Article

Uncertainty in Kinetic Energy Models for Rainfall Erosivity Estimation in Semi-Arid Regions

by
José Bandeira Brasil
1,
Ana Célia Maia Meireles
1,
Carlos Wagner Oliveira
1,
Sirleide Maria de Menezes
1,
Francisco Dirceu Duarte Arraes
2 and
Maria Simas Guerreiro
3,*
1
Postgraduate Program in Sustainable Regional Development—PRODER, Federal University of Cariri, Juazeiro do Norte 63048-080, Brazil
2
Federal Institute of Education, Science and Technology of Sertão Pernambucano (IFSertãoPE)-Campus Salgueiro, Salgueiro 56000-000, Brazil
3
RISE-Health, Faculty of Science and Technology, Fernando Pessoa University, Praça 9 de Abril 349, 4249-004 Porto, Portugal
*
Author to whom correspondence should be addressed.
Hydrology 2025, 12(7), 181; https://doi.org/10.3390/hydrology12070181
Submission received: 17 May 2025 / Revised: 29 June 2025 / Accepted: 1 July 2025 / Published: 4 July 2025

Abstract

The Brazilian semi-arid Northeast plays a critical role in regional hydrology, where rainfall is marked by pronounced temporal variability and short duration, presenting significant challenges for understanding and managing hydrological and erosive processes. This study aims to evaluate the performance of empirical models for estimating rainfall kinetic energy (KE) and erosivity index (EI30) in this region, for all events and erosive events, using high-resolution rainfall data collected at the Federal University of Cariri (UFCA), Ceará. A total of 283 natural rainfall events were analyzed, with KE and EI30 values calculated using multiple models: Wischmeier and Smith, USDA, Van Dijk, a temporal variation-based model (KE_VT), and a regional model developed for Brazil’s semi-arid zone, which served as the reference. The results show a predominance of small rainfall events (<5.2 mm), though maximum EI30 values exceeded 1300 MJ ha−1 mm h−1, highlighting the potential for extreme erosive events. Comparative analysis revealed that all international models significantly underestimated KE and EI30 values compared to the regional reference, with the KE_VT model showing the closest approximation (13% underestimation), for all events and erosive events. Statistical assessments using the Wilcoxon test, Nash–Sutcliffe efficiency, and Willmott concordance index confirmed the superior performance of the KE_VT, for all events and erosive events. These findings underscore the importance of considering intra-event rainfall variability and regional calibration when modeling erosivity in semi-arid climates, contributing to more effective soil conservation and hydrological planning.

1. Introduction

The semi-arid regions of Brazil’s Northeast are primarily defined by a distinctive rainfall regime, marked by scarcity, irregular distribution, and a pronounced concentration of precipitation within a short period—typically three to four months—during which sudden and brief rain events occur [1,2]. Rainfall serves as the principal source of soil moisture, making its accurate monitoring and characterization at the event scale crucial, particularly for understanding soil erosion processes and informing hydrological models [3,4,5].
Understanding rainfall characteristics and their relationship with the dynamics of kinetic energy distribution is essential for assessing rainfall’s erosive potential [6,7,8,9]. Research on rainfall and its erosivity is vital for implementing effective soil conservation and land management strategies in semi-arid environments [10]. Erosivity, which refers to the ability of rainfall to cause soil erosion, is a key parameter in the Universal Soil Loss Equation [11] and related modeling approaches.
Research in semi-arid environments remains limited, largely due to the high costs associated with acquiring specialized equipment needed to measure detailed rainfall characteristics. In many areas of northeastern Brazil, essential rainfall data—such as event duration and intensity—are often unavailable. Rainfall erosivity is quantified through specific indicators, and its accuracy depends on factors such as the number of rain gauges, the temporal resolution of data recording, and the choice of kinetic energy equation used [12]. Among the various approaches, the most robust kinetic energy models estimate rainfall erosivity by incorporating rainfall intensity, offering a more precise representation of the relationship between rainfall and soil erosion than other variables [13].
Despite the challenges associated with rainfall monitoring, empirical relationships continue to be widely used to estimate kinetic energy and rainfall erosivity [13,14,15], most commonly based on the foundational model proposed by Wischmeier and Smith [11]. This model employs the average intensity of each rainfall event as a key input; however, rainfall intensity typically varies throughout the duration of an event [6,7,16]. Other widely adopted empirical models—such as those by [17] and the USDA Agricultural Research Service [18], which is incorporated into the RUSLE2 equation—also rely on average intensity values. In contrast, a modified version of the Wischmeier and Smith model that incorporates the temporal variability of rainfall intensity at fixed intervals during an event has shown promise in more accurately capturing the dynamics of rainfall energy and erosivity [10,16].
A significant advancement in this field was achieved by [10] through a study conducted in Iguatu, CE, a semi-arid region in northeastern Brazil. The study involved detailed monitoring of rainfall characteristics, including distribution, intensity, duration, frequency, droplet diameter, and velocity. Based on these measurements, the authors developed a region-specific empirical model tailored to the semi-arid conditions of Brazil. This model was calibrated and validated to improve the accuracy of kinetic energy and rainfall erosivity estimates, thereby minimizing potential errors. It is important to emphasize that the various models discussed in the literature serve as valuable tools for soil and water conservation, supporting informed decision making in land management practices [8,9,15,19,20].
Given this context, obtaining accurate measurements of rainfall kinetic energy is essential for reliably estimating its erosivity potential. Equally important is the evaluation of different empirical models to determine their suitability for application in semi-arid regions. Accordingly, the objective of this study is to analyze rainfall characteristics and compare the uncertainties associated with various kinetic energy and erosivity estimation models, for all events and erosive events, in relation to the reference model specifically developed for Brazil’s semi-arid region. By quantifying and comparing these uncertainties, we aim to inform the selection and refinement of models for use in regional and global assessments of soil erosion risk, particularly in the context of changing climate and rainfall patterns.

2. Materials and Methods

2.1. Study Area

The study was conducted at the Center for Agricultural Sciences and Biodiversity (CCAB), located on the campus of the Federal University of Cariri (UFCA) in the municipality of Crato. This area lies within the Salgado sub-basin, part of the Cariri region in Ceará, northeastern Brazil (Figure 1). The central geographic coordinates of the study site are 7°14′ S and 39°22′ W, with an elevation of 425 m above sea level.
The study site experiences seasonal climatic variability, with average annual temperatures ranging between 24 °C and 27 °C and clearly defined rainy and dry periods [21]. According to historical data from the Ceará Foundation for Meteorology and Water Resources (FUNCEME), covering the period from 1974 to 2023, the region receives an average annual rainfall of 1116.3 mm. Of this total, approximately 84.4% occurs during the rainy season, which extends from December to April (Figure 2).
The dry season spans from June to November, accounting for only 9% of the total annual rainfall, which underscores the high temporal variability of precipitation characteristic of the state of Ceará [1,5]. The municipality of Crato is located at the base of the Araripe Plateau, in the southernmost part of Ceará, within the Cariri micro-region [21]. Due to its location at the foot of the plateau, the area experiences relatively mild temperatures during the winter months, while summer temperatures tend to be considerably higher.

2.2. Rainfall Data Collection

Rainfall data were collected at the automatic weather station (EMCCAB) at the CCAB/UFCA, equipped with an automatic rain gauge and data logger (Figure 1). The data can be accessed at https://sites.ufca.edu.br/agrotempo/ (accessed 7 September 2024).
The dataset spans from September 2020, when the station began operations, to June 2024. The station utilizes an S-RGF M002 tipping bucket pluviograph with a collection area of 214 cm2. It has a measurement range of 127 mm h−1, with up to 4000 tips per recording interval. Its accuracy is ±4% for rainfall between 0.2 and 50 mm h−1, and ±5% for rainfall between 50 and 100 mm h−1. Each tip corresponds to a rainfall of 0.2 mm, with data acquisition occurring at 5 min intervals.
Using the rainfall data collected from the automatic rain gauge, the following characteristics were recorded: total rainfall (mm), rainfall duration (h), average rainfall intensity (mm h−1), and the maximum rainfall intensity over 30 min (I30, mm h−1). Individual rain events were classified based on a minimum inter-event time (MIET) of 6 h, as proposed by [2]. This criterion resulted in the identification of 283 distinct natural rainfall events during the study period, of which 69 were classified as erosive events (rainfall greater than 12.7 mm).

2.3. Kinetic Energy Models-KE and Erosivity Index-EI30

The equation proposed by [10], specifically developed for the semi-arid region of Brazil, was obtained, calibrated, and validated for the municipality of Iguatu, CE (Equation (1)). The equation was derived by adjusting the original parameters of the Wischmeier and Smith model based on field measurements and average rainfall intensity obtained from disdrometer data. This model was adopted as the reference for estimating kinetic energy (KE) and erosivity index (EI30) and was used for comparison with globally recognized models from the literature [13,15], for all events and erosive events.
KE _ Brasil = 0.1578 + 0.1049     Log   I     R
where:
  • KE is the kinetic energy of rainfall (MJ ha−1),
  • I is the average rainfall intensity (mm h−1),
  • R is the rainfall height (mm).
The widely used Wischmeier and Smith (WS) model [11], modified by [22], was employed to estimate kinetic energy (Equation (2)).
KE _ WS = 0.119 + 0.0873   Log   I     R
Additionally, the kinetic energy considering the temporal variation in rainfall intensity (KE_VT) is calculated for each time interval—30 min intra-event—using the Wischmeier and Smith [11] equation, further modified by [22]. The formulas for this calculation are presented in Equations (3) and (4).
KE r = 0.119 + 0.0873   Log   I r
KE _ VT = r = 1 k KE r   R r
where:
  • KEr is the kinetic energy of rainfall (MJ ha−1 mm−1);
  • Ir is the rainfall intensity during the adopted time interval (mm h−1).
KE_VT represents the sum of the kinetic energy for each rainfall interval, calculated for each adopted time period (MJ ha−1). This value is multiplied by Rr, which is the rainfall height during the r-th time period of a rainfall event divided into k intervals (R mm).
Kinetic energy (KE_USDA) was estimated using the USDA model [18], which is incorporated into the RUSLE2 equation, as shown in Equation (5):
KE _ USDA = 0.29   ( 1 0.72   EXP   ( 0.082     I ) )     R
Similarly, kinetic energy (KE_Van Dijk) was estimated using the [17] model, as presented in Equation (6):
KE _ Van   Dijk = 0.283     ( 1 0.52     EXP   ( 0.042     I ) )     R
The rainfall erosivity index (EI30) for all events and erosive events was calculated using Equation (7) for all the KE models analyzed:
EI 30 = KE     I 30
where:
  • EI30 is the rainfall erosivity index (MJ ha−1 mm h−1),
  • I30 is the maximum rainfall intensity over 30 min during the event (mm h−1).

2.4. Statistical Analysis

Descriptive statistics, linear regression, and boxplots were employed to analyze the rainfall characteristics, as well as the distribution of kinetic energy and erosivity data derived from the models in the literature. The non-parametric Wilcoxon test was used to compare the medians of the KE and EI30 data at a 99% confidence level.
The performance of the KE and EI30 models from the literature was evaluated through graphical analysis using a 1:1 ratio plot and by statistical indicators, including the coefficient of determination (R2), mean error (ME), and root mean square error (RMSE). These indicators measure the dispersion between the observed and estimated values, with values closer to zero indicating a better fit.
Further assessment of model performance was carried out using the Nash–Sutcliffe efficiency coefficient [23], which is considered satisfactory when greater than 0.75. The Willmott concordance index (d) [24] was also used, where a value of 1 indicates perfect agreement between observed and predicted values. Additionally, the model confidence index (C) was calculated as the product of the correlation coefficient (r) and the Willmott index (d), with optimal model performance indicated by a C value above 0.85 [25]. For further details on the model performance evaluation, refer to the research by [26,27].
Statistical analyses were performed for all events and erosive events, using the Statistical Package for the Social Sciences (SPSS) version 16.0, MINITAB version 18, and Microsoft Excel.

3. Results and Discussion

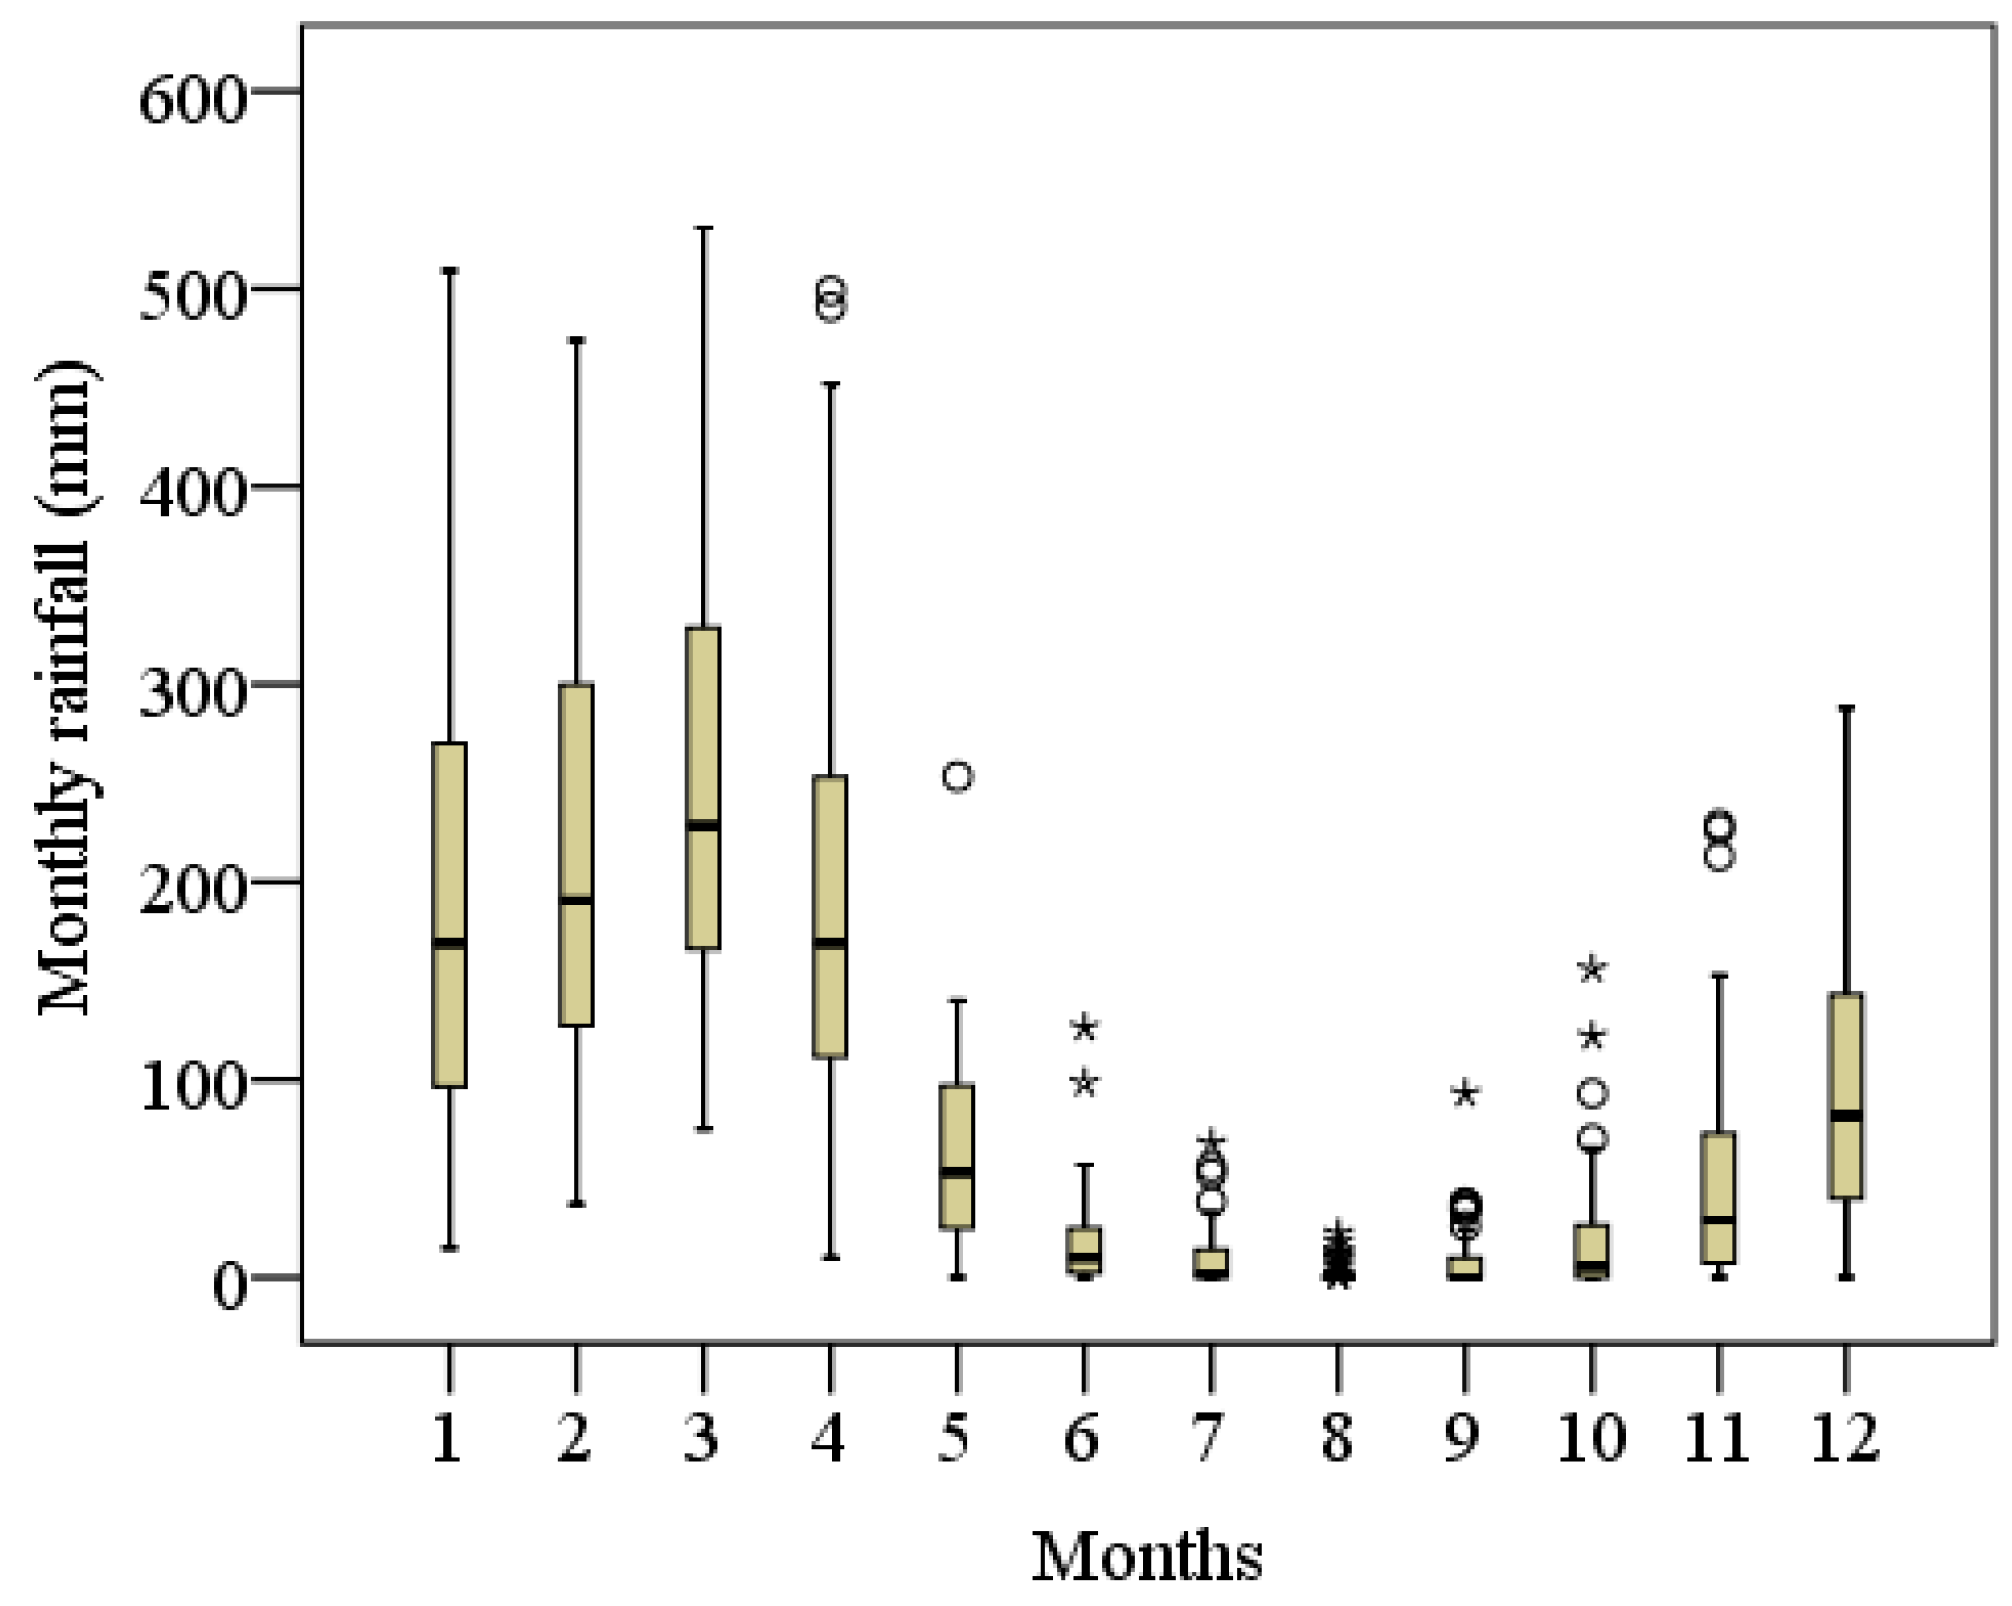
3.1. Rainfall Event Characteristics

A total of 283 rainfall events were analyzed (Table 1). The rainfall height (R) ranged from 0.40 mm to 107.80 mm (Table 1), demonstrating the high variability in the temporal distribution of rainfall during these events [2]. A significant frequency of small events was recorded, with 50% of events having a total rainfall of less than 5.20 mm (Q2 = 50%) (Table 1). The predominance of small rainfall events is a typical feature of semi-arid regions [4,5] and plays a crucial role in understanding hydrological processes at the basin scale [3]. These events influence processes such as the redistribution of raindrops under vegetation, the calculation of kinetic energy, and the assessment of the rainfall erosivity index [5,10].
According to the descriptive statistics (Table 1), rainfall duration, average intensity, maximum 30 min intensity, kinetic energy, and the erosivity index all exhibited substantial variability, consistent with the variation observed in rainfall height. The kinetic energy of rainfall (KE) reached a maximum of 29.99 MJ ha−1, which aligns with the upper range of KE values reported for high-quality natural rainfall events [28], as shown in Table 1.
For the rainfall erosivity index (EI30), 75% of the events had values below 32.84 MJ ha−1 mm h−1 and were associated with rainfall amounts under 12.20 mm, highlighting the high frequency of small rainfall events (Table 1). In Brazil’s transitional zone between the Cerrado and Amazon biomes, ref. [8] observed that lower total rainfall in events are associated with reduced rainfall erosivity, which in turn are associated with lower soil erosion risks. These low-intensity events and slower erosion processes, benefit agricultural productivity by minimizing sediment loss [9].
Despite the predominance of low-intensity events, maximum EI30 values reached 1355.68 MJ ha−1 mm h−1, coinciding with the highest recorded rainfall totals (Table 1), indicating the potential for extreme erosive events even in semi-arid regions. Such high EI30 values are not uncommon in northeastern Brazil; for instance, ref. [14] reported values as high as 2806 MJ ha−1 mm h−1 in the Aiuaba, CE experimental basin. Similarly, the Iguatu, CE experimental basin recorded a maximum EI30 of 2868.9 MJ ha−1 mm h−1 [29]. These elevated values, when combined with reduced vegetation cover—which provides critical protection against raindrop impact—can significantly increase erosion rates. According to [10], vegetation canopy can reduce rainfall kinetic energy (KE) and erosivity (EI30) by 30% and 39%, respectively, with the greatest reduction observed during the period of peak foliage density in the semi-arid region.
High-magnitude rainfall events are key inputs for understanding the variability of the EI30 index, as they significantly influence hydrological and erosive processes. Consequently, these events are critical for developing effective soil and water conservation strategies, particularly in the context of forest adaptation to climate change [6]. Ref. [9] emphasize that changes in extreme precipitation can alter rainfall erosivity, thereby impacting soil erosion dynamics. This understanding is essential for informing the implementation of targeted soil and water conservation practices [15].

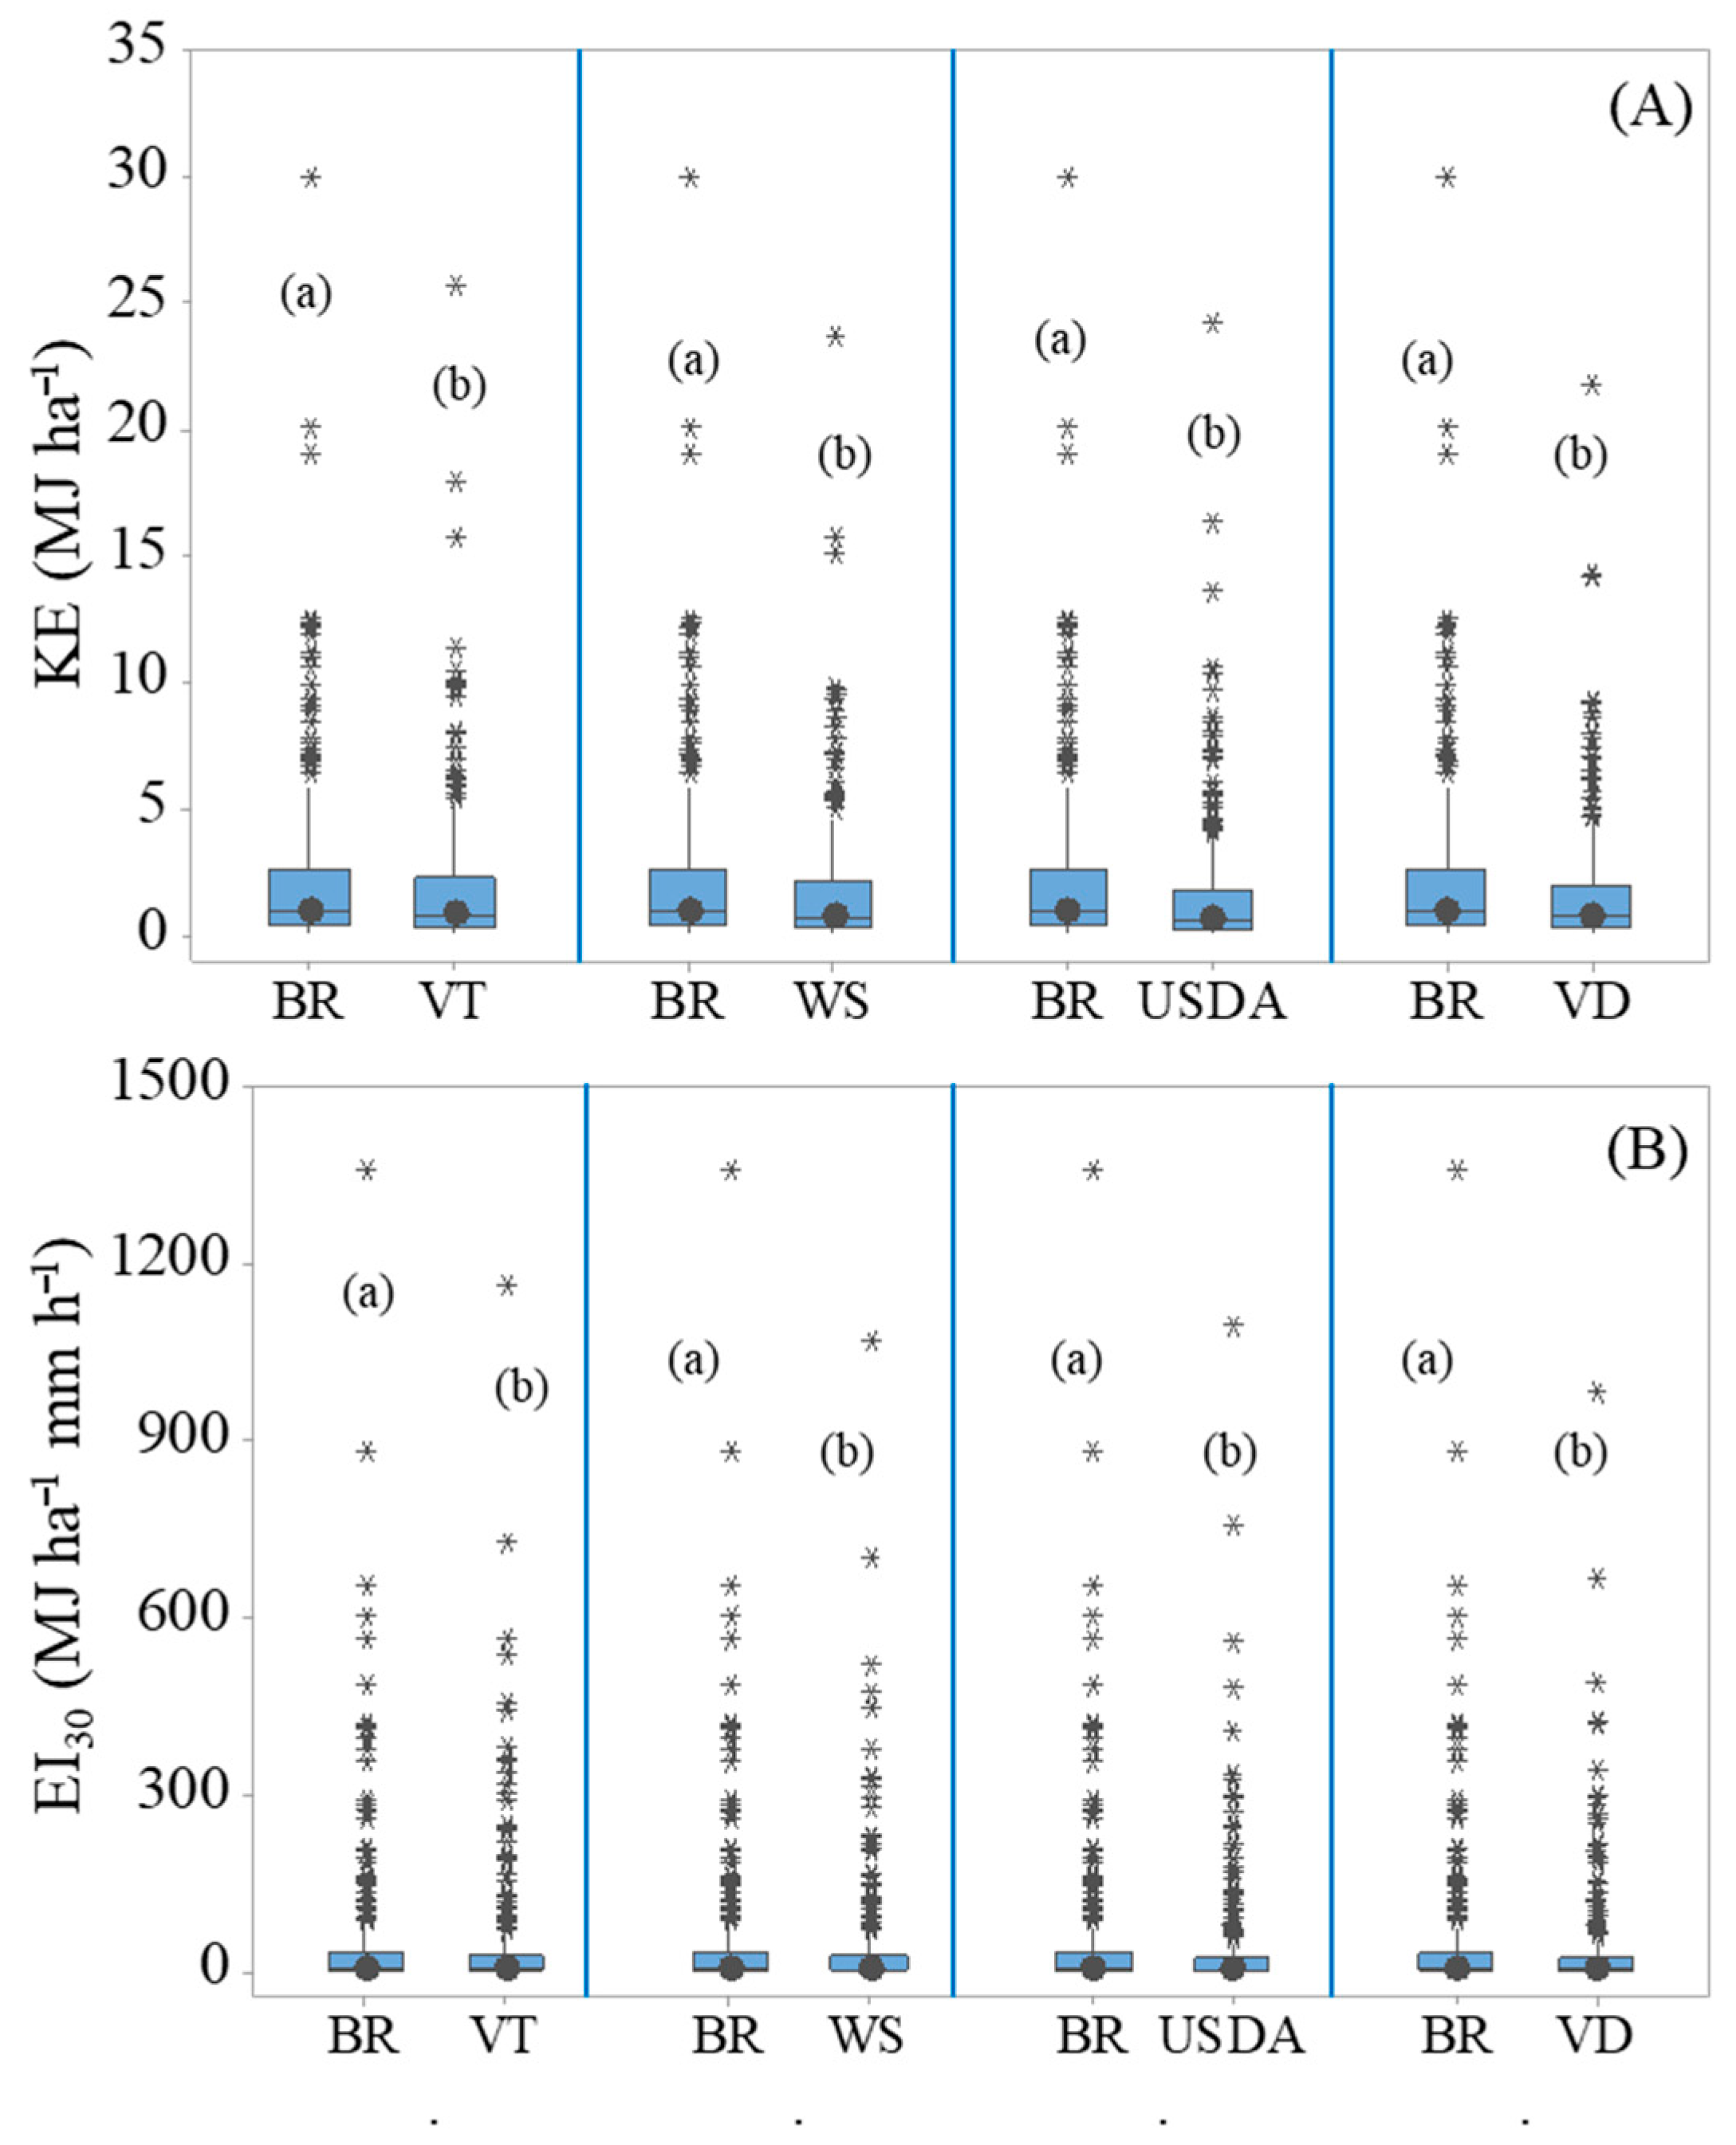
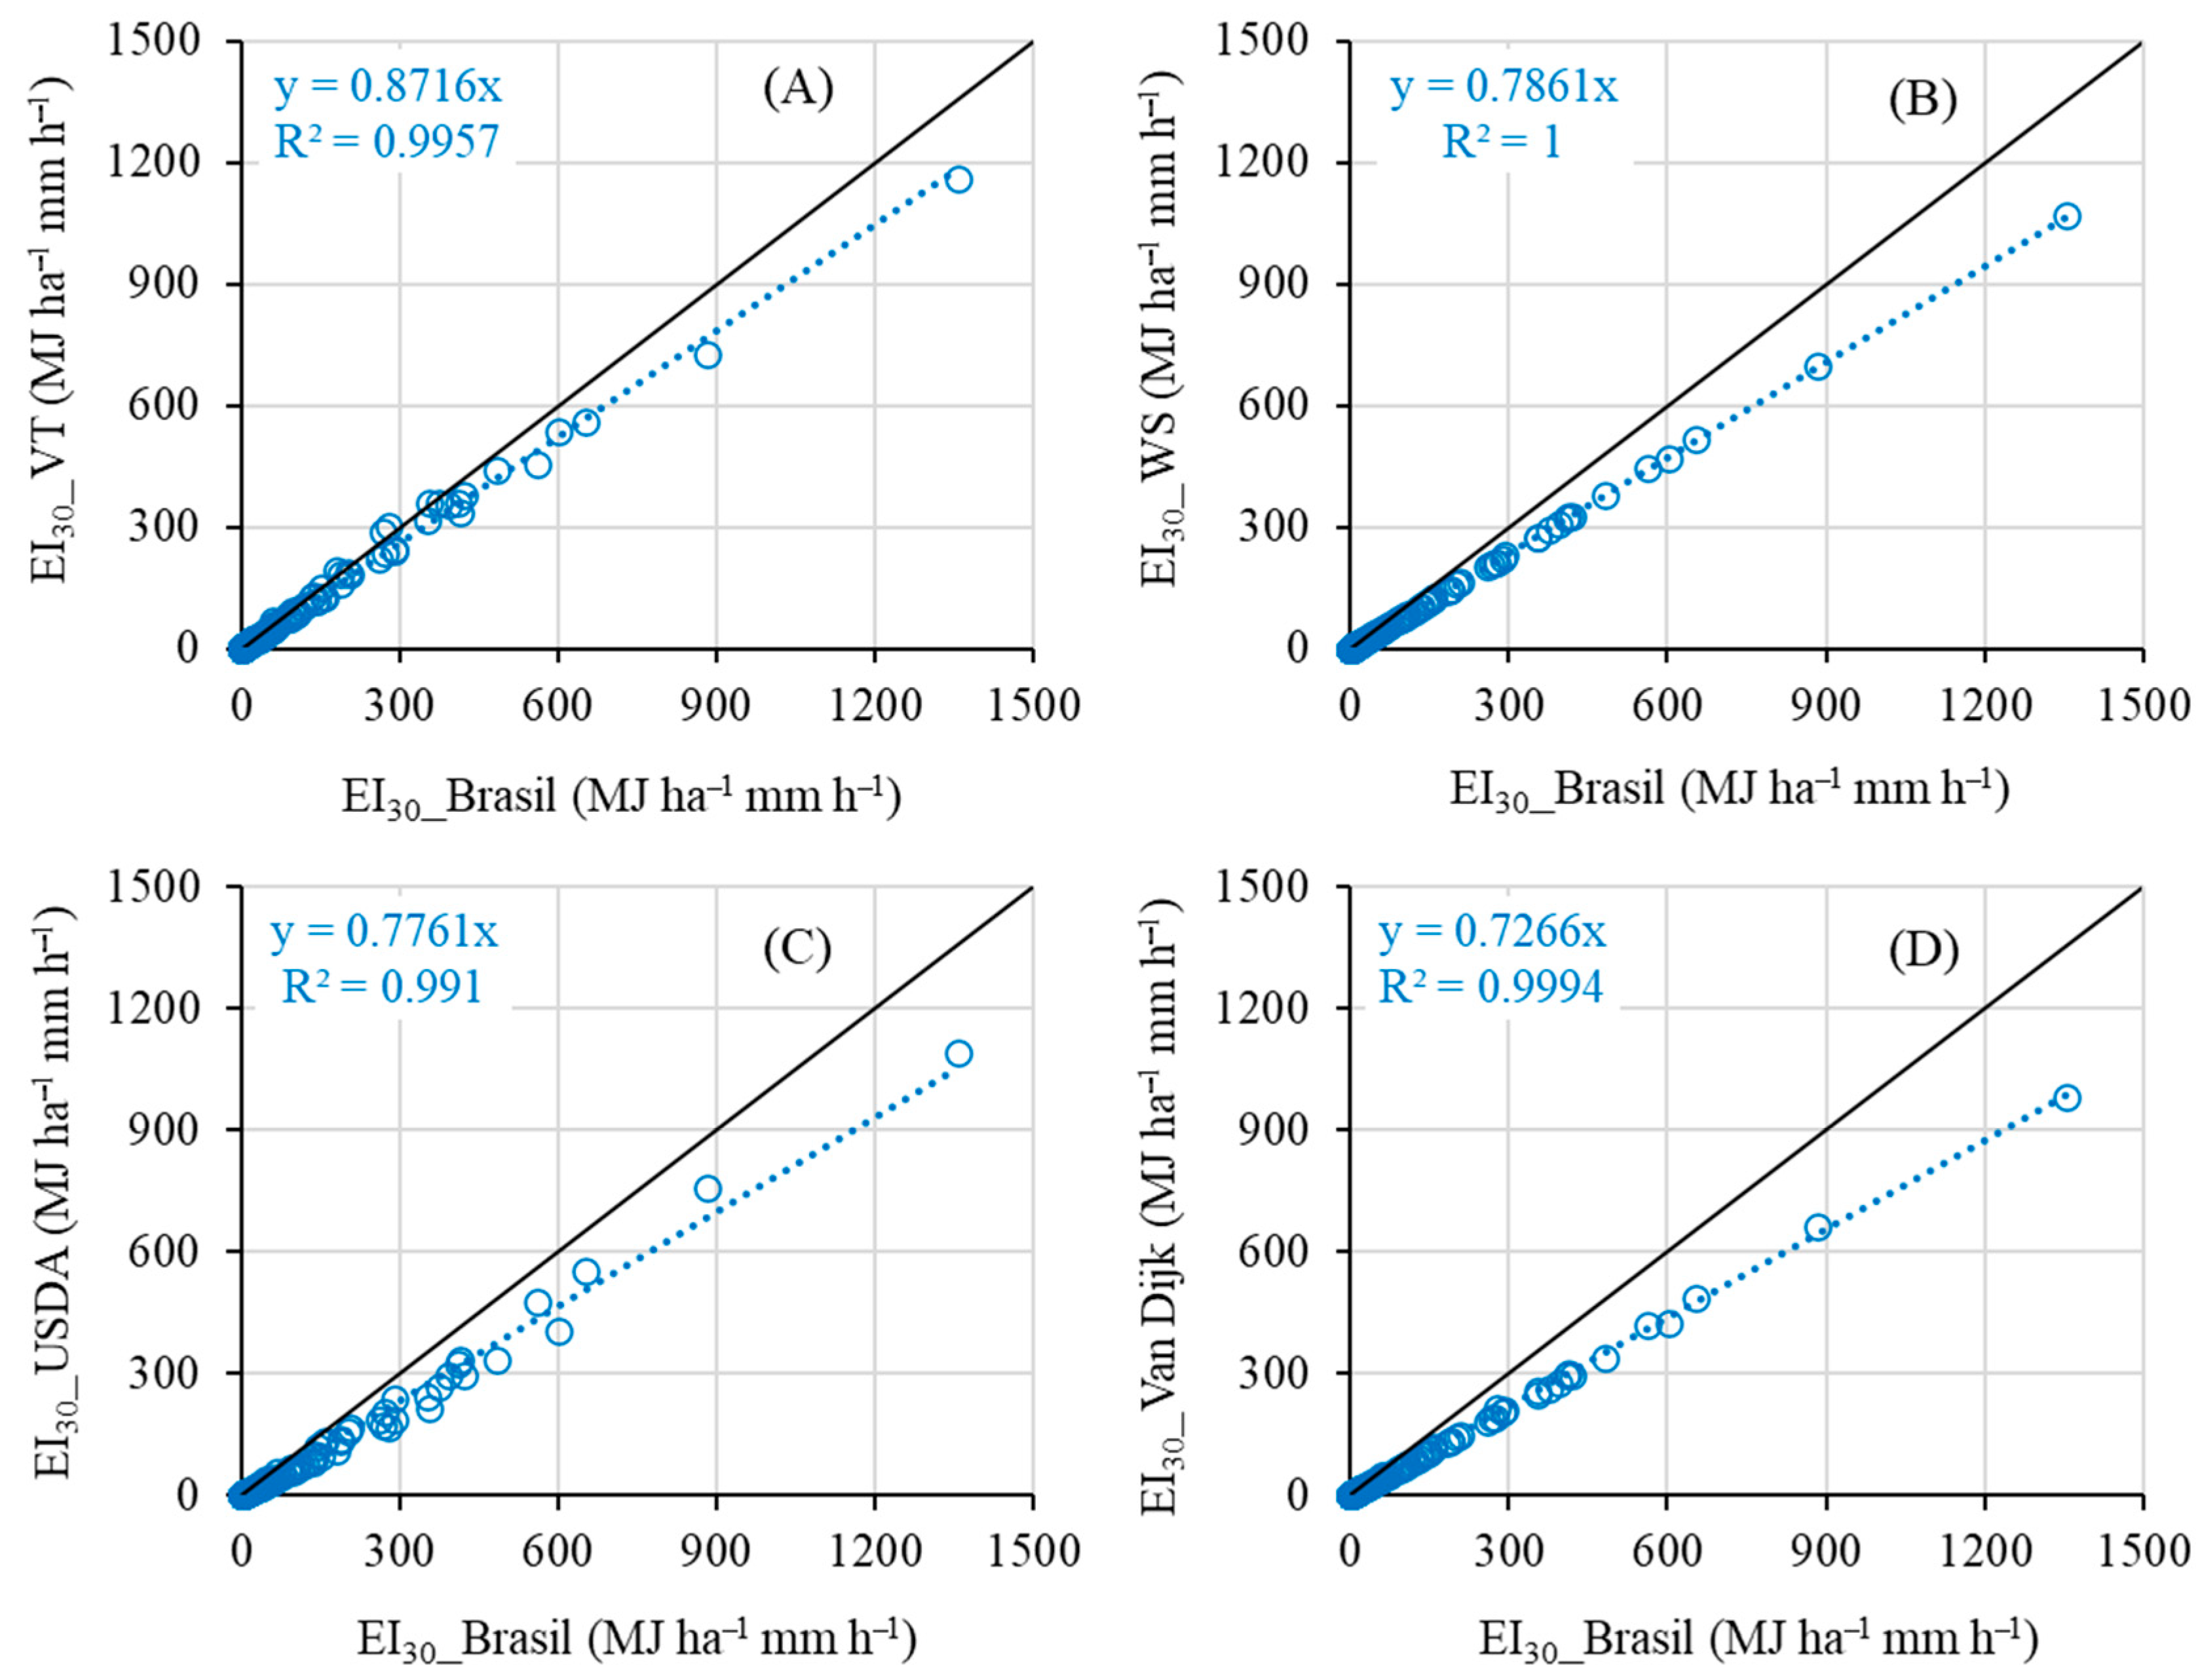
3.2. Kinetic Energy Models-KE and Erosivity Index-EI30

During the study period, all natural rainfall events were used to compare the performance of the kinetic energy and erosivity index estimation models available in the literature: The model developed by [10] was adopted as the reference (KE_Brasil) and compared with the models for temporal variation in intensity (KE_VT), kinetic energy by [11] (KE_WS), kinetic energy by the [18] model (KE_USDA), and kinetic energy by the [17] model (KE_Van Dijk), as shown in Figure 3.
Among the models evaluated, the kinetic energy model that incorporates temporal variation in rainfall intensity (KE_VT) showed the smallest underestimation relative to the KE_Brasil reference model, with a discrepancy of 13% (Figure 3A). The globally adopted Wischmeier and Smith model (KE_WS) underestimated KE by 22% (Figure 3B), followed by the USDA model with a 27% underestimation (Figure 3C). The Van Dijk model exhibited the greatest deviation, underestimating KE by 28% (Figure 3D). These results demonstrate that while all models tend to underestimate KE compared to the Brasil reference, the degree of underestimation varies. Moreover, statistical analysis using the Wilcoxon test confirmed that all models differ significantly from the KE_Brasil model at the 1% significance level (p-value = 0.000) (Figure 4A).
The higher levels of underestimation observed in the KE_WS, KE_USDA, and KE_Van Dijk models can be attributed to their reliance on average rainfall intensity as the input variable. This approach fails to capture the intra-event variability of rainfall intensity, which is more accurately represented by the KE_VT model. In reality, rainfall intensity fluctuates significantly during an event rather than remaining constant [6,7,16]. Additionally, these empirical models were originally developed under climatic conditions distinct from those of the Brazilian semi-arid region, which further contributes to their reduced accuracy when applied in this context. Consistent with the present findings, ref. [10] also identified the KE_VT model as the most suitable for estimating rainfall kinetic energy in the Iguatu-CE Experimental Basin.
To evaluate model performance (Table 2), all kinetic energy (KE) and rainfall erosivity index (EI30) models were compared against the reference KE_Brasil and EI30_Brasil models. Statistical analyses indicated that all tested models demonstrated strong performance, with Nash–Sutcliffe efficiency coefficients (Nash) exceeding 0.8, indicating high predictive accuracy. Similarly, the Willmott index of agreement (d) values were greater than 0.9, reflecting excellent concordance with the reference model. Furthermore, the model confidence index (C) also exceeded 0.9 for all models, confirming their high reliability when compared to the Brasil-specific reference.
The mean error (ME) and root mean square error (RMSE), which assess the dispersion of measured versus estimated values, revealed that the KE_VT and EI30_VT models exhibited the lowest values, demonstrating superior performance in representing both KE and EI30 data. As shown in Figure 3A, the KE_VT model was the least prone to underestimating the KE_Brasil data, making it the most accurate for this dataset. In contrast, the Wischmeier and Smith (WS) and USDA models yielded intermediate results, while the Van Dijk model exhibited the poorest performance in estimating KE and EI30, suggesting its limited suitability for semi-arid environments like the one studied. These findings underscore the necessity of adapting models to local climatic conditions for more accurate hydrological predictions (Table 2).
Since the EI30 is directly dependent on the KE values obtained by the different models (Figure 3), it was observed that all the models similarly underestimated the EI30 data (Figure 5). The model incorporating temporal variation in intensity (EI30_VT) exhibited the smallest underestimation of the EI30_Brasil data, with a 13% difference (Figure 5A). In comparison, the model widely used in soil erosion studies (EI30_WS) underestimated the EI30_Brasil data by 22% (Figure 5B), while the USDA model showed a 23% underestimation (Figure 5C). The EI30_Van Dijk model, however, had the greatest underestimation, at 28% (Figure 5D). All models were statistically different from EI30_Brasil at the 1% significance level (p-value = 0.000) as determined by the Wilcoxon test (Figure 4B).
According to [6,7], South America, including the semi-arid region of Brazil, experiences some of the highest annual rainfall erosivity values. The results presented in Figure 3 and Figure 5 highlight the importance of carefully selecting the appropriate model for estimating kinetic energy and the rainfall erosivity index [10,13,15]. With the ongoing trend in global warming, soil erosion is expected to be significantly affected by changes in rainfall erosivity, and it is of the utmost importance to choose an adequate erosivity quantification model. Extreme rainfall events, in particular, have the potential to aggravate soil erosion, thereby diminishing soil quality, fertility, and the overall health of ecosystems [9].
Given this context, selecting an inappropriate model to estimate EI30 can result in misleading conclusions, making it impossible to accurately calculate soil loss at the scale of individual rainfall events [6,7,10,13,15,16], especially in the arid and semi-arid regions of the world. The refinement of rainfall erosivity models has important implications for the soil erodibility factor (K) in the USLE, RUSLE, and RUSLE2 frameworks. To maintain consistency and accuracy in erosion predictions, it’s important to recalibrate K when applying updated erosivity methods [30].
As seen in Figure 3 and Figure 5, all the models show discrepancies, particularly for higher values of KE and EI30, corresponding to more intense rainfall events. However, for lower rainfall intensities, all models perform well when compared to the reference model. This behavior can be attributed to the smaller raindrops, which, even at low speeds, cause minimal erosion, regardless of the rainfall intensity [5,10,13].
Based on the findings of this study, it is evident that optimizing and refining rainfall erosivity estimation models is crucial, and the integration of remote sensing data can be valuable, especially when predicting changes in extreme rainfall erosivity both regionally and globally [9]. Future research should focus on understanding how the inappropriate selection of rainfall erosivity quantification models can impact soil erosion, particularly in the semi-arid regions of northeastern Brazil and other arid and semi-arid regions of the world.

3.3. Erosive Events

The separation of erosion events using a precipitation threshold of 12.7 mm, as defined by Wischmeier and Smith [11], yielded statistically similar results to analyses that included all events (see Supplementary Material). Although this threshold has been widely adopted across diverse regions and climatic contexts [13], alternative criteria have also been employed. For example, Jiang et al. [19] used a 30 mm threshold in their study of erosive rainfall in the karst landscapes of Guizhou Province, China. Such variation underscores the complexity of defining erosive rainfall, as soil erosion is influenced by more than just precipitation amount. Key characteristics such as rainfall intensity, duration, and total depth significantly contribute to erosive processes [13], and these factors are further modulated by local conditions, including climate, topography, data resolution, and methodological choices [20].
Given that our study is based on a relatively recent monitoring effort spanning four years, we opted to include all recorded natural rainfall events in our analysis. This decision is supported by the finding that their inclusion does not significantly influence the uncertainties of the KE and EI30 models when compared to the regional model. Within this dataset, 75% of the events exhibit precipitation totals below 12 mm—a pattern typical of semi-arid environments, where small but frequent rainfall events are common. Although these events fall below conventional erosivity thresholds, they remain important for understanding local hydrological dynamics, particularly in terms of soil moisture replenishment, runoff initiation, and interactions with surface processes.
Future research should incorporate longer-term datasets and critically assess the applicability of commonly used erosive precipitation thresholds, such as the 12.7 mm criterion proposed by Wischmeier and Smith [11]. Given the variability of rainfall characteristics and the influence of local environmental conditions, especially in semi-arid regions, such thresholds may not fully capture the complexity of erosive processes. A more nuanced evaluation could improve the accuracy of erosivity modeling and enhance our understanding of soil erosion dynamics under diverse climatic contexts.

4. Conclusions

The monitoring of 283 rainfall events revealed that 75% of the events had an EI30 value of less than 32.84 MJ ha−1 mm h−1, with rainfall amounts under 12.20 mm, highlighting the high frequency of small rainfall events and significant temporal variability.
Among the kinetic energy (KE) models, the model incorporating temporal variation (KE_VT) exhibited the least underestimation of KE and EI30 data (13%), for all events and erosive events. This was followed by the Wischmeier and Smith (WS) and USDA models, while the Van Dijk model showed the greatest underestimation (28%), for all events and erosive events. Statistically, all models differed significantly at the 1% level (p-value = 0.000) when compared to the reference Brasil model, for all events and erosive events.
The statistical efficiency criteria indicate that while all models performed well, the KE_VT model provided the best representation of the KE and EI30 data, for all events and erosive events. Conversely, the Van Dijk model was the least effective for estimating these values, for all events and erosive events.
All the models tested demonstrated some degree of inaccuracy, particularly in estimating higher values of kinetic energy (KE) and rainfall erosivity index (EI30) associated with more intense rainfall events. However, for lower rainfall intensities, all models performed relatively well when compared to the reference model. These findings underscore the need for a more rigorous selection process when choosing models for estimating KE and EI30 in studies involving hydrological processes and related modeling.
This study highlights the importance of region-specific calibration and the potential consequences of model misapplication in semi-arid environments, offering valuable insights for future research and model development in rainfall erosivity estimation.
Future research should incorporate long-term datasets and critically evaluate the applicability of erosive precipitation thresholds, especially considering their variability and implications for erosivity modeling in semi-arid regions.

Supplementary Materials

The following supporting information can be downloaded at: https://www.mdpi.com/article/10.3390/hydrology12070181/s1, Figure S1: KE_Brasil model comparison with other models; Figure S2: Statistics of KE and EI30 (B) by the different models; Figure S3: EI30_Brasil model comparison with other models; Table S1: Statistics of KE and EI30 for all models.

Author Contributions

Conceptualization, J.B.B., M.S.G. and A.C.M.M.; methodology, J.B.B., A.C.M.M. and F.D.D.A.; formal analysis, J.B.B., M.S.G., A.C.M.M., F.D.D.A. and S.M.d.M.; investigation, J.B.B. and F.D.D.A.; resources, A.C.M.M. and C.W.O.; data curation, A.C.M.M. and C.W.O.; writing—original draft preparation, J.B.B., M.S.G., A.C.M.M. and F.D.D.A.; writing—review and editing, J.B.B., M.S.G. and A.C.M.M.; supervision, A.C.M.M. and C.W.O.; project administration, A.C.M.M. and C.W.O.; funding acquisition, A.C.M.M. and C.W.O. All authors have read and agreed to the published version of the manuscript.

Funding

This work was supported by Coordination for the Improvement of Higher Education Personnel-Brazil (CAPES) [grant number 88887.807824/2023-00].

Data Availability Statement

The raw data supporting the conclusions of this article will be made available by the authors on request.

Acknowledgments

The authors would like to express their gratitude to the Center for Agricultural Sciences and Biodiversity (CCAB) at the Federal University of Cariri (UFCA) for their logistical support throughout this research. Special thanks are also extended to the Coordination for the Improvement of Higher Education Personnel-Brazil (CAPES) for providing financial assistance to the fellows involved in this study.

Conflicts of Interest

The authors declare that they have no conflicts of interest.

References

  1. Campos, D.A.; Andrade, E.M.; Castanho, A.D.; Feitosa, R.C.; Palácio, H.Q. Biomass dynamics in a fragment of Brazilian tropical forest (Caatinga) over consecutive dry years. Appl. Sci. 2020, 10, 7813. [Google Scholar] [CrossRef]
  2. Brasil, J.B.; Guerreiro, M.S.; Andrade, E.M.; Palácio, H.A.Q.; Medeiros, P.H.A.; Ribeiro Filho, J.C. Minimum Rainfall Inter-Event Time to Separate Rainfall Events in a Low Latitude Semi-Arid Environment. Sustainability 2022, 14, 1721. [Google Scholar] [CrossRef]
  3. Soares, N.S.; Costa, C.A.G.; Carneiro de Lima, J.B.; Francke, T.; de Araújo, J.C. Method for identification of hydrological seasons in the semi-arid Caatinga biome, Brazil. Hydrol. Sci. J. 2024, 69, 309–320. [Google Scholar] [CrossRef]
  4. Guerreiro, M.S.; Andrade, E.M.; Sousa, M.M.M.; Brasil, J.B.; Palácio, H.A.Q. Contribution of Non-Rainfall Water Input to Surface Soil Moisture in a Tropical Dry Forest. Hydrology 2022, 9, 102. [Google Scholar] [CrossRef]
  5. Brasil, J.B.; Andrade, E.M.; Palácio, H.A.Q.; Fernández-Raga, M.; Ribeiro Filho, J.C.; Medeiros, P.H.A.; Guerreiro, M.S. Canopy Effects on Rainfall Partition and Throughfall Drop Size Distribution in a Tropical Dry Forest. Atmosphere 2022, 13, 1126. [Google Scholar] [CrossRef]
  6. Panagos, P.; Borrelli, P.; Meusburger, K.; Yu, B.; Klik, A.; Jae Lim, K.; Yang, J.E.; Ni, J.; Miao, C.; Chattopadhyay, N.; et al. Global rainfall erosivity assessment based on high-temporal resolution rainfall records. Sci. Rep. 2017, 7, 4175. [Google Scholar] [CrossRef]
  7. Panagos, P.; Borrelli, P.; Matthews, F.; Liakos, L.; Bezak, N.; Diodato, N.; Ballabio, C. Global rainfall erosivity projections for 2050 and 2070. J. Hydrol. 2022, 610, 127865. [Google Scholar] [CrossRef]
  8. Santos, W.P.; Avanzi, J.C.; Viola, M.R.; Chou, S.C.; Acuña-Guzman, S.F.; Pontes, L.M.; Curi, N. Projections of rainfall erosivity in climate change scenarios for the largest watershed within Brazilian territory. Catena 2022, 213, 106225. [Google Scholar] [CrossRef]
  9. Zhao, Y.; Zhu, D.; Wu, Z.; Cao, Z. Extreme rainfall erosivity: Research advances and future perspectives. Sci. Total Environ. 2024, 917, 170425. [Google Scholar] [CrossRef]
  10. Brasil, J.B.; Andrade, E.M.; Guerreiro, M.S.; Palácio, H.A.Q.; Ribeiro Filho, J.C.; Fernández-Raga, M.; Medeiros, P.H.A. Measurement and modelling of kinetic energy and erosivity of rainfall and throughfall in a tropical semiarid region. J. Hydrol. 2024, 644, 132088. [Google Scholar] [CrossRef]
  11. Wischmeier, W.H.; Smith, D.D. Predicting Rainfall Erosion Losses: A Guide to Conservation Planning (No. 537); Department of Agriculture, Science and Education Administration: Washington, DC, USA, 1978. [Google Scholar]
  12. Brychta, J.; Podhrázská, J.; Šťastná, M. Review of methods of spatio-temporal evaluation of rainfall erosivity and their correct application. Catena 2022, 217, 106454. [Google Scholar] [CrossRef]
  13. Wang, L.; Li, Y.; Gan, Y.; Zhao, L.; Qin, W.; Ding, L. Rainfall erosivity index for monitoring global soil erosion. Catena 2024, 234, 107593. [Google Scholar] [CrossRef]
  14. Medeiros, P.H.A.; de Araújo, J.C. Temporal variability of rainfall in a semiarid environment in Brazil and its effect on sediment transport processes. J. Soils Sediments 2014, 14, 1216–1223. [Google Scholar] [CrossRef]
  15. Teixeira, D.B.S.; Cecílio, R.A.; Moreira, M.C.; Pires, G.F.; Fernandes Filho, E.I. Recent advancements in rainfall erosivity assessment in Brazil: A review. Catena 2022, 219, 106572. [Google Scholar] [CrossRef]
  16. Yamaura, Y.; Yamada, Y.; Matsuura, T.; Tamai, K.; Taki, H.; Sato, T.; Hashimoto, S.; Murakami, W.; Toda, K.; Saito, H.; et al. Modeling impacts of broad-scale plantation forestry on ecosystem services in the past 60 years and for the future. Ecosyst. Serv. 2021, 49, 101271. [Google Scholar] [CrossRef]
  17. Van Dijk, A.I.J.M.; Bruijnzeel, L.A.; Rosewell, C.J. Rainfall intensity–kinetic energy relationships: A critical literature appraisal. J. Hydrol. 2002, 261, 1–23. [Google Scholar] [CrossRef]
  18. USDA-Agricultural Research Service. Science Documentation Revised Universal Soil Loss Equation Version 2. 2013. Available online: https://www.ars.usda.gov/ (accessed on 2 September 2024).
  19. Jiang, Y.; Gao, J.; Yang, L.; Wu, S.; Dai, E. The interactive effects of elevation, precipitation and lithology on karst rainfall and runoff erosivity. Catena 2021, 207, 105588. [Google Scholar] [CrossRef]
  20. Nearing, M.A.; Yin, S.Q.; Borrelli, P.; Polyakov, V.O. Rainfall erosivity: An historical review. Catena 2017, 157, 357–362. [Google Scholar] [CrossRef]
  21. Sampaio, M.R.L.; Barboza, E.N.; Crisostomo, N.C.; Bezerra Neto, F.d.C.; Silva, D.H.d.; Felizardo, R.d.O.; Pinto, N.A. Estudo comportamental da precipitação pluviométrica no município de Crato-Ceará, no período entre 1974–2009. Rev. Bras. De Gestão Ambient. 2019, 13, 27–33. Available online: https://www.gvaa.com.br/revista/index.php/RBGA/article/view/7729 (accessed on 2 September 2024).
  22. Foster, G.R.; McCool, D.K.; Renard, K.G.; Moldenhauer, W.C. Conversion of the universal soil loss equation to SI metric units. J. Soil Water Conserv. 1981, 36, 355–359. [Google Scholar] [CrossRef]
  23. Nash, J.E.; Sutcliffe, J.V. River flow forecasting through conceptual models part I—A discussion of principles. J. Hydrol. 1970, 10, 282–290. [Google Scholar] [CrossRef]
  24. Willmott, C.J. On the validation of models. Phys. Geogr. 1981, 2, 184–194. [Google Scholar] [CrossRef]
  25. Camargo, A.D.; Sentelhas, P.C. Avaliação do desempenho de diferentes métodos de estimativa da evapotranspiração potencial no Estado de São Paulo, Brasil. Rev. Bras. De Agrometeorol. 1997, 5, 89–97. [Google Scholar]
  26. da Costa, S.A.T.; de Souza, L.S.B.; de Assunção Montenegro, A.A.; de Souza, C.A.A.; de Morais, J.E.F.; de Carvalho Lopes, D.; Neto, A.J.S.; de Souza Santos, J.P.A.; Jardim, A.M.D.R.F.; Alves, C.P.; et al. Calibration and validation of the AquaCrop model for forage cactus production systems under different management interventions in the semi-arid region of Brazil. Phys. Chem. Earth Parts A/B/C 2024, 136, 103716. [Google Scholar] [CrossRef]
  27. Carvalho, T.; Brosinsky, A.; Foerster, S.; Teixeira, A.; Medeiros, P. Reservoir sediment characterisation by diffuse reflectance spectroscopy in a semiarid region to support sediment reuse for soil fertilization. J. Soils Sediments 2022, 22, 2557–2577. [Google Scholar] [CrossRef]
  28. Nanko, K.; Tanaka, N.; Leuchner, M.; Levia, D.F. Throughfall Erosivity in Relation to Drop Size and Crown Position: A Case Study from a Teak Plantation in Thailand. In Forest-Water Interactions; Levia, D.F., Carlyle-Moses, D.E., Iida, S., Michalzik, B., Nanko, K., Tischer, A., Eds.; Ecological Studies; Springer: Cham, Switzerland, 2020; Volume 240. [Google Scholar] [CrossRef]
  29. Santos, J.C.N.; Andrade, E.M.; Medeiros, P.H.A.; Palácio, H.A.Q.; Araújo, J.R. Sediment delivery ratio in a small semi-arid watershed under conditions of low connectivity1. Rev. Ciência Agronômica 2017, 48, 49–58. [Google Scholar] [CrossRef]
  30. Gupta, S.; Borrelli, P.; Panagos, P.; Alewell, C. An advanced global soil erodibility (K) assessment including the effects of saturated hydraulic conductivity. Sci. Total Environ. 2024, 908, 168249. [Google Scholar] [CrossRef]
Figure 1. Location of the study area in the municipality of Crato, Ceará, Northeast Brazil.
Hydrology 12 00181 g001
Figure 2. Temporal variability of the historical series of monthly precipitation in the municipality of Crato, Ceará.
Hydrology 12 00181 g002
Figure 3. Estimation of kinetic energy (KE) by the Brasil model versus temporal variation in intensity-VT (A), Wischmeier and Smith-WS (B), USDA (C), Van Dijk (D).
Hydrology 12 00181 g003
Figure 4. Statistical analysis of kinetic energy-KE (A) and estimation of rainfall erosivity potential-EI30 (B) by the different models. BR-Brasil model; VT-Temporal variation in intensity model; WS-Wischmeier and Smith model; USDA model; VD-Van Dijk model. * Different letters (a, b) represent a statistically different median at the 1% level using the Wilcoxon test.
Hydrology 12 00181 g004
Figure 5. Estimation of rainfall erosivity potential (EI30) by the Brasil model versus temporal variation in intensity-VT (A), Wischmeier and Smith_WS (B), USDA (C), Van Dijk (D).
Hydrology 12 00181 g005
Table 1. Descriptive statistics of rainfall characteristics at EMCCAB (Crato-CE).
VariablesN° of
Events
MeanStDevMinimumQ1Q2
Median
Q3Maximum
R2839.9213.290.402.005.2012.20107.80
D3.914.030.081.082.755.1723.75
I4.386.890.210.962.274.8981.60
I309.2410.960.402.004.4012.0053.60
KE_Brasil2.223.430.050.320.922.6129.99
EI30_Brasil50.91136.580.020.634.0932.841355.68
R—Rainfall height (mm); D—Rainfall duration (h); I—Average rainfall intensity (mm h−1); I30—Maximum rainfall intensity in 30 min (mm h−1); KE—Rainfall kinetic energy (MJ ha−1); EI30—Rainfall erosivity index (MJ ha−1 mm h−1); percentiles—Q1-25%, Q2-50% and Q3-75%; StDev—Standard deviation).
Table 2. Statistical analysis of the methods for estimating kinetic energy-KE and estimating rainfall erosivity potential-EI30 in relation to the Brasil model.
MethodsIndexesError
NashdCPerformanceRMSEME
Brasil × VT0.970.990.99optimal 0.590.29
KEBrasil × WS0.930.980.98optimal 0.890.50
Brasil × USDA0.890.960.96optimal 1.140.68
Brasil × Van Dijk0.890.960.96optimal 1.120.56
EI30Brasil × VT0.980.990.99optimal 20.465.85
Brasil × WS0.950.980.98optimal 31.1411.08
Brasil × USDA0.940.980.98optimal 34.3113.67
Brasil × Van Dijk0.910.970.97optimal 39.8813.81
KE, RMSE, and ME–(MJ ha−1); EI30, RMSE, and ME–(MJ ha−1 mm h−1); Brasil model; VT–Temporal variation in intensity model; WS–Wischmeier and Smith model; USDA model; VD–Van Dijk model. Nash > 0.75-Very good; Willmott concordance index (d) > 0.90-Excellent; model confidence index (C) > 0.85-optimal.
Disclaimer/Publisher’s Note: The statements, opinions and data contained in all publications are solely those of the individual author(s) and contributor(s) and not of MDPI and/or the editor(s). MDPI and/or the editor(s) disclaim responsibility for any injury to people or property resulting from any ideas, methods, instructions or products referred to in the content.

