Article

Dynamics of Nocturnal Evapotranspiration in a Dry Region of the Chinese Loess Plateau: A Multi-Timescale Analysis

1
State Key Laboratory of Water Engineering Ecology and Environment in Arid Area, School of Water Resources and Hydropower, Xi’an University of Technology, Xi’an 710048, China
2
College of Forestry, Northwest A & F University, Yangling 712100, China
3
Key Laboratory of Degraded and Unused Land Consolidation Engineering, Department of Earth & Environmental Science, Xi’an Jiaotong University, Xi’an 710049, China
4
General Institute of Water Resources and Hydropower Planning and Design, Ministry of Water Resources, Beijing 100120, China
5
Department of Land and Water Conservation Engineering, Faculty of Agricultural Engineering and Technology, PMAS-Arid Agriculture University Rawalpindi, Rawalpindi 46300, Pakistan
*
Author to whom correspondence should be addressed.
Hydrology 2025, 12(7), 188; https://doi.org/10.3390/hydrology12070188
Submission received: 9 June 2025 / Revised: 7 July 2025 / Accepted: 9 July 2025 / Published: 10 July 2025
(This article belongs to the Section Hydrology–Climate Interactions)

Abstract

Evapotranspiration (ET) is an important part of agricultural water consumption, yet little is known about nocturnal evapotranspiration (ETN) patterns. An eddy covariance system was used to observe ET over five consecutive years (2020–2024) during the growing season in a dry farming area of the Loess Plateau. Daytime and nocturnal evapotranspiration were partitioned using the photosynthetically active radiation threshold to reveal the changing characteristics of ETN at multiple time scales and its control variables. The results showed the following: (1) In contrast to the non-significant trend in ETN on the diurnal and daily scales, monthly ETN dynamics exhibited two peak fluctuations during the growing season. (2) The contribution of ETN to ET exhibited seasonal characteristics, being relatively low in summer, with interannual variations ranging from 10.9% to 14.3% and an annual average of 12.8%. (3) The half-hourly ETN, determined by machine learning methods, was driven by a combination of factors. The main driving factors were the difference between surface temperature and air temperature (Ts-Ta) and net radiation (Rn), which have almost equivalent contributions. Regression analysis results suggested that Ta was the main factor influencing ETN/ET at the monthly scale. This study focuses on the nighttime water loss process in dry farming fields in Northwest China, and the results provide a basis for rational allocation and efficient utilization of agricultural water resources in arid regions.

1. Introduction

Evapotranspiration (ET) is a key process in the global hydrological cycle and plays an essential role in the exchange of energy between terrestrial ecosystems and the atmosphere [1]. More attention has been paid to daytime evapotranspiration (ETD) processes than to nocturnal evapotranspiration (ETN) because it is traditionally assumed that the stomata of plant leaves remain closed at night to reduce water loss [2]. However, a growing number of observational studies have suggested that different types of plants show an incomplete stomatal closure or sap flow during non-photosynthetic periods, and that nocturnal water flux from the land surface to the atmosphere cannot be neglected [3,4,5]. The impact of nocturnal water loss on global ET may surpass the influence of current global warming on ET [6]. A global study by Padrón et al. [4], using the FLUXNET2015 dataset, concluded that nocturnal water loss accounts for 6.3% of total evapotranspiration, and even exceeds 15% at some sites. This nocturnal water use can reduce the water use efficiency (WUE) of plants [7], which may have an impact on the estimation of carbon budgets. Such evidence indicates that the ETN is critical to the nocturnal water cycle. Therefore, exploring nocturnal evapotranspiration in terrestrial ecosystems is important for water resource management and agricultural activities.
The quantification of nocturnal water loss has focused primarily on plant nocturnal transpiration (TrN), which can be considered a component of ETN [8]. Sap flow observations from different species or ecosystems provide references for revealing nocturnal transpiration patterns. A study of larch plantations indicated that nocturnal sap flow accounted for about 9.2% of daily sap flow [9], and some earlier reports suggested that nocturnal sap flow accounted for an average of 12.03% of sap flow in different biomes, with a higher contribution in arid areas [10]. Despite the important role of sap flow in plant growth and drought adaptation, nighttime sap flow may also be involved in stem water replenishment, and thus, additional correction methods are required when estimating nocturnal transpiration to ensure the reliability of the results [9,11,12,13]. The mechanism of TrN control may be attributed to incomplete closure of stomata at night, and a large number of studies have revealed the complex interrelationship between TrN and the environment [14,15,16]. Vapor pressure deficit (VPD) is considered the main driver of TrN variations, and some studies have postulated a positive correlation between TrN and VPD, meaning that TrN is higher during the nighttime when high temperatures and low humidity are present, along with high soil moisture availability [17]. In addition to the main factor, exogenous environmental variables such as wind speed (WS) [18] and soil water content (SWC) [19] also affect TrN. There are also differences in the regulators of TrN in different plant phenological periods [20].
Although TrN has significant physiological significance for plant growth, from the perspective of water balance or hydrological processes, it is more important to explore variations in ETN and its response to environmental variables, as ETN also includes soil evaporation and canopy interception evaporation [4,8]. Most reports on ETN are relatively short-term observations, single-plant studies, or experiments conducted under controlled conditions [3], so continuously observing and accurately quantifying ETN at different scales remains a challenge. Lysimeters and eddy covariance (EC) systems are typically used to measure ET or ETN [4]. Studies from three ecosystems in the Southeastern U.S., a scrubland region in Northwest China, and a tropical transect of North Australia have demonstrated the potential of using the EC system to observe ETN, with results showing ETN/ETD ratios of approximately 4% to 11.7% [8,21,22]. It should be noted that nighttime EC-based ET measurements still suffer from surface energy imbalance, degradation of measurement accuracy at low wind speeds, and effects of dew on the observations [22,23,24]. Synchronized multi-method validation may be an effective solution to these problems. The use of lysimeters is another method for observing ETN. Montoro et al. [25] used lysimeters to explore the effects of soil water content on ETD and ETN in vineyards during the growing season. Similar to TrN, ETN is influenced by different environmental factors, among which VPD, SWC, air temperature (Ta), and WS have received extensive attention [22]. At night, higher wind speeds and wetter soil conditions facilitate greater exchange between air close to the vegetation canopy and the lower atmosphere [3]. Novick et al. [21] concluded that ETN was mainly driven by VPD and WS, with significant contribution from TrN. The same conclusion was validated at high altitude, but the main drivers of ETN changed with decreasing altitude [26]. In addition to spatial variations, Skaggs and Irmak [27] showed that the relative influence of environmental variables also varies with plant growth stage. Moreover, there are differences in the factors controlling nocturnal water loss at different time scales [28]. In contrast to the control of environmental variables, ETN is also influenced by plant genetic factors and endogenous circadian rhythms, such as variations in stomatal conductance at night [6,29]. In summary, ETN is regulated by several factors, and there remains a lack of clear and unified conclusions regarding the degree of influence of different environmental variables and how the interactions between variables control ETN [8,22]. Therefore, it is necessary to analyze the variations in ETN in different environments or ecosystems and to determine the relationships between ETN and environmental variables.
Based on the above background, we conducted a study on nocturnal evapotranspiration in a dry farming area of the Loess Plateau of China. The Loess Plateau was once very fragile due to the impacts of climate change and human activities; fortunately, the environment has been significantly improved after decades-long ecological restoration [30,31,32]. Some studies on the ET characteristics of the Loess Plateau have focused on the effects of land use and climate change on ET, the hydrological response of vegetation greening, and the analysis of water use efficiency of crops [33,34,35,36,37]. However, there are relatively few studies on ETN variations in this region. Elucidation of the change pattern of ETN in dry farming areas has the potential to enhance the parameterization scheme of evapotranspiration in the land surface process model and provide a foundation for water-saving irrigation in agriculture. The main objectives are (1) to elucidate the variations in ETN over different time scales, (2) to assess the contribution of ETN in dry farming area to ET, and (3) to determine the relationship between ETN and environmental factors and to quantify the relative control of environmental variables on ETN using a machine learning approach. This study utilized 5-year (2020–2024) continuous observation data from the EC system in the Loess Plateau to analyze the ETN characteristics during vegetation growing seasons, as well as the relationship between ETN and environmental factors.

2. Materials and Methods

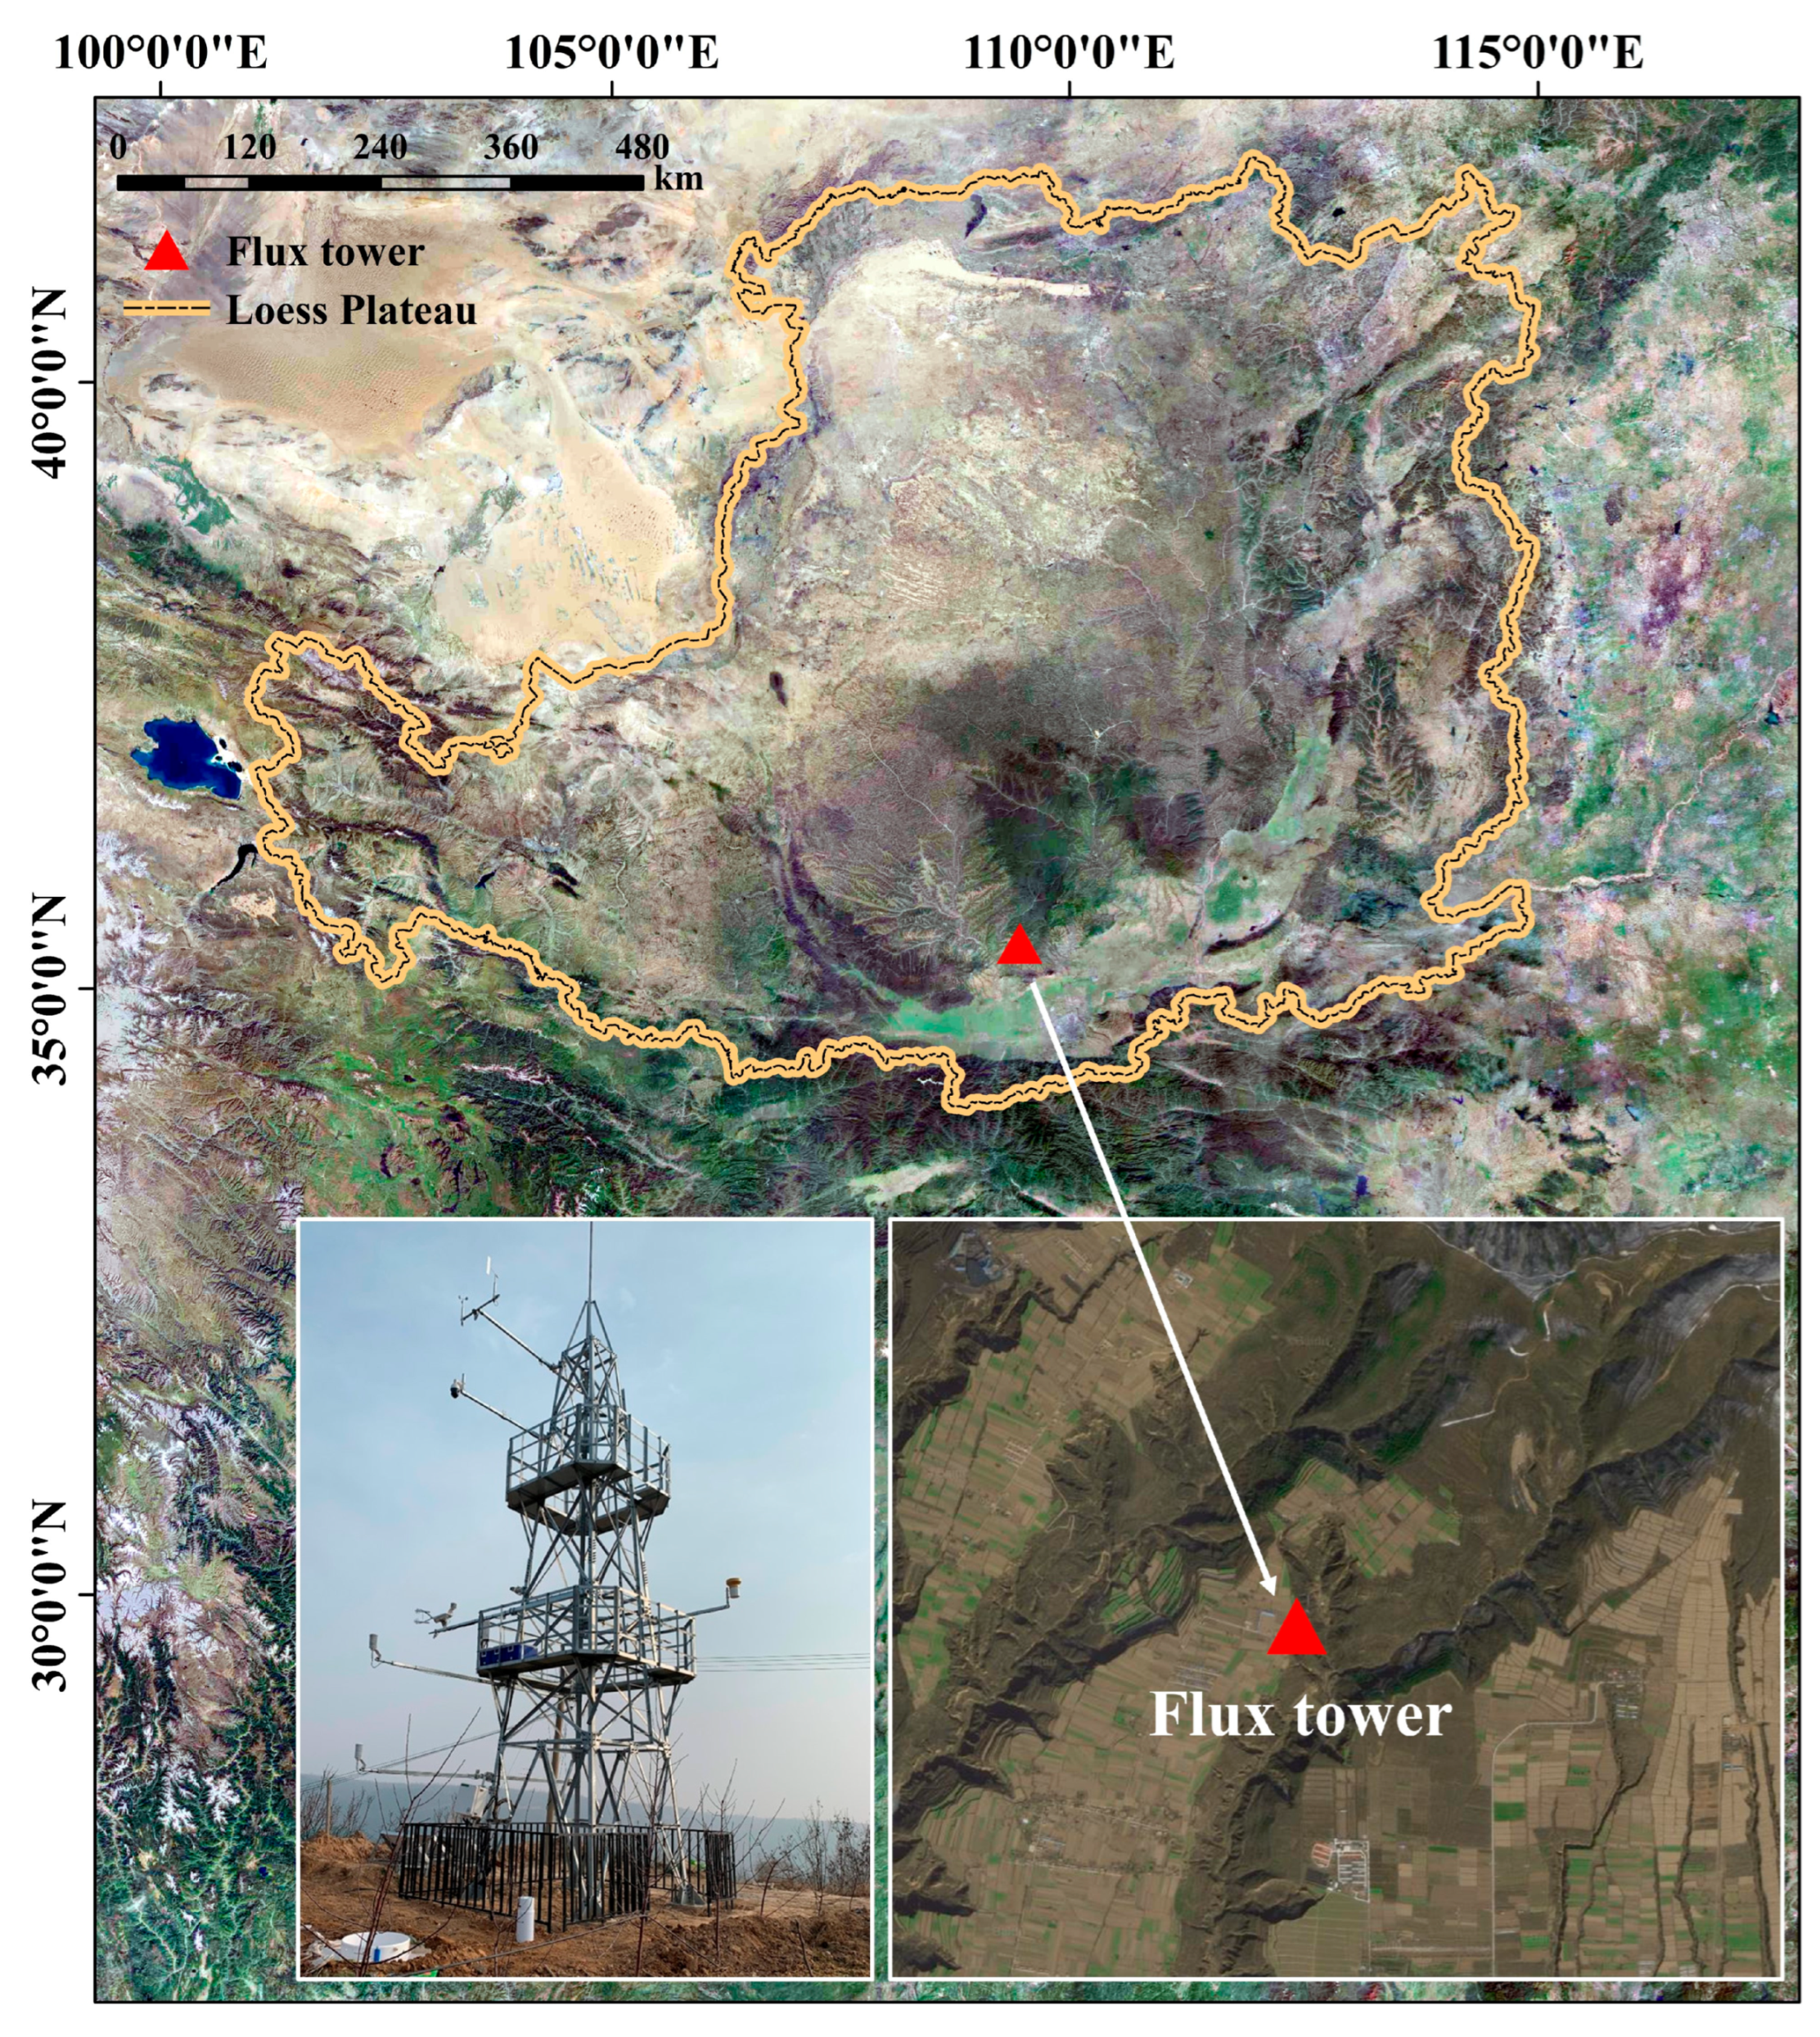
2.1. Site Description

In this study, the EC system was used to observe ET at the Chunhua Ecohydrology Experimental Station of Xi’an University of Technology, located in Chunhua County, Shaanxi Province, China (108°30′ E, 35°0′ N) [38]. The experimental station was situated in the south of the Loess Plateau, at an altitude of 1460 m, and was dominated by gully landscapes (Figure 1). The study area has a continental monsoon climate with an annual average temperature of 10 °C and an annual average precipitation of 600.6 mm. The region observed by the EC system has a high vegetation cover. The natural vegetation mainly consists of Robinia pseudoacacia, Rosa xanthina and Artemisia eriopoda, and there are significant seasonal variations in the growth process [39]. In addition to natural vegetation, land use in the region includes agricultural land (dryland maize fields), but there are no populated cities. In December 2019, we constructed a flux tower on leveled land in the study area and mounted an EC system, radiation sensors, a PhenoCam, and some meteorological observation instruments (Figure 1). An evaporation pan and soil water content measuring instrument were placed around the tower. These were used to monitor water, heat, and carbon fluxes, as well as variations in other environmental factors in the study area. To ensure the reliability of the raw data, the EC system was calibrated once a year.

2.2. Flux and Environmental Measurements

The EC system and meteorological equipment were mounted on a 10 m tower that was not in the shade of any surrounding buildings. The EC system was installed 5 m above the ground surface and consisted of an infrared gas analyzer (Li-7500A, LI-COR, Inc., Lincoln, NE, USA) and a three-dimensional sonic anemometer (CSAT3, Campbell Scientific, Inc., Logan, UT, USA), which was primarily used to measure latent heat flux (LE, W m−2) and sensible heat flux (H, W m−2). The EC system was sampled at 10 Hz, and these raw data were recorded in a CR6 data logger (CR6, Campbell Scientific, Inc., Logan, UT, USA). Air temperature (Ta, °C) and relative humidity (RH, %) were measured using temperature and humidity sensors (HMP155A, Vaisala, Vantaa, Finland), which were mounted 4 m above the surface. The infrared radiometer (SI-111, Apogee Instruments, Inc., Logan, UT, USA) was mounted at a height of 5 m to monitor the surface temperature (Ts, °C) of the vegetation. A four-component radiometer (CNR4, Kipp & Zonen, Delft, The Netherlands) was used to measure net radiation (Rn, W m−2). Photosynthetically active radiation (PAR, µmol m−2 s−1) was measured using a PAR sensor (PQS1, Kipp & Zonen, Delft, The Netherlands). Precipitation (P, mm) and wind speed (WS, m s−1) were measured using a rain gauge (TE525E, Texas Electronics, Dallas, TX, USA) and wind speed sensor (010C, Campbell Scientific, Inc., Logan, UT, USA), respectively. For more details on these instruments, please refer to the study by Guo et al. [40].
The soil water content at depths of 20 cm, 40 cm, and 80 cm (SWC20, SWC40, and SWC80, cm3 cm−3) below the surface was measured using CS655 soil sensors (CS655, Campbell Scientific, Inc., Logan, UT, USA). Meteorological and soil water content data were recorded and stored at 30 min intervals in the data logger (CR6, Campbell Scientific, Inc., Logan, UT, USA). In addition, we continuously monitored vegetation growth dynamics using a tower-mounted digital camera (more accurately called a PhenoCam; NetCam SC web camera, StarDot Technologies, Buena Park, CA, USA), which captured RGB images of the vegetation at a fixed angle every day during the daytime [39]. These images allow for the calculation of vegetation indices within the viewpoint and reflect the growing conditions of the vegetation in the study area. This method is commonly used for monitoring vegetation phenology, and the reliability of the approach has been verified in multiple studies [41,42,43]. The PhenoCam captured three images per day and saved them in the data logger.
We conducted observations in the study area for five consecutive years (from 2020 to 2024). The study period covers the growing seasons (from April to October) of each of these years.

2.3. Data Processing

The raw data recorded by the EC system were pre-processed using EddyPro software (version 7.0.9), with the main steps comprising spike detection, lag correction, coordinate rotation, and WPL density fluctuation correction [44,45,46]. After pre-processing, EddyPro software (version 7.0.9) exported 30 min long screened data to (1) exclude data when the instrument malfunctioned and power failure occurred, (2) remove data that exceeded the measurement range of the instruments or that showed significant deviations, and (3) exclude weak turbulence from nocturnal data using friction velocity thresholds. After the above processing procedures, approximately 40.0% of the nighttime data were retained for the entire study period. Table A1 in Appendix A contains the percentage of data remaining for each year. The REddyProcWeb online tool (https://www.bgc-jena.mpg.de/bgi/index.php/Services/REddyProcWeb, (accessed on 22 February 2025)) was used to interpolate missing data. We evaluated the energy closure in the study area using the energy balance ratio (EBR) (defined as (LE + H)/(Rn − G)) approach, and the EBR for the study periods from 2020 to 2024 was determined to be 0.76, 0.68, 0.71, 0.66, and 0.68, respectively. These results were within a reasonable range of those reported at the FLUXNET sites [47]. Therefore, additional revisions were not made for this study. Finally, the 30 min flux data were aggregated into daily data.
Meteorological and soil water content data were sampled at half-hour intervals and were relatively complete over the study period, with only individual gaps interpolated. Due to power failures, some longer gaps of missing data in 2023 and 2024 were not interpolated. The PhenoCam took three photographs of the vegetation per day, and we selected the one with the best daily imaging quality for use in calculating the vegetation index [39]. Gaps due to instrument failures were not interpolated.

2.4. Methods

The half-hour LE values recorded by the EC system were used to calculate the half-hour daytime evapotranspiration (ETD) and nocturnal evapotranspiration (ETN), with negative values recorded at night replaced by zero [8]. The half-hour ETD and ETN were aggregated into the corresponding daily ETD and ETN, yielding monthly and annual values. Daytime and nighttime were distinguished by a PAR threshold of 5 µmol m−2 s−1 [22]. ET was calculated using the following formula:
E T = L E λ
where λ is the latent heat of vaporization (2.45 MJ kg−1).
To characterize the vegetation dynamics in the study area, the vegetation index was calculated using a formula commonly employed in phenological research. Red, green, and blue digital numbers were extracted from the images taken by the PhenoCam. Then, the green chromatic coordinate (GCC) (i.e., the relative intensity of the green channel in the image) was calculated. Variations in the GCC time series reflect the changes in vegetation canopy structure [39,48]. The GCC was calculated as follows:
G C C = G R + G + B
where R , G , and B are the red, green, and blue digital numbers in images, respectively.

2.5. Statistical Analysis

The boosted regression tree (BRT) method was used to quantify the contribution of each environmental variable to the variation in ETN at half-hour scales. The BRT method, developed by Elith et al. [49], is a machine learning method that combines the boosting technique with the regression tree algorithm. This method uses recursive binary splits to iteratively fit models based on categorical regression trees, and then combines them to eventually fit an improved model based on all data [50]. The BRT method does not require specific data distributions, which is highly inclusive of data and can automatically handle the interaction effects among predictors. Therefore, it has better performance in complex nonlinear problems [51]. There are four key parameters that need to be defined in the BRT algorithm: learning rate (lr), tree complexity (tc), bag fraction (bf), and number of trees (nt). The lr determines the contribution of each tree to the final model, tc controls the number of trees, bf denotes the proportion of data selected from the training set at each iteration, and lr and tc jointly determine the nt of the optimal prediction [8,50]. In this study, we implemented the BRT model in the R software (version 4.3.2) using the gbm package. To obtain optimal results, we tested combinations of parameter values with the objective of minimizing predictive deviation, and finally determined the optimal lr, tc, and bf to be 0.007, 10, and 0.5, respectively. Model performance was evaluated using a 10-fold cross-validation approach, where the data were randomly partitioned into 10 subsets: 9 subsets were used to train the model and 1 subset was used to test model performance. The procedure was repeated 10 times, and model performance was assessed using the root mean square error and coefficient of determination. Before running the BRT, multicollinearity among the predictor variables was assessed using the variance inflation factor (VIF) analysis.

3. Results

3.1. Variations in Environmental Variables

Variations in environmental variables at different time scales during the growing season are summarized in Figure 2 and Table A2 in Appendix A. The daily Ta at night showed significant seasonal trends, gradually increasing from April, peaking in summer, and then decreasing (Figure 2a). Mean Ta increased gradually over five growing seasons. The daily difference between Ts and Ta (Ts-Ta) at night showed no clear trend, with relatively lower values of Ts-Ta in August and diminishing mean values of Ts-Ta from 2020 to 2024 (Figure 2b; Appendix A, Table A2). The mean nocturnal VPD during the growing season was highest in 2023 at 15.7 hPa and lowest in 2024 at 10.6 hPa. Compared with VPD, nocturnal RH had the opposite trend and was typically higher in summer. There was no significant trend in nocturnal Ws, with mean nocturnal Ws being in the range of 2.7 to 3.0 m s−1. The highest monthly mean Ws during the study period was 4.1 m s−1 in September 2024 (Figure 2d; Appendix A, Table A2). Nocturnal SWC20 and SWC40 exhibited similar variability, and both were critically influenced by precipitation at night; however, the response of SWC80 to nocturnal precipitation was weaker compared with those of SWC20 and SWC40 (Figure 2e). The mean SWC20, SWC40, and SWC80 fluctuated within the range of 0.15 to 0.28 cm3 cm−3, 0.26 to 0.34 cm3 cm−3, and 0.22 to 0.29 cm3 cm−3, respectively (Appendix A, Table A2). The nighttime P during the growing season was highest in 2021 at 289.4 mm (precipitation in 2023 and 2024 was affected by lack of measurements and lower observations during the study period) (Appendix A, Table A2). Overall, except for 2021, nocturnal P was mainly concentrated in the summer months. Nocturnal Rn was negative, and the mean Rn varied over a small range (−49.1 to −43.1 W m−2) (Appendix A, Table A2). The daily GCC showed a significant seasonal variation trend, with a rapid increase in the early stage of the growing season, followed by a peak in May or June (Figure 2g; Appendix A, Table A2).

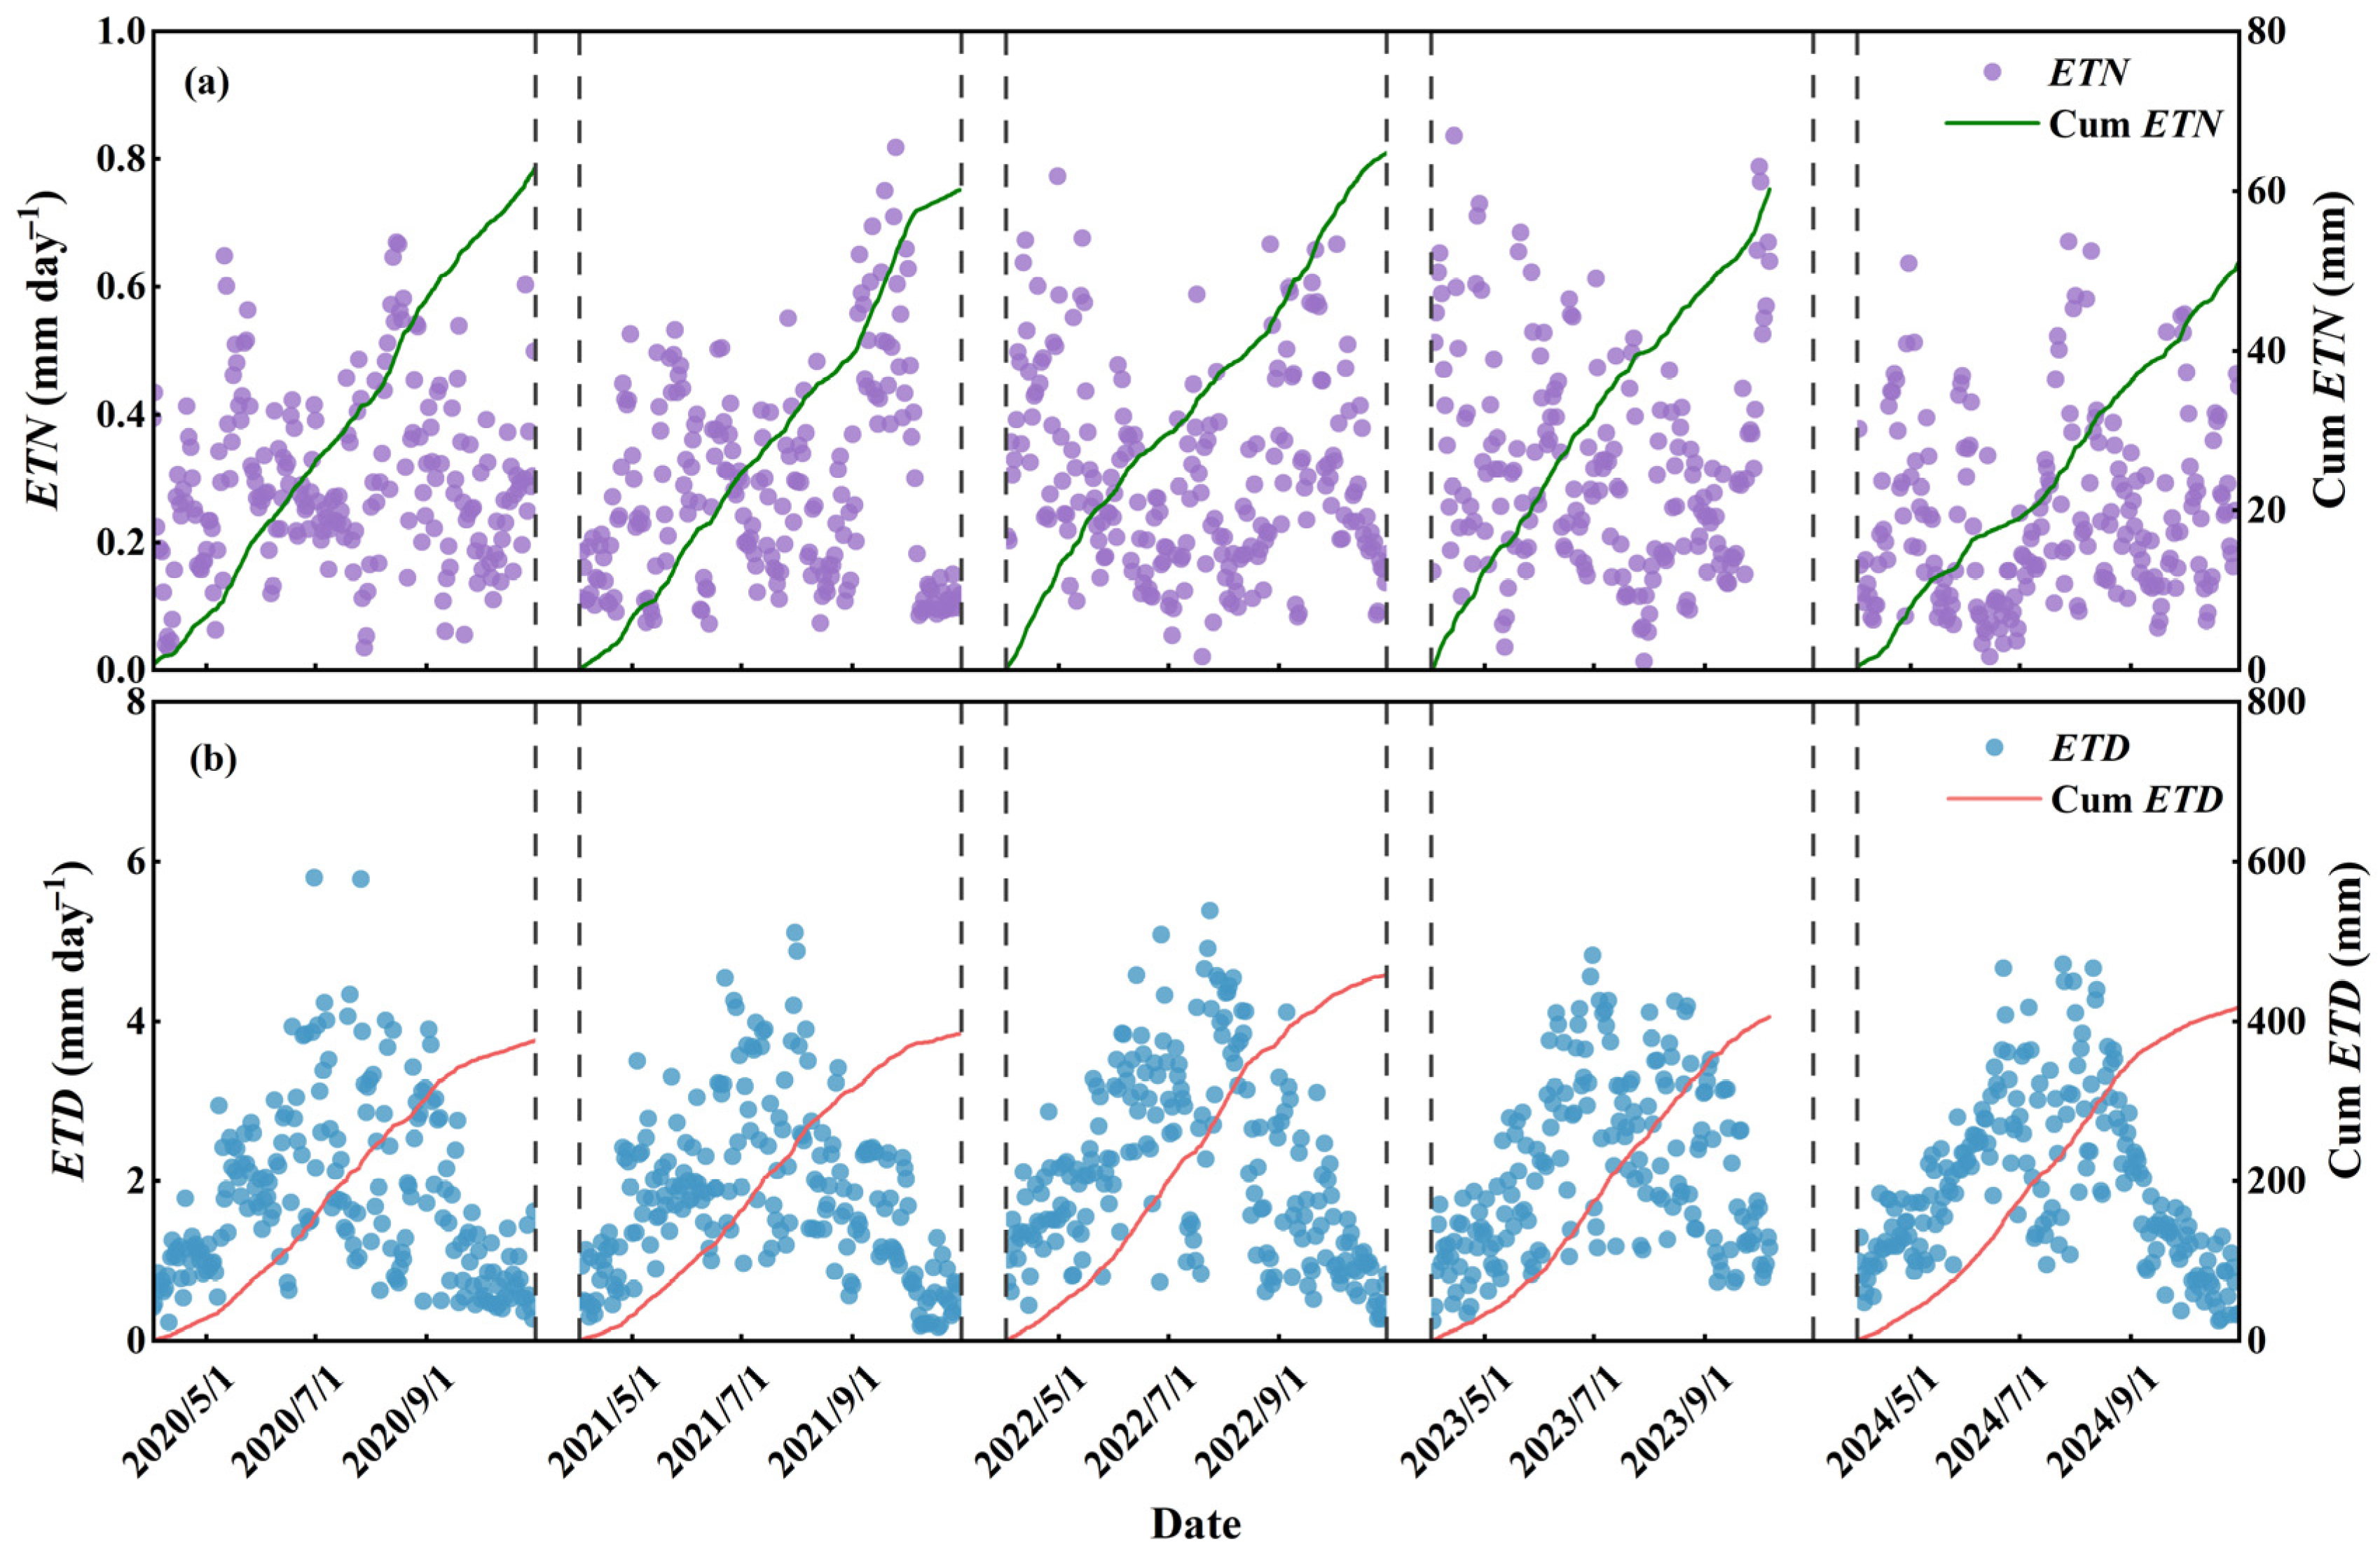
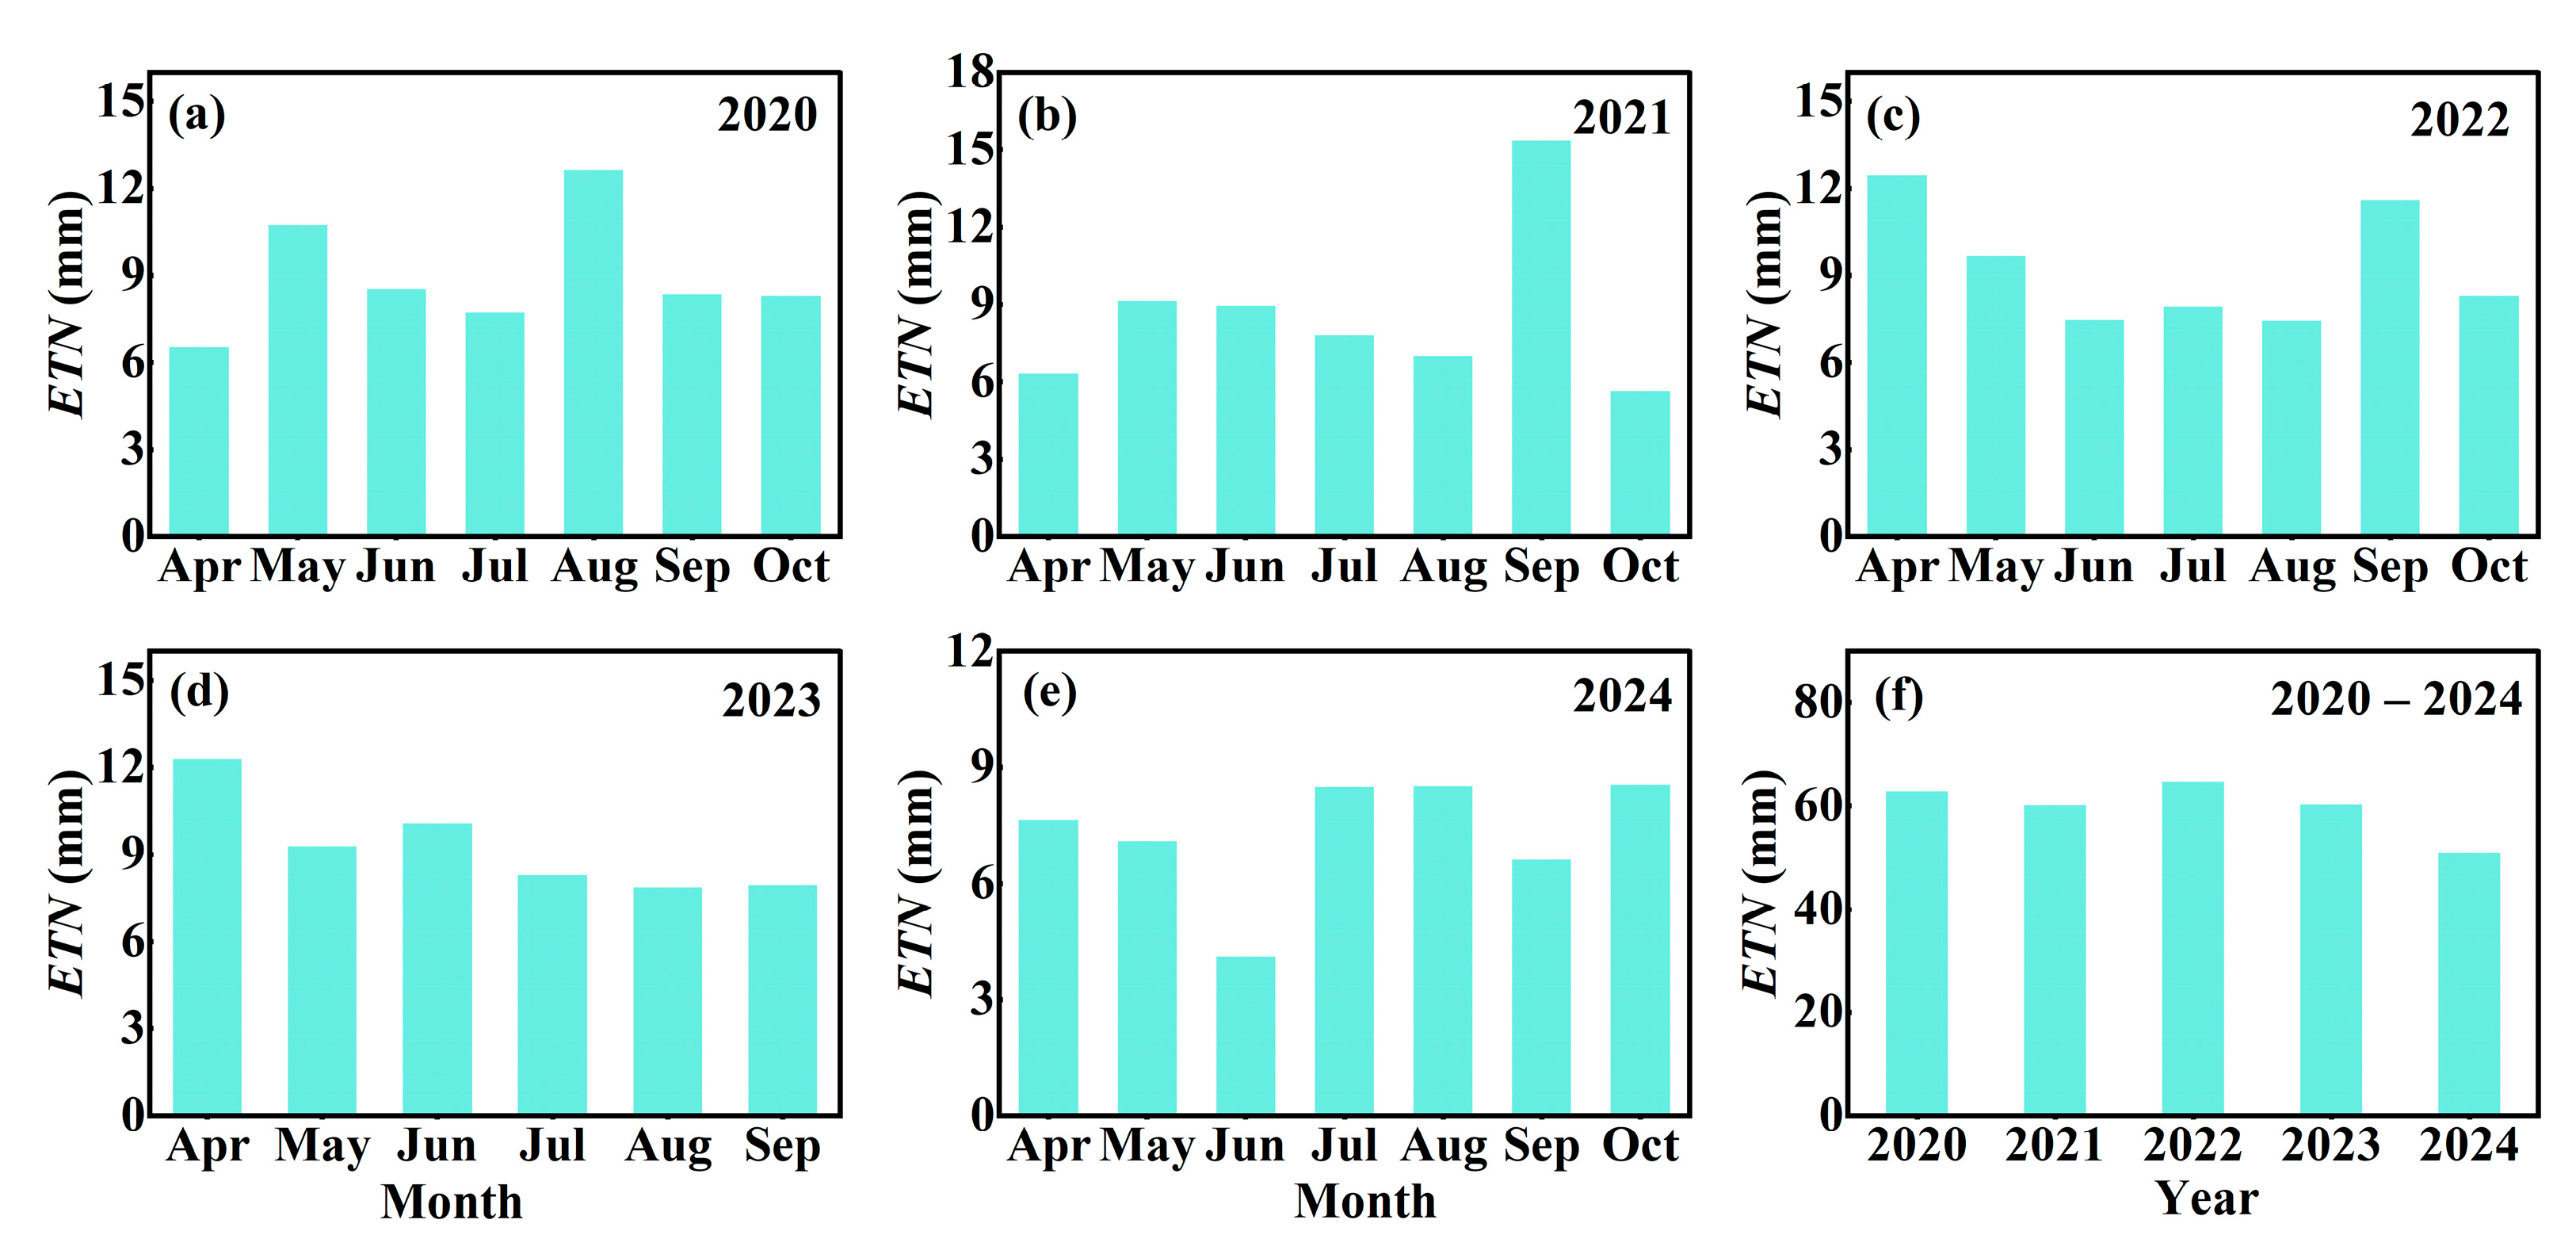
3.2. Variations in ETN on Multiple Time Scales

The non-interpolated half-hour LE data were used to characterize the diurnal variations in ETN. In 2020, the diurnal ETN increased until 20:30 and then remained steady (mean value of 0.016 mm 30 min−1) until 2:30, after which it decreased; however, from 4:00 to 7:00 it showed the opposite upward trend (Figure 3). Before 20:30, the changes in diurnal ETN in 2021 were similar to those in 2020; however, unlike 2020, there was a decreasing trend after 4:00. The diurnal ETN in 2022 also increased until 20:30, then gradually decreased, and then showed an increasing trend after 2:30 (Figure 3). The maximum value (0.017 mm 30 min−1) was recorded at 6:30. In 2023, the diurnal ETN fluctuated widely without any significant variation characteristics, with maximum and minimum values of 0.018 mm 30 min−1 at 1:00 and 0.011 mm 30 min−1 at 6:30, respectively. In 2024, the diurnal ETN increased gradually until 22:00, then decreased, and increased again before sunrise. The maximum and minimum values were 0.015 mm 30 min−1 at 07:00 and 0.009 mm 30 min−1 at 0:30 (Figure 3). Overall, there were differences in the diurnal ETN patterns during the growing seasons in 2020–2024; however, the trends within the time period were not significant.
The interpolated half-hour LE data were aggregated into daily, monthly, and annual ET values. The daily ETN values did not show a significant trend during the study period, in contrast to the daily ETD, which exhibited clear seasonal dynamics (Figure 4). The maximum daily ETN in 2020 and 2024 occurred during the summer period (August and July) with values of 0.67 mm day−1 and 0.67 mm day−1, while the maximum daily ETN in 2022 and 2023 occurred in April, with values of 0.77 mm day−1 and 0.84 mm day−1, respectively (Figure 4). The maximum daily ETN in 2021 was 0.82 mm day−1 on September 25. Aggregated monthly ETN also indicated an initial peak in ETN at the beginning of the growing season (usually April and May), followed by a second peak in the middle or later part of the growing season, similar to the course of daily ETN over the year (Figure 5). The monthly ETN showed a bimodal pattern within the year. Compared with the variation in ETN, the daily ETD showed a more pronounced trend; however, there was usually only one peak in summer (Figure 4). Average daily ETN varied between 0.24 mm day−1 and 0.32 mm day−1 over the five growing seasons, with the total annual ETN ranging from 51.0 mm to 64.8 mm (mean value of 59.8 mm). In comparison, the mean daily ETD varied from 1.76 mm day−1 to 2.14 mm day−1, and the total annual ETD ranged from 376.1 mm to 458.4 mm (mean value of 408.4 mm). The maximum and minimum monthly ETN were observed in September 2021 (15.3 mm) and June 2024 (4.1 mm), respectively, across the study period (Figure 5).
As shown in Figure 6, the monthly ETN/ET ratios exhibited seasonal variations during the study period, with typically lower ETN/ET ratios in summer and higher ratios in spring and autumn. The range of monthly ETN/ET in 2020 was 8.4% to 27.1%; for 2021, 2022, 2023, and 2024, this range was 8.6% to 22.8%, 7.3% to 23.7%, 8.5% to 27.8%, and 4.7% to 25.8%, respectively (Figure 6). In terms of inter-annual variations, the ETN/ET ratios for the growing seasons from 2020 to 2024 were 14.3%, 13.5%, 12.4%, 12.9%, and 10.9%, respectively, with an annual average value of 12.8% over the entire study period (Figure 6f). In contrast to the course of ETN/ET, monthly ETD/ET ratios were higher in summer, usually exceeding 90%, and the contribution of ETD to ET diminished in spring and autumn (Figure 6).

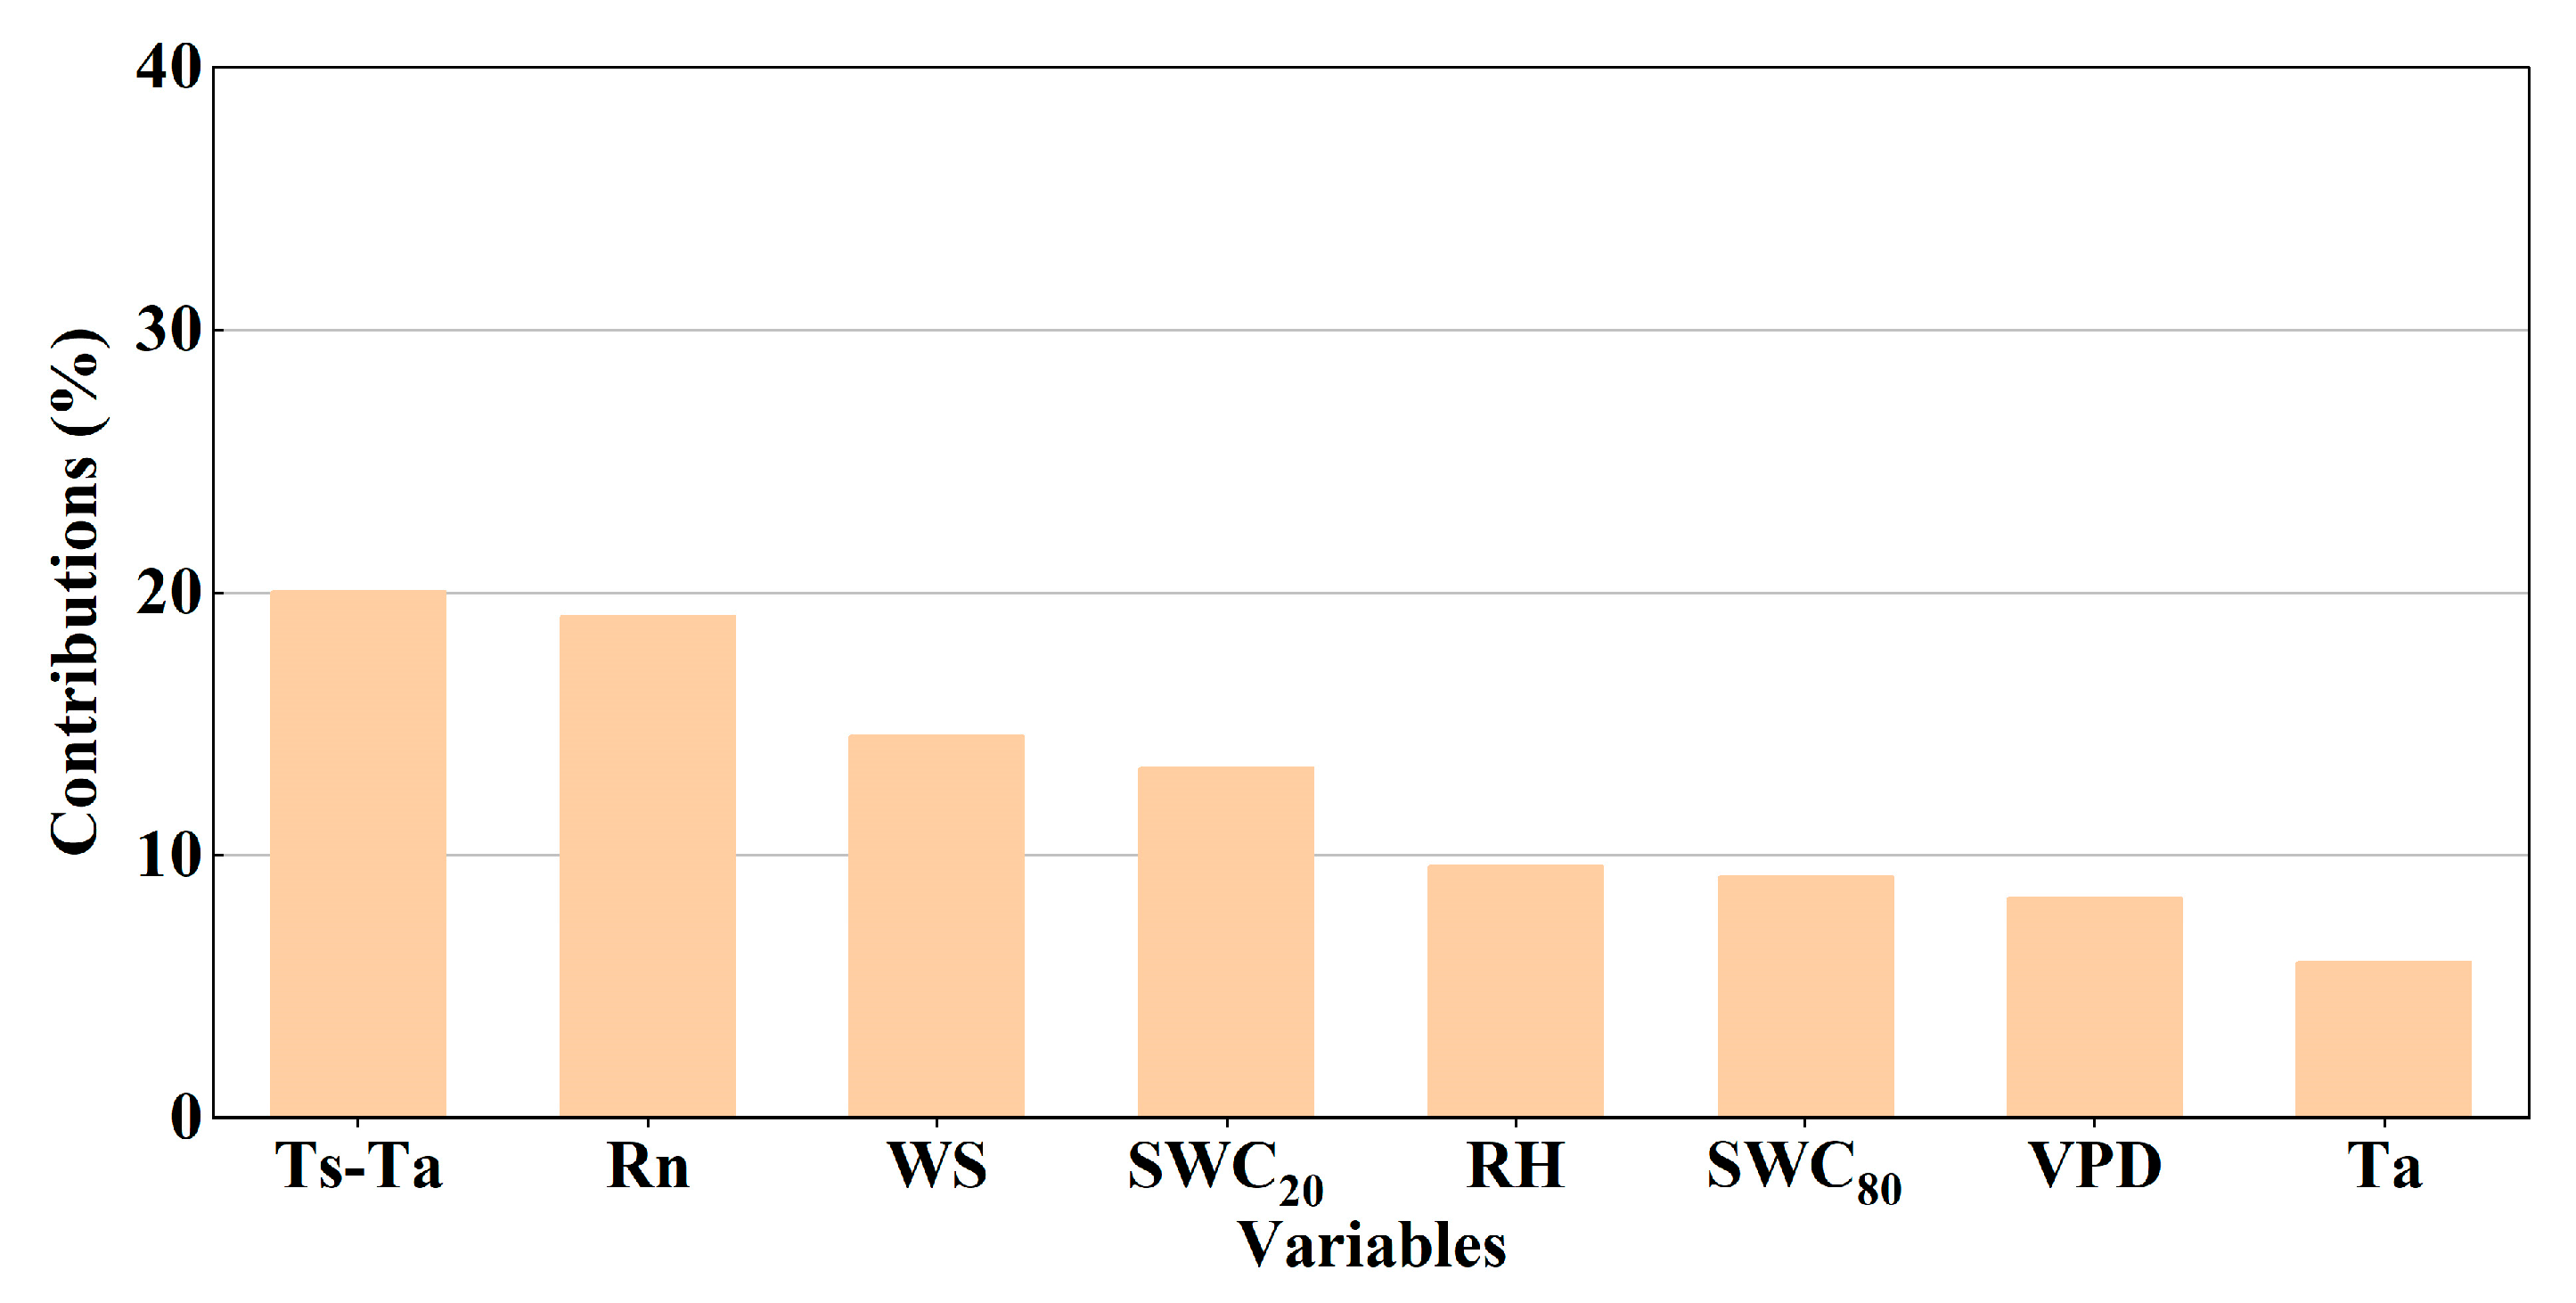
3.3. Environmental Factors Affecting ETN

Before quantifying the effects of environmental variables on ETN, we analyzed the relationships between ETN and environmental factors. Based on the non-interpolated half-hour data, the results of Spearman’s correlation analysis showed different correlations between ETN and environmental factors (Appendix A, Table A3). All environmental variables, except Ta, were significantly correlated with ETN, with RH and Ts-Ta showing negative correlation with ETN. We then assessed the multicollinearity of environmental factors and selected appropriate variables for the BRT model (the absolute value of the correlation coefficient was lower than 0.8; VIF < 10). SWC40 was excluded, and Ta, RH, VPD, WS, Ts-Ta, SWC20, SWC80, and Rn were selected as predictor variables for modeling.
Assessment of the performance of the BRT model yielded RMSE = 0.01 and R2 = 0.24, which were acceptable results compared with the nocturnal evapotranspiration study by Han et al. [8]. The BRT model’s performance validation of two of the five FLUXNET sites yielded RMSE values of 0.02 and 0.01 and R2 values of 0.29 and 0.31. Figure 7 compares the relative contributions of environmental variables to half-hour scale ETN variations. The results indicate that ETN was influenced by several factors during the growing seasons, with Ts-Ta having the highest contribution of 20.1%, followed by Rn with a contribution of 19.1%. The contributions of other factors ranged from 5.9% to 14.5%. The BRT analysis revealed that the relative contributions of different predictor variables to ETN varied little, implying that there may be complex interactions between ETN and the environment at the half-hour scale.

4. Discussion

4.1. Uncertainties in Observations

The eddy covariance (EC) method is generally regarded as the standard approach for observing evapotranspiration [52] and is widely employed for long-term carbon and water flux monitoring in various ecosystems. However, the EC system may underestimate the LE at night when atmospheric stratification is stable, which in turn leads to uncertainties in evapotranspiration observations [21,22]. Potential sources of uncertainty may include instrumental errors, disturbances in environmental and biological processes, and discrepancies in data processing methods [53,54,55,56]. To maximize the reliability of the data, some of the nighttime data were excluded using friction velocity threshold detection, a method similar to that employed in some previous reports [57]. Furthermore, condensation interference is inevitable in the observations due to the capacity of the EC system to capture the negative latent heat flux resulting from the adsorption of atmospheric water vapor [58]. Despite the common practice of disregarding these negative LE values as random noise, in this study, we set the negative LE to zero in an effort to minimize interference. LE observations are also influenced by surface energy imbalance (SEI); however, the mechanism of its nightly generation is subject to some controversy. In addition to the previously considered factors, such as friction velocity and nighttime advection, a recent study conducted in the Loess Plateau suggested that systematic errors in longwave radiation may be the primary cause of nocturnal SEI [23]. This finding indicates that the impact of turbulent flux on nighttime SEI is minimal. Therefore, it is reasonable to use uncorrected flux data for analysis of the mechanism. Further experimental validation of the uncertainties and potential impacts of nocturnal SEI is warranted.

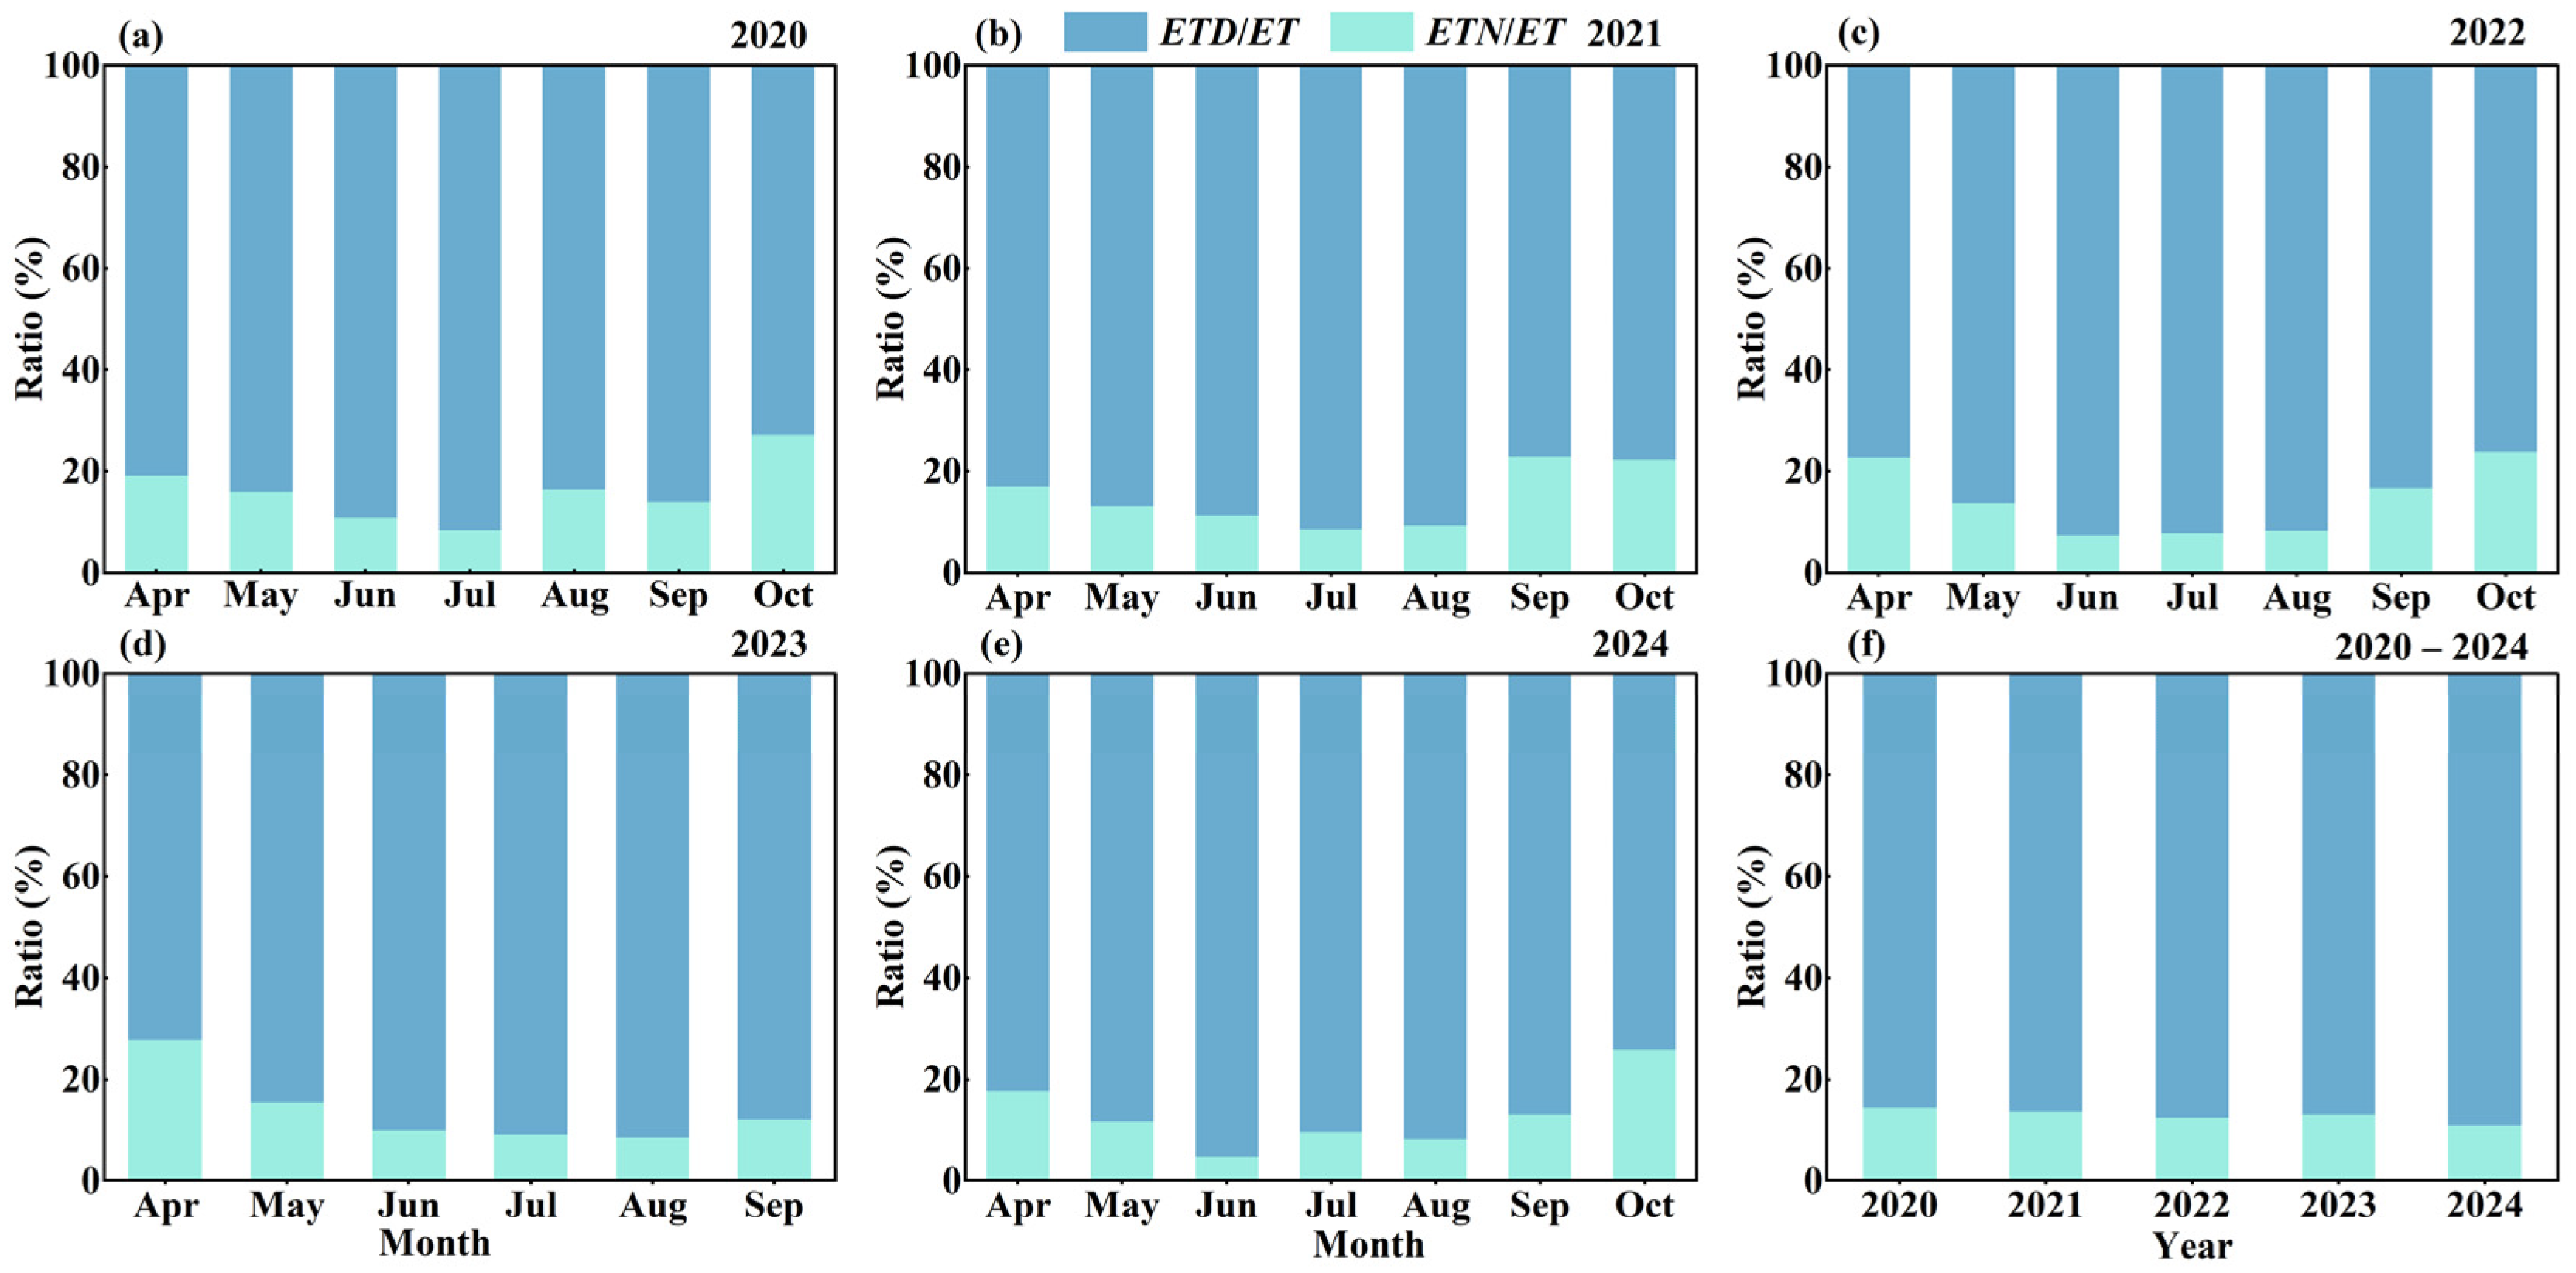
4.2. Changes in ETN and Its Proportion to ET (or ETD)

Our observations of the dry farming area revealed that there was no significant trend in diurnal ETN and that the evapotranspiration intensity was relatively weak at night. As reported by Guo et al. [22], studies in a desert shrubland of Northwest China have similarly suggested that the trend in diurnal ETN is insignificant. Additionally, experiments on the evapotranspiration characteristics of crops in arid regions have concluded that the diurnal ETN variations are weak and small in magnitude [59,60]. On larger time scales, compared with daily ETD, the changes in daily ETN remained insignificant or without clear seasonal dynamics. However, after further aggregation, monthly ETN within the growing seasons exhibited two characteristic peaks (Figure 5), which differed from the commonly assumed presence of one peak in ET within the year (strong seasonal dynamics of ETD masked the variations in ETN). Previous studies in different ecosystems have also identified ETN with two intra-annual peaks, which may be influenced, to some extent, by the evaporation of water from the wet surface [3,57]. Experiments conducted at four sites in the alpine ecosystems of the Qinghai-Tibet Plateau, China, yielded different results from those reported in this study; additionally, the variations in monthly ETN at some sites also show a single-peak pattern with dynamics similar to those of ETD [26]. The study by Han et al. [8] in Australia also suggested that the monthly ETN and ETD have a relatively consistent course of change. These results suggest that ETN dynamics in different regions or ecosystems vary, and that the adaptive responses of plant physiological strategies to environmental stresses are probably the main reasons for these variations. Mid-growth nocturnal sap flow was used to supplement the water deficit caused by intense daytime transpiration [61], leading to a reduction in ETN; however, the extent to which nocturnal refilling of plants can affect transpiration remains difficult to clarify [62]. Some studies have suggested that refilling accounts for 70% or more of nocturnal sap flow [63,64], that this refilling behavior is influenced by soil water content [65], and that arbor refilling exceeds scrub refilling [62]. Although nocturnal evapotranspiration is influenced by the complexity of vegetation and environment, and ETN varies significantly across ecosystems, there remains a need to identify ETN patterns, in terms of processes and mechanisms, through more experimental observations.
Nocturnal evapotranspiration as a proportion of daily evapotranspiration (or daytime evapotranspiration) is a key metric for quantifying the relative importance of nocturnal water loss [8,66]. Our results indicated that the annual average value of the ETN/ET ratio during the study period was 12.8%, with inter-annual variations ranging from 10.9% to 14.3%. Several previous studies found significant variations in ETN/ET (or ETN/ETD) ratios at different sites. Analysis of grassland and forest ecosystems in the southeastern U.S. found that ETN accounted for an average of 8–9% of daytime evapotranspiration [21]; for the desert shrubland region of Northwest China, the annual ETN/ET ratio was only 3–4% [22]; and the ratio of ETN to ET during the growing season at some sites in alpine ecosystems was about 9–15% [26]. In comparison to the aforementioned studies, nocturnal transpiration in arid and semi-arid ecosystems can account for more than 30% of daytime transpiration [67]. Differences in ETN/ET among ecosystems mean that environmental variables may have different effects on ETN/ET.
Therefore, we further analyzed the relationship between ETN/ET and nocturnal environmental variables at the monthly scale (Table 1). The results of linear regression analysis indicated that ETN/ET was significantly influenced by Ta (R2 = 0.77, p < 0.001), and that the different time scales may have contributed to the discrepancy with the results of the BRT analysis. VPD and GCC were also important factors affecting variations in ETN/ET. By contrast, a study of the FLUXNET sites in Northern Australia concluded that there were strong correlations between ETN/ETD and P, VPD, and LAI; however, these strong correlations mainly reflected spatial variations in ETD along the transect [8]. It is noteworthy that the monthly variations in ETN/ET were significant, likely attributable to the substantial nocturnal sap flow that occurs during summer stem water refill; specifically, soil moisture is absorbed by the roots at night and transported upward to effectively replenish the water deficit induced by daytime transpiration. Following sufficient stem water refilling, the nocturnal sap flow is allocated to canopy transpiration [67]. The general relationship between ETN/ET and environmental variables remains elusive at the global scale [4,8], and may be influenced by a combination of vegetation conditions and abiotic factors; however, determining this relationship based on the differential response of ETN and ETD to environmental change is challenging.

4.3. Effects of Environmental Factors on ETN

Variations in ETN were influenced by different drivers that varied across ecosystems. Our results suggest that the relative contributions of Ts-Ta and Rn exceeded those of other variables during the growing season, indicating that energy was the main factor controlling ETN in the study area. The highest contribution of temperature difference to ETN (26.1%), followed by wind speed (20.8%), was observed at low-altitude sites in alpine ecosystems, as reported by Liao et al. [26]. Han et al. [8] also mentioned that ETN at Northern Australian sites was mainly controlled by soil water content and wind speed, which were closely correlated with soil evaporation, and that the wind prevented the formation of a strong nocturnal inversion above the canopy. By contrast, the present study showed that WS and SWC also have important effects on ETN changes (Figure 7), where, on the one hand, an increase in SWC leads to an increase in nocturnal sap flow [68], and on the other hand, WS impacts the rate of water vapor transfer in the environment [8], which in turn regulates ETN. Additional studies have emphasized the role of VPD changes (associated with alternating cold fronts and high-pressure weather) on nighttime transpiration [16], as well as the responses of ETN to Ta during specific phenological stages [22]. Vapor pressure deficit is often thought to influence nocturnal transpiration; however, our results suggested that the contribution of VPD was not significant, probably due to the fact that the study area was frequently in a state of high humidity at night, resulting in a weakening of the control of ETN by VPD. Furthermore, plants in arid environments develop adaptive responses to water stress, such as nocturnal transpiration, which may decrease with the degree of soil aridity [67,69]. In summary, variations in ETN within ecosystems are influenced by a variety of biophysical factors, and there are complex interactions among these factors, making it difficult to elucidate the general mechanisms controlling ETN at different scales. Therefore, it is essential to explore the relationship between ETN and environmental variables in depth using different methods.

5. Conclusions

In this study, evapotranspiration was monitored in a dry farming area on the Loess Plateau of China for five consecutive years (2020–2024). Evapotranspiration during the growing season was categorized into ETN and ETD. We analyzed the pattern of variations in ETN at different time scales, as well as the ratio of ETN to ET. Finally, we assessed the relationship between environmental factors and ETN and quantified the relative effect of environmental variables on ETN.
Observation of the EC system revealed a bimodal pattern in the monthly ETN values within the year, with maximum and minimum monthly ETN values of 15.3 mm (September 2021) and 4.1 mm (June 2024) from 2020 to 2024. The seasonal trends for daily ETN were not significant compared with those for daily ETD, and the maximum ETN was 0.84 mm day−1. The annual ETN ranged from 51.0 mm to 64.8 mm, with a mean annual ETN of 59.8 mm. By contrast, the total annual ETD ranged from 376.1 mm to 458.4 mm, with an annual mean of 408.4 mm. Monthly ETN/ET ratios exhibited seasonal trends, with ETN/ET ratios of 14.3%, 13.5%, 12.4%, 12.9%, and 10.9% in the 2020, 2021, 2022, 2023, and 2024 growing seasons, respectively.
Analysis using the BRT method indicated that the relative contributions of different environmental factors to ETN at the half-hour scale varied little, with Ts-Ta (20.1%) and Rn (19.1%) contributing more than the other predictor variables, and Ta having the lowest contribution (5.9%). Linear regression analyses of ETN/ET with environmental variables at the monthly scale showed that ETN/ET was primarily controlled by Ta. These results suggest that ETN and ETD respond differently to environmental variations and that there are complex interrelationships between ETN and the influencing factors.
The study emphasizes the importance and non-negligible nature of nocturnal evapotranspiration in dry farming regions. Further exploration of its relationship with the environment is essential, especially in arid regions where evapotranspiration plays a key role in the water cycle.

Author Contributions

Conceptualization, F.G., D.L. and S.M.; methodology, F.G. and D.L.; software, F.G.; validation, F.G. and D.L.; formal analysis, D.L., M.L. and F.G.; investigation, F.G. and D.L.; resources, D.L. and Q.L.; data curation, F.G., D.L. and S.M.; writing—original draft preparation, F.G.; writing—review and editing, F.G., D.L., S.M., Q.L., F.Z. and M.L.; visualization, F.G.; supervision, D.L., F.H. and S.M.; project administration, D.L., S.M. and Q.L.; funding acquisition, D.L. and Q.L. All authors have read and agreed to the published version of the manuscript.

Funding

This study was financially supported by the National Natural Science Foundation of China (Grant No. 52279025) and the National Key R&D Program of China (2022YFF1302200).

Data Availability Statement

The experimental data used in this study were obtained from the Chunhua Ecohydrology Experimental Station of Xi’an University of Technology. The dataset is known as the Chunhua Ecohydrology Experimental Station Dataset (CEESD) and can be obtained from the corresponding author (Dengfeng Liu, liudf@xaut.edu.cn) upon reasonable request.

Conflicts of Interest

The authors declare that the research was conducted in the absence of any commercial or financial relationships that could be construed as a potential conflict of interest.

Appendix A

Table A1 lists the percentage of half-hourly data retained throughout the study period (growing season in each year from 2020 to 2024) after quality control procedures.
Table A1. Percentage of data retained.
20202021202220232024Total
Nighttime (%)36.031.251.633.147.240.0
Daytime (%)52.751.872.849.169.159.3
Total (%)45.342.663.442.159.450.8
Table A2 lists the variations in mean (or summed) nocturnal air temperature (Ta), difference between surface temperature and air temperature (Ts-Ta), relative humidity (RH), vapor pressure deficit (VPD), wind speed (WS), soil water content at 20, 40, and 80 cm below the ground (SWC20, SWC40, SWC80), precipitation (P), net radiation (Rn), and daily green chromatic coordinate (GCC) for each month during the growing season (April to October) from 2020 to 2024. “/” represents missing data.
Table A2. Summary of environmental factors.
VariableYearGrowing SeasonMean or Summation
Apr.MayJun.Jul.Aug.Sep.Oct.
Ta (°C)202010.216.018.618.918.515.08.115.0 ± 4.9
20218.415.219.520.318.816.28.115.2 ± 5.6
202211.414.320.320.520.715.39.515.9 ± 5.4
20239.613.519.421.120.7//16.2 ± 5.9
202412.616.4/20.820.817.510.516.3 ± 4.8
Ts-Ta (°C)2020−3.5−3.1−1.8−1.3−1.0−1.7−1.3−1.9 ± 1.6
2021−1.7−3.2−2.1−1.6−1.5−1.6−1.2−1.8 ± 1.5
2022−2.7−2.3−2.0−1.0−0.7−1.5−1.3−1.6 ± 1.2
2023−1.6−1.4−1.5−1.3−1.0//−1.4 ± 1.0
2024−1.8−1.7/−0.6−0.8−0.5−0.9−1.1 ± 0.8
RH (%)202044.449.768.082.486.575.272.368.4 ± 23.9
202168.355.863.079.076.179.983.272.2 ± 20.6
202248.959.957.076.981.371.869.866.6 ± 21.1
202359.167.160.665.777.7//65.0 ± 20.3
202460.558.6/85.681.685.173.873.8 ± 18.5
VPD (hPa)202010.514.113.410.09.510.58.510.9 ± 4.6
20218.514.916.813.313.6//13.2 ± 5.2
202211.711.416.713.813.512.410.012.8 ± 4.8
202312.313.818.519.614.4//15.7 ± 5.8
202410.814.3/9.211.09.68.110.6 ± 3.4
WS (m s−1)20202.73.12.82.93.23.02.42.8 ± 1.4
20213.22.82.52.82.82.32.42.7 ± 1.4
20223.12.72.93.33.62.82.73.0 ± 1.4
20233.12.82.63.02.7//2.9 ± 1.3
20242.82.7/2.02.74.12.92.9 ± 1.5
SWC20 (cm3 cm−3)20200.210.240.250.230.280.190.260.24 ± 0.05
20210.280.310.280.280.180.310.320.28 ± 0.05
20220.220.210.120.220.130.200.220.19 ± 0.06
20230.230.190.140.120.24//0.18 ± 0.06
20240.180.10/0.260.160.090.100.15 ± 0.07
SWC40 (cm3 cm−3)20200.320.330.340.340.350.300.300.33 ± 0.02
20210.350.350.310.330.280.340.400.34 ± 0.04
20220.370.360.270.310.260.270.290.30 ± 0.06
20230.340.330.300.250.35//0.31 ± 0.04
20240.330.25/0.330.280.210.190.26 ± 0.06
SWC80 (cm3 cm−3)20200.260.260.270.270.290.260.240.27 ± 0.02
20210.260.300.300.300.280.270.320.29 ± 0.03
20220.310.300.240.190.190.180.180.23 ± 0.05
20230.210.240.240.200.24//0.22 ± 0.02
20240.270.23/0.230.270.200.160.23 ± 0.05
P (mm)20201.536.018.916.481.721.328.5204.3 ± 4.2
202117.767.820.619.416.984.762.3289.4 ± 4.0
202224.326.014.291.624.615.015.7211.4 ± 3.3
202324.513.047.815.4///100.7 ± 2.3
202417.61.2/70.442.310.418.4160.3 ± 4.2
Rn (W m−2)2020−62.4−62.8−44.8−41.1−34.2−45.1−32.4−46.0 ± 25.8
2021−39.9−59.1−44.6−42.6−44.1−39.9−31.3−43.1 ± 23.3
2022−54.9−58.6−57.4−46.2−36.2−48.4−42.3−49.1 ± 23.5
2023−46.7−40.4−53.3−50.4−44.0//−47.3 ± 24.2
2024−51.8−58.3/−28.8−43.0−39.7−45.4−45.0 ± 19.9
GCC20200.3370.3520.3490.3400.3370.3410.3420.343 ± 0.006
20210.3370.3470.3510.3490.3460.3450.3420.345 ± 0.005
20220.3360.3460.3520.3480.3440.3440.3400.344 ± 0.005
20230.3370.3450.3490.3480.3460.344/0.345 ± 0.005
20240.3380.347/0.3420.3410.3420.3410.343 ± 0.004
Table A3 shows Spearman’s correlation coefficients of half-hour scale nocturnal evapotranspiration (ETN) with environmental variables, including air temperature (Ta), relative humidity (RH), vapor pressure deficit (VPD), wind speed (WS), difference between surface temperature and air temperature (Ts-Ta), soil water content at 20, 40, and 80 cm below the ground (SWC20, SWC40, SWC80), and net radiation (Rn) for the study period. “a” indicates that the correlation is significant at the 0.01 level. “b” indicates that the correlation is significant at the 0.05 level. Table A3 highlights significant correlations between ETN and environmental variables in bold.
Table A3. Spearman’s correlation coefficients of ETN with environmental variables.
VariableETNTaRHVPDWSTs-TaSWC20SWC40SWC80Rn
ETN1
Ta0.021
RH−0.26 a−0.03 b1
VPD0.18 a0.59 a0.76 a1
WS0.11 a0.04 a0.04 a−0.03 a1
Ts-Ta−0.14 a−0.06 a0.77 a0.23 a0.23 a1
SWC200.16 a−0.22 a−0.06 a0.09 a−0.04 a−0.19 a1
SWC400.13 a−0.1 a−0.10 a0.03 b0.02−0.23 a0.82 a1
SWC800.08 a0.07 a−0.06 a0.02 b0.05 a−0.22 a0.50 a0.65 a1
Rn0.08 a−0.16 a0.56 a−0.52 a−0.05 a0.76 a0.06 a−0.04 a−0.04 a1

References

  1. Xue, Y.; Zhang, Z.; Li, X.; Liang, H.; Yin, L. A Review of Evapotranspiration Estimation Models: Advances and Future Development. Water Resour. Manag. 2025, 39, 3641–3657. [Google Scholar] [CrossRef]
  2. Meidner, H.; Mansfield, T.A. Stomatal Responses to Illumination. Biol. Rev. 1965, 40, 483–508. [Google Scholar] [CrossRef]
  3. Groh, J.; Puetz, T.; Gerke, H.H.; Vanderborght, J.; Vereecken, H. Quantification and Prediction of Nighttime Evapotranspiration for Two Distinct Grassland Ecosystems. Water Resour. Res. 2019, 55, 2961–2975. [Google Scholar] [CrossRef]
  4. Padron, R.S.; Gudmundsson, L.; Michel, D.; Seneviratne, S. Terrestrial Water Loss at Night: Global Relevance from Observations and Climate Models. Hydrol. Earth Syst. Sci. 2020, 24, 793–807. [Google Scholar] [CrossRef]
  5. Liu, Z.; Yu, S.; Xu, L.; Wang, Y.; Yu, P.; Chao, Y. Differentiated Responses of Daytime and Nighttime Sap Flow to Soil Water Deficit in a Larch Plantation in Northwest China. Agric. Water Manag. 2023, 289, 108540. [Google Scholar] [CrossRef]
  6. de Dios, V.R.; Roy, J.; Ferrio, J.P.; Alday, J.G.; Landais, D.; Milcu, A.; Gessler, A. Processes Driving Nocturnal Transpiration and Implications for Estimating Land Evapotranspiration. Sci. Rep. 2015, 5, 10975. [Google Scholar] [CrossRef] [PubMed]
  7. Chaves, M.M.; Costa, J.M.; Zarrouk, O.; Pinheiro, C.; Lopes, C.M.; Pereira, J.S. Controlling Stomatal Aperture in Semi-Arid Regions-The Dilemma of Saving Water or Being Cool? Plant Sci. 2016, 251, 54–64. [Google Scholar] [CrossRef]
  8. Han, Q.; Wang, T.; Wang, L.; Smettem, K.; Mai, M.; Chen, X. Comparison of Nighttime With Daytime Evapotranspiration Responses to Environmental Controls Across Temporal Scales Along a Climate Gradient. Water Resour. Res. 2021, 57, e2021WR029638. [Google Scholar] [CrossRef]
  9. Yu, S.; Guo, J.; Liu, Z.; Wang, Y.; Xu, L.; Yu, P.; He, L. Impacts of Environmental and Canopy Conditions on the Nighttime Sap Flow of Larch Plantations in the Liupan Mountains, China. J. For. Res. 2023, 34, 1927–1940. [Google Scholar] [CrossRef]
  10. Forster, M.A. How Significant Is Nocturnal Sap Flow? Tree Physiol. 2014, 34, 757–765. [Google Scholar] [CrossRef]
  11. Kupper, P.; Rohula, G.; Saksing, L.; Sellin, A.; Lõhmus, K.; Ostonen, I.; Helmisaari, H.-S.; Sõber, A. Does Soil Nutrient Availability Influence Night-Time Water Flux of Aspen Saplings? Environ. Exp. Bot. 2012, 82, 37–42. [Google Scholar] [CrossRef]
  12. Zeppel, M.J.B.; Lewis, J.D.; Medlyn, B.; Barton, C.V.M.; Duursma, R.A.; Eamus, D.; Adams, M.A.; Phillips, N.; Ellsworth, D.S.; Forster, M.A.; et al. Interactive Effects of Elevated CO2 and Drought on Nocturnal Water Fluxes in Eucalyptus Saligna. Tree Physiol. 2011, 31, 932–944. [Google Scholar] [CrossRef]
  13. Karpul, R.H.; West, A.G. Wind Drives Nocturnal, but Not Diurnal, Transpiration in Leucospermum Conocarpodendron Trees: Implications for Stilling on the Cape Peninsula. Tree Physiol. 2016, 36, 954–966. [Google Scholar] [CrossRef] [PubMed]
  14. Yi, Y.; Yano, K. Nocturnal versus Diurnal Transpiration in Rice Plants: Analysis of Five Genotypes Grown under Different Atmospheric CO2 and Soil Moisture Conditions. Agric. Water Manag. 2023, 286, 108397. [Google Scholar] [CrossRef]
  15. Vega, C.; Chi, C.-J.E.; Fernandez, V.; Burkhardt, J. Nocturnal Transpiration May Be Associated with Foliar Nutrient Uptake. Plants 2023, 12, 531. [Google Scholar] [CrossRef]
  16. Susana Alvarado-Barrientos, M.; Holwerda, F.; Geissert, D.R.; Munoz-Villers, L.E.; Gotsch, S.G.; Asbjornsen, H.; Dawson, T.E. Nighttime Transpiration in a Seasonally Dry Tropical Montane Cloud Forest Environment. Trees-Struct. Funct. 2015, 29, 259–274. [Google Scholar] [CrossRef]
  17. Yu, T.; Feng, Q.; Si, J.; Zhang, X.; Alec, D.; Zhao, C. Evidences and Magnitude of Nighttime Transpiration Derived from Populus Euphratica in the Extreme Arid Region of China. J. Plant Biol. 2016, 59, 648–657. [Google Scholar] [CrossRef]
  18. Chen, L.X.; Zhang, Z.Q.; Li, Z.D.; Zhang, W.J.; Zhang, X.F.; Dong, K.Y.; Wang, G.Y. Nocturnal Sap Flow of Four Urban Greening Tree Species in Dalian, Liaoning Province, China. Acta Phytoecol. Sin. 2010, 34, 535–546. [Google Scholar] [CrossRef]
  19. O’Keefe, K.; Nippert, J.B. Drivers of Nocturnal Water Flux in a Tallgrass Prairie. Funct. Ecol. 2018, 32, 1155–1167. [Google Scholar] [CrossRef]
  20. Zhao, C.; Si, J.; Feng, Q.; Yu, T.; Li, P.; Forster, M.A. Nighttime Transpiration of Populus Euphratica during Different Phenophases. J. For. Res. 2019, 30, 435–444. [Google Scholar] [CrossRef]
  21. Novick, K.A.; Oren, R.; Stoy, P.C.; Siqueira, M.B.S.; Katul, G.G. Nocturnal Evapotranspiration in Eddy-Covariance Records from Three Co-Located Ecosystems in the Southeastern US: Implications for Annual Fluxes. Agric. For. Meteorol. 2009, 149, 1491–1504. [Google Scholar] [CrossRef]
  22. Guo, X.; Shang, G.; Tian, Y.; Jia, X.; Zha, T.; Li, C.; Yang, H.; Zhang, X. Dynamics of Nocturnal Evapotranspiration and Its Biophysical Controls over a Desert Shrubland of Northwest China. Forests 2021, 12, 1296. [Google Scholar] [CrossRef]
  23. Zhao, J.; Zhang, Q.; Wang, S.; Liang, Y.; Zhang, L.; Yue, P.; Zhao, F. Preliminary study on the nocturnal surface energy imbalance on the Loess Plateau. Chin. J. Geophys. 2025, 68, 385–398. [Google Scholar] [CrossRef]
  24. Liang, J.; Zhang, L.; Cao, X.; Wen, J.; Wang, J.; Wang, G. Energy Balance in the Semiarid Area of the Loess Plateau, China. J. Geophys. Res. Atmos. 2017, 122, 2155–2168. [Google Scholar] [CrossRef]
  25. Montoro, A.; Torija, I.; Manas, F.; Lopez-Urrea, R. Lysimeter Measurements of Nocturnal and Diurnal Grapevine Transpiration: Effect of Soil Water Content, and Phenology. Agric. Water Manag. 2020, 229, 105882. [Google Scholar] [CrossRef]
  26. Liao, Q.; Li, X.; Shi, F.; Deng, Y.; Wang, P.; Wu, T.; Wei, J.; Zuo, F. Diurnal Evapotranspiration and Its Controlling Factors of Alpine Ecosystems during the Growing Season in Northeast Qinghai-Tibet Plateau. Water 2022, 14, 700. [Google Scholar] [CrossRef]
  27. Skaggs, K.E.; Irmak, S. Characterization of Nighttime Evapotranspiration and Other Surface Energy Fluxes and Interactions with Microclimatic Variables in Subsurface Drip and Center-Pivot Irrigated Soybean Fields. Trans. ASABE 2011, 54, 941–952. [Google Scholar] [CrossRef]
  28. Guo, X.; Xiao, J.; Zha, T.; Shang, G.; Liu, P.; Jin, C.; Zhang, Y. Dynamics and Biophysical Controls of Nocturnal Water Loss in a Winter Wheat-Summer Maize Rotation Cropland: A Multi-Temporal Scale Analysis. Agric. For. Meteorol. 2023, 342, 109701. [Google Scholar] [CrossRef]
  29. Chowdhury, F.I.; Arteaga, C.; Alam, M.S.; Alam, I.; Resco de Dios, V. Drivers of Nocturnal Stomatal Conductance in C3 and C4 Plants. Sci. Total Environ. 2022, 814, 151952. [Google Scholar] [CrossRef]
  30. Sun, M.; Dong, Q.; Jiao, M.; Zhao, X.; Gao, X.; Wu, P.; Wang, A. Estimation of Actual Evapotranspiration in a Semiarid Region Based on GRACE Gravity Satellite Data—A Case Study in Loess Plateau. Remote Sens. 2018, 10, 2032. [Google Scholar] [CrossRef]
  31. Zhao, G.; Mu, X.; Wen, Z.; Wang, F.; Gao, P. Soil Erosion, Conservation, and Eco-Environment Changes in the Loess Plateau of China. Land Degrad. Dev. 2013, 24, 499–510. [Google Scholar] [CrossRef]
  32. Sun, W.; Song, X.; Mu, X.; Gao, P.; Wang, F.; Zhao, G. Spatiotemporal Vegetation Cover Variations Associated with Climate Change and Ecological Restoration in the Loess Plateau. Agric. For. Meteorol. 2015, 209, 87–99. [Google Scholar] [CrossRef]
  33. Li, Z.; Liu, W.; Zhang, X.; Zheng, F. Impacts of Land Use Change and Climate Variability on Hydrology in an Agricultural Catchment on the Loess Plateau of China. J. Hydrol. 2009, 377, 35–42. [Google Scholar] [CrossRef]
  34. Zhang, S.; Sadras, V.; Chen, X.; Zhang, F. Water Use Efficiency of Dryland Wheat in the Loess Plateau in Response to Soil and Crop Management. Field Crops Res. 2013, 151, 9–18. [Google Scholar] [CrossRef]
  35. Ge, J.; Pitman, A.J.; Guo, W.; Zan, B.; Fu, C. Impact of Revegetation of the Loess Plateau of China on the Regional Growing Season Water Balance. Hydrol. Earth Syst. Sci. 2020, 24, 515–533. [Google Scholar] [CrossRef]
  36. Zhao, F.; Ma, S.; Wu, Y.; Qiu, L.; Wang, W.; Lian, Y.; Chen, J.; Sivakumar, B. The Role of Climate Change and Vegetation Greening on Evapotranspiration Variation in the Yellow River Basin, China. Agric. For. Meteorol. 2022, 316, 108842. [Google Scholar] [CrossRef]
  37. Liu, Y.; Li, S.; Chen, F.; Yang, S.; Chen, X. Soil Water Dynamics and Water Use Efficiency in Spring Maize (Zea Mays L.) Fields Subjected to Different Water Management Practices on the Loess Plateau, China. Agric. Water Manag. 2010, 97, 769–775. [Google Scholar] [CrossRef]
  38. Zhang, K.; Liu, D.; Liu, H.; Lei, H.; Guo, F.; Xie, S.; Meng, X.; Huang, Q. Energy Flux Observation in a Shrub Ecosystem of a Gully Region of the Chinese Loess Plateau. Ecohydrol. Hydrobiol. 2022, 22, 323–336. [Google Scholar] [CrossRef]
  39. Guo, F.; Liu, D.; Mo, S.; Li, Q.; Meng, J.; Huang, Q. Assessment of Phenological Dynamics of Different Vegetation Types and Their Environmental Drivers with Near-Surface Remote Sensing: A Case Study on the Loess Plateau of China. Plants 2024, 13, 1826. [Google Scholar] [CrossRef]
  40. Guo, F.; Liu, D.; Mo, S.; Huang, Q.; Ma, L.; Xie, S.; Deng, W.; Ming, G.; Fan, J. Estimation of Daily Evapotranspiration in Gully Area Scrub Ecosystems on Loess Plateau of China Based on Multisource Observation Data. Ecol. Indic. 2023, 154, 110671. [Google Scholar] [CrossRef]
  41. Richardson, A.D.; Hufkens, K.; Milliman, T.; Aubrecht, D.M.; Chen, M.; Gray, J.M.; Johnston, M.R.; Keenan, T.F.; Klosterman, S.T.; Kosmala, M.; et al. Tracking Vegetation Phenology across Diverse North American Biomes Using PhenoCam Imagery. Sci. Data 2018, 5, 180028. [Google Scholar] [CrossRef] [PubMed]
  42. Sonnentag, O.; Hufkens, K.; Teshera-Sterne, C.; Young, A.M.; Friedl, M.; Braswell, B.H.; Milliman, T.; O’Keefe, J.; Richardson, A.D. Digital Repeat Photography for Phenological Research in Forest Ecosystems. Agric. For. Meteorol. 2012, 152, 159–177. [Google Scholar] [CrossRef]
  43. Richardson, A.D.; Braswell, B.H.; Hollinger, D.Y.; Jenkins, J.P.; Ollinger, S.V. Near-Surface Remote Sensing of Spatial and Temporal Variation in Canopy Phenology. Ecol. Appl. 2009, 19, 1417–1428. [Google Scholar] [CrossRef] [PubMed]
  44. Webb, E.K.; Pearman, G.I.; Leuning, R. Correction of Flux Measurements for Density Effects Due to Heat and Water Vapour Transfer. Q. J. R. Meteorol. Soc. 1980, 106, 85–100. [Google Scholar] [CrossRef]
  45. Wilczak, J.M.; Oncley, S.P.; Stage, S.A. Sonic Anemometer Tilt Correction Algorithms. Bound.-Layer Meteorol. 2001, 99, 127–150. [Google Scholar] [CrossRef]
  46. Mauder, M.; Cuntz, M.; Drüe, C.; Graf, A.; Rebmann, C.; Schmid, H.P.; Schmidt, M.; Steinbrecher, R. A Strategy for Quality and Uncertainty Assessment of Long-Term Eddy-Covariance Measurements. Agric. For. Meteorol. 2013, 169, 122–135. [Google Scholar] [CrossRef]
  47. Wilson, K.; Goldstein, A.; Falge, E.; Aubinet, M.; Baldocchi, D.; Berbigier, P.; Bernhofer, C.; Ceulemans, R.; Dolman, H.; Field, C.; et al. Energy Balance Closure at FLUXNET Sites. Agric. For. Meteorol. 2002, 113, 223–243. [Google Scholar] [CrossRef]
  48. Sun, L.; Zhu, W.; Xie, Z.; Zhan, P.; Li, X. Multi-Dimension Evaluation of Remote Sensing Indices for Land Surface Phenology Monitoring. Natl. Remote Sens. Bull. 2023, 27, 2653–2669. [Google Scholar] [CrossRef]
  49. Elith, J.; Leathwick, J.R.; Hastie, T. A Working Guide to Boosted Regression Trees. J. Anim. Ecol. 2008, 77, 802–813. [Google Scholar] [CrossRef]
  50. Sun, S.; Che, T.; Li, H.; Wang, T.; Ma, C.; Liu, B.; Wu, Y.; Song, Z. Water and Carbon Dioxide Exchange of an Alpine Meadow Ecosystem in the Northeastern Tibetan Plateau Is Energy-Limited. Agric. For. Meteorol. 2019, 275, 283–295. [Google Scholar] [CrossRef]
  51. Gao, G.; Guo, X.; Feng, Q.; Xu, E.; Hao, Y.; Wang, R.; Jing, W.; Ren, X.; Liu, S.; Shi, J.; et al. Environmental Controls on Evapotranspiration and Its Components in a Qinghai Spruce Forest in the Qilian Mountains. Plants 2024, 13, 801. [Google Scholar] [CrossRef] [PubMed]
  52. Zhang, G.; Zheng, N.; Zhang, J.; Meng, P. Advances in the Study of Regional-Averaged Evapotranspiration Using the Scintillation Method. Acta Ecol. Sin. 2018, 38, 2625–2635. [Google Scholar] [CrossRef]
  53. Fratini, G.; McDermitt, D.K.; Papale, D. Eddy-Covariance Flux Errors Due to Biases in Gas Concentration Measurements: Origins, Quantification and Correction. Biogeosciences 2014, 11, 1037–1051. [Google Scholar] [CrossRef]
  54. Heusinkveld, B.G.; Jacobs, A.F.G.; Holtslag, A.A.M. Effect of Open-Path Gas Analyzer Wetness on Eddy Covariance Flux Measurements: A Proposed Solution. Agric. For. Meteorol. 2008, 148, 1563–1573. [Google Scholar] [CrossRef]
  55. van Gorsel, E.; Leuning, R.; Cleugh, H.A.; Keith, H.; Kirschbaum, M.U.F.; Suni, T. Application of an Alternative Method to Derive Reliable Estimates of Nighttime Respiration from Eddy Covariance Measurements in Moderately Complex Topography. Agric. For. Meteorol. 2008, 148, 1174–1180. [Google Scholar] [CrossRef]
  56. Sabbatini, S.; Mammarella, I.; Arriga, N.; Fratini, G.; Graf, A.; Hoertriagl, L.; Ibrom, A.; Longdoz, B.; Mauder, M.; Merbold, L.; et al. Eddy Covariance Raw Data Processing for CO2 and Energy Fluxes Calculation at ICOS Ecosystem Stations. Int. Agrophys. 2018, 32, 495–515. [Google Scholar] [CrossRef]
  57. Guo, X.; Zhang, Y.; Zha, T.; Shang, G.; Jin, C.; Wang, Y.; Yang, H. Biophysical Controls of Dew Formation in a Typical Cropland and Its Relationship to Drought in the North China Plain. J. Hydrol. 2023, 617, 128945. [Google Scholar] [CrossRef]
  58. Paulus, S.J.; Orth, R.; Lee, S.-C.; Hildebrandt, A.; Jung, M.; Nelson, J.A.; El-Madany, T.S.; Carrara, A.; Moreno, G.; Mauder, M.; et al. Interpretability of Negative Latent Heat Fluxes from Eddy Covariance Measurements in Dry Conditions. Biogeosciences 2024, 21, 2051–2085. [Google Scholar] [CrossRef]
  59. Liu, M.; Shi, H.; Li, X.; Yan, J.; Sun, W.; Dou, X. Path Analysis of Evapotranspiration Dynamic Variation and Its Influencing Factors in Hetao Irrigation District. J. Drain. Irrig. Mach. Eng. 2018, 36, 1081–1086. [Google Scholar] [CrossRef]
  60. Liu, J.; Zhou, S.; Jin, L.; Wang, J.; Yang, J. Evapotranspiration of a Film-Mulched Cotton Field under Drip Irrigation in North Xinjiang. Arid Zone Res. 2012, 29, 360–368. [Google Scholar] [CrossRef]
  61. Ritchie, J.T. Atmospheric and Soil Water Influences on the Plant Water Balance. Agric. Meteorol. 1974, 14, 183–198. [Google Scholar] [CrossRef]
  62. Fang, W.; Lv, N.; Fu, B. Research Advances in Nighttime Sap Flow Density, Its Physiological Implications, and Influencing Factors in Plants. Acta Ecol. Sin. 2018, 38, 7521–7529. [Google Scholar] [CrossRef]
  63. Fisher, J.B.; Baldocchi, D.D.; Misson, L.; Dawson, T.E.; Goldstein, A.H. What the Towers Don’t See at Night: Nocturnal Sap Flow in Trees and Shrubs at Two AmeriFlux Sites in California. Tree Physiol. 2007, 27, 597–610. [Google Scholar] [CrossRef] [PubMed]
  64. Yu, T.; Feng, Q.; Si, J.; Mitchell, P.J.; Forster, M.A.; Zhang, X.; Zhao, C. Depressed Hydraulic Redistribution of Roots More by Stem Refilling than by Nocturnal Transpiration for Populus Euphratica Oliv. in Situ Measurement. Ecol. Evol. 2018, 8, 2607–2616. [Google Scholar] [CrossRef]
  65. Di, N.; Yang, S.; Liu, Y.; Fan, Y.; Duan, J.; Nadezhdina, N.; Li, X.; Xi, B. Soil-Moisture-Dependent Nocturnal Water Use Strategy and Its Responses to Meteorological Factors in a Seasonal-Arid Poplar Plantation. Agric. Water Manag. 2022, 274, 107984. [Google Scholar] [CrossRef]
  66. Dawson, T.E.; Burgess, S.S.O.; Tu, K.P.; Oliveira, R.S.; Santiago, L.S.; Fisher, J.B.; Simonin, K.A.; Ambrose, A.R. Nighttime Transpiration in Woody Plants from Contrasting Ecosystems. Tree Physiol. 2007, 27, 561–575. [Google Scholar] [CrossRef]
  67. Si, J.; Feng, Q.; Yu, T.; Zhao, C. Research Advances in Nighttime Transpiration and Its Eco-Hydrological Implications. Adv. Water Sci. 2014, 25, 907–914. [Google Scholar] [CrossRef]
  68. Chen, Z.; Zhang, Z.; Sun, G.; Chen, L.; Xu, H.; Chen, S. Biophysical Controls on Nocturnal Sap Flow in Plantation Forests in a Semi-Arid Region of Northern China. Agric. For. Meteorol. 2020, 284, 107904. [Google Scholar] [CrossRef]
  69. Bo, Y.; Wang, L.; Jian, S. Variations of Sap Flow of Caragana Korshinskii and Hippophae Rhamnoides in Hilly and Gully Region of the Loess Plateau. Acta Ecol. Sin. 2023, 43, 1553–1562. [Google Scholar] [CrossRef]
Figure 1. The experimental station was located in the gully area of the Loess Plateau of China. The red triangle represents the location of the flux tower.
Hydrology 12 00188 g001
Figure 2. Seasonal variations in (a) mean nocturnal air temperature (Ta), (b) the difference between mean nocturnal Ts and Ta (Ts-Ta), (c) mean nocturnal relative humidity (RH) and vapor pressure deficit (VPD), (d) mean nocturnal wind speed (WS), (e) mean nocturnal soil water content at 20, 40, and 80 cm below the ground (SWC20, SWC40, SWC80) and nocturnal precipitation (P), (f) mean nocturnal net radiation (Rn), and (g) tower-based green chromatic coordinate (GCC). Vertical solid lines separate years.
Hydrology 12 00188 g002
Figure 3. Average diurnal variations in ETN during the growing seasons in 2020–2024.
Hydrology 12 00188 g003
Figure 4. Temporal variations in daily and cumulative (a) nocturnal evapotranspiration (ETN) and (b) daytime evapotranspiration (ETD) during the growing seasons in 2020–2024. Vertical dashed lines separate years.
Hydrology 12 00188 g004
Figure 5. Monthly variations in nocturnal evapotranspiration (ETN) during the growing seasons in (a) 2020, (b) 2021, (c) 2022, (d) 2023, (e) 2024. Annual variations in ETN during the growing seasons in (f) 2020–2024.
Hydrology 12 00188 g005
Figure 6. Monthly variations in the ratios of nocturnal evapotranspiration (ETN/ET) and daytime evapotranspiration (ETD/ET) to evapotranspiration during the growing seasons in (a) 2020, (b) 2021, (c) 2022, (d) 2023, (e) 2024. Annual variations in ETN/ET and ETD/ET during the growing seasons in (f) 2020–2024.
Hydrology 12 00188 g006
Figure 7. Relative contributions of air temperature (Ta), relative humidity (RH), vapor pressure deficit (VPD), wind speed (WS), difference between surface temperature and air temperature (Ts-Ta), soil water content at 20 and 80 cm below the ground (SWC20, SWC80), and net radiation (Rn) to nocturnal evapotranspiration (ETN) based on the boosted regression tree (BRT) method.
Hydrology 12 00188 g007
Table 1. Linear regression parameters for nocturnal evapotranspiration (ETN) with environmental variables (air temperature (Ta), relative humidity (RH), vapor pressure deficit (VPD), wind speed (WS), difference between surface temperature and air temperature (Ts-Ta), soil water content at 20, 40, and 80 cm below the ground (SWC20, SWC40, SWC80), net radiation (Rn), and green chromatic coordinate (GCC)) at the monthly scale for growing seasons in 2020–2024.
Relationship Between ETN/ET and Environmental VariablesSlopeInterceptR2p-Value
ETN/ET–Ta−0.0120.350.77<0.001
ETN/ET–RH−0.0010.220.04>0.05
ETN/ET–VPD−0.0110.280.27<0.01
ETN/ET–WS−0.020.210.02>0.05
ETN/ET–(Ts-Ta)−0.0130.130.03>0.05
ETN/ET–SWC200.2250.100.06>0.05
ETN/ET–SWC400.1850.090.02>0.05
ETN/ET–SWC80−0.1010.170.01>0.05
ETN/ET–Rn0.0010.180.01>0.05
ETN/ET–GCC−7.512.730.31<0.01
Disclaimer/Publisher’s Note: The statements, opinions and data contained in all publications are solely those of the individual author(s) and contributor(s) and not of MDPI and/or the editor(s). MDPI and/or the editor(s) disclaim responsibility for any injury to people or property resulting from any ideas, methods, instructions or products referred to in the content.

