Next Issue
Volume 18, January-1
Previous Issue
Volume 17, December-1
 
 
remotesensing-logo

Journal Browser

Journal Browser

Remote Sens., Volume 17, Issue 24 (December-2 2025) – 138 articles

Cover Story (view full-size image): 
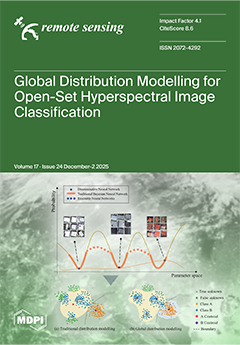
Recently, open-set hyperspectral image (HSI) classification has emerged as an important research focus. However, existing methods often overlook intra-class multimodal structures, reducing their ability to distinguish known and unknown classes. To address this, we developed a novel global distribution-aware network (GDAN) combining generative models and Monte Carlo theory. First, we enhanced a GAN model to capture long-range dependencies across hyperspectral bands. Second, an interpretable open-set HSI model integrating GAN with Markov Chain Monte Carlo (MCMC) is developed to model global distribution and estimate predictive uncertainty. By sampling from the posterior distribution, we obtained accurate ground object information and predictive uncertainty, achieving precise open-set HSI classification. View this paper
  • Issues are regarded as officially published after their release is announced to the table of contents alert mailing list.
  • You may sign up for e-mail alerts to receive table of contents of newly released issues.
  • PDF is the official format for papers published in both, html and pdf forms. To view the papers in pdf format, click on the "PDF Full-text" link, and use the free Adobe Reader to open them.
Order results
Result details
Section
Select all
Export citation of selected articles as:
28 pages, 4151 KB  
Article
FANet: Frequency-Aware Attention-Based Tiny-Object Detection in Remote Sensing Images
by Zixiao Wen, Peifeng Li, Yuhan Liu, Jingming Chen, Xiantai Xiang, Yuan Li, Huixian Wang, Yongchao Zhao and Guangyao Zhou
Remote Sens. 2025, 17(24), 4066; https://doi.org/10.3390/rs17244066 - 18 Dec 2025
Cited by 1 | Viewed by 958
Abstract
In recent years, deep learning-based remote sensing object detection has achieved remarkable progress, yet the detection of tiny objects remains a significant challenge. Tiny objects in remote sensing images typically occupy only a few pixels, resulting in low contrast, poor resolution, and high [...] Read more.
In recent years, deep learning-based remote sensing object detection has achieved remarkable progress, yet the detection of tiny objects remains a significant challenge. Tiny objects in remote sensing images typically occupy only a few pixels, resulting in low contrast, poor resolution, and high sensitivity to localization errors. Their diverse scales and appearances, combined with complex backgrounds and severe class imbalance, further complicate the detection tasks. Conventional spatial feature extraction methods often struggle to capture the discriminative characteristics of tiny objects, especially in the presence of noise and occlusion. To address these challenges, we propose a frequency-aware attention-based tiny-object detection network with two plug-and-play modules that leverage frequency-domain information to enhance the targets. Specifically, we introduce a Multi-Scale Frequency Feature Enhancement Module (MSFFEM) to adaptively highlight the contour and texture details of tiny objects while suppressing background noise. Additionally, a Channel Attention-based RoI Enhancement Module (CAREM) is proposed to selectively emphasize high-frequency responses within RoI features, further improving object localization and classification. Furthermore, to mitigate sample imbalance, we employ multi-directional flip sample augmentation and redundancy filtering strategies, which significantly boost detection performance for few-shot categories. Extensive experiments on public object detection datasets, i.e., AI-TOD, VisDrone2019, and DOTA-v1.5, demonstrate that the proposed FANet consistently improves detection performance for tiny objects, outperforming existing methods and providing new insights into the integration of frequency-domain analysis and attention mechanisms for robust tiny-object detection in remote sensing applications. Full article
(This article belongs to the Special Issue Deep Learning-Based Small-Target Detection in Remote Sensing)
Show Figures

Figure 1

46 pages, 17580 KB  
Article
Joint Hyperspectral Images and LiDAR Data Classification Combined with Quantum-Inspired Entangled Mamba
by Davaajargal Myagmarsuren, Aili Wang, Haoran Lv, Haibin Wu, Gabor Molnar and Liang Yu
Remote Sens. 2025, 17(24), 4065; https://doi.org/10.3390/rs17244065 - 18 Dec 2025
Viewed by 610
Abstract
The multimodal fusion of hyperspectral images (HSI) and LiDAR data for land cover classification encounters difficulties in modeling heterogeneous data characteristics and cross-modal dependencies, leading to the loss of complementary information due to concatenation, the inadequacy of fixed fusion weights to adapt to [...] Read more.
The multimodal fusion of hyperspectral images (HSI) and LiDAR data for land cover classification encounters difficulties in modeling heterogeneous data characteristics and cross-modal dependencies, leading to the loss of complementary information due to concatenation, the inadequacy of fixed fusion weights to adapt to spatially varying reliability, and the assumptions of linear separability for nonlinearly coupled patterns. We propose QIE-Mamba, integrating selective state-space models with quantum-inspired processing to enhance multimodal representation learning. The framework employs ConvNeXt encoders for hierarchical feature extraction, quantum superposition layers for complex-valued multimodal encoding with learned amplitude–phase relationships, unitary entanglement networks via skew-symmetric matrix parameterization (validated through Cayley transform and matrix exponential methods), quantum-enhanced Mamba blocks with adaptive decoherence, and confidence-weighted measurement for classification. Systematic three-phase sequential validation on Houston2013, Muufl, and Augsburg datasets achieves overall accuracies of 99.62%, 96.31%, and 96.30%. Theoretical validation confirms 35.87% mutual information improvement over classical fusion (6.9966 vs. 5.1493 bits), with ablation studies demonstrating quantum superposition contributes 82% of total performance gains. Phase information accounts for 99.6% of quantum state entropy, while gradient convergence analysis confirms training stability (zero mean/std gradient norms). The optimization framework reduces hyperparameter search complexity by 99.6% while maintaining state-of-the-art performance. These results establish quantum-inspired state-space models as effective architectures for multimodal remote sensing fusion, providing reproducible methodology for hyperspectral–LiDAR classification with linear computational complexity. Full article
(This article belongs to the Section AI Remote Sensing)
Show Figures

Graphical abstract

26 pages, 17766 KB  
Article
Impact of Speed and Differential Correction Base Type on Mobile Mapping System Accuracy
by Luis Iglesias, Serafín López-Cuervo, Roberto Rodríguez-Solano and Maria Castro
Remote Sens. 2025, 17(24), 4064; https://doi.org/10.3390/rs17244064 - 18 Dec 2025
Viewed by 401
Abstract
Mobile Mapping Systems (MMSs) have emerged as indispensable instruments for producing high-precision road maps in recent years. Despite incorporating modern devices, their efficacy may be influenced by operational variables such as vehicle speed or the type of GNSS (Global Navigation Satellite System) differential [...] Read more.
Mobile Mapping Systems (MMSs) have emerged as indispensable instruments for producing high-precision road maps in recent years. Despite incorporating modern devices, their efficacy may be influenced by operational variables such as vehicle speed or the type of GNSS (Global Navigation Satellite System) differential correction employed. This study assesses the impact of varying vehicle speeds and differential correction settings on the accuracy of point grids acquired with an MMS on a two-lane rural road. The experiment was performed across a 7 km distance, incorporating two speeds (40 and 60 km/h) and two travel directions. Three correction methodologies were examined: a proximate local base (MBS), a network station solution of the National Geographic Institute (NET), and virtual reference stations (VRSs). The methodology encompassed normality analysis, descriptive statistics, mean comparisons, one- and two-factor analysis of variance (ANOVA), and the computation of the root mean square error (RMSE) as a measure of accuracy. The findings indicate that horizontal discrepancies remain steady and unaffected by the correction technique; however, notable changes are seen in the vertical component, with the NET option proving to be the most effective. The acquisition rate is the primary determinant, exacerbating errors at 60 km/h. In conclusion, the dependability of MMS surveys is contingent upon the correction approach and operational conditions, and it is advisable to sustain moderate speeds to guarantee precise three-dimensional models. Full article
(This article belongs to the Special Issue Advancements in LiDAR Technology and Applications in Remote Sensing)
Show Figures

Graphical abstract

19 pages, 23230 KB  
Article
A Combined Algorithm Approach for Dealiasing Doppler Radar Velocities
by Ioannis Samos, Helena Flocas and Petroula Louka
Remote Sens. 2025, 17(24), 4063; https://doi.org/10.3390/rs17244063 - 18 Dec 2025
Cited by 1 | Viewed by 515
Abstract
Doppler weather radars play a pivotal role in meteorology, providing critical data for monitoring severe weather phenomena, such as thunderstorms. However, Doppler velocity measurements are subjected to aliasing errors when the true velocity exceeds the radar’s maximum detection velocity, compromising the accuracy of [...] Read more.
Doppler weather radars play a pivotal role in meteorology, providing critical data for monitoring severe weather phenomena, such as thunderstorms. However, Doppler velocity measurements are subjected to aliasing errors when the true velocity exceeds the radar’s maximum detection velocity, compromising the accuracy of velocity data. Effective dealiasing techniques are essential to correct these errors and improve data, leading to reliable data assimilation and therefore improved numerical weather prediction (NWP) as well as nowcasting applications. In this study, an attempt is made to present a comparative study of four dealiasing algorithms—convolution-, expansion-, amplitude correction-, and sine-based algorithms—to assess their effectiveness in processing Doppler radar velocity data. The study aims to evaluate these algorithms based on their ability to correct aliasing errors, their computational efficiency, and their practical applicability in real-world meteorological scenarios. Through an experimental evaluation, the performance of each algorithm is analyzed. Results indicate varying degrees of effectiveness among the algorithms, highlighting their respective strengths and limitations in dealing with the velocity aliasing of radar data. It was found that the Amplitude Correction and Convolution algorithms outperformed the others in correcting aliasing. A combined multi-algorithm approach achieved the highest overall accuracy when compared to manually corrected reference data and other algorithms. This research contributes to advancing the understanding of radar data processing techniques and provides insights into optimizing dealiasing strategies for enhanced meteorological forecasting and nowcasting, as well as severe weather prediction. Full article
(This article belongs to the Section Atmospheric Remote Sensing)
Show Figures

Figure 1

26 pages, 7188 KB  
Article
Land Suitability Assessment and Gap Analysis for Sustainable Taro (Colocasia esculenta (L.) Schott) Production in Rwanda Using Remote Sensing Data and a Fuzzy AHP Model
by Jean Marie Vianney Nsigayehe, Xingguo Mo and Suxia Liu
Remote Sens. 2025, 17(24), 4062; https://doi.org/10.3390/rs17244062 - 18 Dec 2025
Viewed by 596
Abstract
Taro (Colocasia esculenta (L.) Schott) is a nutritionally important and climate-resilient crop with high potential for enhancing food security. Despite its significance, taro remains underutilized and excluded from major agricultural policies in Rwanda, resulting in low national yields. This gap hinders evidence-based [...] Read more.
Taro (Colocasia esculenta (L.) Schott) is a nutritionally important and climate-resilient crop with high potential for enhancing food security. Despite its significance, taro remains underutilized and excluded from major agricultural policies in Rwanda, resulting in low national yields. This gap hinders evidence-based planning and limits the crop contribution to resilience amidst population growth and climate change. By taking Rwanda as an example, a worldwide top 10 taro-producing country but still facing food insecurity issues, this study conducted a nationwide land suitability assessment to identify optimal areas for taro cultivation and quantify the production gap. The Fuzzy Analytic Hierarchy Process (AHP) model was integrated with GIS, where climatic, topographic, and a remotely sensed soil dataset were weighted and combined to generate a composite suitability index. Results revealed that 22.8% of Rwanda’s land is highly suitable (S1) and 55.7% is moderately suitable (S2) for taro cultivation. Within agricultural land, 30.2% is highly suitable, of which a significant portion (28.7%) remains largely underutilized, especially in the Eastern province. The national production gap was estimated at 32.4%, with over half of the districts exceeding 30%. The study highlights the importance of aligning taro cultivation with biophysical suitability and integrating spatial planning into national agricultural policies. The developed suitability map provides a critical decision-support tool for policymakers, agricultural planners, and extension services. By promoting sustainable taro production, improving farmer livelihoods and food security in Rwanda, it provides a global model for sustainable development for developing countries and advances research on orphan crops such as taro. The methodology offers a replicable framework for evaluating underutilized crops globally, contributing to sustainable agricultural diversification and food security. Full article
Show Figures

Figure 1

29 pages, 31164 KB  
Article
Geometric Condition Assessment of Traffic Signs Leveraging Sequential Video-Log Images and Point-Cloud Data
by Yiming Jiang, Yuchun Huang, Shuang Li, Jun Liu and He Yang
Remote Sens. 2025, 17(24), 4061; https://doi.org/10.3390/rs17244061 - 18 Dec 2025
Viewed by 413
Abstract
Traffic signs exposed to long-term outdoor conditions frequently exhibit deformation, inclination, or other forms of physical damage, highlighting the need for timely and reliable anomaly assessment to support road safety management. While point-cloud data provide accurate three-dimensional geometric information, their sparse distribution and [...] Read more.
Traffic signs exposed to long-term outdoor conditions frequently exhibit deformation, inclination, or other forms of physical damage, highlighting the need for timely and reliable anomaly assessment to support road safety management. While point-cloud data provide accurate three-dimensional geometric information, their sparse distribution and lack of appearance cues make traffic sign extraction challenging in complex environments. High-resolution sequential video-log images captured from multiple viewpoints offer complementary advantages by providing rich color and texture information. In this study, we propose an integrated traffic sign detection and assessment framework that combines video-log images and mobile-mapping point clouds to enhance both accuracy and robustness. A dedicated YOLO-SIGN network is developed to perform precise detection and multi-view association of traffic signs across sequential images. Guided by these detections, a frustum-based point-cloud extraction strategy with seed-point density growing is introduced to efficiently isolate traffic sign panels and supporting poles. The extracted structures are then used for geometric parameterization and damage assessment, including inclination, deformation, and rotation. Experiments on 35 simulated scenes and nine real-world road scenarios demonstrate that the proposed method can reliably extract and evaluate traffic sign conditions in diverse environments. Furthermore, the YOLO-SIGN network achieves a localization precision of 91.16% and a classification mAP of 84.64%, outperforming YOLOv10s by 1.7% and 8.7%, respectively, while maintaining a reduced number of parameters. These results confirm the effectiveness and practical value of the proposed framework for large-scale traffic sign monitoring. Full article
Show Figures

Graphical abstract

26 pages, 23293 KB  
Article
A Deep Learning Approach to Lidar Signal Denoising and Atmospheric Feature Detection
by Joseph Gomes, Matthew J. McGill, Patrick A. Selmer and Shi Kuang
Remote Sens. 2025, 17(24), 4060; https://doi.org/10.3390/rs17244060 - 18 Dec 2025
Viewed by 622
Abstract
Laser-based remote sensing (lidar) is a proven technique for detecting atmospheric features such as clouds and aerosols as well as for determining their vertical distribution with high accuracy. Even simple elastic backscatter lidars can distinguish clouds from aerosols, and accurate knowledge of their [...] Read more.
Laser-based remote sensing (lidar) is a proven technique for detecting atmospheric features such as clouds and aerosols as well as for determining their vertical distribution with high accuracy. Even simple elastic backscatter lidars can distinguish clouds from aerosols, and accurate knowledge of their vertical location is essential for air quality assessment, hazard avoidance, and operational decision-making. However, daytime lidar measurements suffer from reduced signal-to-noise ratio (SNR) due to solar background contamination. Conventional processing approaches mitigate this by applying horizontal and vertical averaging, which improves SNR at the expense of spatial resolution and feature detectability. This work presents a deep learning-based framework that enhances lidar SNR at native resolution and performs fast layer detection and cloud–aerosol discrimination. We apply this approach to ICESat-2 532 nm photon-counting data, using artificially noised nighttime profiles to generate simulated daytime observations for training and evaluation. Relative to the simulated daytime data, our method improves peak SNR by more than a factor of three while preserving structural similarity with true nighttime profiles. After recalibration, the denoised photon counts yield an order-of-magnitude reduction in mean absolute percentage error in calibrated attenuated backscatter compared with the simulated daytime data, when validated against real nighttime measurements. We further apply the trained model to a full month of real daytime ICESat-2 observations (April 2023) and demonstrate effective layer detection and cloud–aerosol discrimination, maintaining high recall for both clouds and aerosols and showing qualitative improvement relative to the standard ATL09 data products. As an alternative to traditional averaging-based workflows, this deep learning approach offers accurate, near real-time data processing at native resolution. A key implication is the potential to enable smaller, lower-power spaceborne lidar systems that perform as well as larger instruments. Full article
(This article belongs to the Section Atmospheric Remote Sensing)
Show Figures

Figure 1

30 pages, 4698 KB  
Article
Global C-Factor Estimation: Inter-Model Comparison and SSP-RCP Scenario Projections to 2070
by Muqi Xiong
Remote Sens. 2025, 17(24), 4059; https://doi.org/10.3390/rs17244059 - 18 Dec 2025
Viewed by 397
Abstract
The cover-management factor (C-factor) plays a pivotal role in soil erosion control and is the most easily influenced by policymakers. Despite the availability of numerous C-factor estimation methods, systematic comparisons of their applicability and associated uncertainties remain limited, particularly for future projections under [...] Read more.
The cover-management factor (C-factor) plays a pivotal role in soil erosion control and is the most easily influenced by policymakers. Despite the availability of numerous C-factor estimation methods, systematic comparisons of their applicability and associated uncertainties remain limited, particularly for future projections under climate change scenarios. This study systematically evaluates multiple widely used C-factor estimation models and projects potential C-factor changes under future scenarios up to 2070, using 2015 as a baseline. Results reveal substantial spatial variability among models, with the land use/land cover-based model (CLu) showing the strongest correlation with the reference model (r = 0.960) and the lowest error (RMSE = 0.048). Using the CLu model, global average C-factor values are projected to increase across all Shared Socioeconomic Pathways–Representative Concentration Pathways (SSP-RCP) scenarios, rising from 0.077 to 0.079–0.082 by 2070. Statistically significant trends were observed in 28.0% (SSP1-RCP2.6) and 26.6% (SSP5-RCP8.5) of global land areas, identified as hotspot regions (HRs). In these HRs, mean C-factor values are expected to increase by 16.1% and 33.4%, respectively, relative to the 2015 baseline. Economic development analysis revealed distinct trajectories across income categories. Low-income countries (LICs, World Bank classification) exhibited a pronounced dependency on development pathways, with C-factor values decreasing by −50.3% under SSP1-RCP2.6 but increasing by +95.8% under SSP5-RCP8.5 compared to 2015. In contrast, lower-middle-income, upper-middle-income, and high-income countries exhibited consistent C-factor increases across all scenarios. These variations were closely linked to cropland dynamics, with cropland areas in LICs decreasing by 64.6% under SSP1-RCP2.6 but expanding under other scenarios and income categories between 2015 and 2070. These findings highlight the critical importance of sustainable land-use policies, particularly in LICs, which demonstrate the highest magnitude of both improvement and degradation under varying scenarios. This research provides a scientific foundation basis for optimizing soil conservation strategies and land-use planning under future climate and socioeconomic scenarios. Full article
(This article belongs to the Section Environmental Remote Sensing)
Show Figures

Graphical abstract

21 pages, 12673 KB  
Article
Validation of Downscaled SoilMERGE with NDVI and Storm-Event Analysis in Oklahoma and Kansas
by Kenneth Tobin, Aaron Sanchez, Alejandro X. Alaniz, Stephanie Hernandez, Adriana Perez, Deepak Ganta and Marvin Bennett
Remote Sens. 2025, 17(24), 4058; https://doi.org/10.3390/rs17244058 - 18 Dec 2025
Viewed by 358
Abstract
SoilMERGE (SMERGE) is a 0.125-degree root zone soil moisture (RZSM) product (0 to 40 cm depth) covering the contiguous United States. The study area included most of Oklahoma and Kansas, a region where SMERGE exhibited superior performance. The time frame examined was the [...] Read more.
SoilMERGE (SMERGE) is a 0.125-degree root zone soil moisture (RZSM) product (0 to 40 cm depth) covering the contiguous United States. The study area included most of Oklahoma and Kansas, a region where SMERGE exhibited superior performance. The time frame examined was the warm season from 2008 to 2019. In this study, evaluation of a prototype downscaled (500 m) version of SMERGE was made using (1) Ranked correlation (R2) benchmarking against Normalized Difference Vegetation Index (NDVI) datasets and (2) Ranked correlation (R2) analysis of antecedent RZSM with storm-event streamflow across a range of precipitation intensities (5 to >35 mm/day) at a watershed scale. In the NDVI benchmarking, all three downscaled products outperformed (0.52 to 0.59) default SMERGE (0.44). EXtreme Gradient Boosting (XGB) and Gradient Boost recorded a higher ranked correlation (0.59) than Random Forest (0.52). Within the study area, ranked correlation analysis of antecedent RZSM with storm-event United States Geological Survey streamflow was examined in five watersheds. For the most intense storm events (>35 mm), antecedent XGB downscaled SMERGE (0.64) outperformed antecedent streamflow (0.43) and all other versions of SMERGE (0.52 to 0.56) as a predictor of storm event response. The results of this study demonstrated broad-scale benefits of Machine Learning-assisted downscaling, providing proof of concept for the development of state-based SMERGE products across the US Great Plains. Full article
Show Figures

Graphical abstract

20 pages, 16950 KB  
Article
Using High-Resolution Satellite Imagery and Deep Learning to Map Artisanal Mining Spatial Extent in the Democratic Republic of the Congo
by Francesco Pasanisi, Robert N. Masolele and Johannes Reiche
Remote Sens. 2025, 17(24), 4057; https://doi.org/10.3390/rs17244057 - 18 Dec 2025
Viewed by 859
Abstract
Artisanal and Small-scale Mining (ASM) significantly impacts the Democratic Republic of Congo’s (DRC) socio-economic landscape and environmental integrity, yet its dynamic and informal nature makes monitoring challenging. This study addresses this challenge by implementing a novel deep learning approach to map ASM sites [...] Read more.
Artisanal and Small-scale Mining (ASM) significantly impacts the Democratic Republic of Congo’s (DRC) socio-economic landscape and environmental integrity, yet its dynamic and informal nature makes monitoring challenging. This study addresses this challenge by implementing a novel deep learning approach to map ASM sites across the DRC using satellite imagery. We tackled key obstacles including ground truth data scarcity, insufficient spatial resolution of conventional satellite sensors, and persistent cloud cover in the region. We developed a methodology to generate a pseudo-ground truth dataset by converting point-based ASM locations to segmented areas through a multi-stage process involving clustering, auxiliary dataset masking, and manual refinement. Four model configurations were evaluated: Planet-NICFI standalone, Sentinel-1 standalone, Early Fusion, and Late Fusion approaches. The Late Fusion model, which integrated high-resolution Planet-NICFI optical imagery (4.77 m resolution) with Sentinel-1 SAR data, achieved the highest performance with an average precision of 71%, recall of 75%, and F1-score of 73% for ASM detection. This superior performance demonstrated how SAR data’s textural features complemented optical data’s spectral information, particularly improving discrimination between ASM sites and water bodies—a common source of misclassification in optical-only approaches. We deployed the optimized model to map ASM extent in the Mwenga territory, achieving an overall accuracy of 88.4% when validated against high-resolution reference imagery. Despite these achievements, challenges persist in distinguishing ASM sites from built-up areas, suggesting avenues for future research through multi-class approaches. This study advances the domain of ASM mapping by offering methodologies that enhance remote sensing capabilities in ASM-impacted regions, providing valuable tools for monitoring, regulation, and environmental management. Full article
Show Figures

Figure 1

18 pages, 5743 KB  
Article
Skin Temperature of the North Sea from an Autonomous Surface Vehicle Compared to Remote Sensing Observation
by Samuel Mintah Ayim, Lisa Gassen, Mariana Ribas-Ribas and Oliver Wurl
Remote Sens. 2025, 17(24), 4056; https://doi.org/10.3390/rs17244056 - 18 Dec 2025
Viewed by 483
Abstract
Validating satellite-derived sea surface temperature (SST) requires resolving spatial and vertical mismatches between remotely sensed measurements and traditional in situ observations. This study evaluates the bias between infrared-based satellite SST and high-resolution in situ measurements collected in the North Sea using the autonomous [...] Read more.
Validating satellite-derived sea surface temperature (SST) requires resolving spatial and vertical mismatches between remotely sensed measurements and traditional in situ observations. This study evaluates the bias between infrared-based satellite SST and high-resolution in situ measurements collected in the North Sea using the autonomous surface vehicle (ASV) HALOBATES. The ASV enables the direct sampling of the ocean skin layer via a rotating glass disc system, alongside near-surface layer (NSL, 1 m depth) measurements using a flow-through system. Across 37 missions conducted between 2022 and 2023, we quantified biases in our approach and performed match-ups with a level-4 SST product for the North and Baltic Seas. Satellite SST showed strong correlations with in situ observations (r > 0.98), with Deming regression slopes approaching unity for all platforms. Despite this agreement, satellite SST exhibited a consistent cold bias. The mean differences were −0.44 ± 0.60 °C for the skin layer and −0.40 ± 0.52 °C for the NSL. The RMSE values were 0.75 °C for the skin layer and 0.66 °C for the NSL, indicating that satellite SST more closely reflects temperatures at 1 m than those at the skin layer. These findings highlight the importance of depth-resolved in situ measurements for improving remote SST validation. Full article
(This article belongs to the Section Ocean Remote Sensing)
Show Figures

Graphical abstract

22 pages, 10061 KB  
Article
Precipitable Water Vapor from PPP Estimation with Multi-Analysis-Center Real-Time Products
by Wei Li, Heng Gong, Bo Deng, Liangchun Hua, Fei Ye, Hongliang Lian and Lingzhi Cao
Remote Sens. 2025, 17(24), 4055; https://doi.org/10.3390/rs17244055 - 18 Dec 2025
Cited by 1 | Viewed by 486
Abstract
Precipitable water vapor (PWV) is an important component of atmospheric spatial parameters and plays a vital role in meteorological studies. In this study, PWV retrieval by real-time precise point positioning (PPP) technique is validated by using global navigation satellite system (GNSS) observations and [...] Read more.
Precipitable water vapor (PWV) is an important component of atmospheric spatial parameters and plays a vital role in meteorological studies. In this study, PWV retrieval by real-time precise point positioning (PPP) technique is validated by using global navigation satellite system (GNSS) observations and four real-time products from different analysis centers, which are Centre National d’Etudes Spatiales (CNES), Internation GNSS Service (IGS), Japan Aerospace Exploration Agency (JAXA), and Wuhan University (WHU). To comparatively analyze the performance of each scenario, the single-system (GPS/Galileo/BDS3), and multi-system (GPS + Galileo + BDS) PPP techniques are applied for zenith tropospheric delay (ZTD) and PWV retrieval. Then, the ZTD and PWV are evaluated by comparison with the IGS final ZTD product, the European Centre for Medium-Range Weather Forecasts (ECMWF) Reanalysis v5 (ERA5) data, and radiosondes observations provided by the University of Wyoming. Experimental results demonstrate that the root mean squares error (RMS) of ZTD differences from multi-system solutions are below 11 mm with respect to the four-product series and the RMS of PWV differences are below 3.5 mm. As for single-system solution, the IGS real-time products lead to the worst accuracy compared with the other products. Besides the scenario of BDS3 observations with IGS real-time products, the RMS of ZTD differences from the GPS-only and Galileo-only solutions are all less than 15 mm compared to the four-product series, as well as the RMS of PWV differences is under 5 mm, which meets the accuracy requirement for GNSS atmosphere sounding. Full article
(This article belongs to the Special Issue BDS/GNSS for Earth Observation (Third Edition))
Show Figures

Graphical abstract

24 pages, 2210 KB  
Article
Deep Transfer Learning for UAV-Based Cross-Crop Yield Prediction in Root Crops
by Suraj A. Yadav, Yanbo Huang, Kenny Q. Zhu, Rayyan Haque, Wyatt Young, Lorin Harvey, Mark Hall, Xin Zhang, Nuwan K. Wijewardane, Ruijun Qin, Max Feldman, Haibo Yao and John P. Brooks
Remote Sens. 2025, 17(24), 4054; https://doi.org/10.3390/rs17244054 - 17 Dec 2025
Viewed by 724
Abstract
Limited annotated data often constrain accurate yield prediction in underrepresented crops. To address this challenge, we developed a cross-crop deep transfer learning (TL) framework that leverages potato (Solanum tuberosum L.) as the source domain to predict sweet potato (Ipomoea batatas L.) [...] Read more.
Limited annotated data often constrain accurate yield prediction in underrepresented crops. To address this challenge, we developed a cross-crop deep transfer learning (TL) framework that leverages potato (Solanum tuberosum L.) as the source domain to predict sweet potato (Ipomoea batatas L.) yield using multi-temporal uncrewed aerial vehicle (UAV)-based multispectral imagery. A hybrid convolutional–recurrent neural network (CNN–RNN–Attention) architecture was implemented with a robust parameter-based transfer strategy to ensure temporal alignment and feature-space consistency across crops. Cross-crop feature migration analysis showed that predictors capturing canopy vigor, structure, and soil–vegetation contrast exhibited the highest distributional similarity between potato and sweet potato. In comparison, pigment-sensitive and agronomic predictors were less transferable. These robustness patterns were reflected in model performance, as all architectures showed substantial improvement when moving from the minimal 3 predictor subset to the 5–7 predictor subsets, where the most transferable indices were introduced. The hybrid CNN–RNN–Attention model achieved peak accuracy (R20.64 and RMSE ≈ 18%) using time-series data up to the tuberization stage with only 7 predictors. In contrast, convolutional neural network (CNN), bidirectional gated recurrent unit (BiGRU), and bidirectional long short-term memory (BiLSTM) baseline models required 11–13 predictors to achieve comparable performance and often showed reduced or unstable accuracy at higher dimensionality due to redundancy and domain-shift amplification. Two-way ANOVA further revealed that cover crop type significantly influenced yield, whereas nitrogen rate and the interaction term were not significant. Overall, this study demonstrates that combining robustness-aware feature design with hybrid deep TL model enables accurate, data-efficient, and physiologically interpretable yield prediction in sweet potato, offering a scalable pathway for applying TL in other underrepresented root and tuber crops. Full article
(This article belongs to the Special Issue Application of UAV Images in Precision Agriculture)
Show Figures

Graphical abstract

20 pages, 4389 KB  
Article
A New Convective Initiation Definition and Its Characteristics in Central and Eastern China Based on Fengyun-4A Satellite Cloud Imagery
by Lili Peng, Yunying Li, Chengzhi Ye and Xiaofeng Ou
Remote Sens. 2025, 17(24), 4053; https://doi.org/10.3390/rs17244053 - 17 Dec 2025
Viewed by 459
Abstract
With the upgrading of geostationary meteorological satellites, their capabilities in Convective Initiation (CI) identification have been enhanced. To improve the applicability of the ARGI-based CI algorithm in central and eastern China, this study uses Fengyun-4A data, integrates radar and precipitation data to construct [...] Read more.
With the upgrading of geostationary meteorological satellites, their capabilities in Convective Initiation (CI) identification have been enhanced. To improve the applicability of the ARGI-based CI algorithm in central and eastern China, this study uses Fengyun-4A data, integrates radar and precipitation data to construct a True_CI dataset, and defines False_CI events (satellite-identified events without radar or precipitation signals) for comparative analysis. The results show that True_CI events tend to have longer durations, larger cloud cluster areas, and lower central cloud-top brightness temperature (BT) during development. They exhibit distinct features such as reduced differences between water vapor and infrared channels, increased cloud optical thickness, and ice-phase transformation 30 min before CI occurrence—features absent in most False_CI events. Based on these comparative findings, a new satellite-based CI definition is proposed with a set of reference thresholds, which should be adjusted for different latitudes and seasons. The evaluation of the Defined_CI events (defined using the CI definition) via True_CI events indicates that the CI definition on satellite cloud imagery proposed in this study is reliable, and suggests that further research on the pre-CI environmental conditions of weak convection is needed. Supported by hyperspectral data or numerical model products, such research will help clarify which cloud clusters are prone to developing into convective weather. Full article
Show Figures

Figure 1

23 pages, 4955 KB  
Article
Earth Observation and Geospatial Analysis for Fire Risk Assessment in Wildland–Urban Interfaces: The Case of the Highly Dense Urban Area of Attica, Greece
by Antonia Oikonomou, Marilou Avramidou and Emmanouil Psomiadis
Remote Sens. 2025, 17(24), 4052; https://doi.org/10.3390/rs17244052 - 17 Dec 2025
Viewed by 913
Abstract
Wildfires increasingly threaten Mediterranean landscapes, particularly in regions like Attica, Greece, where urban sprawl, agricultural abandonment, and climatic conditions heighten the risk at the Wildland–Urban Interface (WUI). The Mediterranean basin, recognized as one of the global wildfire “hotspots”, has witnessed a steady increase [...] Read more.
Wildfires increasingly threaten Mediterranean landscapes, particularly in regions like Attica, Greece, where urban sprawl, agricultural abandonment, and climatic conditions heighten the risk at the Wildland–Urban Interface (WUI). The Mediterranean basin, recognized as one of the global wildfire “hotspots”, has witnessed a steady increase in both fire severity, frequency, and burned area during the last four decades, a trend amplified by urban sprawl and agricultural land abandonment. This study represents the first integrated, region-wide mapping of the WUI and associated wildfire risk in Attica, the most densely urbanized area in Greece and one of the most fire-exposed metropolitan regions in Southern Europe, utilizing advanced techniques such as Earth Observation and GIS analysis. For this purpose, various geospatial datasets were coupled, including Copernicus High Resolution Layers, multi-decadal Landsat fire history archive, UCR-STAR building footprints, and CORINE Land Cover, among others. The research delineated WUI zones into 40 interface and intermix categories, revealing that WUI encompasses 26.29% of Attica, predominantly in shrub-dominated areas. An analysis of fire frequency history from 1983 to 2023 indicated that approximately 102,366 hectares have been affected by wildfires. Risk assessments indicate that moderate hazard zones are most prevalent, covering 36.85% of the region, while approximately 25% of Attica is classified as moderate, high, or very high susceptibility zones. The integrated risk map indicates that 37.74% of Attica is situated in high- and very high-risk zones, principally concentrated in peri-urban areas. These findings underscore Attica’s designation as one of the most fire-prone metropolitan regions in Southern Europe and offer a viable methodology for enhancing land-use planning, fuel management, and civil protection efforts. Full article
(This article belongs to the Special Issue Remote Sensing in Natural Hazard Exploration and Impact Assessment)
Show Figures

Figure 1

17 pages, 3111 KB  
Article
Spatiotemporal Variations in Vegetation Phenology in the Qinling Mountains and Their Responses to Climate Variability
by Huan Li, Jiao Ao, Jiahua Liang, Mingjuan Zhang, Zhongke Feng and Zhichao Wang
Remote Sens. 2025, 17(24), 4051; https://doi.org/10.3390/rs17244051 - 17 Dec 2025
Viewed by 464
Abstract
Understanding vegetation phenology responses to climate change is essential for predicting ecosystem dynamics, especially in mountainous transition zones, such as the Qinling Mountains, where climatic and ecological gradients are pronounced. To quantify these complex interactions, we combined high spatiotemporal resolution remote sensing data [...] Read more.
Understanding vegetation phenology responses to climate change is essential for predicting ecosystem dynamics, especially in mountainous transition zones, such as the Qinling Mountains, where climatic and ecological gradients are pronounced. To quantify these complex interactions, we combined high spatiotemporal resolution remote sensing data (30 m, 8-day) with CMFD climate datasets from 2010 to 2020. We leveraged a rigorous analysis of covariance (ANCOVA) framework to simultaneously test the spatial heterogeneity of phenological baselines and the temporal convergence of trends across vegetation types. Results revealed that the spatial pattern of the start of the growing season (SOS) exhibited highly significant heterogeneity (p < 0.001), primarily governed by vegetation composition and altitudinal gradients—a phenomenon we define as a spatial baseline constraint effect. In contrast, the interannual SOS trends (slopes) showed no significant differences among vegetation types (p = 0.685), indicating a temporal convergence effect. This regional synchrony, characterized by a consistent shift toward earlier SOS of approximately −0.8 to −0.9 days yr−1 at low and mid-elevations, was largely driven by rising spring temperatures (R2 ≈ 0.20). Crucially, the end of the growing season (EOS) displayed weak climatic sensitivity, revealing an asymmetric phenological response to temperature changes. Our findings demonstrate that vegetation phenology in the Qinling Mountains is jointly controlled by spatial baseline constraint and temporal trend convergence. This dual-mechanism framework provides new insights into the highly structured stability and resilience of mountainous ecosystems under regional warming. Full article
Show Figures

Figure 1

25 pages, 25629 KB  
Article
DSEPGAN: A Dual-Stream Enhanced Pyramid Based on Generative Adversarial Network for Spatiotemporal Image Fusion
by Dandan Zhou, Lina Xu, Ke Wu, Huize Liu and Mengting Jiang
Remote Sens. 2025, 17(24), 4050; https://doi.org/10.3390/rs17244050 - 17 Dec 2025
Viewed by 351
Abstract
Many deep learning-based spatiotemporal fusion (STF) methods have been proven to achieve high accuracy and robustness. Due to the variable shapes and sizes of objects in remote sensing images, pyramid networks are generally introduced to extract multi-scale features. However, the down-sampling operation in [...] Read more.
Many deep learning-based spatiotemporal fusion (STF) methods have been proven to achieve high accuracy and robustness. Due to the variable shapes and sizes of objects in remote sensing images, pyramid networks are generally introduced to extract multi-scale features. However, the down-sampling operation in the pyramid structure may lead to the loss of image detail information, affecting the model’s ability to reconstruct fine-grained targets. To address this issue, we propose a novel Dual-Stream Enhanced Pyramid based on Generative Adversarial Network (DSEPGAN) for the spatiotemporal fusion of remote sensing images. The network adopts a dual-stream architecture to separately process coarse and fine images, tailoring feature extraction to their respective characteristics: coarse images provide temporal dynamics, while fine images contain rich spatial details. A reversible feature transformation is embedded in the pyramid feature extraction stage to preserve high-frequency information, and a fusion module employing large-kernel and depthwise separable convolutions captures long-range dependencies across inputs. To further enhance realism and detail fidelity, adversarial training encourages the network to generate sharper and more visually convincing fusion results. The proposed DSEPGAN is compared with widely used and state-of-the-art STF models in three publicly available datasets. The results illustrate that DSEPGAN achieves superior performance across various evaluation metrics, highlighting its notable advantages for predicting seasonal variations in highly heterogeneous regions and abrupt changes in land use. Full article
Show Figures

Figure 1

23 pages, 11089 KB  
Article
Quantifying Broad-Leaved Korean Pine Forest Structure Using Terrestrial Laser Scanning (TLS), Changbai Mountain, China
by Jingcheng Luo, Qingda Chen, Zhichao Wu, Tian Gao, Li Zhou, Jiaojiao Deng, Yansong Zhang and Dapao Yu
Remote Sens. 2025, 17(24), 4049; https://doi.org/10.3390/rs17244049 - 17 Dec 2025
Viewed by 379
Abstract
Accurate assessment of stand structure is fundamental for elucidating the relationship between forest structure and ecological function, which is vital for enhancing forest quality and ecosystem services. This study, conducted in a 1 hm2 plot of old-growth broadleaved-Korean pine forest in Changbai [...] Read more.
Accurate assessment of stand structure is fundamental for elucidating the relationship between forest structure and ecological function, which is vital for enhancing forest quality and ecosystem services. This study, conducted in a 1 hm2 plot of old-growth broadleaved-Korean pine forest in Changbai Mountain, integrated Terrestrial Laser Scanning (TLS), precise geographic coordinates, Quantitative Structure Models (QSM), and wood density data. This methodology enabled a precise, non-destructive quantification of key structural parameters—DBH, tree height, crown overlap, stand volume, and carbon storage—and the development of species-specific allometric equations. The results demonstrated that TLS-derived DBH estimates were 99% accurate, consistent across diameter classes. The overall crown overlap rate (DBH ≥ 5 cm) was 59.1%, decreasing markedly to 26.7% and 19.2% at DBH thresholds of 20 cm and 30 cm, respectively. Allometric models based on DBH showed higher predictive accuracy for stem biomass than for branches, and for broadleaved species over conifers. Notably, conventional models overestimated stem biomass while underestimating branch biomass by 1.34–92.85%, highlighting biases from limited large-tree samples. The integrated TLS-QSM approach provides a robust alternative for accurate biomass estimation, establishing a critical foundation for large-scale, non-destructive allometric modeling. Its broader applicability, however, necessitates further validation across diverse forest ecosystems. Full article
Show Figures

Figure 1

23 pages, 15283 KB  
Article
Quality Assessment of Despeckling Filters Based on the Analysis of Ratio Images
by Rubén Darío Vásquez-Salazar, William S. Puche, Alejandro C. Frery and Luis Gómez
Remote Sens. 2025, 17(24), 4048; https://doi.org/10.3390/rs17244048 - 17 Dec 2025
Viewed by 367
Abstract
We present a quantitative and qualitative evaluation of despeckling filters based on a set of Haralick-derived features and the Jensen–Shannon Divergence obtained from ratio images. To that aim, we propose a normalized composite index, called the Texture-Divergence Measurement (TDM), [...] Read more.
We present a quantitative and qualitative evaluation of despeckling filters based on a set of Haralick-derived features and the Jensen–Shannon Divergence obtained from ratio images. To that aim, we propose a normalized composite index, called the Texture-Divergence Measurement (TDM), that describes the statistical and structural behavior of the filtered images. Complementary qualitative analysis using Image Horizontal Visibility Graphs (IHVGs) confirms the results of the proposed metric. The combination of the proposed TDM metric and IHVG visualization provides a robust framework for assessing despeckling performance from both statistical and structural perspectives. Full article
Show Figures

Figure 1

26 pages, 11926 KB  
Article
STC-DeepLAINet: A Transformer-GCN Hybrid Deep Learning Network for Large-Scale LAI Inversion by Integrating Spatio-Temporal Correlations
by Huijing Wu, Ting Tian, Qingling Geng and Hongwei Li
Remote Sens. 2025, 17(24), 4047; https://doi.org/10.3390/rs17244047 - 17 Dec 2025
Viewed by 532
Abstract
Leaf area index (LAI) is a pivotal biophysical parameter linking vegetation physiological processes and macro-ecological functions. Accurate large-scale LAI estimation is indispensable for agricultural management, climate change research, and ecosystem modeling. However, existing methods fail to efficiently extract integrated spatial-spectral-temporal features and lack [...] Read more.
Leaf area index (LAI) is a pivotal biophysical parameter linking vegetation physiological processes and macro-ecological functions. Accurate large-scale LAI estimation is indispensable for agricultural management, climate change research, and ecosystem modeling. However, existing methods fail to efficiently extract integrated spatial-spectral-temporal features and lack targeted modeling of spatio-temporal dependencies, compromising the accuracy of LAI products. To address this gap, we propose STC-DeepLAINet, a Transformer-GCN hybrid deep learning architecture integrating spatio-temporal correlations via the following three synergistic modules: (1) a 3D convolutional neural networks (CNNs)-based spectral-spatial embedding module capturing intrinsic correlations between multi-spectral bands and local spatial features; (2) a spatio-temporal correlation-aware module that models temporal dynamics (by “time periods”) and spatial heterogeneity (by “spatial slices”) simultaneously; (3) a spatio-temporal pattern memory attention module that retrieves historically similar spatio-temporal patterns via an attention-based mechanism to improve inversion accuracy. Experimental results demonstrate that STC-DeepLAINet outperforms eight state-of-the-art methods (including traditional machine learning and deep learning networks) in a 500 m resolution LAI inversion task over China. Validated against ground-based measurements, it achieves a coefficient of determination (R2) of 0.827 and a root mean square error (RMSE) of 0.718, outperforming the GLASS LAI product. Furthermore, STC-DeepLAINet effectively captures LAI variability across typical vegetation types (e.g., forests and croplands). This work establishes an operational solution for generating large-scale high-precision LAI products, which can provide reliable data support for agricultural yield estimation and ecosystem carbon cycle simulation, while offering a new methodological reference for spatio-temporal correlation modeling in remote sensing inversion. Full article
Show Figures

Figure 1

21 pages, 3816 KB  
Article
Discrepant Pathway in Regulating ET Under Change in Community Composition of Alpine Grassland in the Source Region of the Yellow River
by Shuntian Guan, Longyue Zhang, Yunqi Xiong, Congjia Li, Zhenzhen Zheng, Shibo Huang, Ronghai Hu, Xiaoming Kang, Jianqin Du, Kai Xue, Xiaoyong Cui, Yanfen Wang and Yanbin Hao
Remote Sens. 2025, 17(24), 4046; https://doi.org/10.3390/rs17244046 - 17 Dec 2025
Viewed by 355
Abstract
Understanding evapotranspiration (ET) dynamics under community composition transitions in grasslands is crucial for interpreting alpine ecosystem responses to climate change. We investigated variations in ET and its components during the growing season across five alpine grassland transition types in the Source Region of [...] Read more.
Understanding evapotranspiration (ET) dynamics under community composition transitions in grasslands is crucial for interpreting alpine ecosystem responses to climate change. We investigated variations in ET and its components during the growing season across five alpine grassland transition types in the Source Region of the Yellow River (SRYR) from 1986 to 2018, integrating climatic, vegetation, and soil factors. Under warming and wetting conditions, ET increased significantly by 1.17 mm yr−1, accounting for 79.39% of annual precipitation, while soil moisture declined slightly. A pronounced temperature–precipitation decoupling emerged between alpine meadow-origin (AM-origin) and alpine steppe-origin (AS-origin) transitions, indicating differential hydrological responses driven by community composition. Vegetation growth increased across all transitions, yet its regulation of ET components varied by transition type. Transpiration dominated ET increases, contributing over 80% in AM-origin and 100% in AS-origin transitions. Soil evaporation exhibited contrasting trends: decreasing in AS-origin transitions due to enhanced soil insulation from vegetation growth, but increasing in AM-origin transitions, thereby reducing soil moisture. Interannual ET growth rates and seasonal fluctuations were greater in AM-origin than in AS-origin transitions. A critical turning point in ET trends, caused by changes in precipitation, revealed the divergent hydrological trajectories among the transitions. In AM-origin transitions, temperature primarily drove ET increases, causing soil drying (strongest in AM to TS), whereas in AS-origin transitions, precipitation dominated, resulting in soil wetting (more pronounced in AS to AM). These findings demonstrate that the directionality of compositional transitions governs hydrological responses more strongly than absolute vegetation states. Full article
(This article belongs to the Section Ecological Remote Sensing)
Show Figures

Figure 1

21 pages, 4815 KB  
Article
Global Low Clouds Evolution and Their Meteorological Drivers Across Multiple Timescales
by Yize Li, Jinming Ge, Yue Hu, Ziyang Xu, Jiajing Du and Qingyu Mu
Remote Sens. 2025, 17(24), 4045; https://doi.org/10.3390/rs17244045 - 17 Dec 2025
Viewed by 701
Abstract
Low clouds significantly influence Earth’s radiation budget, but their climate feedback remains highly uncertain due to complex interactions with meteorological conditions across spatial and temporal scales. The cloud controlling factor framework is widely used to link meteorological variables with cloud properties. However, most [...] Read more.
Low clouds significantly influence Earth’s radiation budget, but their climate feedback remains highly uncertain due to complex interactions with meteorological conditions across spatial and temporal scales. The cloud controlling factor framework is widely used to link meteorological variables with cloud properties. However, most studies assume a static, linear relationship, potentially obscuring the timescale-dependent responses. In this study, we apply the Ensemble Empirical Mode Decomposition method to ISCCP-H cloud observations and ERA5 data (1987–2016) to isolate low cloud amount across multiple intrinsic timescales and trends over global land and ocean. The trends show a nonlinear increase in stratocumulus (Sc) and a significant nonlinear decline in cumulus (Cu), while stratus (St) exhibits weaker trends. We categorize timescales short (≤1 year) for annual variations, medium (1–8 years) for interannual variability such as ENSO, and long (>8 years) for decadal and longer-term climate changes. It is found that Sc and Cu over land are primarily influenced by near-surface heating, while sea surface temperature and surface sensible heat flux (SHF) dominate over ocean at short timescales. SHF becomes dominant over land at medium timescales, largely reflecting ENSO-related induced surface anomalies. At long timescales, atmospheric stability and wind speed influence continental clouds, while SHF remains dominant over ocean. Trend components reveal that Sc and Cu are most sensitive to temperature changes, whereas St responds to mid-level humidity over ocean and SHF over land. These findings underscore the importance of timescale-dependent cloud–meteorology relationships to improve cloud parameterizations and reduce climate projection uncertainties. Overall, our results demonstrate that low cloud variability and trends cannot be explained by a single linear mechanism but instead arise from distinct meteorological controls that change across timescales, cloud types, and surface regimes. Full article
Show Figures

Figure 1

40 pages, 8521 KB  
Systematic Review
Nutrient and Dissolved Oxygen (DO) Estimation Using Remote Sensing Techniques: A Literature Review
by Androniki Dimoudi, Christos Domenikiotis, Dimitris Vafidis, Giorgos Mallinis and Nikos Neofitou
Remote Sens. 2025, 17(24), 4044; https://doi.org/10.3390/rs17244044 - 16 Dec 2025
Viewed by 1015
Abstract
Eutrophication has emerged as a critical threat to water quality degradation and ecosystem health on a global scale, calling for prompt management actions. Remote sensing enables the monitoring of eutrophication by detected changes in ocean color caused by fluctuations in chlorophyll a (chl [...] Read more.
Eutrophication has emerged as a critical threat to water quality degradation and ecosystem health on a global scale, calling for prompt management actions. Remote sensing enables the monitoring of eutrophication by detected changes in ocean color caused by fluctuations in chlorophyll a (chl a). Although chl a is a crucial indicator of phytoplankton biomass and nutrient overloading, it reflects the outcome of eutrophication rather than its cause. Nutrients, the primary “drivers” of eutrophication, are essential indicators for predicting the potential phytoplankton growth in water bodies, allowing adoption of effective preventive measures. Long-term monitoring of nutrients combined with multiple water quality indicators using remotely sensed data could lead to a more precise assessment of the trophic state. Retrieving non-optically active constituents, such as nutrients and DO, remains challenging due to their weak optical characteristics and low signal-to-noise ratios. This work is an attempt to review the current progress in the retrieval of un-ionized ammonia (NH3), ammonium (NH4+), ammoniacal nitrogen (AN), nitrite (NO2), nitrate (NO3), dissolved inorganic nitrogen (DIN), phosphate (PO43−), dissolved inorganic phosphorus (DIP), silicate (SiO2) and dissolved oxygen (DO) using remotely sensed data. Most studies refer to Case II highly nutrient-enriched water bodies. The commonly used spaceborne and airborne sensors, along with the selected spectral bands and band indices, per study area, are presented. There are two main model categories for predicting nutrient and DO concentration: empirical and artificial intelligence (AI). Comparative studies conducted in the same study area have shown that ML and NNs achieve higher prediction accuracy than empirical models under the same sample size. ML models often outperform NNs when training data are limited, as they are less prone to overfitting under small-sample conditions. The incorporation of a wider range of conditions (e.g., different trophic state, seasonality) into model training needs to be tested for model transferability. Full article
Show Figures

Figure 1

28 pages, 6707 KB  
Article
Depth-Specific Prediction of Coastal Soil Salinization Using Multi-Source Environmental Data and an Optimized GWO–RF–XGBoost Ensemble Model
by Yuanbo Wang, Xiao Yang, Xingjun Lv, Wei He, Ming Shao, Hongmei Liu and Chao Jia
Remote Sens. 2025, 17(24), 4043; https://doi.org/10.3390/rs17244043 - 16 Dec 2025
Viewed by 590
Abstract
Soil salinization is an escalating global concern threatening agricultural productivity and ecological sustainability, particularly in coastal regions where complex interactions among hydrological, climatic, and anthropogenic factors govern salt accumulation. The vertical differentiation and spatial heterogeneity of salinity drivers remain poorly resolved. We present [...] Read more.
Soil salinization is an escalating global concern threatening agricultural productivity and ecological sustainability, particularly in coastal regions where complex interactions among hydrological, climatic, and anthropogenic factors govern salt accumulation. The vertical differentiation and spatial heterogeneity of salinity drivers remain poorly resolved. We present an integrated modeling framework combining ensemble machine learning and spatial statistics to investigate the depth-specific dynamics of soil salinity in the Yellow River Delta, a vulnerable coastal agroecosystem. Using multi-source environmental predictors and 220 field samples harmonized to 30 m resolution, the hybrid Gray Wolf Optimizer–Random Forest–XGBoost model achieved high predictive accuracy for surface salinity (R2 = 0.91, RMSE = 0.03 g/kg, MAE = 0.02 g/kg). Spatial autocorrelation analysis (Global Moran’s I = 0.25, p < 0.01) revealed pronounced clustering of high-salinity hotspots associated with seawater intrusion pathways and capillary rise. The results reveal distinct vertical control mechanisms: vegetation indices and soil water content dominate surface salinity, while total dissolved solids (TDS), pH, and groundwater depth increasingly influence middle and deep layers. By applying SHAP (SHapley Additive Explanations), we quantified nonlinear feature contributions and ranked key predictors across layers, offering mechanistic insights beyond conventional correlation. Our findings highlight the importance of depth-specific monitoring and intervention strategies and demonstrate how explainable machine learning can bridge the gap between black-box prediction and process understanding. This framework offers a generalizable framework that can be adapted to other coastal agroecosystems with similar hydro-environmental conditions. Full article
(This article belongs to the Topic Water Management in the Age of Climate Change)
Show Figures

Figure 1

35 pages, 18467 KB  
Article
Monitoring Rubber Plantation Distribution and Biomass with Sentinel-2 Using Deep Learning and Machine Learning Algorithm (2019–2024)
by Yingtan Chen, Jialong Duanmu, Zhongke Feng, Jun Qian, Zhikuan Liu, Huiqing Pei, Pietro Grimaldi and Zixuan Qiu
Remote Sens. 2025, 17(24), 4042; https://doi.org/10.3390/rs17244042 - 16 Dec 2025
Viewed by 617
Abstract
The number of rubber plantations has increased significantly since 2000, especially in Southeast Asia and China, and their ecological impacts are becoming more evident. A robust rubber supply monitoring system is currently required at both the production and ecological levels. This study used [...] Read more.
The number of rubber plantations has increased significantly since 2000, especially in Southeast Asia and China, and their ecological impacts are becoming more evident. A robust rubber supply monitoring system is currently required at both the production and ecological levels. This study used Sentinel-2 multi-rule remote sensing images and a deep learning method to construct a deep learning model that could generate a distribution map of rubber plantations in Danzhou City, Hainan Province, from 2019 to 2024. For biomass modeling, 52 sample plots (27 of which were historical plots) were integrated, and the canopy structure was extracted as an auxiliary variable from the point cloud data generated by an unmanned aerial vehicle survey. Five algorithms, namely Random Forest (RF), Gradient Boosting Decision Tree, Convolutional Neural Network, Back Propagation Neural Network, and Extreme Gradient Boosting, were used to characterize the spatiotemporal changes in rubber plantation biomass and analyze the driving mechanisms. The developed deep learning model was exceptional at identifying rubber plantations (overall accuracy = 91.63%, Kappa = 0.83). The RF model performed the best in terms of biomass prediction (R2 = 0.72, RRMSE = 21.48 Mg/ha). Research shows that canopy height as a characteristic factor enhances the explanatory power and stability of the biomass model. However, due to limitations such as sample plot size, image differences, canopy closure degree, and point cloud density, uncertainties in its generalization across years and regions remain. In summary, the proposed framework effectively captures the spatial and temporal dynamics of rubber plantations and estimates their biomass with high accuracy. This study provides a crucial reference for the refined management and ongoing monitoring of rubber plantations. Full article
Show Figures

Graphical abstract

29 pages, 5197 KB  
Systematic Review
Mapping Reef Island Shoreline Changes: A Systematic Review of Data Sources and Methods
by Maria Kottermair, Stuart R. Phinn, Chris Roelfsema and Daniel Harris
Remote Sens. 2025, 17(24), 4041; https://doi.org/10.3390/rs17244041 - 16 Dec 2025
Viewed by 961
Abstract
Reef islands are small, low-lying landforms composed of unconsolidated bioclastic materials and are highly vulnerable to coastal hazards exacerbated by climate change. This vulnerability has driven extensive research interest in shoreline changes across temporal scales ranging from short-term (seasonal) to long-term (decadal) dynamics. [...] Read more.
Reef islands are small, low-lying landforms composed of unconsolidated bioclastic materials and are highly vulnerable to coastal hazards exacerbated by climate change. This vulnerability has driven extensive research interest in shoreline changes across temporal scales ranging from short-term (seasonal) to long-term (decadal) dynamics. In this review, we first conducted an exploratory search of publicly available databases to assess the global distribution of reef islands and their potential for providing baseline data. Based on the PRISMA 2020 framework, we then examined 74 studies to identify data sources and methods commonly used to analyse reef island shoreline changes. Our findings indicate that no global dataset currently exists that specifically identifies reef islands, despite the potential value of such a dataset. Shoreline changes have been assessed for over 91 atolls and 119 non-atoll reef islands (excluding a global study) spanning the Pacific, Indian, and Atlantic Oceans. However, inconsistencies in time spans, reporting practices, and error assessments make cross-study comparisons challenging. Analysis of data sources revealed that 40% of studies were purely desktop-based, while only 11% relied solely on field data. Most used a combination of remote sensing and field-based approaches. Emerging technologies such as drones and LiDAR remain underutilised in reef island research, although they provide promising opportunities for high-resolution mapping and monitoring. This review provides a methodological framework to guide future research on reef island shoreline changes. Full article
(This article belongs to the Special Issue Remote Sensing Application in Coastal Geomorphology and Processes II)
Show Figures

Figure 1

26 pages, 7144 KB  
Article
Slight Change, Huge Loss: Spatiotemporal Evolution of Ecosystem Services and Driving Factors in Inner Mongolia, China
by Zherui Yin, Wenhui Kuang, Geer Hong, Yali Hou, Changqing Guo, Wenxuan Bao, Zhishou Wei and Yinyin Dou
Remote Sens. 2025, 17(24), 4040; https://doi.org/10.3390/rs17244040 - 16 Dec 2025
Viewed by 446
Abstract
The spatiotemporal evolution of ecosystem services has a profound influence on the fragile eco-environment in Inner Mongolia and the arid/semi-arid and the ecological barrier regions of Northern China; in particular, the small-scale and high-value land variables may lead to large eco-environment effects through [...] Read more.
The spatiotemporal evolution of ecosystem services has a profound influence on the fragile eco-environment in Inner Mongolia and the arid/semi-arid and the ecological barrier regions of Northern China; in particular, the small-scale and high-value land variables may lead to large eco-environment effects through altering the ecosystem services, which is still unclear in this vulnerable area. The differential driving mechanism of both human activities and natural factors on ecosystem services also needs to be revealed. To solve this scientific issue, the synergistic methodology of spatial analysis technology, the improved ecosystem service assessment method, flow gain/loss model, global/local Moran’s I approach, and the Geographically and Temporally Weighted Regression (GTWR) model were applied. Our main results are as follows: remote sensing monitoring showed that the land changes featured a persistent expansion of cropland and built-up areas, with a decline in grassland and wetland, along the east–west gradient from forests, grasslands, and unused-lands, to become the dominant cover type. According to our improved model, the ecosystem services considering the internal structure of build-up lands were first investigated in this ecologically fragile area of China, and the evaluated ecosystem service value (ESV) reduced from CNY 5515.316 billion to CNY 5425.188 billion, with an average annual decrease of CNY 3.004 billion from 1990 to 2020. Another finding was that the small-scale land variables with large ecological service impacts were quantified; namely, the proportion of grassland, woodland, wetland, and water body decreased from 62.71% to 61.34%, with only a relatively minor fluctuation of −1.37%, but this decline resulted in a large ESV loss of CNY 116.141 billion from 1990 to 2020. From the driving perspective, the temperature, digital elevation model (DEM), and slope exhibited negative effects on ESV changes, whereas a positive association was analyzed in terms of the precipitation and human footprint during the studied period. This study provides important support for optimizing land resource allocation, guiding the development of agriculture and animal husbandry, and protecting the ecological environment in arid/semi-arid and ecological barrier regions. Full article
Show Figures

Figure 1

39 pages, 5635 KB  
Article
A Sustainable Agricultural Development Index (SADI): Bridging Soil Health, Management, and Socioeconomic Factors
by Gabriel Pimenta Barbosa de Sousa, José Alexandre Melo Demattê, Sabine Chabrillat, Robert Milewski, Raul Roberto Poppiel, Merilyn Taynara Accorsi Amorim, Bruno dos Anjos Bartsch, Jorge Tadeu Fim Rosas, Maurício Roberto Cherubin, Yuxin Ma, Roney Berti de Oliveira, Marcos Rafael Nanni and Renan Falcioni
Remote Sens. 2025, 17(24), 4039; https://doi.org/10.3390/rs17244039 - 16 Dec 2025
Viewed by 661
Abstract
Soil Health (SH) is a key concept in discussions on sustainable land use, with implications that extend beyond agriculture. To address the need for integrated assessments, this study developed a Sustainable Agricultural Development Index (SADI) by combining the Soil Health Index (SHI) with [...] Read more.
Soil Health (SH) is a key concept in discussions on sustainable land use, with implications that extend beyond agriculture. To address the need for integrated assessments, this study developed a Sustainable Agricultural Development Index (SADI) by combining the Soil Health Index (SHI) with socioeconomic and management indicators. The analysis was conducted across Germany using 3300 soil analysis sites and environmental covariates, including climate, topography, vegetation indices, and bare soil reflectance. From this foundation, SADI was designed to evaluate agricultural sustainability across German states based on three dimensions: Management (Bare Soil Frequency), Environment (SHI Maps), and Economy (Profit per Hectare). Results revealed that SHI correlated significantly with land surface temperature (R = −0.47), bare soil frequency (R = −0.40), and vegetation indices (R = 0.43). Soil organic carbon also played a key role in explaining degradation patterns. While economically stronger states tended to achieve higher SH scores, environmentally sound and well-managed regions also performed well despite lower economic returns. These findings emphasize that sustainable agriculture depends on balancing economic growth, environmental integrity, and management efficiency. The SADI provides a comprehensive framework for policymakers and land managers to evaluate and guide sustainable agricultural development. Full article
Show Figures

Graphical abstract

29 pages, 33246 KB  
Article
Regional Forest Wildfire Mapping Through Integration of Sentinel-2 and Landsat 8 Data in Google Earth Engine with Semi-Automatic Training Sample Generation
by Yue Chen, Weili Kou, Xiong Yin, Rui Wang, Jiangxia Ye and Qiuhua Wang
Remote Sens. 2025, 17(24), 4038; https://doi.org/10.3390/rs17244038 - 16 Dec 2025
Viewed by 1125
Abstract
Accurate mapping of burned forest areas in mountainous regions is essential for wildfire assessment and post-fire ecological management. This study develops an FS-SNIC-ML workflow that integrates multi-source optical fusion, semi-automatic sample generation, feature selection, and object-based machine-learning classification to support reliable burned-area mapping [...] Read more.
Accurate mapping of burned forest areas in mountainous regions is essential for wildfire assessment and post-fire ecological management. This study develops an FS-SNIC-ML workflow that integrates multi-source optical fusion, semi-automatic sample generation, feature selection, and object-based machine-learning classification to support reliable burned-area mapping under complex terrain conditions. A pseudo-invariant feature (PIFS)-based fusion of Sentinel-2 and Landsat 8 imagery was employed to generate cloud-free, gap-free, and spectrally consistent pre- and post-fire reflectance datasets. Burned and unburned samples were constructed using a semi-automatic SAM–GLCM–PCA–Otsu procedure and county-level stratified sampling to ensure spatial representa-tiveness. Feature selection using LR, RF, and Boruta identified dNBR, dNDVI, and dEVI as the most discriminative variables. Within the SNIC-supported GEOBIA framework, four classifiers were evaluated; RF performed best, achieving overall accuracies of 92.02% for burned areas and 94.04% for unburned areas, outperforming SVM, CART, and KNN. K-means clustering of dNBR revealed spatial variation in fire conditions, while geographical detector analysis showed that NDVI, temperature, soil moisture, and their pairwise interactions were the dominant drivers of wildfire hotspot density. The proposed workflow provides an effective and transferable approach for high-precision burned-area extraction and quantification of wildfire-driving factors in mountainous forest regions. Full article
(This article belongs to the Special Issue Advances in Remote Sensing for Burned Area Mapping)
Show Figures

Figure 1

22 pages, 27042 KB  
Article
MSDF-Mamba: Mutual-Spectrum Perception Deformable Fusion Mamba for Drone-Based Visible–Infrared Cross-Modality Vehicle Detection
by Jiashuo Shen, Jun He, Qiuyu Liu, Zhilong Zhang, Guoyan Wang and Dawei Lu
Remote Sens. 2025, 17(24), 4037; https://doi.org/10.3390/rs17244037 - 15 Dec 2025
Cited by 1 | Viewed by 836
Abstract
To ensure all-day detection performance, unmanned aerial vehicles (UAVs) usually need both visible and infrared images for dual-modality fusion object detection. However, misalignment between the RGB-IR image pairs and complexity of fusion models constrain the fusion detection performance. Specifically, typical alignment methods choose [...] Read more.
To ensure all-day detection performance, unmanned aerial vehicles (UAVs) usually need both visible and infrared images for dual-modality fusion object detection. However, misalignment between the RGB-IR image pairs and complexity of fusion models constrain the fusion detection performance. Specifically, typical alignment methods choose only one modality as a reference modality, leading to excessive dependence on the chosen modality quality. Furthermore, current multimodal fusion detection methods still struggle to strike a balance between high accuracy and low computational complexity, thus making the deployment of these models on resource-constrained UAV platforms a challenge. In order to solve the above problems, this paper proposes a dual-modality UAV image target detection method named Mutual-Spectrum Perception Deformable Fusion Mamba (MSDF-Mamba). First, we designed a Mutual Spectral Deformable Alignment (MSDA) module. This module employs a bidirectional cross-attention mechanism to enable one modality to actively extract the semantic information of the other, generating fusion features rich in cross-modal context as shared references. These fusion features are then used to predict spatial offsets, with deformable convolutions achieving feature alignment. Based on the MSDA module, a Selective Scan Fusion (SSF) module is carefully designed to project the aligned features onto a unified hidden state space. With this method, we achieve full interaction and enhanced fusion of intermodal features with low computational complexity. Experiment results demonstrate that our method outperforms existing state-of-the-art cross-modality detection methods on the mAP metric, achieving a relative improvement of 3.1% compared to baseline models such as DMM, while still maintaining high computational efficiency. Full article
Show Figures

Figure 1

Previous Issue
Back to TopTop