Highlights
What are the main findings?
- Shoreline change has been assessed for over 91 atolls and 119 non-atoll reef islands; a separate global study covered 221 atolls.
- Most studies rely on remote sensing, especially high-resolution satellite and aerial imagery; only 11% use field data exclusively.
What are the implications of the main findings?
- Emerging technologies like drones and lidar remain underutilised despite their potential for high-resolution, three-dimensional shoreline monitoring.
- No global database currently exists that explicitly identifies and classifies reef islands, limiting comprehensive research and monitoring efforts.
Abstract
Reef islands are small, low-lying landforms composed of unconsolidated bioclastic materials and are highly vulnerable to coastal hazards exacerbated by climate change. This vulnerability has driven extensive research interest in shoreline changes across temporal scales ranging from short-term (seasonal) to long-term (decadal) dynamics. In this review, we first conducted an exploratory search of publicly available databases to assess the global distribution of reef islands and their potential for providing baseline data. Based on the PRISMA 2020 framework, we then examined 74 studies to identify data sources and methods commonly used to analyse reef island shoreline changes. Our findings indicate that no global dataset currently exists that specifically identifies reef islands, despite the potential value of such a dataset. Shoreline changes have been assessed for over 91 atolls and 119 non-atoll reef islands (excluding a global study) spanning the Pacific, Indian, and Atlantic Oceans. However, inconsistencies in time spans, reporting practices, and error assessments make cross-study comparisons challenging. Analysis of data sources revealed that 40% of studies were purely desktop-based, while only 11% relied solely on field data. Most used a combination of remote sensing and field-based approaches. Emerging technologies such as drones and LiDAR remain underutilised in reef island research, although they provide promising opportunities for high-resolution mapping and monitoring. This review provides a methodological framework to guide future research on reef island shoreline changes.
1. Introduction
Reef islands are small, low-lying islands that sit atop coral reef platforms, like barrier reefs, fringing reefs, platform reefs, or atolls. They consist of material derived from the surrounding coral reef system, which is transported by hydrodynamic processes [1,2,3]. These islands occur in the mid- to low-latitudes and represent the most widespread island type in both the Pacific [4] and the Indian Oceans [5]. Many of them are classified as atoll islands, which are islands situated on an atoll rim or a patch reef inside an atoll lagoon. An atoll is a ring-shaped mid-ocean reef with a lagoon [6]. In regions like the Caribbean and Australia, reef islands are commonly referred to as cays. Most are only a few hectares to a few square kilometres in size and typically rise only a few metres above sea level, making them susceptible to environmental changes like sea level rise and changes in the storm and wave regime [7,8,9]. The associated risks facing these islands, such as coastal erosion, inundation, and saltwater intrusion, are a growing concern for many reef island populations, especially for nations like Tuvalu, the Marshall Islands, and Kiribati, which consist exclusively of atoll islands and other types of reef islands [10]. This fundamental issue has also drawn the interest of the research community [11] and is reflected in numerous publications addressing shoreline changes and reef island vulnerability (Table 1). Analysing and understanding historical shoreline changes in reef islands and the drivers of these changes can lead to better future projections and appropriate adaptation measures [10].
In a broader context, shoreline changes have been a concern globally [12]. This is particularly the case in relatively densely populated regions, and has become the subject of extensive scientific investigation, including studies on global shoreline changes in beaches [13], national assessments [14,15], and effects on World Heritage sites [16], to name a few. This research interest is also reflected in the variety of shoreline products, like the Digital Earth Australia Coastline [17] or CoastSat [18], which show the historic shoreline changes for an entire country and the entire world, respectively. As a consequence of this research interest, several reviews and meta-analyses have been published about shoreline change analysis in general, but not specifically addressing reef islands (Table 1). There are also two meta-analyses explicitly on reef island shoreline changes (see [19,20]), but they focus on changes rather than the methods and analyses employed. However, there are unique challenges to studying shoreline changes in reef islands due to their small size and remote locations, which may limit the transferability of widely applied data sources and data collection approaches.
Recognising the uniqueness and importance of studying shoreline changes in reef islands, the aim of this paper is to review past and current methods used to measure these changes to determine the trends in methods, potential research gaps, and future directions in studying these highly vulnerable reef islands. This review focuses on data sources and methods used to assess short-term (daily or seasonal) to decadal changes in reef island shorelines and beaches. It also provides the bibliographic metrics and geographic distribution of the studies included here. However, studies focusing on drivers of change (e.g., [21,22]), hydrodynamic modelling (e.g., [23]), or broader island evolution (e.g., [24]) are excluded unless they directly quantify shoreline change. The findings presented here may serve as a reference point for researchers investigating shoreline changes in reef islands, providing a foundational framework to guide future studies.

Table 1.
Overview of reviews and meta-analyses addressing the mapping and analysis of shorelines of reef islands.
Table 1.
Overview of reviews and meta-analyses addressing the mapping and analysis of shorelines of reef islands.
| Reference | Title | Type | Comments |
|---|---|---|---|
| Sun et al. (2024) [25] | Remote Sensing Image Interpretation for Coastal Zones: A Review | Review | Addresses coastal zone interpretation, platforms and sensors, spectral characteristics, and challenges. |
| Kennedy (2024) [9] | A review of the vulnerability of low-lying reef island landscapes to climate change and ways forward for sustainable management | Review | Overview of key physical parameters and methodological approaches to assess vulnerability of reef islands, including mapping topography and planform variability. |
| Wang et al. (2023) [26] | An Overview of Shoreline Mapping Using Airborne LiDAR | Systematic review | Overview of shoreline mapping techniques using lidar over past 20 years, including data availability and extraction methods. |
| Ankrah et al. (2022) [11] | Bibliometric analysis of data sources and tools for shoreline change analysis and detection | Systematic review | Detailed overview of shoreline definition, sources, analysis tools, studies, and reviews, including views on machine learning. |
| Vitousek et al. (2023) [27] | The future of coastal monitoring through satellite remote sensing | Review | Overview of past, present, and future techniques for coastal monitoring and detailed description of current and potential applications of remote sensing. |
| Tsiakos and Chalkias (2023) [28] | Use of Machine Learning and Remote Sensing Techniques for Shoreline Monitoring: A Review of Recent Literature | Systematic review | Review of the literature from 2015 to 2022 on shoreline extraction and change analysis using machine learning methods. |
| Mutagi et al. (2022) [29] | Shoreline Change Model: A Review | Review | Overview of shoreline change models including along- and cross-shore movement on sandy and tidal coasts for short and long time periods. |
| Parthasarathy and Deka (2021) [30] | Remote sensing and GIS application in assessment of coastal vulnerability and shoreline changes: a review | Review | Detailed overview of coastal vulnerability indexes and shoreline change, but not focused on islands. |
| Duvat (2019) [19] | A global assessment of atoll island planform changes over the past decades | Meta- analysis | Global meta-analysis of atoll islands, but only focuses on planform changes, not discussing other methods. |
| Hamylton (2017) [31] | Mapping coral reef environments: A review of historical methods, recent advances, and future opportunities | Review | Review focuses on methods that map not only reef islands but also surrounding reef platforms, so review has a wider scope. Although a thorough review, it does not include latest developments since 2017. |
| Fairley et al. (2016) [32] | Terrestrial Laser Scanner Techniques for Enhancement in Understanding of Coastal Environments | Review | Summary of traditional survey methods for coastal environments and current and potential use of terrestrial laser scanners. Also includes a case study of sand and gravel beach. |
| Hamylton and Puotinen (2015) [20] | A meta-analysis of reef island response to environmental change on the Great Barrier Reef | Meta- analysis | Only focuses on GBR and was published over 10 years ago. |
| Boak and Turner (2005) [33] | Shoreline definition and detection: a review | Review | Seminal paper on shoreline proxies and delineation methods. |
2. Materials and Methods
2.1. Approach
The first step involved an exploratory search of publicly available online databases on reef islands worldwide to assess their current mapping and distribution status. Such databases are a critical foundation for understanding the global distribution of reef islands and identifying data gaps in shoreline monitoring. If any data exists in high resolution, it could also serve as a baseline for shoreline change mapping. Additionally, a comprehensive global database can support ecological habitat mapping and inform conservation efforts.
The second step involved a literature review on data sources and methods used in analysing shoreline changes. A hybrid approach was employed, combining a systematic quantitative literature review (following the general PRISMA guidelines [34]) that provides the basis for the analysis, with a critical review of the general literature when deemed appropriate. This review method was used to systematically analyse the current body of scientific literature, including bibliographic characteristics, location of study islands, data sources, measurement techniques, parameters measured, temporal resolution, shoreline definition, and methods used for the analysis and to ensure the accuracy of results.
2.2. Databases Searched
For the review, two online databases, namely Web of Science and Scopus, were searched and analysed. The results were last updated in March 2025 to include the most recent publications. The two selected databases are common repositories and were also chosen for other reviews (e.g., [11,26]) as they cover a wide range of fields. Google Scholar, as recommended by Pickering and Byrne [35], was considered and tested, but not included in the final analysis, primarily because it did not seem to add a significant number of relevant studies. In addition, Google Scholar frequently updates its algorithm and does not provide consistent search results, making it less reliable for replication. This lack of reproducibility negates the fundamental principle of a systematic review, which should be repeatable. The publications were not restricted to a time range.
Only ‘true’ reef islands have been included in this review, which are islands formed on top of a reef platform like an atoll or platform reef from unconsolidated, biogenic sediments, and elevations lower than 3 m above mean sea level [4]. Rather confusingly, low limestone islands are sometimes called coral reef islands or just reef islands, like Moorea [36] or Bidong Island [37], but these have been excluded due to their different composition (lithified limestone versus the unconsolidated reef material of true reef islands) and geomorphic nature (generally low in elevation but often uplifted). In addition, this review focused on short to decadal timescales, rather than geological timescales that address the evolutionary history of these islands.
This review included only peer-reviewed journal articles. Conference proceedings, reports, and book chapters were excluded due to inconsistent peer-review standards and limited availability and their potential to introduce a bias into the analysis. However, conference papers that were published in peer-reviewed journals were included. Review articles and meta-analyses were also not included in the quantitative analysis as they are not considered primary research, and the focus of meta-analyses lies in the results and not the methods, which are the focus of this paper. In addition, only papers in English were considered, as translation is often challenging. The resulting studies were manually input into a spreadsheet, and for each study, the categories were populated with values from each publication and then analysed using pivot tables. To avoid bias, results were only reported quantitatively if values were present for all datasets.
2.3. Keywords and Focus Points
A set of keywords was chosen to capture as many relevant peer-reviewed articles as possible while omitting irrelevant results. These carefully selected keywords included ‘shoreline OR coastline OR beach OR reef islands OR atoll OR atoll islands’ in combination with ‘dynamics OR morphodynamics OR geomorphic change OR erosion OR accretion OR changes OR coastal changes OR volumetric comparison OR variability OR spatiotemporal analysis OR evolution’ and ‘detection OR analysis OR rate’.
The focus points of this review are the bibliography, geographic distribution, and data sources and methods used to quantify shoreline changes to provide insight into the what, who, when, and how of studies conducted in this research area. The bibliographic characteristics include the publication year, journal type, and authorship country, referring to the countries of the affiliated institutions of all authors. Content characteristics cover the geographical area and analytical variables: study area, data source, temporal resolution, and type of analysis. The study location refers to the location of the islands or atolls studied to provide insight into their geographic distribution. Data source refers to the type of data used for analysis, while method refers to the measurement techniques and tools and the software used. For example, data sources could be historic maps or satellite imagery, the method for shoreline extraction could be manual digitisation, and the tool used for change detection analysis could be a geographic information system (GIS)-based tool. Temporal resolution and coverage show the number of data points and the total time span of the study. The type of analysis explains how shoreline changes were measured, e.g., comparing the island size during different years or analysing changes only along a transect. The outcomes of these studies were not evaluated in detail since the focus of this review is on the methods, and it is not a meta-analysis, which has already been conducted by Duvat [19].
The findings are organised sequentially with regard to the steps and decisions needed to conduct a shoreline change analysis: the general steps are to first map the shoreline at specific points in time, which includes acquiring data and defining the shoreline and extraction method, and then to compare the various shorelines over time. A summary of the methodological workflow, explained in detail in the following sections, is illustrated in Figure 1. To enhance readability across multiple subtopics, the Introduction, Results, and Discussion are integrated for each step, rather than following the traditional structure of presenting all topics in detail within the Introduction, followed by a separate Section 3.
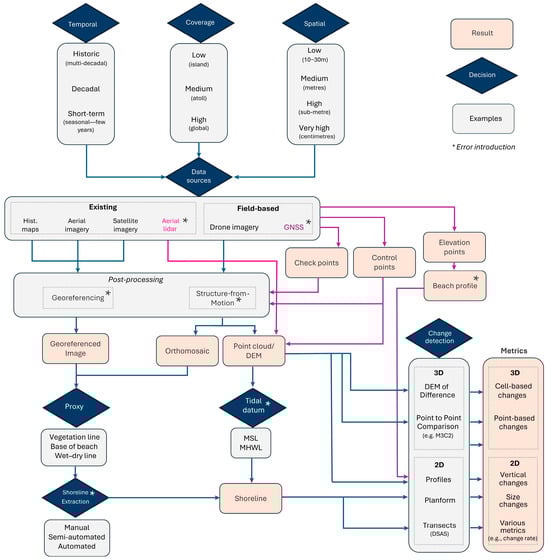
Figure 1.
Flow chart of data input and output, methods, and resulting metrics of general shoreline change analysis.
3. Results and Discussion
3.1. Databases of Reef Islands
An online search resulted in six datasets that included reef islands (Table 2). The Millennium Reef Project [38] was the first effort, starting in 2004, to map coral reefs based on Landsat satellite imagery and classify them according to their morphology, like reef flat, lagoon, and channel. It also identified reef islands as either atoll rim land or bank barrier land. While this is an impressive dataset, especially at the time of publication, it is not comprehensive as it misses entire regions like the Indo-Pacific region, most of Australia, and the Caribbean Sea. A follow-up project [39] updated the database to map all atoll islands comprehensively. Both datasets show the outlines of the different reef classes, and the more recent version also includes the atoll name. A global atoll geodatabase containing 416 atoll locations with their names has been compiled by Goldberg [40], with a recent update increasing the total number of atoll locations to 611 [41]. The most comprehensive database identifying all islands by location and name and classifying them by their island type, including reef islands, is limited to the Pacific Ocean [4]. A global islands database by the U.S. Geological Survey (USGS) [42] shows the outline of all islands worldwide; however, the islands are classified by size and do not distinguish different types of islands, like reef islands. There are also software toolkits like CoastSat (https://github.com/kvos/CoastSat v3.2., accessed on 30 November 2025) available that allow users to define their own area of interest and delineate shorelines based on global Landsat and Sentinel satellite imagery archives [18], including some shoreline datasets (http://coastsat.space/, accessed on 30 November 2025). While other databases might have reef islands included, they do not identify them as such. This indicates that no single database exists that both maps reef islands worldwide and identifies them as such. Developing such a database could support various research and planning efforts, including island evolution, habitat analysis, and hazard mitigation mapping.
Table 2.
Regional geospatial datasets that include reef islands. The table lists the data source, spatial coverage, vector type (● = point; □ = polygon), island names included (✓ = included), and number of records (reef islands or atolls/total islands, where available).
Table 2.
Regional geospatial datasets that include reef islands. The table lists the data source, spatial coverage, vector type (● = point; □ = polygon), island names included (✓ = included), and number of records (reef islands or atolls/total islands, where available).
| Reference | Name | Data Source | Data Class | Spatial Coverage | Vector Type | Island Names | # Records | Notes |
|---|---|---|---|---|---|---|---|---|
| Mudiyanselage et al. (2025) [43] | Global high-resolution coastline database | 2009–2023 WorldView 2 and 3 | All shorelines | global | □ | * | Detailed database but no names included | |
| USGS (Sayre, 2023) [42] | Global lslands | 2014 Landsat | All islands, grouped by size | global | □ | ✓ | */ 370 k | Comprehensive and detailed outline |
| Andréfouët and Bionaz (2021) [44] | Millennium Coral Reef Mapping Project | Landsat | All reef areas, classified by geomorphic unit | multi- regional | □ | ✓ | >12 k ** | Not all areas are covered, e.g., Australia, Indo-Pacific region, and Caribbean Sea |
| Andréfouët and Paul (2023) [39] | Atolls of the world | Landsat | Atolls, classified by geomorphic unit | global | □ | 598 | Comprehensive list of atolls with reef islands identified | |
| Goldberg (2016) [40] | Global Atlas of Atolls | Google Earth and others | Atoll location | global | ● | ✓ | 453 | First comprehensive dataset of atolls |
| Nunn et al. (2016) [4] | Pacific Islands | Google Earth and others | All islands, classified by geologic type | Pacific | ● | ✓ | 638/ 1778 | Names are on an island level but do not contain the atoll name |
Notes: * reef islands not specified; ** number includes all ‘land on reef’ features, not all of which are ‘true’ reef islands as defined here.
3.2. Findings of Shoreline Change Studies
The database searches of Scopus and Web of Science provided 1440 entries. After excluding duplicates (n = 449), non-English papers (n = 8), proceedings (not published in a journal) (n = 15), or otherwise out-of-scope articles (n = 794), a total of 174 full-text articles were screened. Of these, 74 met the criteria for inclusion in the final systematic review (see Figure 2).
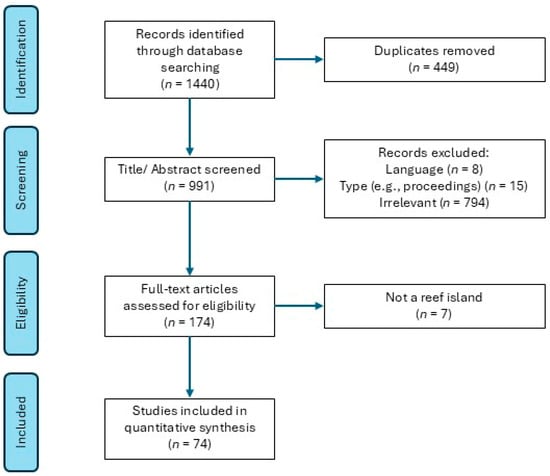
Figure 2.
PRISMA flow chart of the systematic quantitative literature review, resulting in 74 studies included in this review.
3.2.1. Bibliographic Characteristics
Shoreline changes were not widely studied until the 2000s, with only four publications available in the 1980s and then almost two decades with no publications focusing specifically on shoreline changes (Figure 3). Despite the absence of such studies during this time, several studies focusing on evolution of reef islands [45,46,47] and morphodynamics [48] surfaced in the 1990s with the advent of new sensors, like velocimeters and current profilers and accelerator mass spectrometry.
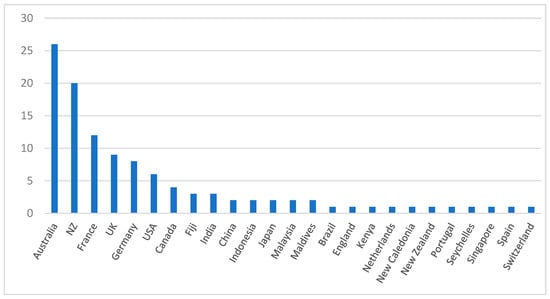
Figure 3.
Number of publications by country of authors, including co-authors.
The number of studies per year has continuously increased since 2006, with works published by Kench and Brander [49], Kench et al. [50], and Webb and Kench [51]. This is likely due to increased availability of suitable data and the more widespread use of GIS technology to analyse these changes more efficiently. The access to and availability of satellite imagery have gradually improved over the last two decades with the launch of more satellites and free access to regularly updated global archives like Landsat and Sentinel 2. At the same time, more historical imagery has been emerging in online catalogues as they are being digitised. In addition, heightened awareness of the increased vulnerability of these small islands due to sea level rise, particularly under future climate scenarios reported by the Intergovernmental Panel on Climate Change (e.g., [52,53]), has led to greater funding availability, prompting more researchers to apply established methodologies to islands that have not been previously studied.
More than 20% of studies included in this review were published in Geomorphology, followed by Remote Sensing (11%) and Journal of Coastal Research (10%). Other notable journals include Anthropocene (5%), Global and Planetary Change (5%), Frontiers in Marine Science (4%), and Geology (4%), each with four or fewer publications. The remainder (41%) were published in various other journals, each contributing only one relevant article to this review.
An analysis of author affiliations shows that most of the studies were led by researchers from Australia, New Zealand, and France, taking into account the affiliations of all contributing authors rather than just the first author (Figure 3). Although most reef islands are in Small Island Developing States (SIDSs), these regions remain underrepresented among authors. While China and Japan are not SIDSs, the number of studies originating from these countries may be underestimated due to the language-based exclusion criteria.
3.2.2. Types and Geographic Distribution of Islands Studied
The results show that shoreline changes have been assessed for reef islands from 91 atolls and 119 non-atoll reef islands, across 73 publications (Table 3). This count excludes a global study by Holdaway et al. [54], which assessed 221 atolls, since not all atolls were listed, and including this study may have skewed the numbers of individual studies. A greater number of studies focused exclusively on atoll islands (n = 40) compared to those examining solely other types of reef islands (n = 27), while only seven studies addressed both types of islands. The single study that assessed the largest number of individual islands was by Kench et al. [55], with 509 atoll islands across 42 atolls. Due to inconsistencies in reporting, such as missing island counts at the atoll level and potential overlap among studies, the total number of islands assessed across all reviewed publications could not be accurately determined. However, the average number of islands in a study was 30.3, while the average number of atolls or platforms studied was 3.5. Although more reef islands than atolls have been studied, the number of individual atoll islands assessed is higher, since a single atoll may contain numerous islands on its atoll platform. This research focus likely reflects the greater importance placed on atoll islands as human habitats.
Table 3.
List of reef islands and atolls with shoreline change studies, organised by ocean and country/region. Superscript numbers indicate references; matching superscripts across columns correspond to the same source.
Table 3.
List of reef islands and atolls with shoreline change studies, organised by ocean and country/region. Superscript numbers indicate references; matching superscripts across columns correspond to the same source.
| Country/ Region | Reef Island/Atoll | # Islands (If Non-Atoll) | # Atolls | Reference |
|---|---|---|---|---|
| Atlantic Ocean | 42 | 1 | ||
| Belize | Carrie Bow Cay 1, English Cay 1, Frank’s Cay 2, Glover’s Reef Atoll 3, Goff’s Cay 1, Hunting Cay 1,2, Lime Cay 1,2, Middle Silk Cay 1, Nicholas Cay 1,2, North Silk Cay 1, North Spot 1, Northeast Sapodilla Cay 1,2, Pompion Cay 1, Ragged Cay 1,2, Ranguana Cay 1, Rendezvous Cay 1, Round Cay 1, Sergeant’s Cay 1, South Water Cay 1, Tobacco Cay 1, Tom Owen’s East Cay 1,2, Tom Owen’s West Cay 1,2, West Cay 1 | 23 | - | 1 Stoddart et al. (1982a) [56], 2 Houser et al. (2014) [57], 3 Stoddart et al. (1982b) [58] |
| Brazil | Rocas Atoll 4 | - | 1 | 4 Costa et al. (2017) [59] |
| British Overseas Territory | Prickly Pear 5, Sandy Island 5, Scrub Island 5 | 3 | - | 5 Cambers & Wynne (2019) [60] |
| Honduras | Utila 6: Sandy Cay, South West Cay, Water Cay. Cayos Cochinos 6: Morgan’s Cay, Diamond Cay, Bells Cay, Little Cay A. Cayos Cochinos: Paloma, Balfate, Largo Arriba, Borrego, Largo Abajo, Chachauate, Bolanos, Zacate, Timon | 16 | - | 6 Husband et al. (2023) [61] |
| Indian Ocean | 18 | 34 | ||
| Australia | Eva Island 7,8, Fly Island 7,8, North Keeling Island 9, Observation Island 7,8, Y Island 7,8 | 5 | - | 7 Bonesso et al. (2020) [62], 8 Cuttler et al. (2020) [63], 9 Adnan et al. (2016) [64] |
| British Indian Ocean Territory | Diego Garcia Atoll 10,11, Peros Banhos Atoll 10 | - | 2 | 10 Wu et al. (2021) [65], 11 Hamylton & East (2012) [66] |
| France | Grande Glorieuse Island 12 | 1 | - | 12 Testut et al. (2016) [67] |
| India | Agatti Atoll 13, Amini Atoll 13, Androth 13,14, Bangaram Atoll 14, Bitra Atoll 13,14, Chetlat Atoll 13, Kadmat Atoll 13, Kalpeni Atoll 13, Kavaratti Atoll 13, Keelakarai 15, Kiltan Atoll 13, Mandapam 15, Minicoy Atoll 13,14, Suheli Par Atoll 14, Tuticorin 15, Vembar 15 | 5 | 11 | 13 Suganya et al. (2019) [68], 14 Menon et al. (2024) [69], 15 Asir et al. (2020) [70] |
| Maldives | Alifu Atoll 16, Baa Atoll 16, Dhaalu Atoll 16, Faafu Atoll 16, Fuvahmulah 17, Gaafaru 16, Gnaviyani 16, Haa Alifu-Noonu Atoll 16, Huvadhoo Atoll 18,19,20, Huvadhu Atoll 16, Ihavandhippolhu Atoll 16, Kaashidhoo 16, Laamu Atoll 16, Lhaviyani Atoll 16, Maamakunudhoo Atoll 16, Meemu Atoll 16, North Kaafu Atoll 16, Raa Atoll 16, Rasdhoo 16, Seenu Atoll 16, South Kaafu Atoll 16, South Maalhosmadulu Atoll 21,22,23, Thaa Atoll 16, Thoddoo 16, Vaavu Atoll 16, Vabbinfaru Island 24 | 7 | 19 | 16 Duvat (2020) [71], 17 David & Schlurmann (2020) [72], 18 Aslam & Kench (2017) [73], 19 Carruthers et al. (2023) [74], 20 Petrie et al. (2023) [75], 21 Kench & Brander (2006) [49], 22 Kench et al. (2006) [50], 23 Kench et al. (2008) [76], 24 Beetham & Kench (2014) [77] |
| Seychelles | Aldabra Atoll 25, Farquhar Atoll 26,27 | - | 2 | 25 Constance et al. (2024) [78], 26 Duvat et al. (2017b) [79], 27 Volto & Duvat (2020) [80] |
| Pacific Ocean | 59 | 55 | ||
| Australia (GBR) | Bushy Islet 28, Erskine Island 29, Heron Island 30, Low Isles 31, Masthead Island 28, Nymph Island 32, One Tree Island 33,34,35, Raine Island 36,37, Taylor Cay 28, Two Isles 32 | 10 | - | 28 Lazarus et al. (2025) [81], 29 Flood (1986) [82], 30 Flood (2018) [83], 31 Hamylton et al. (2019) [84], 32 Hamylton et al. (2020) [85], 33 Bryson et al. (2016) [86], 34 Shannon et al. (2013) [87], 35 Talavera et al. (2021) [88], 36 Dawson & Smithers (2010) [89], 37 Dawson (2021) [90] |
| French Polynesia | Manihi Atoll 38, Manuae Atoll 38, Mataiva Atoll 39, Rangiroa Atoll 39,40, Takapoto Atoll 41, Takaroa Atoll 39, Tetiaroa Atoll 42, Tikehau Atoll 39, Tupai Atoll 42 | - | 9 | 38 Yates et al. (2013) [91], 39 Duvat et al. (2017a) [22], 40 Gairin et al. (2022) [92], 41 Duvat & Pillet (2017) [93], 42 Le Cozannet et al. (2013) [94] |
| FSM | Ant Atoll 43,44, Eauripik Atoll 43,44, Losiep 43,44, Mokil Atoll 43,44,45, Murilo Atoll 43,44, Namoluk Atoll 43,44, Namonuito Atoll 43,44, Nomwin Atoll 43,44, Pakin Atoll 43,44, Pingelap Atoll 43,44,45, Pulusuk Atoll 43,44, Puluwat Atoll 43,44, Satawan Atoll 43,44, Sorol Atoll 43,44, Ulithi Atoll 43,44, Zohhoiiyoru Bank 43,44 | 1 | 15 | 43 Kench et al. (2024) [55], 44 Sengupta et al. (2021b) [95], 45 Webb & Kench (2010) [51] |
| Indonesia | Langkai Island 46, Sabangko Island 32, Tanakeke Island 32 | 3 | - | 46 Kappelmann et al. (2024) [96], 32 Hamylton et al. (2020) [85] |
| Japan | Ballast Island 47 | 1 | - | 47 Kayanne et al. (2016) [97] |
| Kiribati | Abemama Atoll 43,48, Aranuka Atoll 49, Arorae 43,48, Maiana Atoll 49, Makin 43,48, Nikunau 43,48, Onotoa Atoll 43,48, Tabiteuea Atoll 43,48, Tamana 43,48, Tarawa Atoll 45,50,51 | 4 | 6 | 43 Kench et al. (2024) [55], 48 Sengupta et al. (2021a) [98], 49 Rankey (2011) [99], 50 Biribo & Woodroffe (2013) [100], 45 Webb & Kench (2010) [51], 51 Ellison et al. (2017) [101] |
| Malaysia | Sipandan Island 52 | 1 | - | 52 Lowe et al. (2019) [102] |
| Marshall Islands | Ailinglaplap Atoll 53, Ebon Atoll 43,54, Jabat Atoll 54, Jaluit Atoll 55, Lae Atoll 43,54, Likiep Atoll 43,54, Majuro Atoll 43,56, Mejit Atoll 43, Mejit Island 54, Nadikdik Atoll 43,57, Rongerik Atoll 43,54, Ujae Atoll 43,54, Wotho Atoll 43,54, Wotje Atoll 43,58 | - | 14 | 53 Ford et al. (2020) [103], 54 Ford & Kench (2015) [104], 43 Kench et al. (2024) [55], 55 Ford & Kench (2016) [105], 56 Ford (2012) [106], 57 Ford & Kench (2014) [107], 58 Ford (2013) [108] |
| New Caledonia | Amédée 59, Ange 59, Baille 59, Bois de Fer 59, Canard 59, Faux Tabac 59, Goéland 59, Goldfield 59, Kondoyo 59, Larégnère 59, Maitre 59, Mba 59, MbéKuen 59, Mbo 59, Nokanhui Atoll 59, Pandanus 59, Ronde 59, Ronhua 59, Signal 59, Ténia 59, Tibarama 59 | 20 | 1 | 59 Garcin et al. (2016) [109] |
| Papua New Guinea | Takú Atoll 60,61,62,63 | - | 1 | 60 Mann & Westphal (2014) [110], 61 Mann & Westphal (2016) [111], 63 Smithers & Hoeke (2014) [112], 62 Mann et al. (2016) [113] |
| Solomon Islands | Isabel 64, Ontong Java Atoll 65, Roviana 64, Sasahura Ite Island 52 | 3 | 1 | 64 Albert et al. (2016) [114], 65 Bayliss-Smith (1988) [115], 52 Lowe et al. (2019) [102] |
| South China Sea | Bei Island 66, Beizi Island 66, Ganquan Island 66, Jinqing Island 66, Jinyin Island 66, Jiuzhang Atoll 67, Mahuan Island 66, Nan Island 66, Shanhu Island 66, Xishazhou 66, Xiyue Island66, Zhong Island 66 | 11 | 1 | 66 Liu et al. (2020) [116], 67 Zhou et al. (2023) [117] |
| Tuvalu | Funafuti Atoll 43,45,68,69,70,71, Nanamanga Atoll 43, Nanumaga 43,71, Nanumea Atoll 43,71, Niulakita 43,71, Niutao 43,71, Nui Atoll 43,71, Nukufetau Atoll 43,71, Nukulaelae Atoll 43,71, Tepuka Island 72, Vaitupu 43,71 | 5 | 6 | 45 Webb & Kench (2010) [51], 43 Kench et al. (2024) [55], 68 Hisabayashi et al. (2018) [118], 69 Kench et al. (2015) [119], 70 Kench et al. (2017) [120], 71 Kench et al. (2018) [8], 72 Kench et al. (2014) [121] |
| USA | Palmyra Atoll 73 | - | 1 | 73 Collen et al. (2009) [122] |
| Total | 119 | 91 | ||
| Global Study—Pacific and Indian | Various atolls in the Maldives, Spratly Islands, Paracel Islands, Tokelau, Kiribati, Marshall Islands, Tuvalu, French Polynesia, FSM, Chagos, and Palau 74 | - | 221 | 74 Holdaway et al. (2021) [54] |
The most widely studied countries in shoreline change research are Australia, the Maldives, Kiribati, the Marshall Islands, and Tuvalu, each with more than seven publications. Geographically, the majority of the studies (62%) focused exclusively on islands in the Pacific Ocean, followed by 28% in the Indian Ocean, and only 8% in the Atlantic Ocean. Notably, only a global-scale analysis [54] encompassed atolls from both the Pacific and Indian Oceans. Although many studies have been conducted in the Pacific, the proportion of atolls studied relative to their total number shows that the region is comparatively under-studied. In the Indian Ocean, 63% of atolls have been examined, whereas only 15% have been examined in the Pacific and 9% in the Atlantic (Figure 4). This comparison could not be made for reef islands due to the absence of a global database. However, comparing the distribution of studied reef islands with coral reefs reveals that many areas, especially in the Indo-Pacific region and Australia, likely contain numerous reef islands that have not been fully studied (Figure 5).
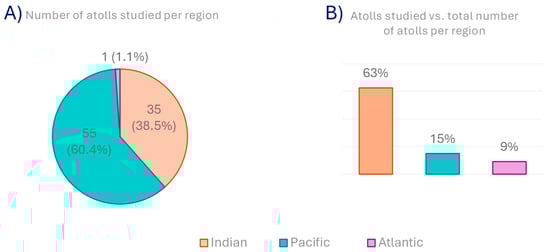
Figure 4.
Summary of atolls studied. (A) number of atolls studied per region, and (B) number of atolls studied versus the total numer of atolls per region.
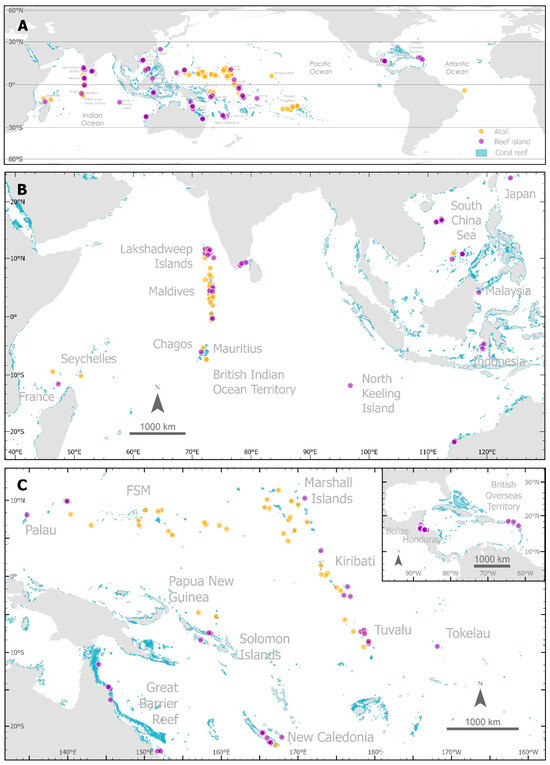
Figure 5.
Maps of atoll and other types of reef islands with published research on shoreline changes in comparison to the distribution of coral reefs around the world (source: Allen Coral Atlas [123]): (A) global map, (B) Indian Ocean and Malay Archipelago, and (C) Western Pacific Ocean with inset map of the Caribbean Sea.
3.2.3. Data Sources and Methods Used to Analyse Reef Island Shoreline Changes
Figure 6 presents an overview of the data sources employed to map shoreline changes on reef islands, illustrating how these sources guide the type of mapping and monitoring conducted, distinguishing between two-dimensional (2D) and three-dimensional (3D) approaches. The following sections provide more details on these data sources, including their temporal and spatial resolutions, as well as shoreline definitions, extraction methods, and associated uncertainties.

Figure 6.
A diagram illustrating how various data sources are currently used for mapping and monitoring reef island shorelines to detect changes over time in 2D and 3D. Data sources include active and passive sensors mounted on various platforms, including tripods, drones, planes, and satellites. The different types of arrows indicate the current (solid) and potential (dashed) use of the different sensor–platform combinations and resulting shoreline mapping.
Data sources. A variety of data sources have been employed to assess shoreline changes in reef islands over time (Figure 7, Table 4). At the most fundamental level, this involves mapping the shoreline at two different points in time and then comparing them to quantify changes. Since temporal analysis relies on datasets from different points in time, the data sources may vary, resulting in the use of a combination of various data sources in change detection studies. These data sources used to delineate shorelines can be categorised into two main types: remotely sensed data and field-based data.
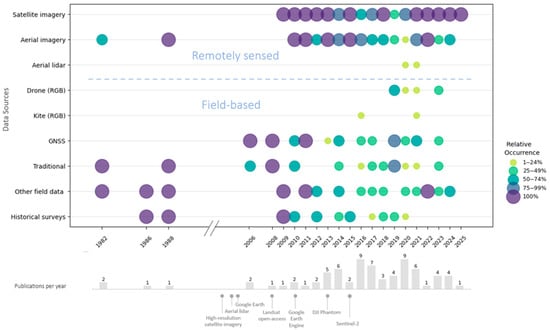
Figure 7.
Data sources used in shoreline change analyses on reef islands, shown as relative occurrence and number of publications per year. Note: traditional data sources are surveying techniques not using GNSSs, like pace-and-compass traverse, levels, and total stations. Other field data may refer to sediment sampling and vegetation surveys, among others.
Traditional survey methods, such as theodolites and total stations, have been consistently used. In contrast, drones have only been used since 2019 for reef island shoreline studies. Overall, remotely sensed data sources, such as aerial and satellite imagery, constitute the majority of data sources. Lidar data have not been explored much, except for a few studies using aerial lidar data but no drone or terrestrial lidar data.
Field-based data refers to data that requires data collection in the field, including elevation measurements taken with a level, a total station, or a Global Navigation Satellite System (GNSS), as well as drone and kite photography. Drone images, although considered remote sensing, are considered field-based here as the operator will be in the field. These types of images are becoming a commonly used tool to create high-resolution 3D products like digital elevation models in many fields, including coastal change applications [9,124].
Remotely sensed data refers to data collected with sensors mounted on platforms such as a satellites, aeroplanes, or drones. While drones are technically a form of remote sensing, they are classified here under field data collection (versus desktop-based analysis) due to their requirement of on-site deployment. The sensors can be passive sensors, like multispectral or hyperspectral optical sensors, or active sensors, such as lidar or radar, which emit and receive their own energy pulses to measure a surface.
Overall, 40% of studies were purely desktop-based, while only 11% were solely based on field data. Many studies (49%) incorporated both remotely sensed and field data. However, in 10 out of the 36 studies that utilised both types of data sources, the field data were used solely for verification or sediment sampling, without being directly incorporated into the shoreline change detection analysis.
The main reason for fewer field-based studies is likely the difficulty associated with collecting field data. Not only can it be highly cost-prohibitive, but it is also time-consuming, as most of the islands are in very remote areas that are by their very nature difficult to reach. In addition, the aerial extent is far more limited than using remotely sensed data. Modern field studies consistently include GNSSs, either as a primary data source, like tracing the shoreline using a GNSS unit, or as a secondary data source by surveying ground control points. Only six studies incorporated drone imagery. The number of published studies using drones is likely to grow, as drones have become increasingly more affordable over the last few years, and research in the coastal field will catch up to this trend.
The most common examples of data from passive sensors in the field of shoreline dynamics are historical aerial photographs and satellite imagery, while for active sensors, they are aerial lidar data. However, on reef islands, the collection of aerial lidar data is less common. For example, only larger islands had lidar data collected in the early 2000s. To our knowledge, the first acquisition of lidar on atoll islands occurred in the Northwestern Hawaiian Islands (Midway Atoll, Kure Atoll, and Pearl and Hermes Atoll) in 2010. The first atoll island nation to acquire lidar data was Tuvalu in 2018. The data was collected as part of the Tuvalu Coastal Adaptation Project [125]. The main reason for this scarcity of lidar data on these small, remote islands is the high cost [31] of mobilising specialised planes to reach these places with relatively low populations, and a lack of airstrips compared to the larger land masses. While satellite radar and lidar, such as IceSAT-2, exist and may be good solutions for data scarcity, they have likely not been used for mapping reef islands due to their coarse resolution. However, future missions might solve this issue.
Data-fusion approaches combining various data sources, like satellite imagery, drone-SfM photogrammetry, and lidar, have not been explored much in reef island shorelines change studies. However, such studies could lead to a much deeper understanding of short-term versus long-term signals by providing long-term data sources (generally 2D and lower-resolution) with short-term data (often 3D and higher-resolution), thereby combining the benefits of the various data sources and maximising the analysis potential. For example, Hamylton et al. [84] used historic maps and aerial photographs, drones, and topographic survey data to reconstruct the 90-year shoreline movement of Low Isles, including changes in the topographic profile between 1973 and 2017. Talavera et al. [88] integrated historical aerial photographs with airborne lidar data, as well as drone and kite SfM-photogrammetry, in their change analysis of a rubble coral island. Cuttler et al. [63] compared shoreline positions and planform areas derived from lidar and satellite imagery. The reasons why data fusion is not commonly employed despite its advantages are likely due to the lack of data and added complexity of the varying resolution and accuracy.
Table 4.
List of sensors and platforms used in reef island shoreline mapping. XXX: highly used; XX: commonly used; X: hardly used. na—not applicable, as in a sensor on a particular platform does not exist for mapping; nf: not feasible due to technology; *: used in shoreline mapping but not on reef islands specifically.
| Sensor/Platform | Satellite | Airborne | Drone | Kite | Mobile | Stationary | Notes | |
|---|---|---|---|---|---|---|---|---|
| Optical imagery | Panchromatic/ RGB | XXX | XXX | X | X | - | - | Stationary methods have been used with surf cameras or people taking pictures at established camera stations like CoastSnap [126], but not on reef islands. |
| Multi- spectral | XXX | - | Not yet | - | - | - | Widely used with satellite data, especially for automated extraction of the water–land interface using the NDWI. | |
| Hyper- spectral | * | * | - | - | - | - | Very few studies have utilised hyperspectral imaging in shoreline mapping; however, it is unlikely to add any extra value for shoreline extraction compared to multispectral imaging as it typically has lower spatial and temporal resolution and requires more complex processing. | |
| Radar | * | * | na | na | na | Has potential for application, but it is expensive and requires specialised knowledge. | ||
| Lidar | * | X | not yet | nf | not yet | not yet | Satellite lidar like IceSat-2 has potential for mapping reef islands, but currently the resolution is too low. | |
| GNSS | na | na | na | na | X | XX | GNSSs have been mounted on vehicles and driven along beaches or mounted on a backpack while traversing beaches. This is generally not possible on remote islands due to lack of cars and environmental protection. However, the most common use of GNSSs is taking single elevation points around the beach. | |
| Spatial resolution |  increases | |||||||
Temporal resolution and coverage. Studies greatly differ in the overall range of time they cover (observation period between the oldest and newest dataset), and number of data points they provide (how many datasets in total). The longer the overall time range of a study with more data points in between, the more insights can generally be gained into the dynamics of the shoreline. The observation period of the studies varies widely from short-term (<3 years with 16%) to medium-term (8–20 years with 19%) and long-term assessments (>20 years with 65%), while the average time span is 43.6 years. The longest time range of 157 years from 1856 to 2013 was evaluated on Rocas Atoll by Costa et al. [59], where they assessed both reef islands and a shingle bank. The oldest sources included in the shoreline change analysis were nautical charts from the 19th century [59,119,121,122]. Most studies (65%) included imagery from two to five different points in time. However, having only two datasets over a long time to measure change might not capture the actual shoreline trend, especially for non-linear shoreline behaviour [127].
Spatial resolution. The spatial resolution determines the detail that can be extracted from the imagery. A spatial resolution of satellite imagery of 10 m will inherently provide less detail than a 5 cm image taken by a drone. The ground resolution varies from tens of metres to sub-metre to centimetre resolution for Landsat and Sentinel imagery to aerial imagery to drone imagery, respectively. The resolution of the georeferenced image is influenced by the quality of the original photograph or map, the scan resolution, and the resampling size (if resampled and not just georeferenced), and affects the accuracy of the shoreline delineation and change detection [73]. The resolution of historical aerial imagery ranges from 0.5 to 2 m, while the resolution of satellite imagery can range from 0.3 m for WorldView-3 to 30 m for Landsat imagery, respectively.
Pre-processing approaches to data sources. Several types of data require further processing before the shoreline can be extracted at different points in time to then analyse the shoreline changes. Whenever aerial or satellite imagery is used as a source, georeferencing is a common task required, especially for historical aerial photographs, to ensure images overlay correctly and minimise errors in quantifying changes. Although satellite imagery is generally pre-registered by the vendor, it often requires co-registration with the other images in the analysis due to positional shifts of several metres. Such misalignment can significantly affect the results when assessing small-scale shoreline changes. Another image pre-processing technique is image enhancement, which can facilitate more accurate feature extraction. For example, Mann and Westphal [110] changed the brightness of images to show more contrast in the shoreline features.
For drone imagery, structure-from-motion (SfM) photogrammetry is an essential processing step to generate usable products for further analysis. It creates a 3D model from overlapping 2D images and can output a point cloud, an orthomosaic, and a digital elevation model (DEM). Although other SfM software is available, all studies in this systematic review involving SfM used exclusively Metashape (formerly called PhotoScan) by Agisoft or Pix4D. Notably, the studies provided very little detail about the processing steps, which can have a significant impact on the positional accuracy of the finished product.
For data acquired from a laser scanner, similarly to SfM photogrammetry, the point cloud can be further processed into a digital elevation model. Aerial lidar data, however, are often delivered with derivative products (like a DEM) by the vendor, making this processing step unnecessary.
For GNSS data, it needs to be post-processed to improve accuracy. While most studies do not explicitly mention this step, it can generally be assumed when mapping or when survey-grade GNSS receivers are used with the Post-Processed Kinematic (PPK) method. Real-time kinematic (RTK) data collection is often preferred by researchers as it does not require post-processing. However, PPK provides slightly higher accuracy than RTK [128]. In most cases, reef islands may not have the capability of absolute real-time correction due to their remoteness and distance to reference stations or established geodetic control points.
Shoreline definition. Shoreline definition is not straightforward since the shoreline is generally not a fixed line and moves every day with the tide, but also seasonally or periodically [33]. Due to the complexity of defining shorelines, shoreline indicators or proxies have long been used.
Common proxies for determining the shoreline from imagery are the vegetation line, base of beach, instantaneous waterline, and wet–dry line (see Figure 8). The vegetation line (VL), also referred to as the stability line, indicates the outer limit of vegetation on an island and is typically used to assess long-term (decadal) changes. In comparison, the base of beach (BB) or beach toe, which is the low-water mark [116], is a better indicator of short-term (seasonal or inter-annual) changes [9].
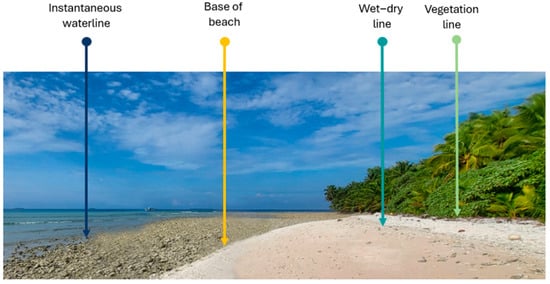
Figure 8.
Examples of shoreline proxies commonly used: instantaneous waterline, base of beach or beach toe, wet–dry line, and vegetation line.
Tidal data like mean sea level (MSL) or mean high-water line (MHWL), while a more exact measure due to its long-term measurement, can only be derived confidently from elevation data and tide gages. However, recent research led by Bishop-Taylor et al. [17] has developed algorithms to not only extract the mean sea level from satellite imagery but also create an intertidal digital elevation model.
The vegetation line, followed by the base of beach, is the most common shoreline proxy used in shoreline change analysis of aerial and satellite images, with over 80% of studies using one of these proxies or a combination of them (Figure 9). For example, Adnan et al. [64] and Testut et al. [67] delineated both VL and BB and compared the changes. Both studies found that these two proxies did not necessarily follow the same trend, and the results should therefore be carefully interpreted.
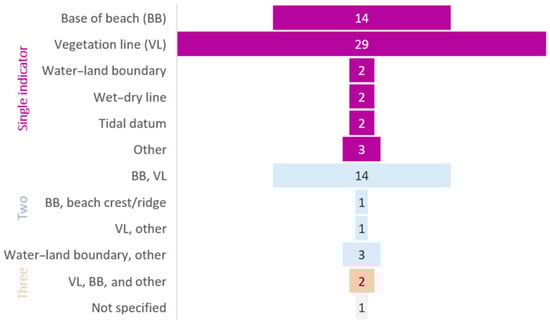
Figure 9.
Shoreline indicators used in the shoreline change studies of reef islands. Some studies used up to three different indicators. The width of the bar shows the number of studies that used a specific indicator(s).
Shoreline extraction. Once the data source and shoreline proxy have been determined, the shoreline needs to be delineated on different dates using either manual, automated, or semi-automated methods. Manual delineation refers to digitising on-screen through visual interpretation by the researcher. Automatic image classification may include techniques such as density slicing or machine learning algorithms. Semi-automated methods require some manual input but are largely automated.
There is a clear relationship between the method of shoreline delineation (manual versus automatic) and data sources used. When historical aerial imagery was employed, even when combined with satellite imagery, shorelines were manually extracted in most of the studies. In studies based solely on satellite imagery, automatic extraction was the main mode of extraction.
When using 3D data, the shoreline itself does not necessarily need to be extracted to analyse changes along the beach. Rather, the entire beach width can be analysed with just two datasets, providing more details than a 2D analysis. However, if the shoreline is needed, a contour line can be extracted using a specific tidal datum, like the mean sea level or mean high-water line.
Types of shoreline change analyses. Shoreline changes over time can be analysed by assessing the difference between two or more time points and can be grouped into two main categories: two-dimensional (2D) and three-dimensional (3D) analysis.
Two-dimensional shoreline change analysis is typically based on either horizontal delineation of the shoreline position over time, also referred to as planform changes, or vertical profile analysis along transects perpendicular to the shoreline, measuring elevation changes.
In most (73%) two-dimensional studies where the shore-‘line’ has been delineated, transects were cast perpendicular to the reference shoreline (which can be either the oldest or youngest) to then assess the net change or change rate. This is most commonly performed with the Digital Shoreline Change Analysis (DSAS) tool that was developed by the U.S. Geological Survey in 1992 and is currently on its 6th version, and is now a stand-alone programme instead of an ArcMap extension [129]. Only a small fraction of the studies (8%) assessing long-term historical changes quantified exclusively planform area changes. These studies only compared the overall island size and qualitative patterns of erosion and accretion, rather than the net retreat or progression rate of certain sections of the shoreline. In very few studies (6%), the vertical profiles were interpolated to create a continuous surface of the beach [59,101].
Three-dimensional change analysis based on GNSSs, lidar [62], or SfM photogrammetry mapping [88,102] has only recently been incorporated into reef island studies since 3D data has become more readily available. To analyse changes in 3D, either the point clouds or the DEMs can be compared. Traditionally, a “difference DEM” was created by subtracting one DEM from the other. In more recent years, algorithms such as Multiscale Model-to-Model Cloud Comparison (M3C2) have been developed to directly compare point clouds (for examples, refer to [130,131]). However, the latter approaches have not been used for reef island mapping.
Morphometrics and other potential driving forces. Shoreline change studies often not only measured the position of the shoreline, but also other metrics that might influence the nature and severity of change, like island size, reef size, elevation, aspect, circularity, and volume. In addition, most studies (53%) examined the potential mechanisms driving shoreline changes. The most common parameters are the position of an island within an atoll and wind and wave conditions. Only a few studies investigated the relationship with reef width (n = 3), vegetation (n = 4), or elevation (n = 7). This is likely due to data restrictions, since vegetation data and topographic surveys are difficult to acquire and are field-based, lidar data on remote islands is still scarce, and topographic surveys using GNSSs are difficult due to the vegetation cover on most islands, which restricts GNSS reception.
Uncertainty. The types of errors assessed in each study vary according to the data source and analysis approach. Under optimal conditions, positional accuracy of data sources (horizontal/vertical) typically ranges from ±0.005/0.011 m for GNSSs [132] to approximately ±1.0 m for georeferenced aerial photo mosaics and high-resolution satellite images [133], ±0.0.01/0.2 m for drone-derived orthomosaics and DEMs with GCPs [134], and ±0.02–1.0/0.02–0.15 m for aerial lidar [26]. The most common errors stemming from the traditional analysis approach of georeferencing historical aerial images and hand-digitising shorelines are from the rectification process, pixel resolution, and digitisation [108]. In a detailed accuracy assessment, Ford et al. [133] estimated the uncertainty of manually digitised shorelines from aerial and satellite imagery to range between ±0.44 m and 10.08 m. For a field-based approach, the error depends on the type of equipment, like a certain GNSS receiver used in addition to the method, such as ground control points and the post-processing technique. However, errors in GNSS post-processed data are hardly ever mentioned. In addition, several studies fail to report or discuss the accuracy of the derived shorelines. Yet, assessing accuracy is a critical step to ensure validity and reliability of the results [135].
Limitations. Common limitations noted were data availability and quality, limited study size, inherent issues of shoreline proxies, and detection of small-scale changes. Data availability was the main limitation mentioned by the studies included in this review [71,76,88,91,136], followed by image quality, specifically spatial resolution, which can introduce large errors in shoreline positioning [51,57,71,73,92,97] and cloud cover [69,79,118]. This often led to various time ranges for different islands within the same study, as data from a single aerial survey or satellite scene did not cover the whole study area. Limited study size may also restrict the generalisation of findings to other areas [74,92,94,100,136].
Another limitation in reef island shoreline change analyses was choosing a shoreline proxy, which can be biassed if manually digitised [64]. The vegetation line may not be an adequate indicator in urban areas [106] or sparsely vegetated areas [113], or for determining sub-decadal changes, as it does not consider changes in the beach [22,61]. Small-scale changes may not be detected or masked by the error margin [51,54,69,71,79].
Two-dimensional shoreline change analysis does not take into account volumetric changes [59,73,77]. As a result, it may not capture changes in the sediment budget and reveal potential causes of erosion or accretion [64,81,96].
Summary. The advantages and disadvantages of the methods to quantify reef island shoreline changes, as discussed above, are summarised in Table 5. For an overview of the advantages and disadvantages of data sources, the reader is referred to Hamylton [31].
Table 5.
Comparison of methods of reef island shoreline change analyses based on the findings of the studies. Note that the 3D point cloud comparison method has not yet been used for reef island settings.
4. Conclusions and Future Work
4.1. Key Findings on Shoreline Change Mapping Techniques
Given their importance to human populations and vulnerability to coastal hazards, shoreline changes have become a major focus of research worldwide. Reef island shorelines, despite representing only a small fraction of global coastlines, are particularly important because their low elevation and limited land area make them especially vulnerable to environmental changes. This review assessed 74 studies focused on reef island shoreline changes to determine commonly used data sources and mapping techniques, with the aim of providing a methodological framework to support future research in this area.
Several key patterns and gaps were revealed in this assessment. While the general methodology for monitoring shorelines is straightforward, it also requires many decisions to be made, which are summarised in Figure 1. Considerable variation in temporal scales, analytical techniques, and reporting of findings and error assessments make comparisons between islands challenging. Most studies rely heavily on satellite and aerial imagery, with limited field data. Despite the advantages of three-dimensional analysis and increasing accessibility of relevant technologies, such approaches remain underutilised. Although most studies have investigated shoreline changes in atolls in the Pacific, the region remains relatively under-studied in proportion to the large number of atolls it encompasses. Reef island shorelines in general have been investigated in various regions; however, global assessment of reef island distribution was not possible due to the absence of a global reef island database.
A major limitation in analysing multi-decadal shoreline changes is the availability of historical aerial images. Having access to images from a greater number of dates would improve temporal resolution and strengthen future assessments. Additionally, having highly overlapping images available could enable the reconstruction of historical 3D surfaces. Unless more images are recovered from archives that have not been well catalogued or made digitally available before, this limitation may persist despite advances in modern technology.
An emerging trend observed in recent reef island studies is a shift from focusing on the actual shoreline changes towards investigating driving factors [22,137] and vulnerability indices like the sensitivity index [62], and risk classification [7], which utilises the outcomes of shoreline change studies and their controlling factors as inputs to classify the vulnerability of individual islands. Although these indices are gaining more traction, Flood [82] created the first sensitivity index in 1986 for cays on the GBR.
When compared to general shoreline change studies, similar trends emerge in the use of remote sensing and tools like DSAS. However, some data sources have not been applied to reef islands, either due to logistical constraints or inadequate spatial resolution relative to the small size of these islands. For example, mainstream shoreline studies most commonly use Landsat satellite imagery [11] while reef island research has relied more on aerial and high-resolution satellite imagery like WorldView or IKONOS, with only a few studies incorporating Landsat data. The application of machine learning remains in its infancy across both domains, but has recently been used to explore drivers of change in reef islands [137]. Overall, reef island shoreline change studies appear to lag behind broader shoreline change research in terms of technological adoptions.
4.2. Limitations of This Review
This review may not have captured all the relevant literature on the topic due to limitations in the selected databases, search terms, and exclusion criteria. Another limitation is the data extraction process, as one might argue that more variables could have been analysed. Some variables, like accuracy reporting or field measurement settings, were initially included but proved too difficult to analyse due to inconsistent or missing reporting across studies. Consequently, these variables were described more qualitatively than quantitatively. Additionally, the results of the individual studies were not analysed, as this review was not intended to be a meta-analysis of reef island shoreline changes but rather a synthesis of the tools and methods used in such studies.
4.3. Directions for Future Research
To facilitate future reef island studies and planning efforts, a comprehensive global database of reef islands should be established. This database should outline the island extents and include key attributes such as names, jurisdictions, and other relevant characteristics.
The rapid evolution and growing accessibility of remote sensing technologies, particularly drones and laser scanners, will facilitate high-resolution, three-dimensional mapping that enhances our understanding of shoreline dynamics. Next-generation lidar satellite missions, like an upcoming iteration of IceSAT-2, are expected to deliver significantly higher spatial and temporal resolution and more accurate 3D data, ideal for mapping remote reef islands. These advancements, combined with growing availability of airborne and drone lidar and the continued expansion of open-access, cloud-computing platforms like Google Earth Engine [25,138], which currently support massive dataset analysis but remain limited to low-resolution satellite imagery, will greatly enhance opportunities for detailed analysis of reef islands shorelines. In the future, integrating platforms that host non-satellite datasets, such as GeoNadir [139] for drone data or OpenTopography [140] for lidar data, into Google Earth Engine would further improve resolution and enable deeper insights across broader regions and at global scales. Similarly, advances in machine learning offer promising opportunities for finding patterns and automating tasks such as the detection of shorelines, which can improve objectivity and reproducibility in delineation methods.
While many reef islands have been studied to date, most lack comprehensive assessments that span both short-term and long-term timescales, potentially obscuring important trends. Future research should adopt a multi-faceted approach that integrates multi-decadal datasets with short-term observations, using both two-dimensional and three-dimensional methods, to better capture the dynamic nature of reef island shorelines and assess their vulnerability.
In summary, we identified several key gaps that future research should address: (1) Developing a global database of reef islands; (2) standardising shoreline change reporting and uncertainty metrics; and (3) integrating short-term data with long-term data.
Author Contributions
Conceptualisation, M.K.; Methodology, M.K.; Software, M.K.; Validation, M.K.; Formal Analysis, M.K.; Investigation, M.K.; Resources, S.R.P. and C.R.; Data Curation, M.K.; Writing—Original Draft Preparation, M.K.; Writing—Review and Editing, M.K., S.R.P., C.R. and D.H.; Visualisation, M.K.; Supervision, S.R.P., C.R. and D.H.; Project Administration, M.K.; Funding Acquisition, M.K. All authors have read and agreed to the published version of the manuscript.
Funding
This research was funded in part by a cooperative agreement with the National Oceanic and Atmospheric Administration, Project NA22OAR4170107, which is sponsored by the University of Guam Sea Grant from the NOAA Office of Sea Grant, Department of Commerce. The views expressed herein are those of the authors and do not necessarily reflect the views of NOAA or any of its sub-agencies. M.K. received an RTP Scholarship through the University of Queensland.
Data Availability Statement
The dataset is available on request from the authors.
Acknowledgments
We thank Kristina Albu for the professional editing of Figure 1 and Figure 6. We also thank Ana Patricia Ruiz Beltrán and the anonymous reviewers for their valuable feedback, which improved the quality of this work. During the preparation of this manuscript, the authors used ChatGPT-4o to assist with writing the Python script for Figure 7 and Figure 9. The authors have reviewed and edited the output and take full responsibility for the content of this publication.
Conflicts of Interest
The authors declare no conflicts of interest.
Abbreviations
The following abbreviations are used in this manuscript:
| 2D | Two-dimensional |
| 3D | Three-dimensional |
| BB | Base of beach |
| DEM | Digital elevation model |
| DSAS | Digital Shoreline Analysis System |
| FSM | Federated States of Micronesia |
| GNSS | Global Navigation Satellite System |
| MSL | Mean sea level |
| MHWL | Mean high-water line |
| PPK | Post-Processed Kinematic |
| RGB | Red, Green, Blue |
| RTK | Real-time Kinematic |
| SfM | Structure-from-motion |
| USGS | U.S. Geological Survey |
| VL | Vegetation line |
References
- Yamano, H.; Chikamori, M. An Overview of the Nature and Dynamics of Reef Islands. Glob. Environ. Res. 2005, 9, 9–20. [Google Scholar]
- Kench, P.S.; McLean, R.F.; Nichol, S.L. New Model of Reef-Island Evolution Maldives, Indian Ocean. Geology 2005, 33, 145–148. [Google Scholar] [CrossRef]
- Bonesso, J.L.; Cuttler, M.V.W.; Browne, N.K.; Mather, C.C.; Paumard, V.; Hiscock, W.T.; Callow, J.N.; O’Leary, M. Reef Island Evolution in a Turbid-Water Coral Reef Province of the Indo-Pacific. Depos. Rec. 2023, 9, 921–934. [Google Scholar] [CrossRef]
- Nunn, P.D.; Kumar, L.; Eliot, I.; McLean, R.F. Classifying Pacific Islands. Geosci. Lett. 2016, 3, 7. [Google Scholar] [CrossRef]
- Coffin, M.F.; Eldholm, O. Indian Ocean Islands, 2nd ed.; Elsevier Ltd.: Amsterdam, The Netherlands, 2021; pp. 700–723. [Google Scholar]
- Woodroffe, C.D. Reef-Island Topography and the Vulnerability of Atolls to Sea-Level Rise. Glob. Planet. Change 2008, 62, 77–96. [Google Scholar] [CrossRef]
- Fellowes, T.E.; Vila-Concejo, A.; Byrne, M.; Bruce, E.; Baker, E. Risk Classification of Low-Lying Coral Reef Islands and Their Exposure to Climate Threats. Sci. Total Environ. 2024, 912, 168787. [Google Scholar] [CrossRef] [PubMed]
- Kench, P.S.; Ford, M.R.; Owen, S.D. Patterns of Island Change and Persistence Offer Alternate Adaptation Pathways for Atoll Nations. Nat. Commun. 2018, 9, 605. [Google Scholar] [CrossRef]
- Kennedy, D.M. A Review of the Vulnerability of Low-Lying Reef Island Landscapes to Climate Change and Ways Forward for Sustainable Management. Ocean Coast. Manag. 2024, 249, 106984. [Google Scholar] [CrossRef]
- Kench, P.S.; Liang, C.; Ford, M.R.; Owen, S.D.; Aslam, M.; Ryan, E.J.; Turner, T.; Beetham, E.; Dickson, M.E.; Stephenson, W.; et al. Reef Islands Have Continually Adjusted to Environmental Change over the Past Two Millennia. Nat. Commun. 2023, 14, 508. [Google Scholar] [CrossRef]
- Ankrah, J.; Monteiro, A.; Madureira, H. Bibliometric Analysis of Data Sources and Tools for Shoreline Change Analysis and Detection. Sustainability 2022, 14, 4895. [Google Scholar] [CrossRef]
- IPCC. Climate Change 2023: Synthesis Report. Contribution of Working Groups I, II and III to the Sixth Assessment Report of the Intergovernmental Panel on Climate Change; Core Writing Team, Lee, H., Romero, J., Eds.; IPCC: Geneva, Switzerland, 2023. [Google Scholar] [CrossRef]
- Luijendijk, A.; Hagenaars, G.; Ranasinghe, R.; Baart, F.; Donchyts, G.; Aarninkhof, S. The State of the World’s Beaches. Sci. Rep. 2018, 8, 6641. [Google Scholar] [CrossRef]
- Fletcher, C.H.; Romine, B.M.; Genz, A.S.; Barbee, M.M.; Dyer, M.; Anderson, T.R.; Lim, S.C.; Vitousek, S.; Bochicchio, C.; Richmond, B.M. National Assessment of Shoreline Change: Historical Shoreline Change in the Hawaiian Islands; U.S. Department of the Interior; U.S. Geological Survey: Reston, VA, USA, 2012. Available online: http://pubs.usgs.gov/of/2011/1051 (accessed on 30 November 2025).
- Hapke, C.J.; Himmelstoss, E.; Kratzmann, M.G.; Thieler, E.R.; List, J.H. Historical Shoreline Change Assessment for the U.S. New England and Mid-Atlantic Coasts; U.S. Geological Survey: Reston, VA, USA, 2010. [Google Scholar]
- Sabour, S.; Brown, S.; Nicholls, R.J.; Haigh, I.D.; Luijendijk, A.P. Multi-Decadal Shoreline Change in Coastal Natural World Heritage Sites: A Global Assessment. Environ. Res. Lett. 2020, 15, 104047. [Google Scholar] [CrossRef]
- Bishop-Taylor, R.; Nanson, R.; Sagar, S.; Lymburner, L. Mapping Australia’s Dynamic Coastline at Mean Sea Level Using Three Decades of Landsat Imagery. Remote Sens. Environ. 2021, 267, 112734. [Google Scholar] [CrossRef]
- Vos, K.; Splinter, K.D.; Harley, M.D.; Simmons, J.A.; Turner, I.L. CoastSat: A Google Earth Engine-Enabled Python Toolkit to Extract Shorelines from Publicly Available Satellite Imagery. Environ. Model. Softw. 2019, 122, 104528. [Google Scholar] [CrossRef]
- Duvat, V.K.E. A Global Assessment of Atoll Island Planform Changes over the Past Decades. WIREs Clim. Change 2019, 10, e557. [Google Scholar] [CrossRef]
- Hamylton, S.M.; Puotinen, M. A Meta-Analysis of Reef Island Response to Environmental Change on the Great Barrier Reef. Earth Surf. Process. Landf. 2015, 40, 1006–1016. [Google Scholar] [CrossRef]
- Collin, A.; Duvat, V.; Pillet, V.; Salvat, B.; James, D. Understanding Interactions between Shoreline Changes and Reef Outer Slope Morphometry on Takapoto Atoll (French Polynesia). J. Coast. Res. 2018, 85, 496–500. [Google Scholar] [CrossRef]
- Duvat, V.K.E.; Salvat, B.; Salmon, C. Drivers of Shoreline Change in Atoll Reef Islands of the Tuamotu Archipelago, French Polynesia. Glob. Planet. Change 2017, 158, 134–154. [Google Scholar] [CrossRef]
- East, H.K.; Perry, C.T.; Beetham, E.P.; Kench, P.S.; Liang, Y. Modelling Reef Hydrodynamics and Sediment Mobility under Sea Level Rise in Atoll Reef Island Systems. Glob. Planet. Change 2020, 192, 103196. [Google Scholar] [CrossRef]
- Kench, P.S.; Mann, T. Reef Island Evolution and Dynamics: Insights from the Indian and Pacific Oceans and Perspectives for the Spermonde Archipelago. Front. Mar. Sci. 2017, 4, 145. [Google Scholar] [CrossRef]
- Sun, S.; Xue, Q.; Xing, X.; Zhao, H.; Zhang, F. Remote Sensing Image Interpretation for Coastal Zones: A Review. Remote Sens. 2024, 16, 4701. [Google Scholar] [CrossRef]
- Wang, J.; Wang, L.; Feng, S.; Peng, B.; Huang, L.; Fatholahi, S.N.; Tang, L.; Li, J. An Overview of Shoreline Mapping by Using Airborne LiDAR. Remote Sens. 2023, 15, 253. [Google Scholar] [CrossRef]
- Vitousek, S.; Buscombe, D.; Vos, K.; Barnard, P.L.; Ritchie, A.C.; Warrick, J.A. The Future of Coastal Monitoring through Satellite Remote Sensing. Camb. Prism. Coast. Futures 2023, 1, e4. [Google Scholar] [CrossRef]
- Tsiakos, C.-A.D.; Chalkias, C. Use of Machine Learning and Remote Sensing Techniques for Shoreline Monitoring: A Review of Recent Literature. Appl. Sci. 2023, 13, 3268. [Google Scholar] [CrossRef]
- Mutagi, S.; Yadav, A.; Hiremath, C.G. Shoreline Change Model: A Review. In Sustainability Trends and Challenges in Civil Engineering; Nandagiri, L., Narasimhan, M.C., Marathe, S., Dinesh, S.V., Eds.; Springer: Cham, Switzerland, 2022; pp. 1019–1031. [Google Scholar]
- Parthasarathy, K.S.S.; Deka, P.C. Remote Sensing and GIS Application in Assessment of Coastal Vulnerability and Shoreline Changes: A Review. ISH J. Hydraul. Eng. 2021, 27, 588–600. [Google Scholar] [CrossRef]
- Hamylton, S.M. Mapping Coral Reef Environments: A Review of Historical Methods, Recent Advances and Future Opportunities. Prog. Phys. Geogr. 2017, 41, 803–833. [Google Scholar] [CrossRef]
- Fairley, I.; Thomas, T.; Phillips, M.; Reeve, D.; Makowski, C.; Finkl, C.W. Terrestrial Laser Scanner Techniques for Enhancement in Understanding of Coastal Environments. In Coastal Research Library; Springer International Publishing: Cham, Switzerland, 2016; pp. 273–289. [Google Scholar]
- Boak, E.H.; Turner, I.L. Shoreline Definition and Detection: A Review. J. Coast. Res. 2005, 21, 688–703. [Google Scholar] [CrossRef]
- Page, M.J.; Moher, D.; Bossuyt, P.M.; Boutron, I.; Hoffmann, T.C.; Mulrow, C.D.; Shamseer, L.; Tetzlaff, J.M.; Akl, E.A.; Brennan, S.E.; et al. PRISMA 2020 Explanation and Elaboration: Updated Guidance and Exemplars for Reporting Systematic Reviews. BMJ 2021, 372, n160. [Google Scholar] [CrossRef] [PubMed]
- Pickering, C.; Byrne, J. The Benefits of Publishing Systematic Quantitative Literature Reviews for PhD Candidates and Other Early-Career Researchers. High. Educ. Res. Dev. 2014, 33, 534–548. [Google Scholar] [CrossRef]
- Madi Moussa, R.; Fogg, L.; Bertucci, F.; Calandra, M.; Collin, A.; Aubanel, A.; Polti, S.; Benet, A.; Salvat, B.; Galzin, R.; et al. Long-Term Coastline Monitoring on a Coral Reef Island (Moorea, French Polynesia). Ocean Coast. Manag. 2019, 180, 104928. [Google Scholar] [CrossRef]
- Zainuddin, S.N.H.; Safuan, C.D.M.; Zakaria, J.; Saengsupavanich, C.; Ramli, M.Z.; Ali, A.; Bachok, Z.; Shariful, F.; Ariffin, A.S.T.; Khalil, I.; et al. Impact of Storm Pabuk on a Monsoon Coral Beach: Bidong Island, Terengganu (Malaysia). Mar. Geol. 2025, 481, 107495. [Google Scholar] [CrossRef]
- Andréfouët, S.; Muller-Karger, F.E.; Robinson, J.A.; Kranenburg, C.J.; Torres-Pulliza, D.; Spraggins, S.A.; Murch, B. Global Assessment of Modern Coral Reef Extent and Diversity for Regional Science and Management Applications: A View from Space. In Proceedings of the 10th International Coral Reef Symposium, Okinawa, Japan, 28 June–2 July 2004; Volume 1, pp. 1732–1745. [Google Scholar]
- Andréfouët, S.; Paul, M. Atolls of the World: A Reappraisal from an Optical Remote Sensing and Global Mapping Perspective. Mar. Pollut. Bull. 2023, 194, 115400. [Google Scholar] [CrossRef]
- Goldberg, W.M. Atolls of the World: Revisiting the Original Checklist. Atoll Res. Bull. 2016, 610, 1–47. [Google Scholar] [CrossRef]
- Goldberg, W.M.; Rankey, E.C. A Revision and Critique of Atoll Numbers Based on Satellite Imagery. Pac. Sci. 2025, 79, 105–230. [Google Scholar] [CrossRef]
- Sayre, R. Global Islands: U.S. Geological Survey Data Release; U.S. Geological Survey: Reston, VA, USA, 2023. [Google Scholar]
- Mudiyanselage, S.D.; Dai, C.; Howat, I.M.; Larour, E.; Husby, E. A Global High Resolution Coastline Database from Satellite Imagery. Sci. Data 2025, 12, 812. [Google Scholar] [CrossRef] [PubMed]
- Andréfouët, S.; Bionaz, O. Lessons from a Global Remote Sensing Mapping Project: A Review of the Impact of the Millennium Coral Reef Mapping Project for Science and Management. Sci. Total Environ. 2021, 776, 145987. [Google Scholar] [CrossRef]
- Woodroffe, C.D.; McLean, R.F.; Smithers, S.G.; Lawson, E.M. Atoll Reef-Island Formation and Response to Sea-Level Change: West Island, Cocos (Keeling) Islands. Mar. Geol. 1999, 160, 85–104. [Google Scholar] [CrossRef]
- McLean, R.F.; Woodroffe, C.D. Coral Atoll Development: A Holocene Perspective on Response to Sea-Level Change. Pac. Sci. 1992, 46, 376. [Google Scholar]
- Woodroffe, C.D.; McLean, R.F. Pleistocene Morphology and Holocene Emergence of Christmas (Kiritimati) Island, Pacific Ocean. Coral Reefs 1998, 17, 235–248. [Google Scholar] [CrossRef]
- Carter, B.; Woodroffe, C.D. Coastal Evolution: Late Quaternary Shoreline Morphodynamics; Cambridge University Press: Cambridge, UK, 1994. [Google Scholar]
- Kench, P.S.; Brander, R.W. Response of Reef Island Shorelines to Seasonal Climate Oscillations: South Maalhosmadulu Atoll, Maldives. J. Geophys. Res. 2006, 111, F01001. [Google Scholar] [CrossRef]
- Kench, P.S.; McLean, R.F.; Brander, R.W.; Nichol, S.L.; Smithers, S.G.; Ford, M.R.; Parnell, K.E.; Aslam, M. Geological Effects of Tsunami on Mid-Ocean Atoll Islands: The Maldives before and after the Sumatran Tsunami. Geology 2006, 34, 177–180. [Google Scholar] [CrossRef]
- Webb, A.P.; Kench, P.S. The Dynamic Response of Reef Islands to Sea-Level Rise: Evidence from Multi-Decadal Analysis of Island Change in the Central Pacific. Glob. Planet. Change 2010, 72, 234–246. [Google Scholar] [CrossRef]
- Oppenheimer, M.; Glavovic, B.C.; Hinkel, J.; van de Wal, R.; Magnan, A.K.; Abd-Elgawad, A.; Cai, R.; Cifuentes-Jara, M.; DeConto, R.M.; Ghosh, T.; et al. Sea Level Rise and Implications for Low-Lying Islands, Coasts and Communities. In IPCC Special Report on the Ocean and Cryosphere in a Changing Climate; Pörtner, H.-O., Roberts, D.C., Masson-Delmotte, V., Zhai, P., Tignor, M., Poloczanska, E., Mintenbeck, K., Alegría, A., Nicolai, M., Okem, A., et al., Eds.; IPCC: Geneva, Switzerland, 2019. [Google Scholar]
- Mycoo, M.; Wairiu, M.; Campbell, D.; Duvat, V.; Golbuu, Y.; Maharaj, S.; Nalau, J.; Nunn, P.; Pinnegar, J.; Warrick, O. Small Islands. In Climate Change 2022: Impacts, Adaptation and Vulnerability; Cambridge University Press: Cambridge, UK; New York, NY, USA, 2022. [Google Scholar] [CrossRef]
- Holdaway, A.; Ford, M.; Owen, S. Global-Scale Changes in the Area of Atoll Islands during the 21st Century. Anthropocene 2021, 33, 100282. [Google Scholar] [CrossRef]
- Kench, P.S.; Sengupta, M.; Ford, M.R.; Owen, S.D. Island Change Framework Defines Dominant Modes of Atoll Island Dynamics in Response to Environmental Change. Commun. Earth Environ. 2024, 5, 585. [Google Scholar] [CrossRef]
- Stoddart, D.R.; Fosberg, F.R.; Spellman, D.L. Cays of the Belize Barrier Reef and Lagoon. Atoll Res. Bull. 1982, 256, 1–73. [Google Scholar] [CrossRef]
- Houser, C.; D’Ambrosio, T.; Bouchard, C.; Heyman, W.; Darbonne, K.; Kuykendall, S. Erosion and Reorientation of the Sapodilla Cays, Mesoamerican Reef Belize from 1960 to 2012. Phys. Geogr. 2014, 35, 335–354. [Google Scholar] [CrossRef]
- Stoddart, D.R.; Fosberg, F.T.; Sachet, M.H. Ten Years of Change on the Glover’s Reef Cays. Atoll Res. Bull. 1982, 257, 1–17. [Google Scholar] [CrossRef]
- Costa, M.B.; Macedo, E.C.; Siegle, E. Planimetric and Volumetric Changes of Reef Islands in Response to Wave Conditions. Earth Surf. Process. Landf. 2017, 42, 2663–2678. [Google Scholar] [CrossRef]
- Cambers, G.; Wynne, S.P. Beach Changes and Associated Ecosystem Services in Anguilla, West Indies, 1992–2014. Aquat. Ecosyst. Health Manag. 2019, 22, 193–204. [Google Scholar] [CrossRef]
- Husband, E.; East, H.K.; Hocking, E.P.; Guest, J. Honduran Reef Island Shoreline Change and Planform Evolution over the Last 15 Years: Implications for Reef Island Monitoring and Futures. Remote Sens. 2023, 15, 4787. [Google Scholar] [CrossRef]
- Bonesso, J.L.; Cuttler, M.V.W.; Browne, N.; Hacker, J.; O’Leary, M. Assessing Reef Island Sensitivity Based on LiDAR-Derived Morphometric Indicators. Remote Sens. 2020, 12, 3033. [Google Scholar] [CrossRef]
- Cuttler, M.V.W.; Vos, K.; Branson, P.; Hansen, J.E.; O’Leary, M.; Browne, N.K.; Lowe, R.J. Interannual Response of Reef Islands to Climate-Driven Variations in Water Level and Wave Climate. Remote Sens. 2020, 12, 4089. [Google Scholar] [CrossRef]
- Adnan, F.A.F.; Hamylton, S.M.; Woodroffe, C.D. A Comparison of Shoreline Changes Estimated Using the Base of Beach and Edge of Vegetation Line at North Keeling Island. J. Coast. Res. 2016, 75, 967–971. [Google Scholar] [CrossRef]
- Wu, M.Y.; Duvat, V.K.E.; Purkis, S.J. Multi-Decadal Atoll-Island Dynamics in the Indian Ocean Chagos Archipelago. Glob. Planet. Change 2021, 202, 103519. [Google Scholar] [CrossRef]
- Hamylton, S.; East, H. A Geospatial Appraisal of Ecological and Geomorphic Change on Diego Garcia Atoll, Chagos Islands (British Indian Ocean Territory). Remote Sens. 2012, 4, 3444–3461. [Google Scholar] [CrossRef]
- Testut, L.; Duvat, V.; Ballu, V.; Fernandes, R.M.S.; Pouget, F.; Salmon, C.; Dyment, J. Shoreline Changes in a Rising Sea Level Context: The Example of Grande Glorieuse, Scattered Islands, Western Indian Ocean. Acta Oecol. 2016, 72, 110–119. [Google Scholar] [CrossRef]
- Suganya, G.M.D.; Deepika, B.; Madhumitha, R.; Rajakumari, S.; Purvaja, R.; Ramesh, R. Planform Island Change Assessment for Inhabited Lakshadweep Islands. Nat. Hazards 2019, 98, 735–750. [Google Scholar] [CrossRef]
- Menon, S.; Khanna, P.; Misra, S.K.; Jorry, S.J. Decadal Timescale Evolution of Coral Islands: Insights from Lakshadweep Archipelago. Front. Mar. Sci. 2024, 11, 1431655. [Google Scholar] [CrossRef]
- Asir, N.G.G.; Kumar, P.D.; Arasamuthu, A.; Mathews, G.; Raj, K.D.; Kumar, T.K.A.; Bilgi, D.S.; Edward, J.K.P. Eroding Islands of Gulf of Mannar, Southeast India: A Consequence of Long-Term Impact of Coral Mining and Climate Change. Nat. Hazards 2020, 103, 103–119. [Google Scholar] [CrossRef]
- Duvat, V.K.E. Human-Driven Atoll Island Expansion in the Maldives. Anthropocene 2020, 32, 100265. [Google Scholar] [CrossRef]
- David, C.G.; Schlurmann, T. Hydrodynamic Drivers and Morphological Responses on Small Coral Islands—The Thoondu Spit on Fuvahmulah, the Maldives. Front. Mar. Sci. 2020, 7, 538675. [Google Scholar] [CrossRef]
- Aslam, M.; Kench, P.S. Reef Island Dynamics and Mechanisms of Change in Huvadhoo Atoll, Republic of Maldives, Indian Ocean. Anthropocene 2017, 18, 57–68. [Google Scholar] [CrossRef]
- Carruthers, L.; East, H.; Ersek, V.; Suggitt, A.; Campbell, M.; Lee, K.; Naylor, V.; Scurrah, D.; Taylor, L. Coral Reef Island Shoreline Change and the Dynamic Response of the Freshwater Lens, Huvadhoo Atoll, Maldives. Front. Mar. Sci. 2023, 10, 1070217. [Google Scholar] [CrossRef]
- Petrie, S.B.; Hilton, M.J.; Konlechner, T.M.; Borrie, D.R. Does Tidal Phase Determine Successful Plant Colonisation of Atoll Lagoon Islands in the Maldives? Estuar. Coast. Shelf Sci. 2023, 293, 108480. [Google Scholar] [CrossRef]
- Kench, P.S.; Nichol, S.L.; Smithers, S.G.; McLean, R.F.; Brander, R.W. Tsunami as Agents of Geomorphic Change in Mid-Ocean Reef Islands. Geomorphology 2008, 95, 361–383. [Google Scholar] [CrossRef]
- Beetham, E.P.; Kench, P.S. Wave Energy Gradients and Shoreline Change on Vabbinfaru Platform, Maldives. Geomorphology 2014, 209, 98–110. [Google Scholar] [CrossRef]
- Constance, A.; Bunbury, N.; Lack, N.; Nebiker, S.; Obura, D.; Fleischer-Dogley, F.; Schaepman-Strub, G. Low Average Shoreline Change Rate in 51 Years on the Raised Aldabra Atoll. Sci. Rep. 2024, 14, 12. [Google Scholar] [CrossRef]
- Duvat, V.K.E.; Volto, N.; Salmon, C. Impacts of Category 5 Tropical Cyclone Fantala (April 2016) on Farquhar Atoll, Seychelles Islands, Indian Ocean. Geomorphology 2017, 298, 41–62. [Google Scholar] [CrossRef]
- Volto, N.; Duvat, V.K.E. Applying Directional Filters to Satellite Imagery for the Assessment of Tropical Cyclone Impacts on Atoll Islands. J. Coast. Res. 2020, 36, 732–740. [Google Scholar] [CrossRef]
- Lazarus, E.; Duce, S.; Lewis, S.; Smithers, S. The Reef Island Geomorphic Activity Assessment: A New Approach to Quantify Cay Geomorphic Change. Glob. Planet. Change 2025, 247, 104743. [Google Scholar] [CrossRef]
- Flood, P.G. Sensitivity of Coral Cays to Climatic Variations, Southern Great Barrier Reef, Australia. Coral Reefs 1986, 5, 13–18. [Google Scholar] [CrossRef]
- Flood, P.G. Understanding the Reasons for the Reorientation of Heron Island, a Coral Sand Cay, Great Barrier Reef, Australia. In Reefs in Space and Time: Recognizing David Stoddart’s Contribution to Coral Reef Science; Smithsonian Institution Scholarly Press: Washington, DC, USA, 2018. [Google Scholar]
- Hamylton, S.M.; McLean, R.; Lowe, M.; Adnan, F.A.F. Ninety Years of Change on a Low Wooded Island, Great Barrier Reef. R. Soc. Open Sci. 2019, 6, 181314. [Google Scholar] [CrossRef]
- Hamylton, S.M.; Nurdin, N.; Carvalho, R.C.; Jompa, J.J.; Akbar As, M.; Fitrah, M.N.; Lanuru, M.; Amri, K. Mangrove and Sand Cay Dynamics on Australian and Indonesian Low Wooded Islands: A 45-Year Comparison of Changes from Remote Sensing. Estuar. Coast. Shelf Sci. 2020, 245, 106912. [Google Scholar] [CrossRef]
- Bryson, M.; Duce, S.; Harris, D.; Webster, J.M.; Thompson, A.; Vila-Concejo, A.; Williams, S.B. Geomorphic Changes of a Coral Shingle Cay Measured Using Kite Aerial Photography. Geomorphology 2016, 270, 1–8. [Google Scholar] [CrossRef]
- Shannon, A.M.; Power, H.E.; Webster, J.M.; Vila-Concejo, A. Evolution of Coral Rubble Deposits on a Reef Platform as Detected by Remote Sensing. Remote Sens. 2013, 5, 1–18. [Google Scholar] [CrossRef]
- Talavera, L.; Vila-Concejo, A.; Webster, J.M.; Smith, C.; Duce, S.; Fellowes, T.E.; Salles, T.; Harris, D.L.; Hill, J.; Figueira, W.; et al. Morphodynamic Controls for Growth and Evolution of a Rubble Coral Island. Remote Sens. 2021, 13, 1582. [Google Scholar] [CrossRef]
- Dawson, J.L.; Smithers, S.G. Shoreline and Beach Volume Change between 1967 and 2007 at Raine Island, Great Barrier Reef, Australia. Glob. Planet. Change 2010, 72, 141–154. [Google Scholar] [CrossRef]
- Dawson, J.L. Multi-decadal shoreline morphodynamics of a shelf-edge reef island, Great Barrier Reef: Implications for future island persistence. Geomorphology 2021, 392, 107920. [Google Scholar] [CrossRef]
- Yates, M.L.; Le Cozannet, G.; Garcin, M.; Salaï, E.; Walker, P. Multidecadal Atoll Shoreline Change on Manihi and Manuae, French Polynesia. J. Coast. Res. 2013, 29, 870–882. [Google Scholar] [CrossRef]
- Gairin, E.; Collin, A.; James, D.; Dolique, F.; Jeanson, M.; Lecchini, D. Multi-Decadal Coastal Evolution of Remote Pacific Islands: Armouring of Taha’a, Raiatea, Maupiti, and Rangiroa (French Polynesia). Reg. Environ. Change 2022, 22, 119. [Google Scholar] [CrossRef]
- Duvat, V.K.E.; Pillet, V. Shoreline Changes in Reef Islands of the Central Pacific: Takapoto Atoll, Northern Tuamotu, French Polynesia. Geomorphology 2017, 282, 96–118. [Google Scholar] [CrossRef]
- Le Cozannet, G.; Garcin, M.; Petitjean, L.; Cazenave, A.; Becker, M.; Meyssignac, B.; Walker, P.; Devilliers, C.; Le Brun, O.; Lecacheux, S.; et al. Exploring the Relation between Sea Level Rise and Shoreline Erosion Using Sea Level Reconstructions: An Example in French Polynesia. J. Coast. Res. 2013, 65, 2137–2142. [Google Scholar] [CrossRef]
- Sengupta, M.; Ford, M.R.; Kench, P.S. Shoreline Changes in Coral Reef Islands of the Federated States of Micronesia since the Mid-20th Century. Geomorphology 2021, 377, 107584. [Google Scholar] [CrossRef]
- Kappelmann, Y.; Sengupta, M.; Mann, T.; Stuhr, M.; Kneer, D.; Jompa, J.; Westphal, H. Island Accretion within a Degraded Reef Ecosystem Suggests Adaptability to Ecological Transitions. Sediment. Geol. 2024, 468, 106675. [Google Scholar] [CrossRef]
- Kayanne, H.; Aoki, K.; Suzuki, T.; Hongo, C.; Yamano, H.; Ide, Y.; Iwatsuka, Y.; Takahashi, K.; Katayama, H.; Sekimoto, T.; et al. Eco-Geomorphic Processes That Maintain a Small Coral Reef Island: Ballast Island in the Ryukyu Islands, Japan. Geomorphology 2016, 271, 84–93. [Google Scholar] [CrossRef]
- Sengupta, M.; Ford, M.R.; Kench, P.S. Multi-Decadal Planform Changes on Coral Reef Islands from Atolls and Mid-Ocean Reef Platforms of the Equatorial Pacific Ocean: Gilbert Islands, Republic of Kiribati. Geomorphology 2021, 389, 107831. [Google Scholar] [CrossRef]
- Rankey, E.C. Nature and Stability of Atoll Island Shorelines: Gilbert Island Chain, Kiribati, Equatorial Pacific. Sedimentology 2011, 58, 1831–1859. [Google Scholar] [CrossRef]
- Biribo, N.; Woodroffe, C.D. Historical Area and Shoreline Change of Reef Islands around Tarawa Atoll, Kiribati. Sustain. Sci. 2013, 8, 345–362. [Google Scholar] [CrossRef]
- Ellison, J.C.; Mosley, A.; Helman, M. Assessing Atoll Shoreline Condition to Guide Community Management. Ecol. Indic. 2017, 75, 321–330. [Google Scholar] [CrossRef]
- Lowe, M.K.; Adnan, F.A.F.; Hamylton, S.M.; Carvalho, R.C.; Woodroffe, C.D. Assessing Reef-Island Shoreline Change Using UAV-Derived Orthomosaics and Digital Surface Models. Drones 2019, 3, 44. [Google Scholar] [CrossRef]
- Ford, M.R.; Kench, P.S.; Owen, S.D.; Hua, Q. Active Sediment Generation on Coral Reef Flats Contributes to Recent Reef Island Expansion. Geophys. Res. Lett. 2020, 47, e2020GL088752. [Google Scholar] [CrossRef]
- Ford, M.R.; Kench, P.S. Multi-Decadal Shoreline Changes in Response to Sea Level Rise in the Marshall Islands. Anthropocene 2015, 11, 14–24. [Google Scholar] [CrossRef]
- Ford, M.R.; Kench, P.S. Spatiotemporal Variability of Typhoon Impacts and Relaxation Intervals on Jaluit Atoll, Marshall Islands. Geology 2016, 44, 159–162. [Google Scholar] [CrossRef]
- Ford, M. Shoreline Changes on an Urban Atoll in the Central Pacific Ocean: Majuro Atoll, Marshall Islands. J. Coast. Res. 2012, 28, 11–22. [Google Scholar] [CrossRef]
- Ford, M.R.; Kench, P.S. Formation and Adjustment of Typhoon-Impacted Reef Islands Interpreted from Remote Imagery: Nadikdik Atoll, Marshall Islands. Geomorphology 2014, 214, 216–222. [Google Scholar] [CrossRef]
- Ford, M. Shoreline Changes Interpreted from Multi-Temporal Aerial Photographs and High Resolution Satellite Images: Wotje Atoll, Marshall Islands. Remote Sens. Environ. 2013, 135, 130–140. [Google Scholar] [CrossRef]
- Garcin, M.; Vendé-Leclerc, M.; Maurizot, P.; Le Cozannet, G.; Robineau, B.; Nicolae-Lerma, A. Lagoon Islets as Indicators of Recent Environmental Changes in the South Pacific: The New Caledonian Example. Cont. Shelf Res. 2016, 122, 120–140. [Google Scholar] [CrossRef]
- Mann, T.; Westphal, H. Assessing Long-Term Changes in the Beach Width of Reef Islands Based on Temporally Fragmented Remote Sensing Data. Remote Sens. 2014, 6, 6961–6987. [Google Scholar] [CrossRef]
- Mann, T.; Westphal, H. Multi-Decadal Shoreline Changes on Takú Atoll, Papua New Guinea: Observational Evidence of Early Reef Island Recovery after the Impact of Storm Waves. Geomorphology 2016, 257, 75–84. [Google Scholar] [CrossRef]
- Smithers, S.G.; Hoeke, R.K. Geomorphological Impacts of High Latitude Storm Waves on Low Latitude Reef Islands: Observations of the December 2008 Event on Nukutoa, Takuu, Papua New Guinea. Geomorphology 2014, 222, 106–121. [Google Scholar] [CrossRef]
- Mann, T.; Bayliss-Smith, T.; Westphal, H. A Geomorphic Interpretation of Shoreline Change Rates on Reef Islands. J. Coast. Res. 2016, 32, 500–507. [Google Scholar] [CrossRef]
- Albert, S.; Leon, J.X.; Grinham, A.R.; Church, J.A.; Gibbes, B.R.; Woodroffe, C.D. Interactions between Sea-Level Rise and Wave Exposure on Reef Island Dynamics in the Solomon Islands. Environ. Res. Lett. 2016, 11, 054011. [Google Scholar] [CrossRef]
- Bayliss-Smith, T.P. The Role of Hurricanes in the Development of Reef Islands, Ontong Java Atoll, Solomon Islands. Geogr. J. 1988, 154, 377–391. [Google Scholar] [CrossRef]
- Liu, J.; Huang, R.; Yu, K.; Zou, B. How Lime-Sand Islands in the South China Sea Have Responded to Global Warming over the Last 30 Years: Evidence from Satellite Remote Sensing Images. Geomorphology 2020, 371, 107423. [Google Scholar] [CrossRef]
- Zhou, S.; Shi, Q.; Yang, H.; Wang, L.; Zhang, X.; Liu, X.; Tan, F.; Yan, P. Geomorphic Development of an Unvegetated Shingle Cay on the Ximen Reef in the Southern South China Sea. Palaeogeogr. Palaeoclimatol. Palaeoecol. 2023, 609, 111314. [Google Scholar] [CrossRef]
- Hisabayashi, M.; Rogan, J.; Elmes, A. Quantifying Shoreline Change in Funafuti Atoll, Tuvalu Using a Time Series of Quickbird, Worldview and Landsat Data. GISci. Remote Sens. 2018, 55, 307–330. [Google Scholar] [CrossRef]
- Kench, P.S.; Thompson, D.; Ford, M.R.; Ogawa, H.; McLean, R.F. Coral Islands Defy Sea-Level Rise over the Past Century: Records from a Central Pacific Atoll. Geology 2015, 43, 515–518. [Google Scholar] [CrossRef]
- Kench, P.S.; Beetham, E.; Bosserelle, C.; Kruger, J.; Pohler, S.M.L.; Coco, G.; Ryan, E.J. Nearshore Hydrodynamics, Beachface Cobble Transport and Morphodynamics on a Pacific Atoll Motu. Mar. Geol. 2017, 389, 17–31. [Google Scholar] [CrossRef]
- Kench, P.S.; Chan, J.; Owen, S.D.; McLean, R.F. The Geomorphology, Development and Temporal Dynamics of Tepuka Island, Funafuti Atoll, Tuvalu. Geomorphology 2014, 222, 46–58. [Google Scholar] [CrossRef]
- Collen, J.D.; Garton, D.W.; Gardner, J.P.A. Shoreline Changes and Sediment Redistribution at Palmyra Atoll (Equatorial Pacific Ocean) 1874–Present. J. Coast. Res. 2009, 25, 711–722. [Google Scholar] [CrossRef]
- Allen Coral Atlas. Available online: https://allencoralatlas.org/ (accessed on 30 November 2025).
- Over, J.-S.R.; Ritchie, A.C.; Kranenburg, C.J.; Brown, J.A.; Buscombe, D.D.; Noble, T.; Sherwood, C.R.; Warrick, J.A.; Wernette, P.A. Processing Coastal Imagery with Agisoft Metashape Professional Edition, Version 1.6: Structure from Motion Workflow Documentation; Open-File Report; U.S. Geological Survey: Reston, VA, USA, 2021. [Google Scholar] [CrossRef]
- Wandres, M.; Espejo, A.; Sovea, T.; Tetoa, S.; Malologa, F.; Webb, A.; Lewis, J.; Lee, G.; Damlamian, H. A National-Scale Coastal Flood Hazard Assessment for the Atoll Nation of Tuvalu. Earth’s Future 2024, 12, e2023EF003924. [Google Scholar] [CrossRef]
- Harley, M.D.; Kinsela, M.A. CoastSnap: A Global Citizen Science Program to Monitor Changing Coastlines. Cont. Shelf Res. 2022, 245, 104796. [Google Scholar] [CrossRef]
- Dolan, R.; Michael, S.F.; Stuart, J.H. Temporal Analysis of Shoreline Recession and Accretion. J. Coast. Res. 1991, 7, 723–744. [Google Scholar]
- Pirti, A. Evaluating the Accuracy of Post-Processed Kinematic (PPK) Positioning Technique. Geod. Cartogr. 2021, 47, 66–70. [Google Scholar] [CrossRef]
- U.S. Geological Survey. Digital Shoreline Analysis System Version 6.0: U.S. Geological Survey Software Release; U.S. Geological Survey: Reston, VA, USA, 2024. Available online: https://www.usgs.gov/centers/whcmsc/science/digital-shoreline-analysis-system-dsas/ (accessed on 30 November 2025).
- Eltner, A.; Kaiser, A.; Castillo, C.; Rock, G.; Neugirg, F.; Abellán, A. Image-Based Surface Reconstruction in Geomorphometry—Merits, Limits and Developments. Earth Surf. Dynam. 2016, 4, 359–389. [Google Scholar] [CrossRef]
- Lague, D.; Brodu, N.; Leroux, J. Accurate 3D Comparison of Complex Topography with Terrestrial Laser Scanner: Application to the Rangitikei Canyon (N-Z). ISPRS J. Photogramm. Remote Sens. 2013, 82, 10–26. [Google Scholar] [CrossRef]
- Pirti, A.; Eren, M. Positional Accuracy Evaluation of CORS VRS, PPK, Static GPS + GLONASS, and Total Station Surveys in Urban Areas. Nova Geod. 2025, 5, 285. [Google Scholar] [CrossRef]
- Ford, M.R.; Ryan, E.J.; Mules, T.; Tuck, M.E.; Sengupta, M.; Dickson, M.E. An Assessment of the Accuracy of Shoreline Indicators Interpreted from Aerial Photos and Very-High-Resolution Satellite Imagery. J. Coast. Res. 2025, 41, 843–855. [Google Scholar] [CrossRef]
- Zhang, H.; Aldana-Jague, E.; Clapuyt, F.; Wilken, F.; Vanacker, V.; Van Oost, K. Evaluating the Potential of Post-Processing Kinematic (PPK) Georeferencing for UAV-Based Structure-from-Motion (SfM) Photogrammetry and Surface Change Detection. Earth Surf. Dynam. 2019, 7, 807–827. [Google Scholar] [CrossRef]
- Gorman, L.; Morang, A.; Larson, R. Monitoring the Coastal Environment: Part IV, Mapping, Shoreline Changes, and Bathymetric Analysis. J. Coast. Res. 1998, 14, 61–92. [Google Scholar]
- Utami, D.A.; Anwar, I.P.; Sujatmiko, K.A. Influence of Variability to Coastline Dynamic in the Small Uninhabited Reef Islands of Kepulauan Seribu. IOP Conf. Ser. Earth Environ. Sci. 2021, 925, 012039. [Google Scholar] [CrossRef]
- Sengupta, M.; Ford, M.R.; Kench, P.S.; Perry, G.L.W. Exploring the Drivers of Reef Island Shoreline Change Using Machine Learning Models. Sci. Rep. 2025, 15, 16735. [Google Scholar] [CrossRef] [PubMed]
- Gorelick, N.; Hancher, M.; Dixon, M.; Ilyushchenko, S.; Thau, D.; Moore, R. Google Earth Engine: Planetary-Scale Geospatial Analysis for Everyone. Remote Sens. Environ. 2017, 202, 18–27. [Google Scholar] [CrossRef]
- GeoNadir. Available online: https://data.geonadir.com/ (accessed on 30 November 2025).
- OpenTopography. Available online: https://opentopography.org/ (accessed on 30 November 2025).
Disclaimer/Publisher’s Note: The statements, opinions and data contained in all publications are solely those of the individual author(s) and contributor(s) and not of MDPI and/or the editor(s). MDPI and/or the editor(s) disclaim responsibility for any injury to people or property resulting from any ideas, methods, instructions or products referred to in the content. |
© 2025 by the authors. Licensee MDPI, Basel, Switzerland. This article is an open access article distributed under the terms and conditions of the Creative Commons Attribution (CC BY) license (https://creativecommons.org/licenses/by/4.0/).