



-
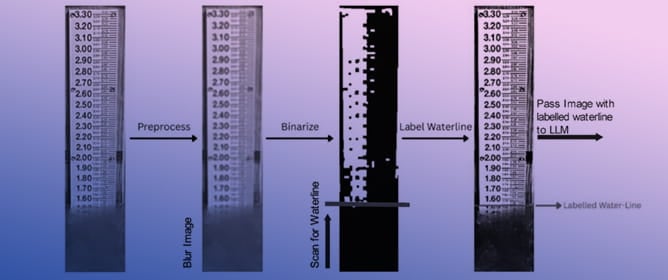
Leveraging Artificial Intelligence in Hydrology to Process Citizen Science Photos of Water Levels -
Seasonal Inflow Shifts and Increasing Hot–Dry Stress for Eagle Mountain Lake Reservoir, Texas: SWAT Modeling with Downscaled CMIP6 Daily Climate and Observed Operations -
Assessing Environmental Status in Salt Marsh Transitional Waters Using High-Resolution Hydrodynamic Models -
Integrated Hydrological and Water Allocation Modelling for Drought Management and Restriction Planning in a Regulated River Basin: Application to the Olt River Basin (Romania)
Journal Description
Hydrology
Hydrology
is an international, peer-reviewed, open access journal on hydrology published monthly online by MDPI. The American Institute of Hydrology (AIH) and Japanese Society of Physical Hydrology (JSPH) are affiliated with Hydrology and their members receive discounts on the article processing charges.
- Open Access— free for readers, with article processing charges (APC) paid by authors or their institutions.
- High Visibility: indexed within Scopus, ESCI (Web of Science), PubAg, GeoRef, and other databases.
- Journal Rank: JCR - Q2 (Water Resources) / CiteScore - Q1 (Oceanography)
- Rapid Publication: manuscripts are peer-reviewed and a first decision is provided to authors approximately 16.5 days after submission; acceptance to publication is undertaken in 3.6 days (median values for papers published in this journal in the first half of 2026).
- Recognition of Reviewers: Reviewers whose reports are timely and of high quality receive an APC discount voucher for a future publication in an MDPI journal. Become a reviewer.
- Journal Clusters of Water Resources: Water, Journal of Marine Science and Engineering, Hydrology, Resources, Oceans, Limnological Review, Coasts and Hydropower.
Impact Factor:
3.1 (2025);
5-Year Impact Factor:
3.4 (2025)
Latest Articles
Deterministic and Stochastic Approaches to Modeling Water Filtration Through Saturated and Unsaturated Porous Media: A Review
Hydrology 2026, 13(10), 263; https://doi.org/10.3390/hydrology13100263 (registering DOI) - 22 Sep 2026
Abstract
Water flow through saturated and unsaturated porous media underlies groundwater assessment, contaminant transport, agricultural drainage and dam-seepage analysis, yet existing reviews typically address only one link in this chain: a single governing equation, a single flow regime, or a single modeling paradigm. This
[...] Read more.
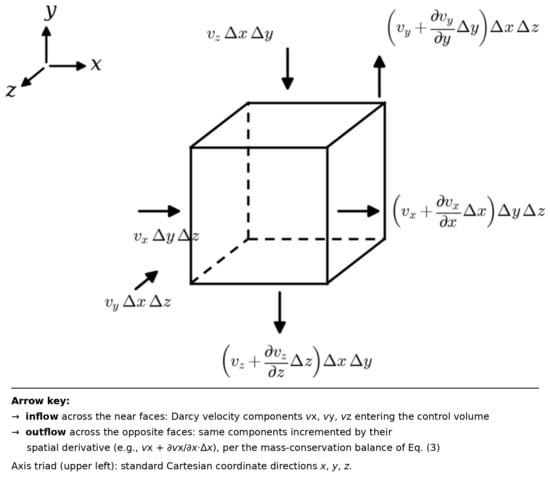
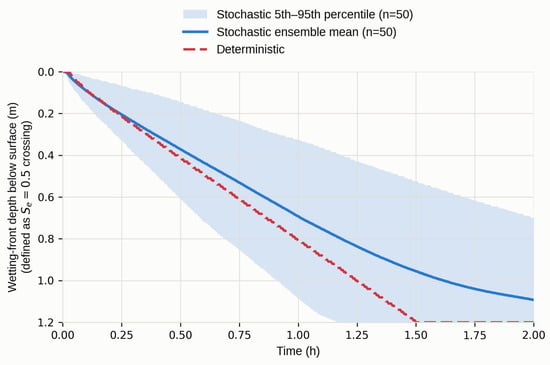
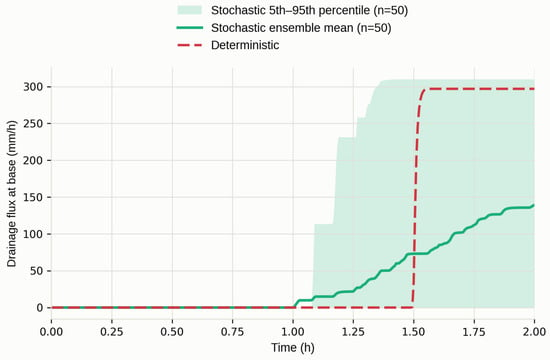
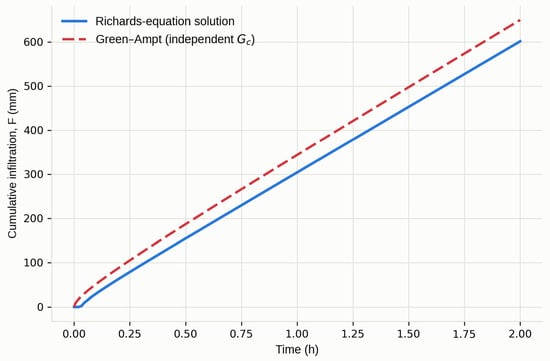
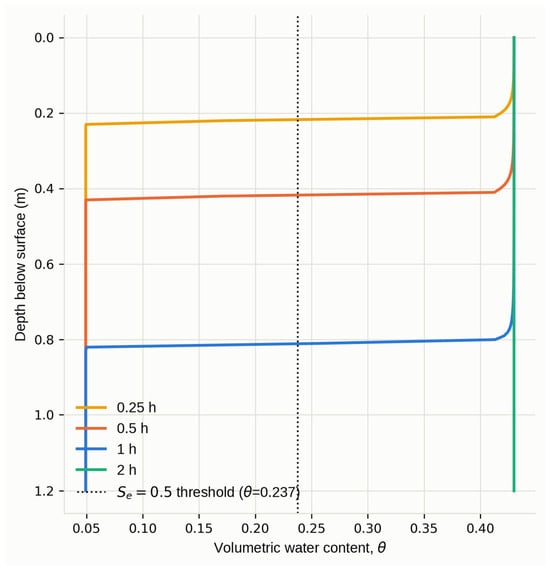
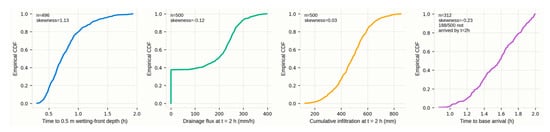
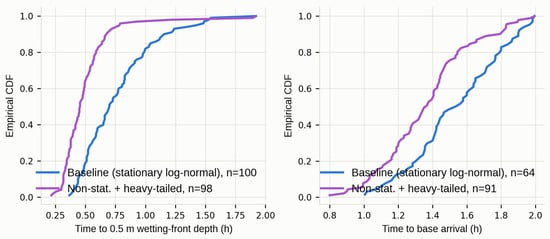
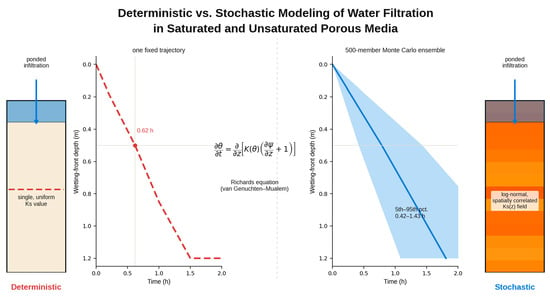
Water flow through saturated and unsaturated porous media underlies groundwater assessment, contaminant transport, agricultural drainage and dam-seepage analysis, yet existing reviews typically address only one link in this chain: a single governing equation, a single flow regime, or a single modeling paradigm. This review connects them. It revisits the hydrodynamic foundations of filtration, from Darcy’s original experiments to the steady-state and transient saturated-flow equations, and extends the treatment to variably saturated conditions through the Richards equation and soil-water-retention models. Deterministic and stochastic modeling paradigms are then compared directly, and the comparison is made concrete through an original numerical case study: the Richards equation is solved for ponded infiltration into a sand filter column, first deterministically and then over a convergence-checked Monte Carlo ensemble (up to 500 realizations) of spatially correlated hydraulic-conductivity fields, showing that realistic heterogeneity alone produces a more than three-fold spread in the predicted wetting-front arrival time. Recent developments in numerical solvers, high-performance computing and machine-learning surrogate models are reviewed to show how the two paradigms are converging into hybrid, physics-informed frameworks, and the review is positioned explicitly against seven related studies published between 2017 and 2025. Persistent challenges in characterizing heterogeneity and validating hybrid models are identified, and directions for future research are outlined.
Full article
(This article belongs to the Topic Recent Advances in Hydrological and Hydraulic Engineering: A Contemporary Perspective)
►
Show Figures
Open AccessArticle
Spatiotemporal Patterns and Environmental Controls of Dissolved Organic Matter in Coastal Rivers of the Bohai Rim, China
by
Zhen Ren, Jiao Yang, Wanzhu Li, Meiling Yang, Na Liu and Baoli Wang
Hydrology 2026, 13(10), 262; https://doi.org/10.3390/hydrology13100262 - 22 Sep 2026
Abstract
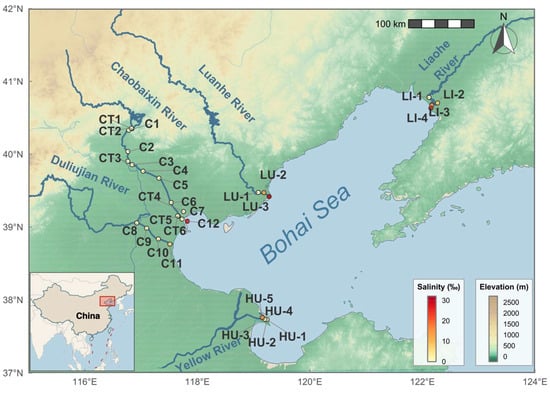
Dissolved organic matter (DOM) in coastal rivers plays a key role in land–ocean carbon cycling, yet its spatiotemporal dynamics drivers remain poorly understood. This study investigated five typical rivers across the Bohai Rim, China, using ultraviolet–visible absorption, fluorescence spectroscopy, and stable carbon isotope
[...] Read more.
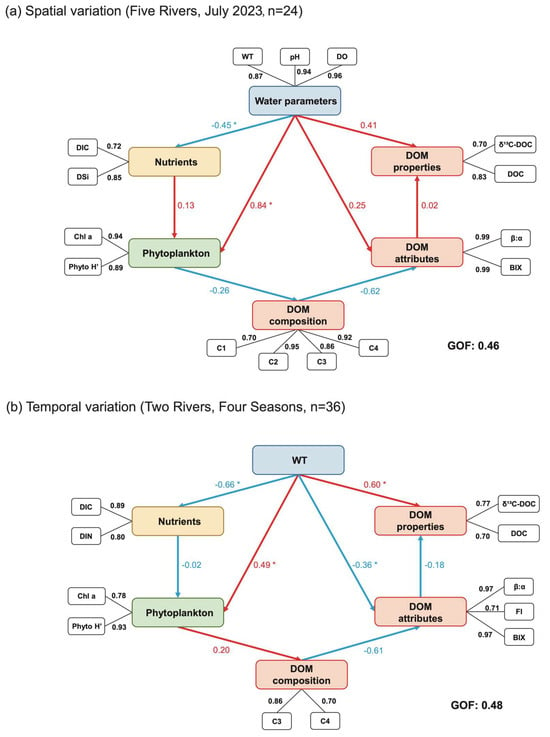
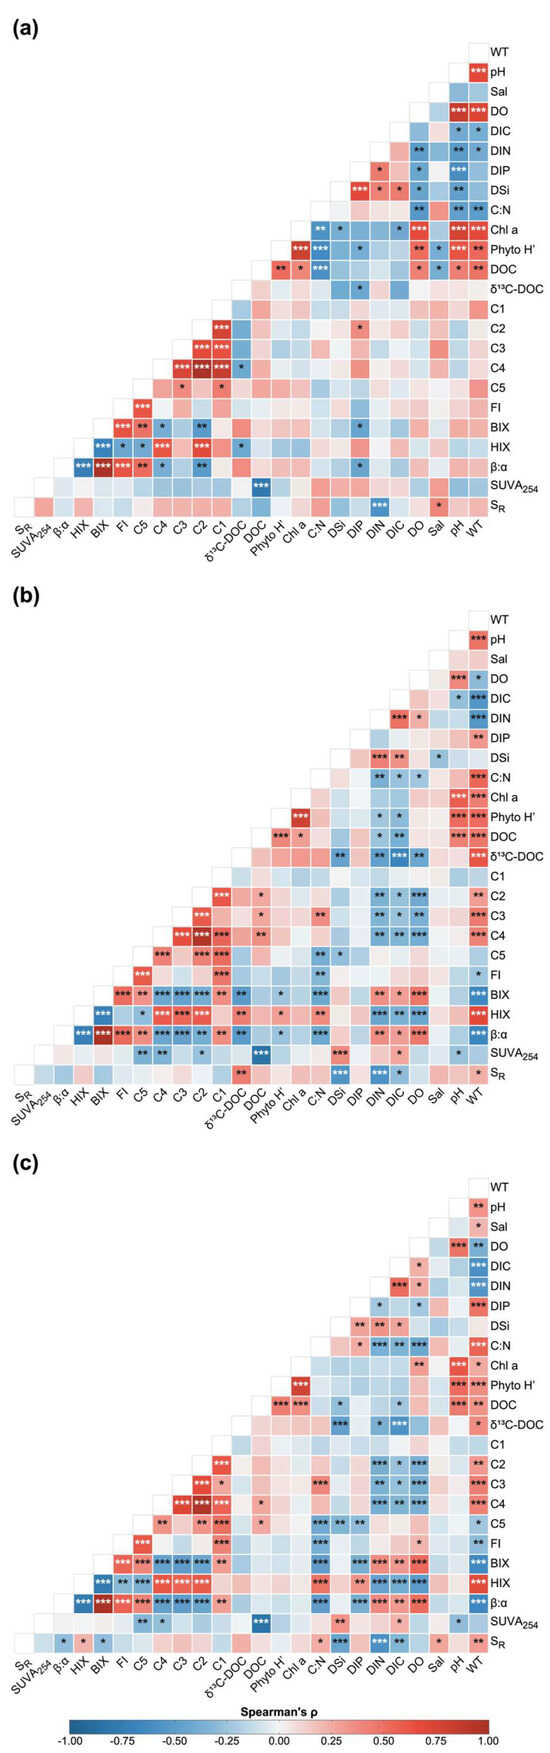
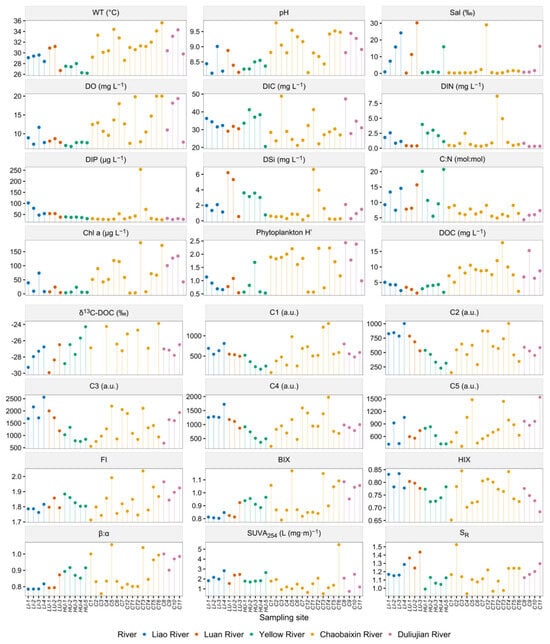
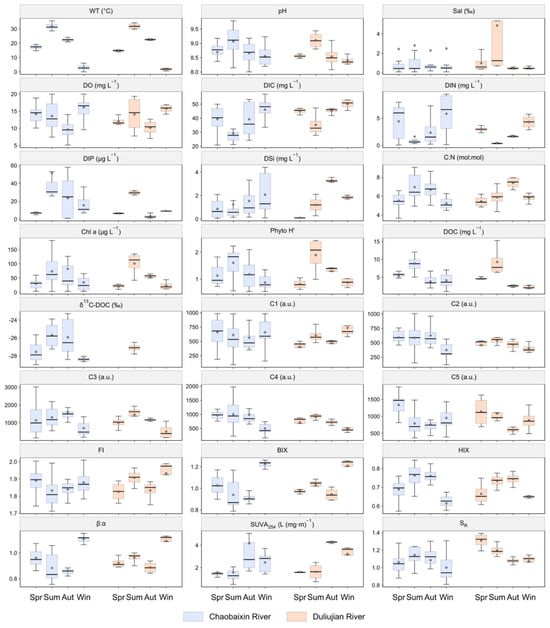
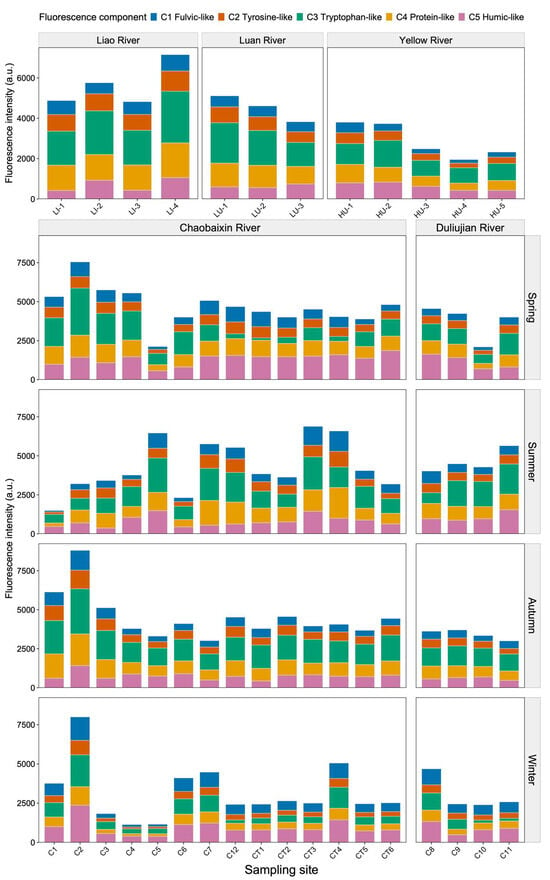
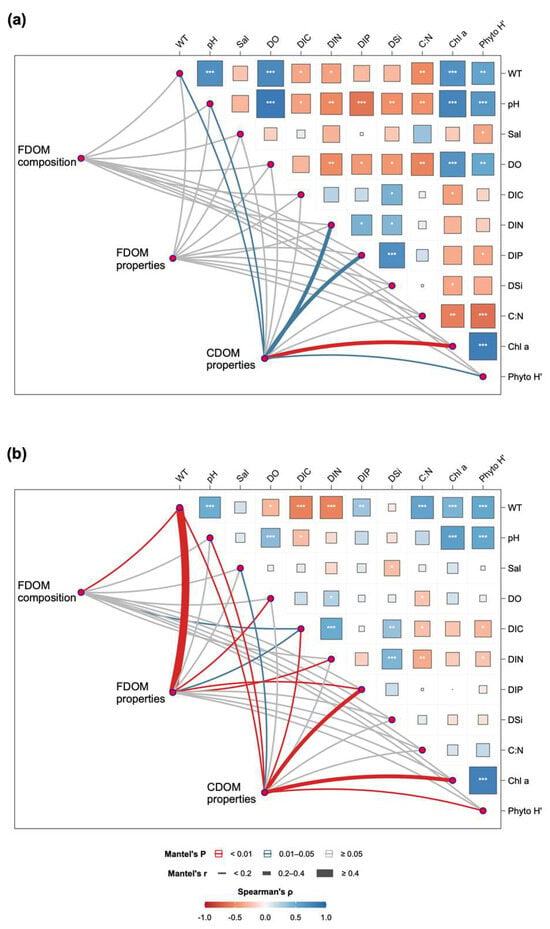
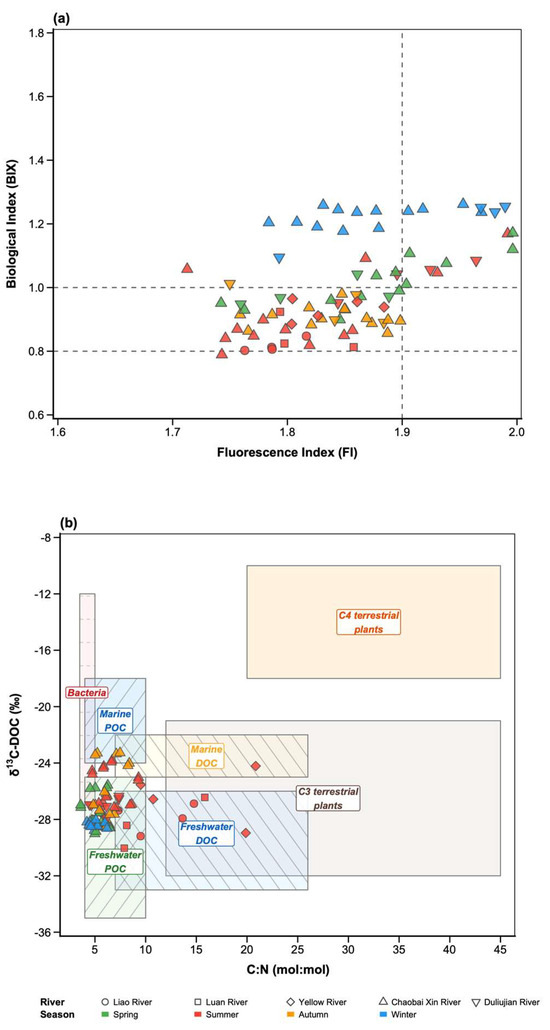
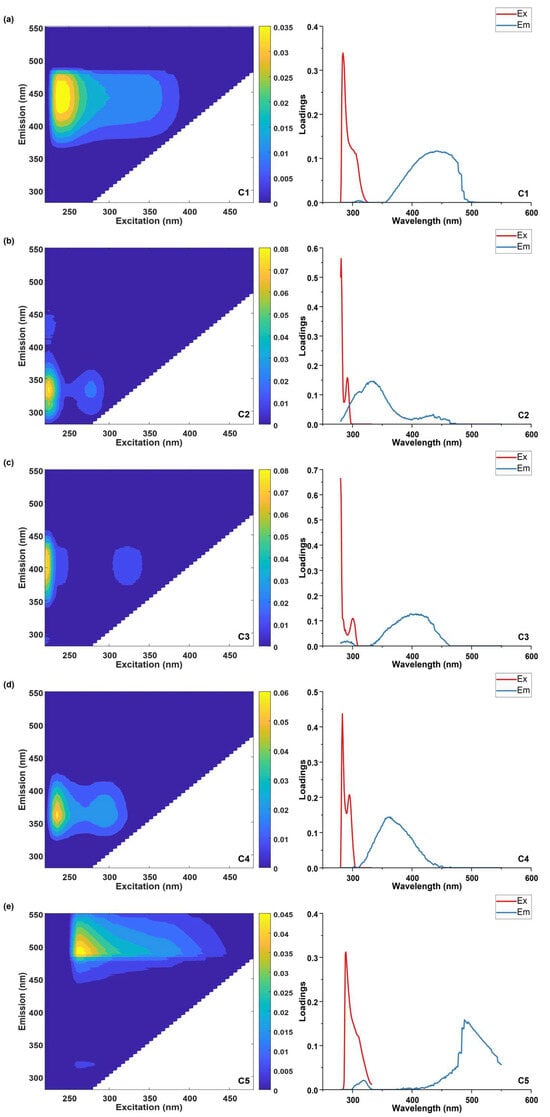
Dissolved organic matter (DOM) in coastal rivers plays a key role in land–ocean carbon cycling, yet its spatiotemporal dynamics drivers remain poorly understood. This study investigated five typical rivers across the Bohai Rim, China, using ultraviolet–visible absorption, fluorescence spectroscopy, and stable carbon isotope analysis. Fluorescence indices and dual-proxy source characterization indicated that autochthonous DOM, mainly from phytoplankton and microbial metabolism, dominated the bulk DOM pool, whereas terrestrial C3 plant inputs served as secondary but spatially variable sources. Among all measured environmental variables, water temperature exhibited relatively strong correlations with DOM optical properties, while salinity showed limited influence. Mantel tests and partial least squares path modeling further suggested that water temperature indirectly shaped temporal variations in DOM by modulating phytoplankton biomass and diversity, which in turn promoted the production of low-aromaticity autochthonous DOM. This cascading framework synthesizes thermal, nutrient, and microbial controls on fluvial DOM, improving understanding of regional carbon budgets and providing scientific support for integrated management of the Bohai coastal zone.
Full article
(This article belongs to the Special Issue Watershed Evolution and Water Cycle Response Under Global Change)
►▼
Show Figures

Figure 1
Open AccessArticle
A Poly-Shock Sentinel-Node Framework for Scenario-Based Assessment of Water-Scarcity Risk in the Transboundary Talas River Basin Using GIS-WEAP
by
Ainur Medetkhan, Alexander Neftissov, Ilyas Kazambayev, Lalita Kirichenko, Zhanuzak Abdibayev and Marat Bayandin
Hydrology 2026, 13(10), 261; https://doi.org/10.3390/hydrology13100261 - 22 Sep 2026
Abstract
►▼
Show Figures
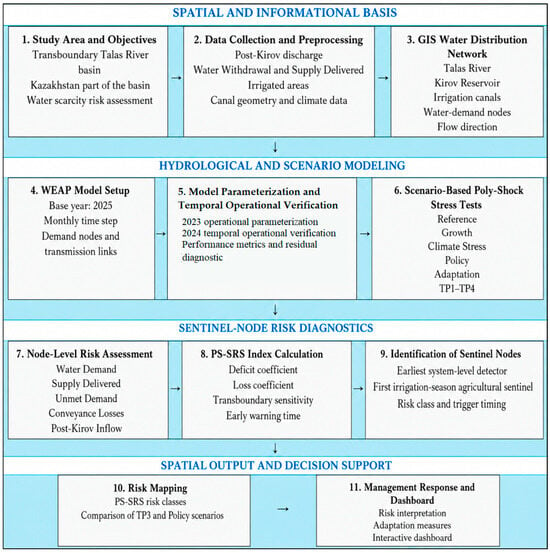
Transboundary river basins in Central Asia are exposed to interacting reductions in available inflow, increasing water demand and infrastructure losses. This study develops a poly-shock sentinel-node framework for the scenario-based assessment of water-scarcity risk in the Kazakhstan part of the transboundary Talas River
[...] Read more.
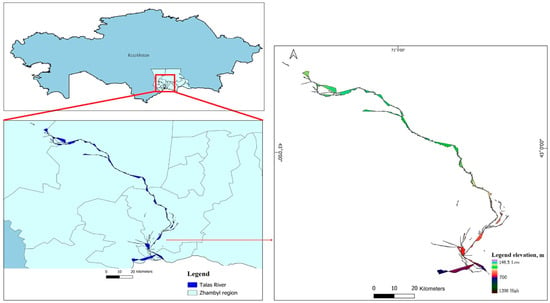
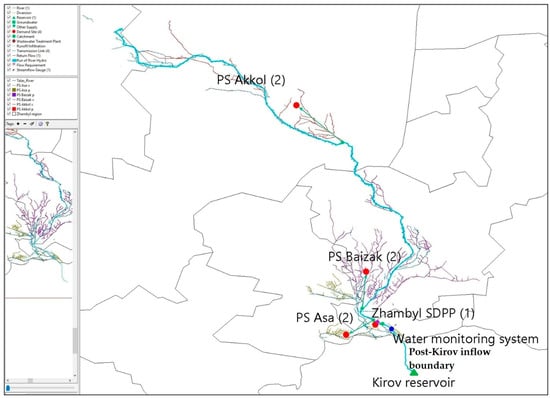
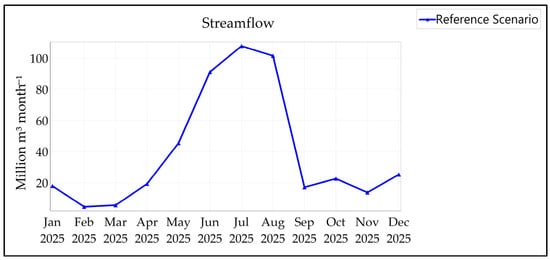
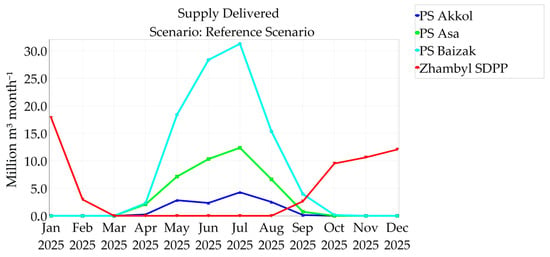
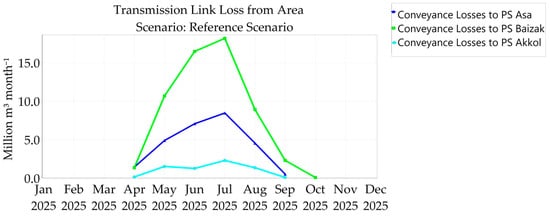
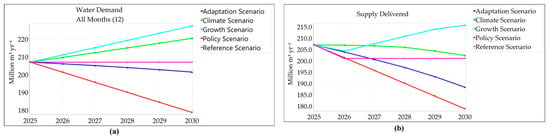
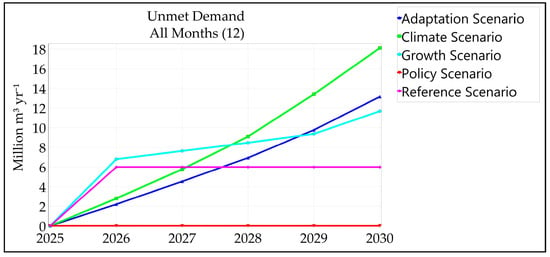
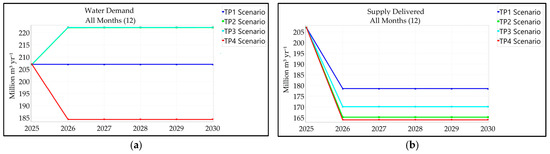
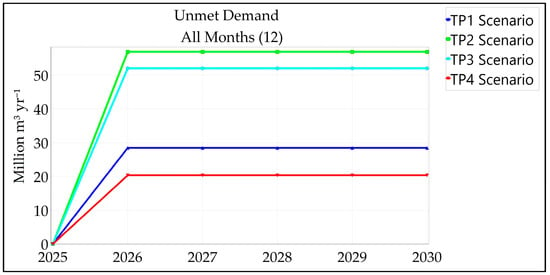
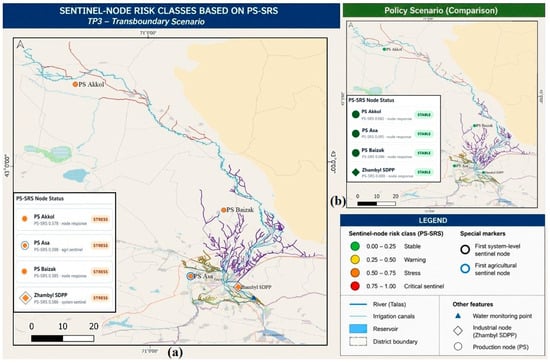
Transboundary river basins in Central Asia are exposed to interacting reductions in available inflow, increasing water demand and infrastructure losses. This study develops a poly-shock sentinel-node framework for the scenario-based assessment of water-scarcity risk in the Kazakhstan part of the transboundary Talas River Basin. The methodology combines GIS-based spatial analysis, WEAP water-allocation modeling, nine scenarios for 2026–2030, and the Poly-Shock Sentinel Risk Score (PS-SRS) for four water-demand nodes. Here, poly-shock denotes a deliberately constructed combination of hydrological, demand-related, infrastructure, and operational stressors. The model outputs are interpreted as conditional scenario-based stress tests rather than deterministic forecasts. Under the specified assumptions, annual unmet demand in 2030 ranges from 5.98 million m3 yr−1 in Reference to 56.90 million m3 yr−1 in TP2. Under the assumed Policy parameter package, no simulated unmet demand occurs, while TP4 reduces unmet demand from 52.01 to 20.33 million m3 yr−1 relative to TP3. Sentinel identity is scenario-dependent: PS Asa is the first system-level node under Reference and Growth, whereas Zhambyl SDPP is the earliest chronological system-level detector under the Climate Scenario, Adaptation, and TP1–TP4. PS Asa remains the first irrigation-season agricultural sentinel across all scenarios in which agricultural risk occurs. The proposed PS-SRS is interpreted as a case-specific node-level diagnostic that should be considered jointly with annual unmet demand and the first threshold-crossing month.
Full article

Figure 1
Open AccessArticle
Delineation of Potential Aquifer Zones in the Lagnadiz Area (Zaër Pluton, Central Morocco) Using a Multi-Source Analysis (Sentinel-1, Sentinel-2, DEM) and a Multi-Criteria Approach
by
Meryeme Khachchabi, Tarik Tagma, Fatima El Khalloufi, Jalal Moustadraf and El Hassania El Hamzaoui
Hydrology 2026, 13(9), 260; https://doi.org/10.3390/hydrology13090260 - 21 Sep 2026
Abstract
Groundwater is essential for drinking and irrigation to ensure a stable life and economic development, especially in semi-arid to arid rural areas such as the Lagnadiz district in central Morocco. However, its occurrence is highly variable in discontinuous media because of its uneven
[...] Read more.
Groundwater is essential for drinking and irrigation to ensure a stable life and economic development, especially in semi-arid to arid rural areas such as the Lagnadiz district in central Morocco. However, its occurrence is highly variable in discontinuous media because of its uneven circulation along fractures, making it difficult to locate productive drilling sites. This study aimed to identify suitable locations for the establishment of productive wells by combining Sentinel-1 and Sentinel-2 imagery, a DEM, and geological data. Lineaments were automatically extracted and validated using Google Earth imagery, slope and hillshade maps, and field observations. Six thematic layers (lithology, drainage density, distance to faults, slope, lineament density, and lineament intersection density) were weighted using the Analytic Hierarchy Process and integrated through Weighted Linear Combination. The resulting groundwater potential map shows that high potential areas cover 38.53% of the study area, followed by moderate potential areas (34.84%) and low potential areas (26.63%). A ±10% weight sensitivity analysis showed strong map stability, with r values of 0.9949–0.9999 and class agreement rates of 93.31–99.61%. The map was independently validated using exploitation-yield data from 22 boreholes that were not involved in its construction. Using a productivity threshold of 5 m3/h, the ROC analysis produced an AUC of 0.795, with a 95% confidence interval ranging from 0.581 to 0.949, indicating an acceptable ability of the GWPI map to distinguish between the two productivity groups.
Full article
Open AccessReview
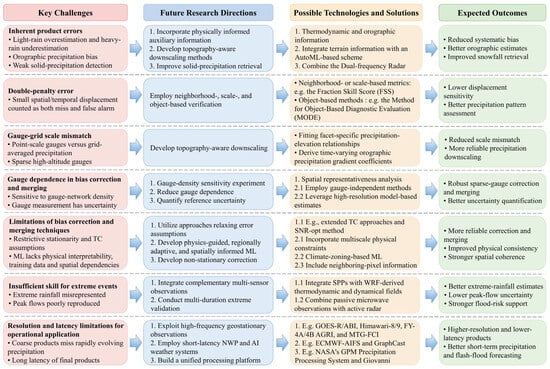
Advancing the Use of Satellite and Reanalysis Precipitation Data in Data-Scarce High-Altitude Regions: A Comprehensive Review
by
Liangkun Deng, Shihan Shan, Hua Chen, Xiang Zhang, Guiliang Zhong, Fuling Wen and Yan Zhang
Hydrology 2026, 13(9), 259; https://doi.org/10.3390/hydrology13090259 - 21 Sep 2026
Abstract
►▼
Show Figures
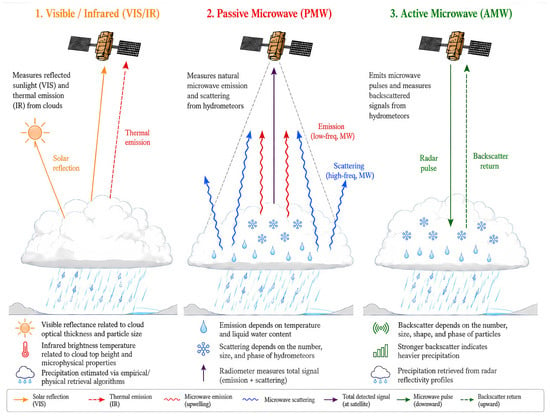
Accurate precipitation observation in high-altitude regions is of paramount importance for understanding climate variability and mitigating extreme hazards. However, obtaining reliable precipitation measurements in these areas remains a formidable challenge due to sparse gauge networks, complex topography, and intricate meteorological conditions. With the
[...] Read more.
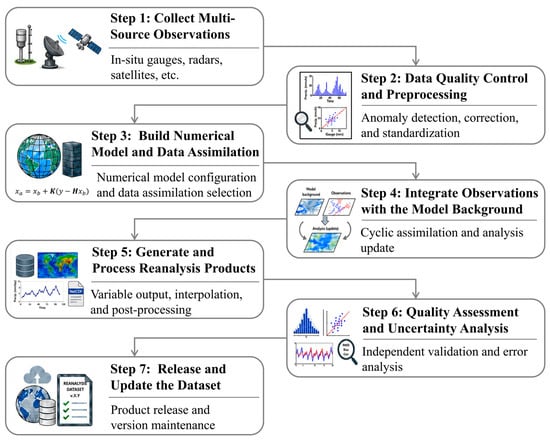
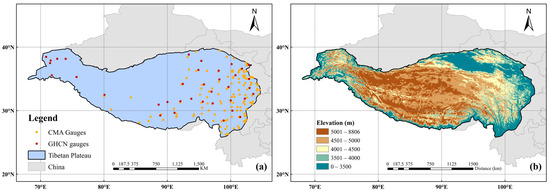
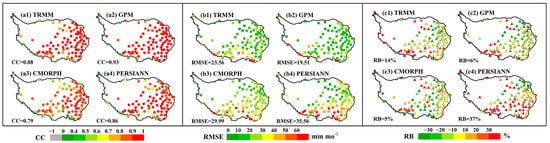
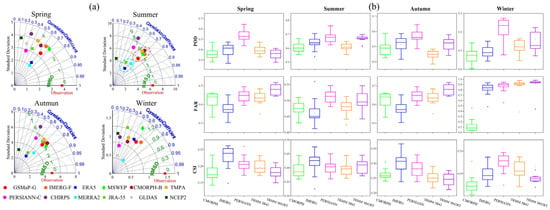
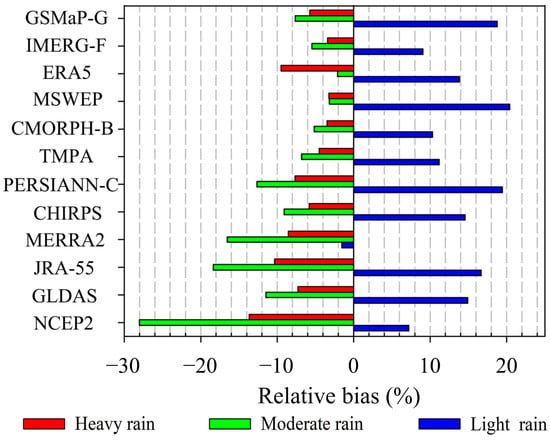
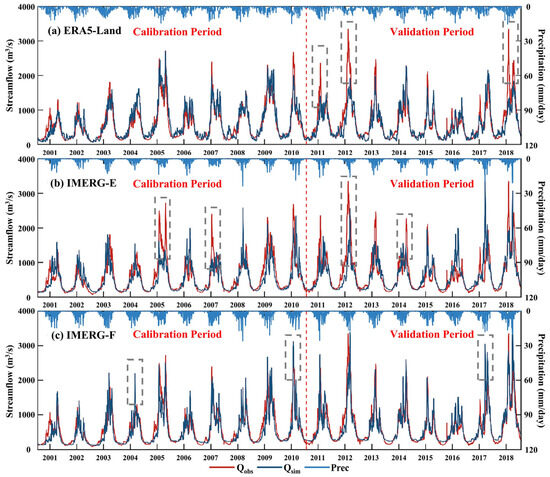
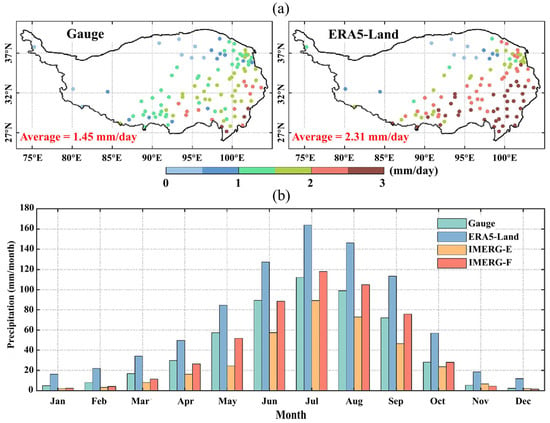
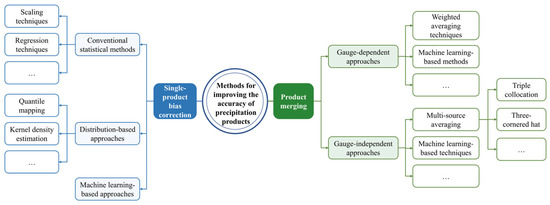
Accurate precipitation observation in high-altitude regions is of paramount importance for understanding climate variability and mitigating extreme hazards. However, obtaining reliable precipitation measurements in these areas remains a formidable challenge due to sparse gauge networks, complex topography, and intricate meteorological conditions. With the advent of remote sensing and numerical simulation techniques, satellite precipitation products (SPPs) and reanalysis datasets have emerged as effective alternatives to in-situ rain gauges. This review systematically examines the progress, challenges, and prospects of applying these precipitation products to address data scarcity, focusing specifically on high-altitude regions, with the Tibetan Plateau (TP) as the primary case study. The retrieval principles, advantages and limitations, applicability, and error characteristics of these products are first outlined. These precipitation products generally demonstrate significant conditional biases across multiple spatiotemporal scales and often lack the fidelity to accurately capture extreme events. Accordingly, the theoretical foundations, implementation procedures, and case studies of bias correction and product merging methods are analyzed to evaluate their potential for accuracy improvement in alpine regions. The results indicate that these methods have been effective in reducing errors in both precipitation estimates and hydrological simulations. Nevertheless, further efforts are needed to address key challenges related to the products themselves, the accuracy improvement algorithms, and their operational application. This review offers comprehensive guidance for leveraging SPPs and reanalysis datasets to obtain more reliable precipitation estimates in high-altitude regions.
Full article

Figure 1
Open AccessArticle
Long-Term Assessment of Rainwater Harvesting and Storage Reliability at a Mediterranean University Campus
by
Anna Baryła, Mariusz Sojka, Atilgan Atilgan and Agnieszka Karczmarczyk
Hydrology 2026, 13(9), 258; https://doi.org/10.3390/hydrology13090258 - 21 Sep 2026
Abstract
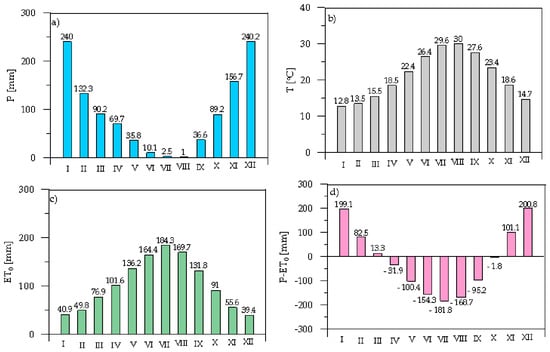
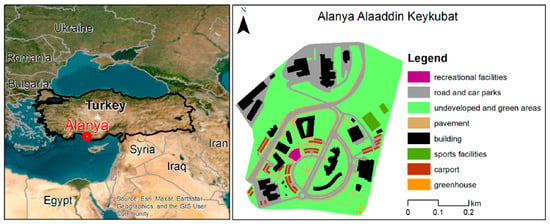
Rainwater harvesting (RWH) may contribute to sustainable water management in Mediterranean regions, where water availability and demand are highly seasonal. This study examined the potential for RWH and the reliability of storage at the Kestel Campus of Alanya Alaaddin Keykubat University in Alanya,
[...] Read more.
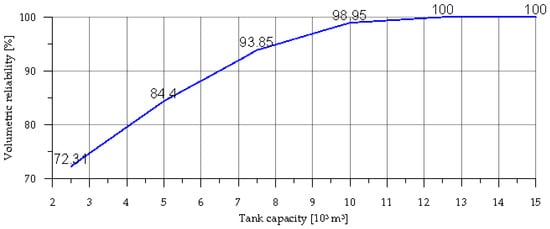
Rainwater harvesting (RWH) may contribute to sustainable water management in Mediterranean regions, where water availability and demand are highly seasonal. This study examined the potential for RWH and the reliability of storage at the Kestel Campus of Alanya Alaaddin Keykubat University in Alanya, Türkiye, using monthly climate data from 2000 to 2024. The analysis considered variations in precipitation and air temperature, FAO-56 Penman–Monteith reference evapotranspiration (ET0), the climatic water balance, campus land cover, potential runoff, non-potable water demand, and six storage-capacity scenarios. The campus area is 231,700 m2, of which 35,700 m2 represents the potential roof catchment area. The average annual precipitation was 1104.1 mm, and the mean annual ET0 was 1241.6 mm, resulting in a mean climatic water deficit of 137.5 mm per year. The average theoretical roof runoff was 35,475 m3 per year, and the modelled annual non-potable water demand, including toilet flushing and irrigation of 1 hectare of green space, was about 19,804 m3 per year. With the assumed demand, runoff, and monthly operating conditions, the volumetric reliability rose from 72.3% for a storage capacity of 2500 m3 to 99.0% for 10,000 m3 and reached 100% at 12,500 m3; further increasing the storage to 15,000 m3 did not provide any additional benefit in terms of reliability. These storage capacities should be understood as planning scenarios only, not as design recommendations, since economic feasibility, event-based operation, and water quality were not assessed. The results show that a long-term seasonal water balance analysis is important for planning rainwater harvesting at the campus level in Mediterranean climates.
Full article
(This article belongs to the Special Issue Advances in Urban Hydrology and Stormwater Management (Second Edition))
►▼
Show Figures

Figure 1
Open AccessArticle
Impact of Land Cover Change on Urban Flooding and Hydraulic Performance of Kinalumsan River, Cebu City, Central Visayas, Philippines
by
Niña Alyannah Kaye Regidor, Floris Boogaard, Taneza Mae A. Bontilao, Alfonso Miguel I. Angeles, Adones B. Caduyac and Kathrina Marie M. Borgonia
Hydrology 2026, 13(9), 257; https://doi.org/10.3390/hydrology13090257 - 20 Sep 2026
Abstract
Predicting flood dynamics in data-scarce urban catchments remains a major hydrological challenge, yet physically-based modeling is essential for design mitigation infrastructure. This study assessed the impact of land cover change on the hydrological response and hydraulic performance of the ungauged Kinalumsan River in
[...] Read more.
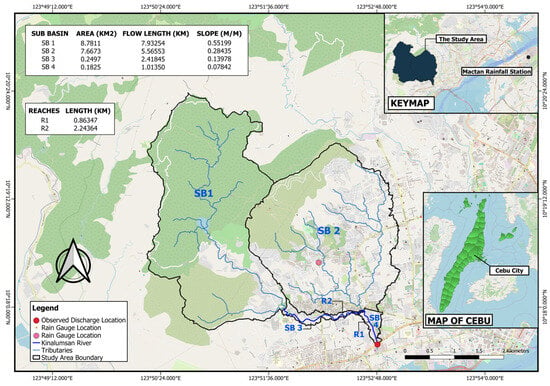
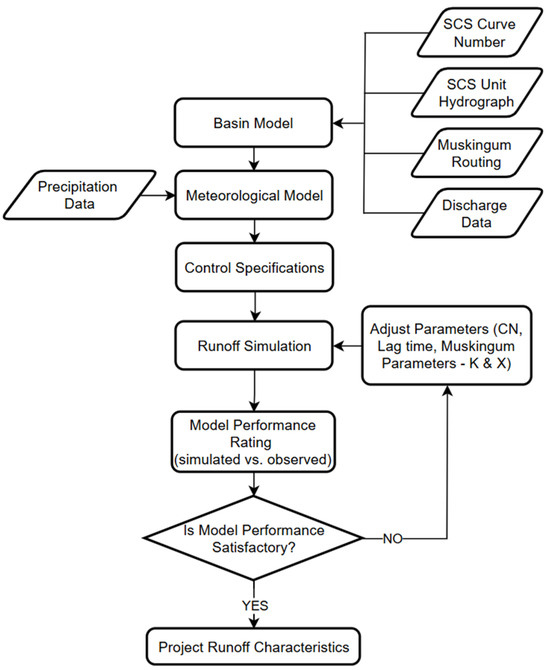
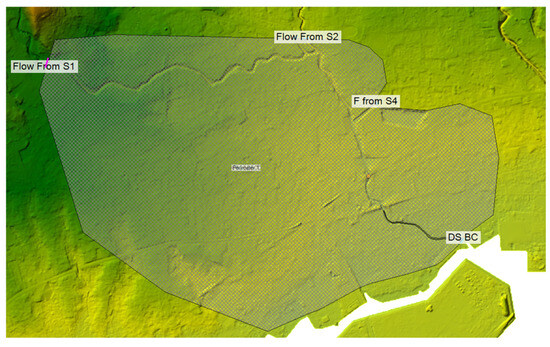
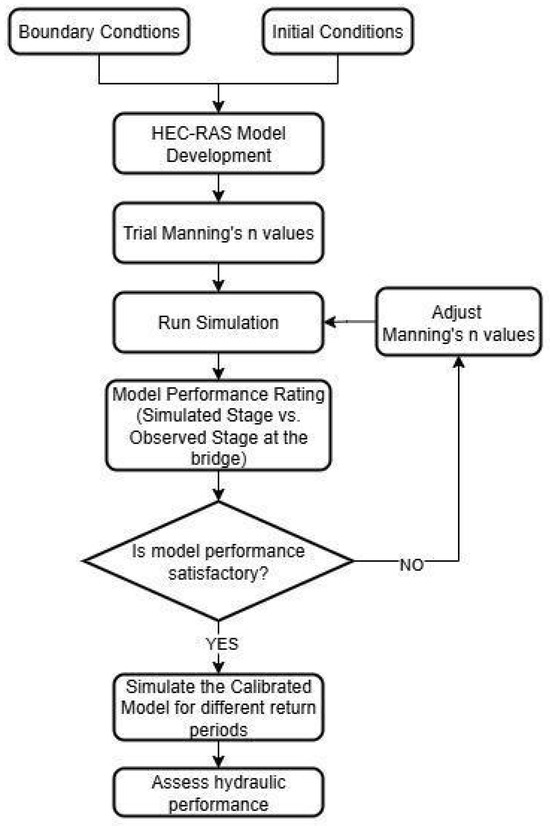
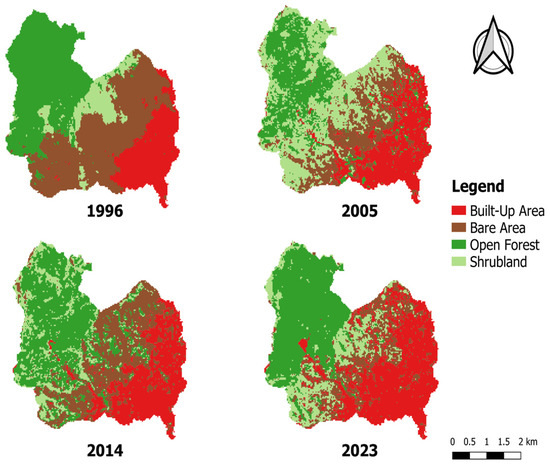
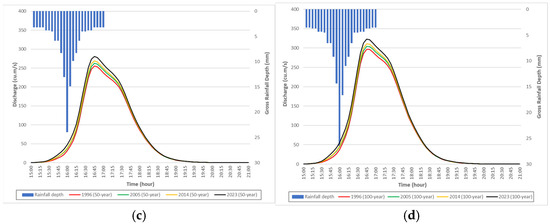
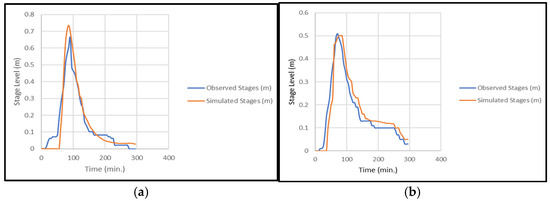
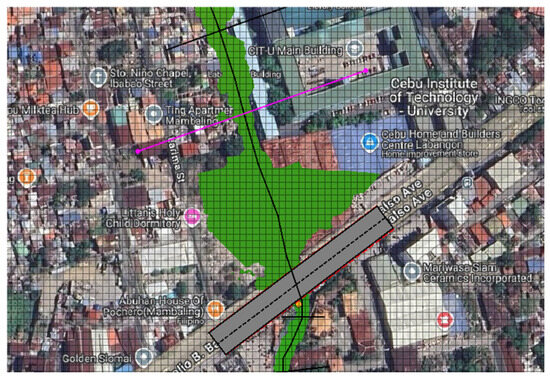
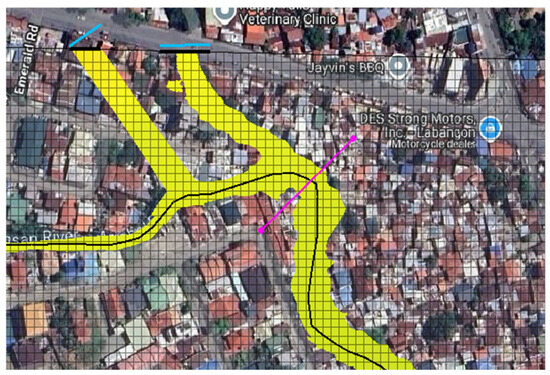
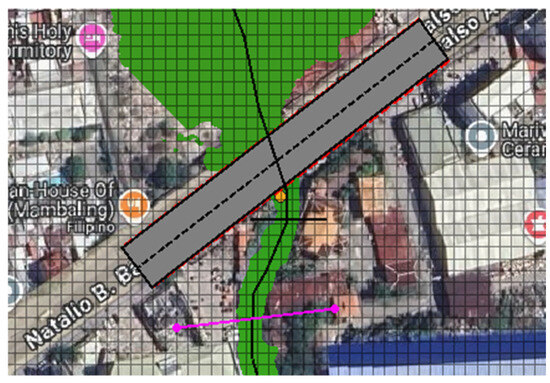
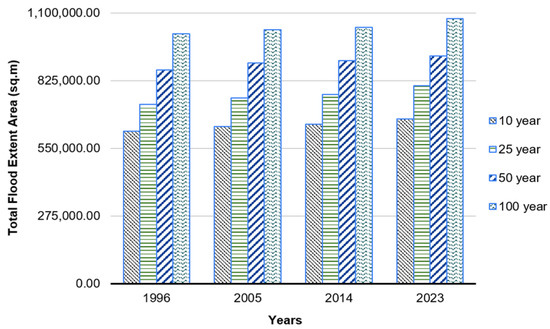
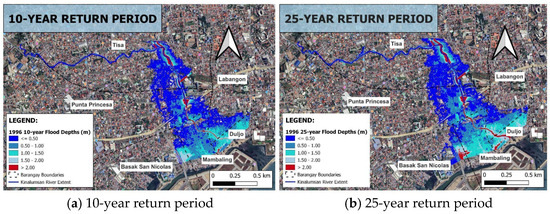
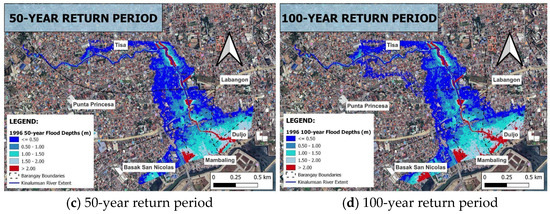
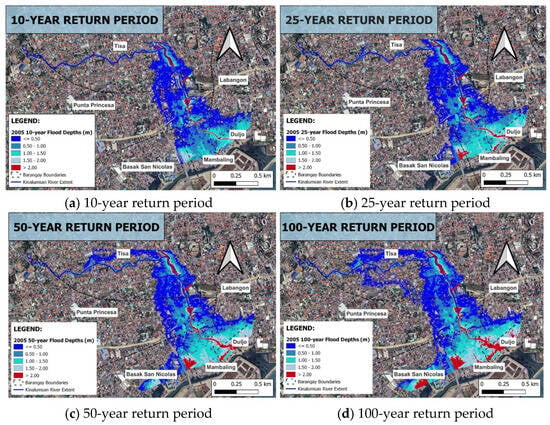
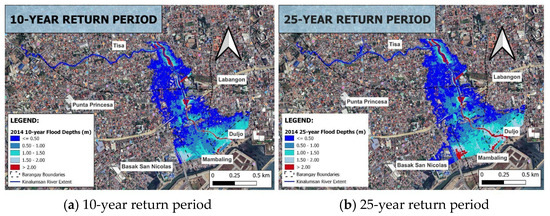
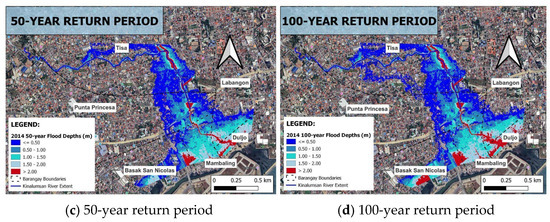
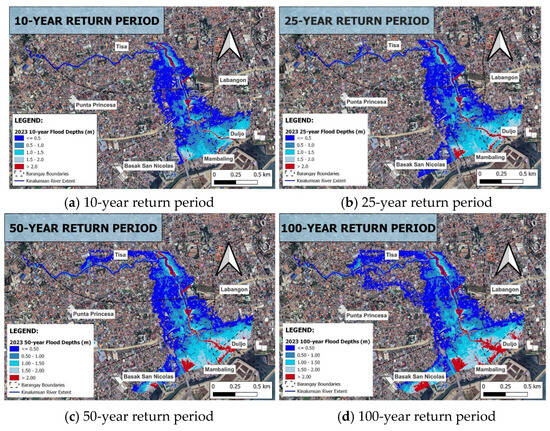
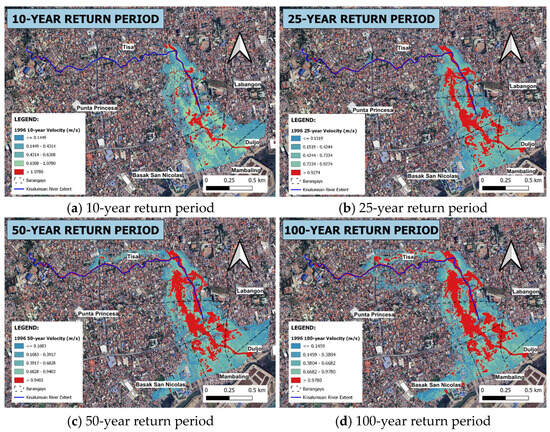
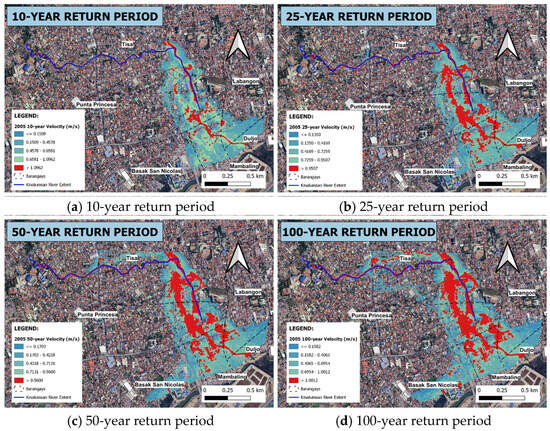
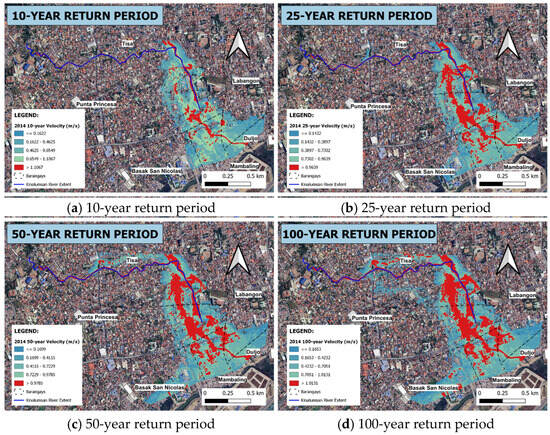
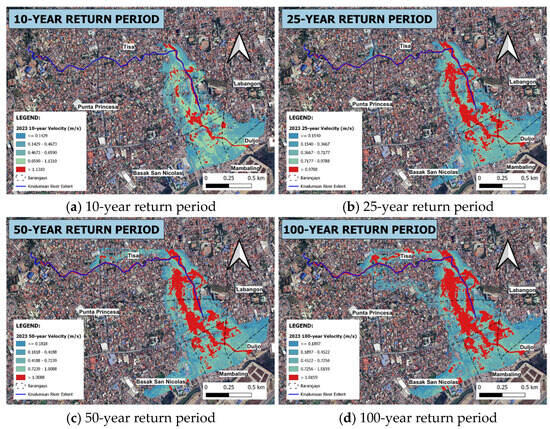
Predicting flood dynamics in data-scarce urban catchments remains a major hydrological challenge, yet physically-based modeling is essential for design mitigation infrastructure. This study assessed the impact of land cover change on the hydrological response and hydraulic performance of the ungauged Kinalumsan River in Cebu City, Philippines, which frequently overflows during intense rainfall. To overcome the absence of historical gauge records, a short-term field monitoring campaign was conducted to capture discrete storm events for event-based calibration. Land cover maps from 1996 to 2023 were analyzed to evaluate spatiotemporal trends. A physically-based, coupled modeling framework was deployed: a HEC-HMS model utilized the Soil Conservation Service Curve Number (SCS-CN) method to simulate peak discharges under 10-, 25-, 50- and 100-year return periods, which subsequently drove a HEC-RAS (Version 6.6) 2D model to assess flood characteristics. The event-based calibration demonstrated good predictive performance, achieving Nash–Sutcliffe Efficiency (NSE) values of 0.96 (HEC-HMS) and 0.88 (HEC-RAS), indicating reliable simulation of the catchment’s response. Results show a steady increase in built-up areas, which contributed to higher peak discharges and expanded flood extents. Extreme rainfall events further amplified flood hazards, with the 100-year return period producing the widest inundation. The districts of Tisa and Punta Princesa located near the downstream portion of the Kinalumsan River consistently experienced the greatest exposure in both depth and velocity terms. Overall, the study demonstrates that integrating short-duration monitoring campaigns with coupled hydrologic–hydraulic modeling provides a scientifically defensible, highly transferable template for rapid flood hazard mapping and stormwater management in data-constrained developing regions. This cost-effective method of flood modelling can be upscaled to other cities where data is scarce including selection of nature-based solutions for the improvement of urban drainage and stormwater management for resilient cities.
Full article
(This article belongs to the Special Issue Advances in Urban Flood Modeling, Forecasting and Early Warning)
►▼
Show Figures

Figure 1
Open AccessArticle
Internally Cross-Checked Estimation of Downstream Water-Level Response Timing During a Controlled Dam Release in a Sparsely Gauged River
by
Pengfei Lyu, Yi Tang, Hidekazu Shirai, Yasuharu Watanabe, Wei Xie and Toshio Eisaka
Hydrology 2026, 13(9), 256; https://doi.org/10.3390/hydrology13090256 - 19 Sep 2026
Abstract
Controlled releases can reveal downstream response timing when calibrated hydraulic routing is unavailable, but sparse stage-only records limit what can be inferred. We analyze one principal 2026 controlled release on the Satsunai River, Japan, using dam outflow and two downstream water-level series. We
[...] Read more.
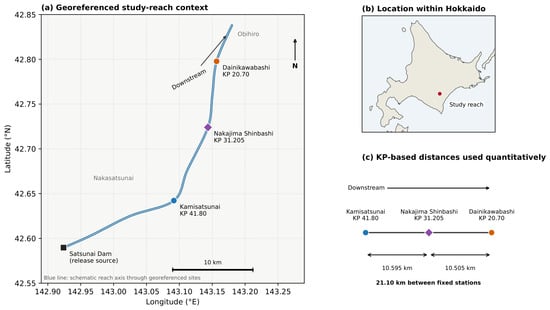
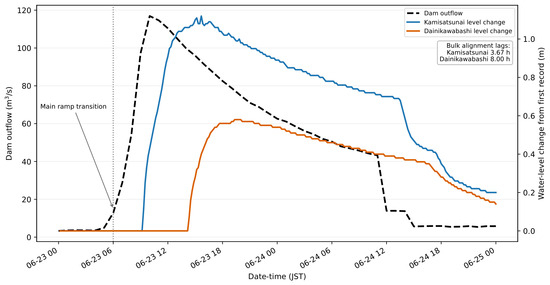
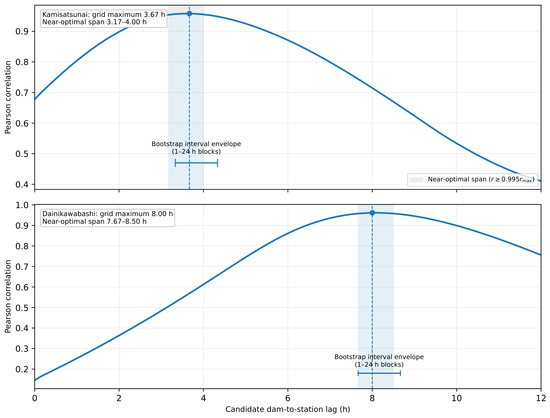
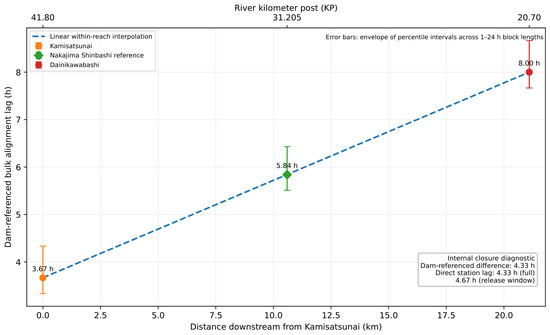
Controlled releases can reveal downstream response timing when calibrated hydraulic routing is unavailable, but sparse stage-only records limit what can be inferred. We analyze one principal 2026 controlled release on the Satsunai River, Japan, using dam outflow and two downstream water-level series. We ask whether dam-referenced lags agree with a direct station-to-station estimate, whether the reach-scale timing persists under alternative preprocessing and dependence assumptions, and what timing can be assigned conditionally to an intermediate ungauged location. Cross-correlation maxima occurred at 3.67 h at Kamisatsunai and 8.00 h at Dainikawabashi; their 4.33 h difference matched the full-record station-to-station maximum and was close to the 4.67 h release-window result. Across detrending and differencing transformations, endpoint separation remained 3.67–4.33 h. Expanded 1–24 h moving-block bootstrap sensitivity yielded a lag-difference envelope of 4.17–4.50 h, corresponding to an apparent celerity of 1.30–1.41 m/s. Linear interpolation gave 5.84 h at Nakajima Shinbashi, with a conditional percentile-interval envelope of 5.51–6.43 h. Taken together, these estimates give a consistent event-specific description of bulk hydrograph alignment. Additional events and hydraulic observations are needed to assess transferability and spatial model-form uncertainty.
Full article
(This article belongs to the Special Issue Advances in Flood Studies: Enhancing Data Collection, Rating Curves, and Hydrological Analyses)
►▼
Show Figures

Figure 1
Open AccessArticle
Spatiotemporal Evolution Characteristics and Associated Factors Identification of Meteorological Drought in Huaihe River Basin
by
Shanshan Tang, Lei Guo, Qingqing Tian and Fei Wang
Hydrology 2026, 13(9), 255; https://doi.org/10.3390/hydrology13090255 - 19 Sep 2026
Abstract
►▼
Show Figures
The Huaihe River Basin (HRB) lies in the climatic transition zone between northern and southern China. Its precipitation shows obvious spatiotemporal heterogeneity, and frequent meteorological droughts seriously threaten regional food and water security. Clarifying the spatiotemporal variations, non-linear abrupt changes and multi-scale driving
[...] Read more.
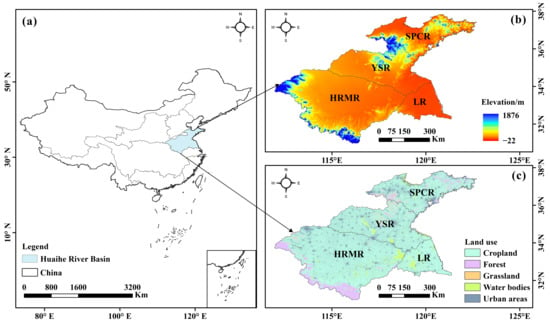
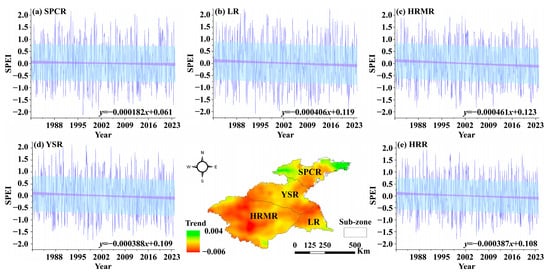
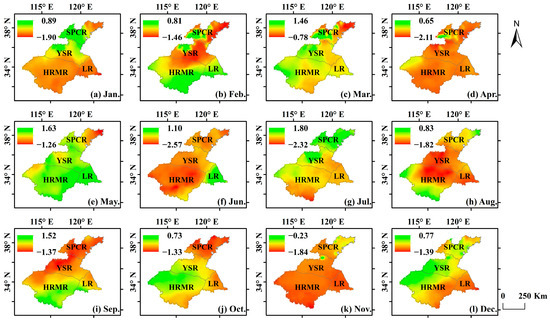
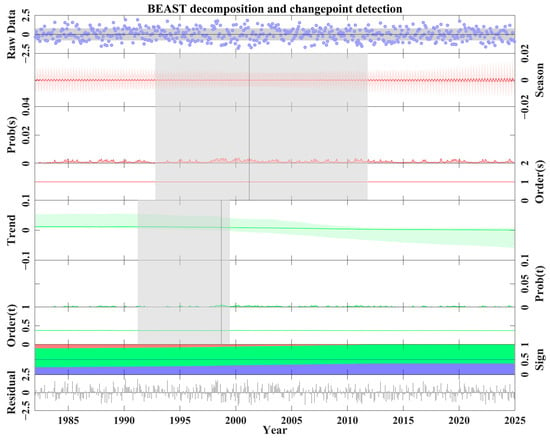
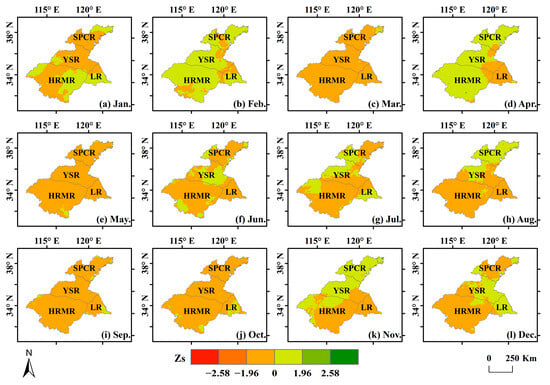
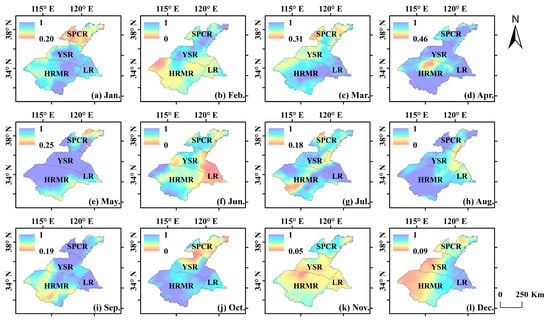
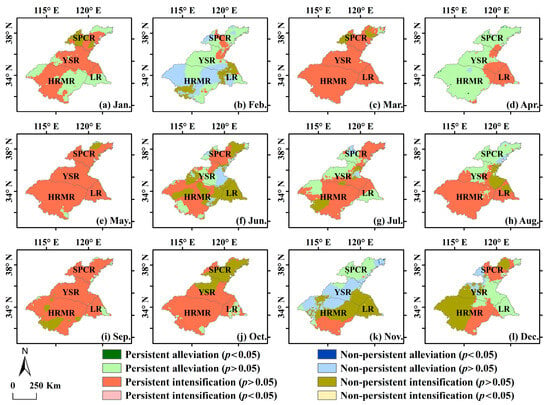
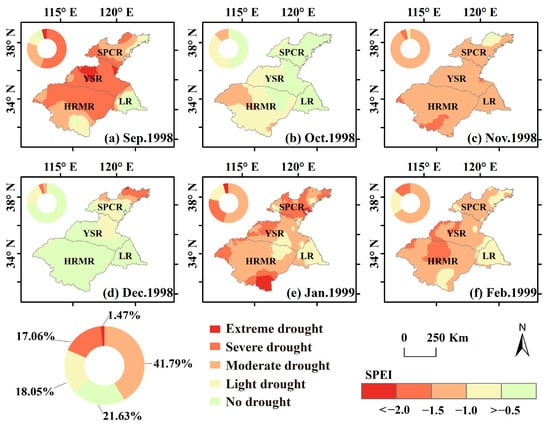
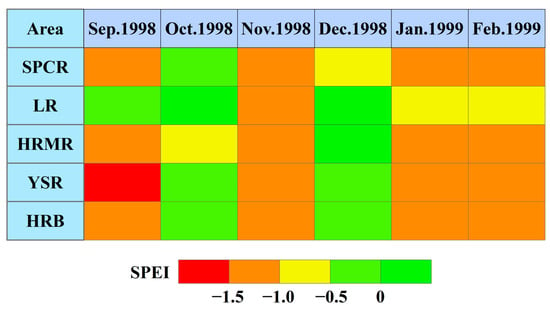
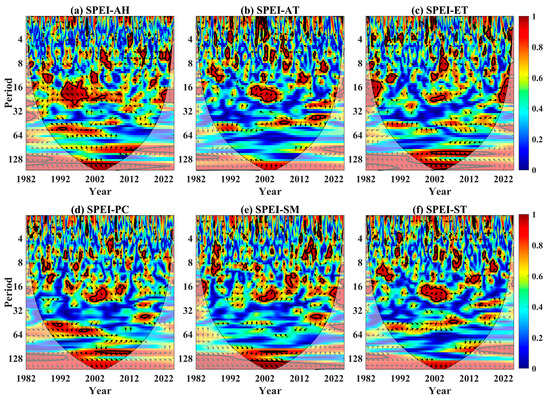
The Huaihe River Basin (HRB) lies in the climatic transition zone between northern and southern China. Its precipitation shows obvious spatiotemporal heterogeneity, and frequent meteorological droughts seriously threaten regional food and water security. Clarifying the spatiotemporal variations, non-linear abrupt changes and multi-scale driving mechanisms of meteorological droughts in the basin is of great significance for regional drought risk prevention and control, as well as the optimized allocation of water resources. In this study, the one-month time scale Standardized Precipitation Evapotranspiration Index (SPEI-1) was adopted as the primary indicator for quantifying meteorological drought. An analytical workflow integrating Bayesian Estimator of Abrupt Change, Seasonality, and Trend (BEAST), MMK–Hurst coupling trend and persistence discrimination, Three-Threshold Run Theory and Partial Wavelet Coherence (PWC) is constructed. The framework systematically investigates drought spatiotemporal evolution, abrupt change features, persistent trend patterns and climatic driving effects over 1982–2024. The results indicate the following: (1) In 1982–2024, the drought in the whole basin showed a slight aggravating trend, with an average drought trend rate of −0.000387. Spatially, this trend varied, with faster progression in the west and slower in the east, and more severe conditions in the west and milder conditions in the east. (2) 1988 was the driest year within the study period, with three drought peaks occurring in April, June and November. Annual mean SPEI-1 values indicated the severest drought in the Yishu-Si River system (YSR, −0.62), followed by the Shandong Peninsula and Coastal River systems (SPCR, −0.56), Huai River Mainstream River system (HRMR, −0.55), and the Lixia River system (LR, −0.52). (3) The probability that the mutation point for the seasonal component of the SPEI occurred in March 2001 was 74%, whilst the probability that the potential mutation signal for the trend component occurred in September 1998 was 44.1%. (4) Within the HRB, droughts covering over 95% of the basin intensified in spring and autumn. A mean Hurst index of 0.70 implies overall persistent drought evolution. MMK–Hurst coupled analysis revealed that the basin was predominantly dominated by mild, non-significant, persistent drought. (5) The typical cross-seasonal drought event of 1998–1999 exhibited multi-stage fluctuations, with the central and western hilly regions constituting the core cluster of extreme droughts. During this event, areas experiencing moderate drought accounted for 41.79%, whilst those experiencing extreme drought accounted for only 1.47%, and drought intensity diminished progressively from west to east. (6) Air-specific humidity (AH) constitutes an Average Wavelet Coherence (AWC) of 0.94 and a Percentage of Significant Power (POSP) of 12.20%. AH achieves the highest total POSP with only a marginal advantage relative to SM. The multi-method coupled analysis framework established in this study provides theoretical support for regionalized drought early warning, water resource regulation, and disaster prevention and mitigation in the HRB.
Full article

Figure 1
Open AccessArticle
Evaluating Rainfall Forecast Skill in Numerical Weather Prediction Models and the Effects of Bias Correction on the PCJ (Piracicaba-Capivari-Jundiaí) River Basins in Brazil
by
Violet Ishak, Danieli Mara Ferreira, Maria Fernanda Dames dos Santos Lima and José Eduardo Gonçalves
Hydrology 2026, 13(9), 254; https://doi.org/10.3390/hydrology13090254 - 16 Sep 2026
Abstract
►▼
Show Figures
Precipitation forecasts from numerical weather prediction systems can contain systematic errors in both occurrence and magnitude, limiting their usefulness for hydrological applications. This study evaluated two operational precipitation forecasting systems against two observational reference datasets across three basins in São Paulo State, Brazil,
[...] Read more.
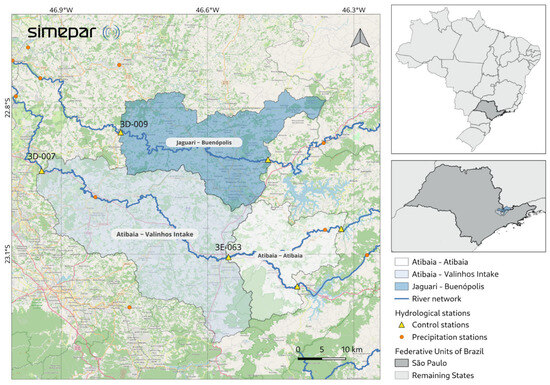
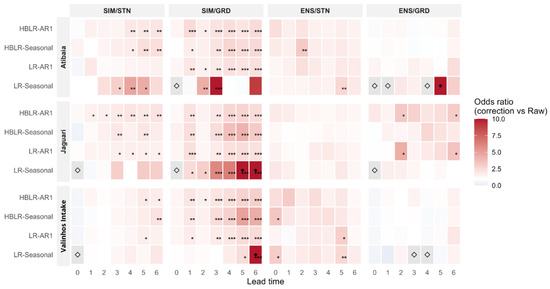
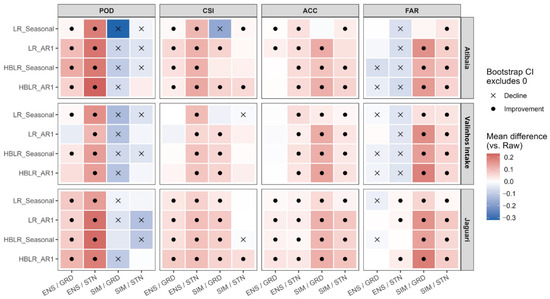
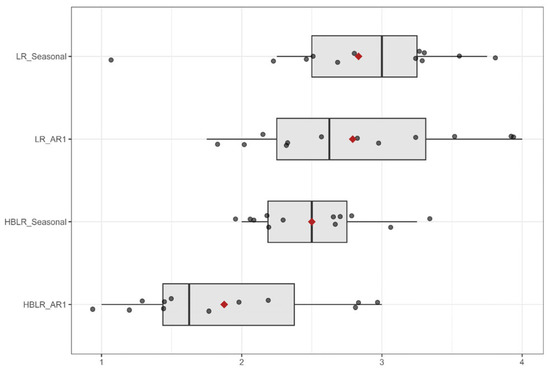
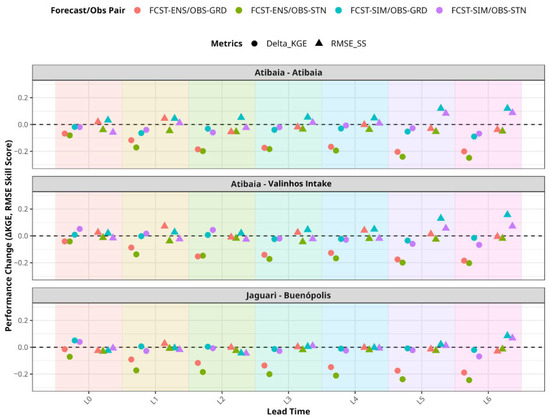
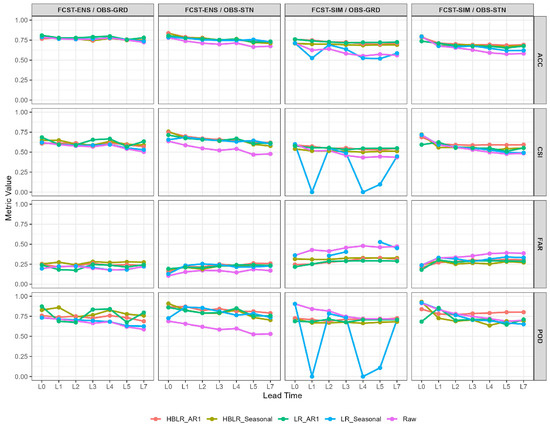
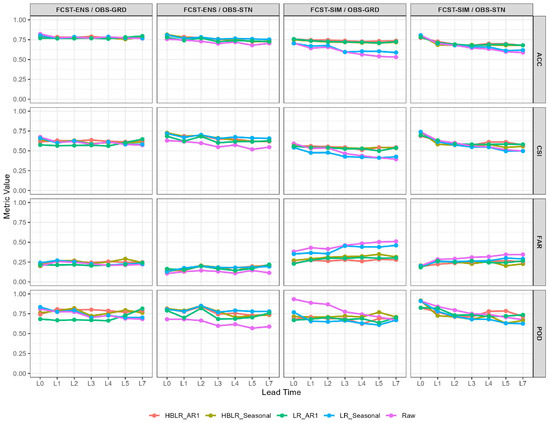
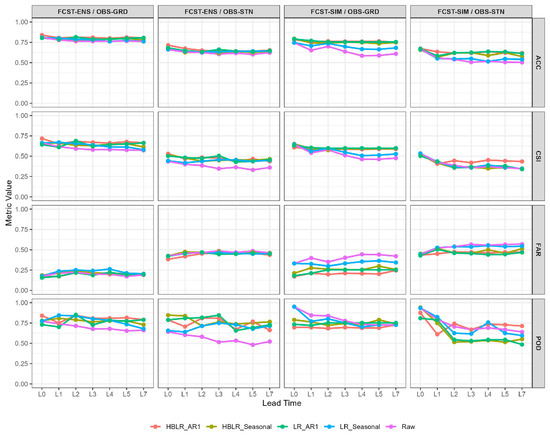
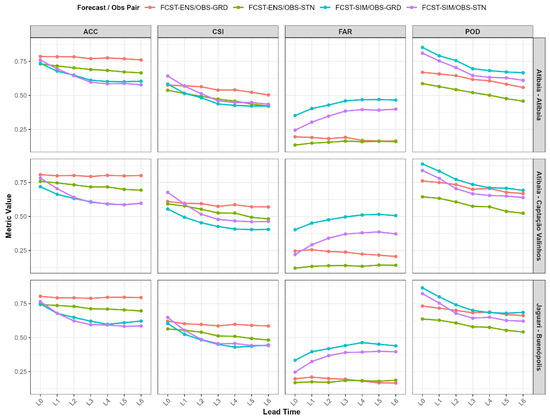
Precipitation forecasts from numerical weather prediction systems can contain systematic errors in both occurrence and magnitude, limiting their usefulness for hydrological applications. This study evaluated two operational precipitation forecasting systems against two observational reference datasets across three basins in São Paulo State, Brazil, and assessed statistical post-processing for dry/wet occurrence and precipitation magnitude. Four logistic-regression-based methods were evaluated for occurrence correction, while Quantile Delta Mapping (QDM) was applied to precipitation amounts. Occurrence correction was assessed using POD, FAR, CSI, and ACC, with dry days defined as the event. Changes in individual classifications were evaluated using the exact McNemar test, while changes in categorical metrics across seven lead times were assessed using exact paired permutation tests and bootstrap 95% confidence intervals. A descriptive multi-metric ranking was used to compare correction methods. QDM was evaluated using RMSE skill score and KGE. Occurrence correction modified categorical performance, with effects depending on forecast–observation pairing, basin, and lead time. The McNemar test identified significant classification changes after Holm adjustment in some configurations, whereas the permutation tests did not provide evidence of systematic metric improvement. HBLR-AR1 showed the most balanced overall performance, whereas LR-Seasonal was the least consistent method. QDM improved RMSE skill, particularly at longer lead times, but did not consistently improve KGE. Overall, correction effectiveness depended on forecast–observation discrepancies.
Full article

Figure 1
Open AccessArticle
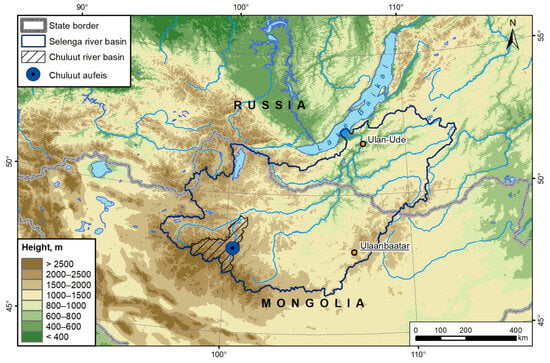
Long-Term Dynamics of Aufeis and Their Association with Vegetation Phenology: A Case Study in the Chuluut River Valley, Mongolia
by
Margarita Zharnikova, Alexander Ayurzhanaev, Vladimir Chernykh, Bator Sodnomov, Zhargalma Alymbaeva, Endon Garmaev and Avirmed Dashtseren
Hydrology 2026, 13(9), 253; https://doi.org/10.3390/hydrology13090253 - 16 Sep 2026
Abstract
►▼
Show Figures
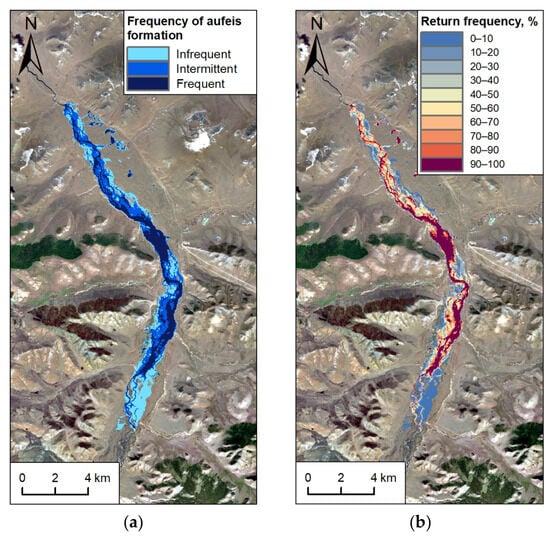
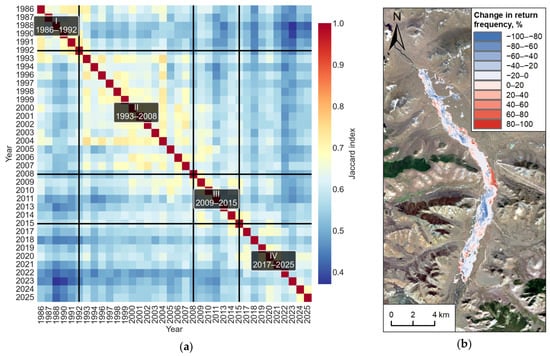
Multi-temporal satellite data were used to examine changes in aufeis area and spatial configuration in the Chuluut River valley, Mongolia, and to compare seasonal vegetation dynamics among sites with different return frequencies of aufeis. Annual aufeis masks were derived from Landsat imagery for
[...] Read more.
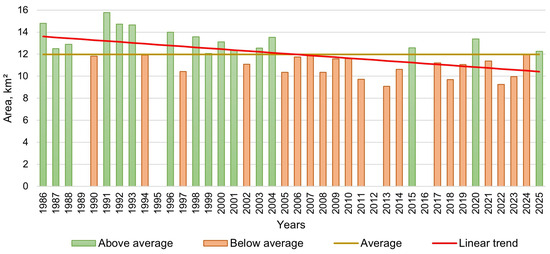
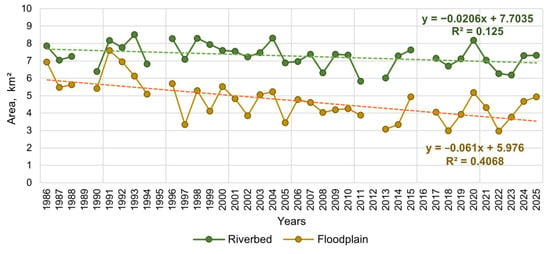
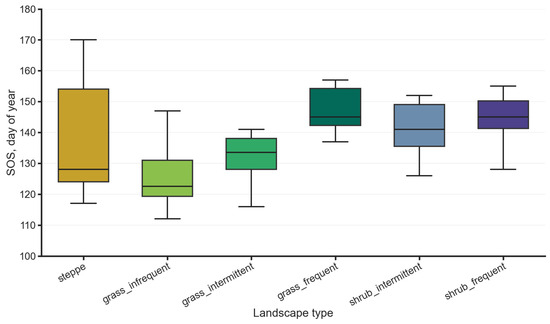
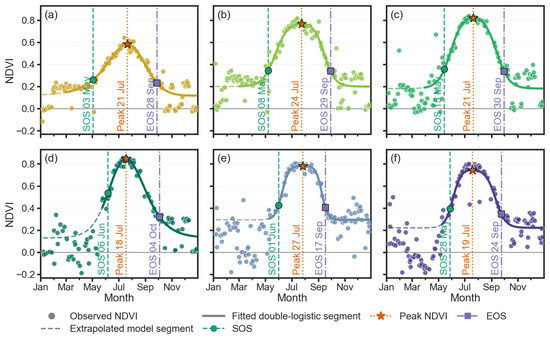
Multi-temporal satellite data were used to examine changes in aufeis area and spatial configuration in the Chuluut River valley, Mongolia, and to compare seasonal vegetation dynamics among sites with different return frequencies of aufeis. Annual aufeis masks were derived from Landsat imagery for 1986–2025, while vegetation phenology was assessed using Harmonized Landsat–Sentinel-2 (HLS) data for 2016–2025. Mean aufeis area was 11.98 km2 and declined significantly by approximately 0.084 km2 per year, accompanied by spatial reorganization. The strongest climatic association was found with April–June precipitation in the preceding year. Hydrologically, aufeis acts as a temporary seasonal water store, retaining part of winter discharge and releasing meltwater during spring. Its decline and redistribution may alter the timing and pathways of seasonal water release, reduce delayed moisture inputs to floodplain surfaces, and modify water availability for riparian and meadow ecosystems. In meadows, the start of season (SOS) occurred later under frequent than infrequent aufeis recurrence. Peak and mean summer normalized difference vegetation index (NDVI) values remained high after aufeis melt-out. The highest integrated seasonal NDVI values occurred under intermittent aufeis recurrence.
Full article

Figure 1
Open AccessArticle
Water Quality Indices for Irrigation and Drinking Water Supply: The Importance of Use-Specific Assessment
by
Daphne H. F. Muniz, Juaci V. Malaquias and Eduardo C. Oliveira-Filho
Hydrology 2026, 13(9), 252; https://doi.org/10.3390/hydrology13090252 - 16 Sep 2026
Abstract
Water quality indices are generally developed for specific water uses, but direct comparisons of indices designed for public water supply and irrigation using the same monitoring dataset remain limited. This study evaluated surface water quality in the Federal District (FD), Brazil, assessing its
[...] Read more.
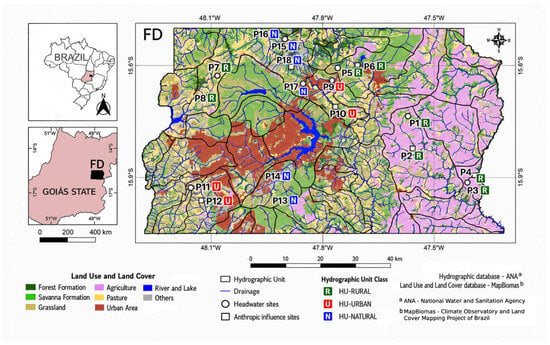
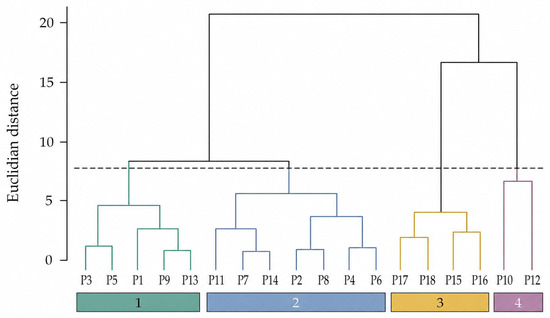
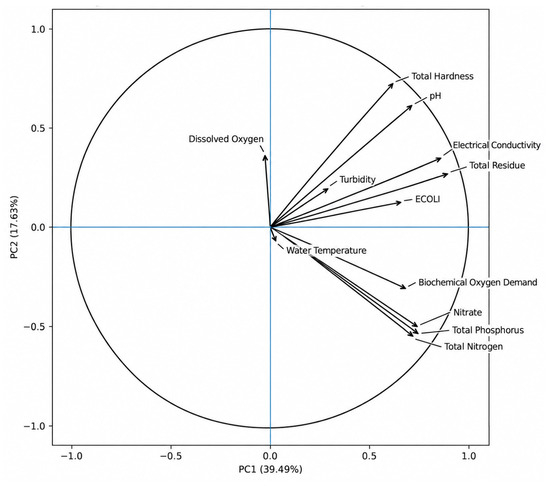
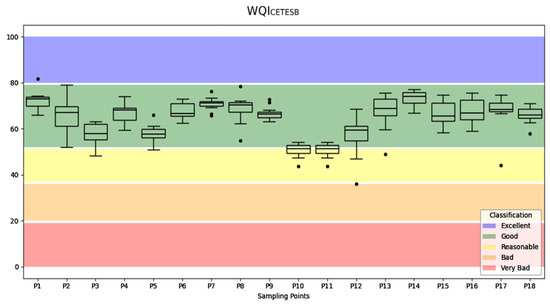
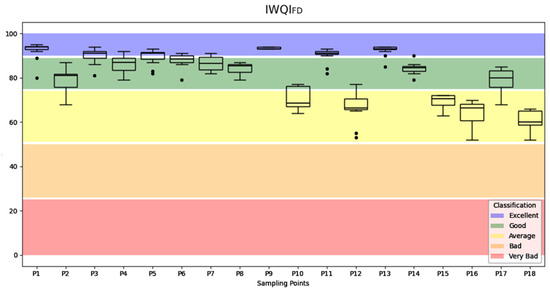
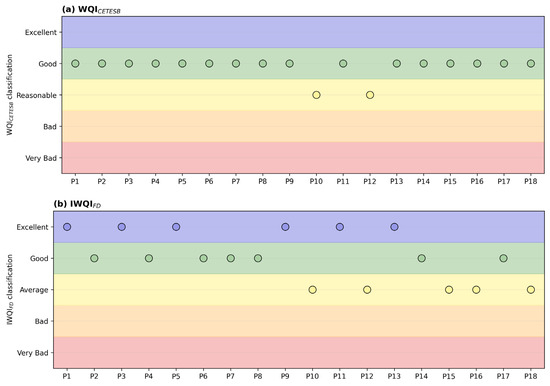
Water quality indices are generally developed for specific water uses, but direct comparisons of indices designed for public water supply and irrigation using the same monitoring dataset remain limited. This study evaluated surface water quality in the Federal District (FD), Brazil, assessing its suitability for public drinking water supply and irrigation under different land uses. Eighteen sampling sites across rural, urban, and natural hydrographic units were monitored bimonthly from December 2017 to October 2019. A total of 12 sampling campaigns were conducted, resulting in 12 samples per site and 216 samples overall. The reported water quality indices were calculated using the median values obtained over the monitoring period. Twelve physical, chemical, and microbiological parameters were analyzed to calculate the WQICETESB (for raw water intended for public drinking-water supply after treatment) and the IWQIFD (for irrigation). The WQICETESB classified 16 sampling sites as “Good” (52–79) and two as “Reasonable” (37–51), with no sites classified as “Excellent”. The IWQIFD classified six sampling sites as “Excellent” (90–100), seven as “Good” (75–89), and five as “Average” (51–74). No significant differences were detected among broad land use categories, whereas seasonal differences were observed for water temperature, turbidity, total phosphorus, and total nitrogen. Multivariate analyses indicated site-specific patterns associated with anthropogenic and natural hydrogeochemical influences. Even in natural areas, water may not meet optimal conditions for irrigation. The IWQIFD yielded more favorable classifications than the WQICETESB at several sampling sites, reflecting differences in parameter selection, weighting structure, classification thresholds, and intended uses. These findings reinforce the importance of use-specific water-quality assessment and demonstrate the value of WQIs as complementary tools for integrating complex datasets and supporting Integrated Water Resources Management (IWRM). For management purposes, index selection should be aligned with the intended water use, while critical individual parameters should also be evaluated alongside aggregated index scores.
Full article
(This article belongs to the Special Issue Integrated Hydrological and Water Quality Approaches for Assessing and Mitigating Pollution in River, Lake and Reservoir Basins)
►▼
Show Figures

Figure 1
Open AccessArticle
Spatial Variability and Magnitude of Soil Erosion in Vineyards Across Spain: Insights from Standardized ISUM Measurements
by
Jesús Rodrigo-Comino, Antonio Jódar-Abellán, Alejandro Florido-Tomé, Manuel López-Vicente, José Manuel Mirás-Avalos, Javier J. Cancela, Jesús Barrena-González, Manuel Pulido, Noemí Lana-Renault, José Arnáez, Andrés Caballero-Calvo, María Teresa González-Moreno, Laura Cambronero-Ruiz, Lucía Moreno-Cuenca, Susana García-Pisabarros, Marta García-Fernández, María Fernández-Raga and Artemi Cerdà
Hydrology 2026, 13(9), 251; https://doi.org/10.3390/hydrology13090251 - 16 Sep 2026
Abstract
Soil erosion and sediment redistribution in vineyards often exceed tolerable thresholds, but comparative field measurements across regions remain limited because studies use different methods and sampling designs. This study assesses soil redistribution in vineyards using a common field-based approach. Thirteen vineyard sites across
[...] Read more.
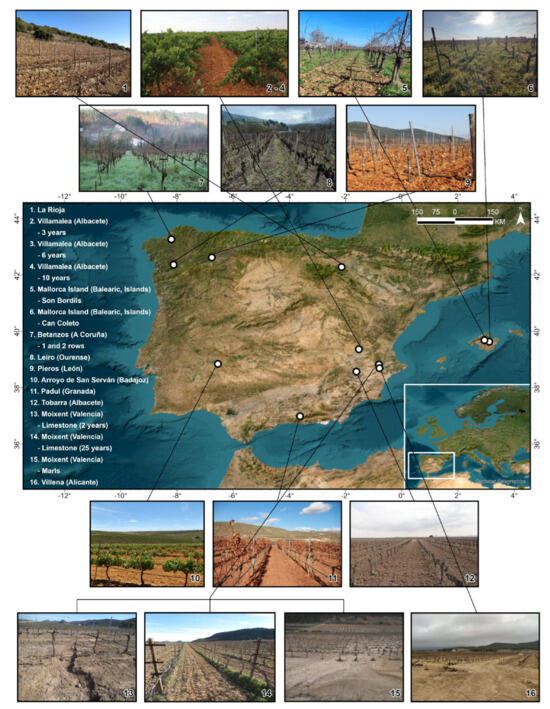
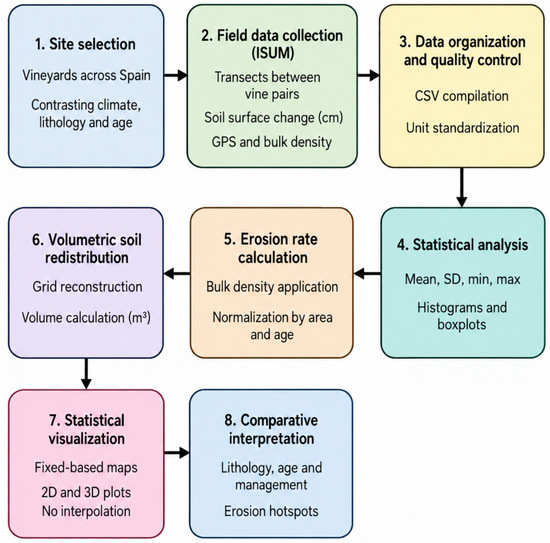
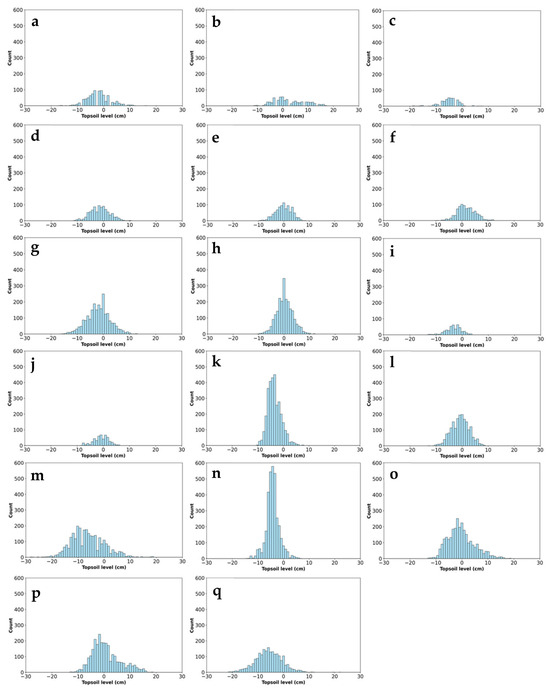
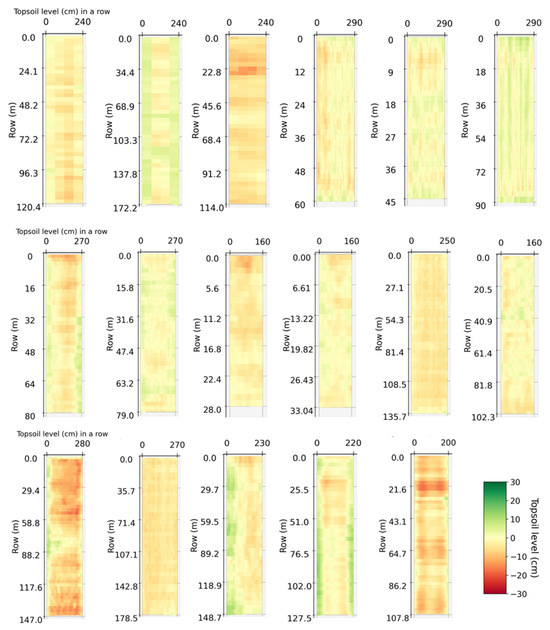
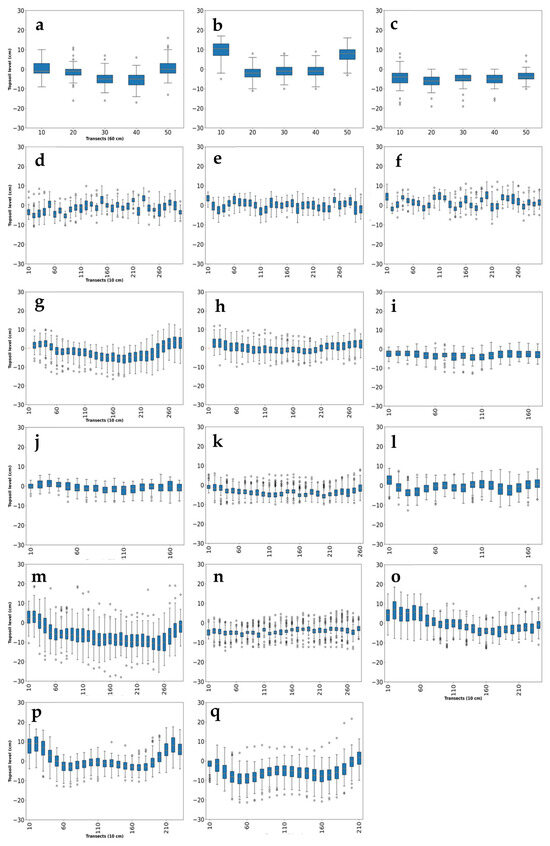
Soil erosion and sediment redistribution in vineyards often exceed tolerable thresholds, but comparative field measurements across regions remain limited because studies use different methods and sampling designs. This study assesses soil redistribution in vineyards using a common field-based approach. Thirteen vineyard sites across Spain, covering contrasting climates, parent materials, soil types, management conditions, and vineyard ages (2–40 years), were surveyed using the Improved Stock Unearthing Method (ISUM). Soil surface changes were measured along systematic transects and combined with site-specific bulk density and vineyard age to estimate soil mobilization rates in t ha−1 yr−1. Measured surface changes ranged from −28 to +19 cm, while soil mobilization rates varied considerably among sites. The highest net soil losses were recorded in a young vineyard developed on limestone (−103.3 t ha−1 yr−1) and in a vineyard on marls (−87.7 t ha−1 yr−1). Other sites showed moderate net erosion (−3.9 to −15.4 t ha−1 yr−1), whereas positive balances (+7.2 to +17.9 t ha−1 yr−1) were observed in some older or more stable vineyards. Differences among sites suggest that vineyard age and parent material are relevant factors when interpreting erosion magnitude, while management conditions may contribute to the spatial variability of soil redistribution. Spatial maps based directly on ISUM measurements showed marked differences between erosion and deposition areas within individual vineyards, without the use of spatial interpolation. Applying the same ISUM protocol across contrasting vineyard conditions allowed soil redistribution patterns to be compared using a consistent field procedure. The results also showed the large variability that can occur among vineyard systems.
Full article
(This article belongs to the Special Issue State-of-the-Art on Soil Erosion and Hydrological Connectivity)
►▼
Show Figures

Figure 1
Open AccessArticle
Hydraulic Performance of Variable-Tread Stepped Spillways: Froude Number Reduction and Energy Redistribution at the Stilling-Basin Inlet
by
Luis Antonio Yataco Pastor, Yoisdel Castillo Alvarez, Reinier Jiménez Borges, Marcos Aviles, Omar Rodríguez-Abreo, Luis Angel Iturralde Carrera, Carlos Alberto González-Gutiérrez and Juvenal Rodríguez-Reséndiz
Hydrology 2026, 13(9), 250; https://doi.org/10.3390/hydrology13090250 - 15 Sep 2026
Abstract
Transverse modification of step geometry has been repeatedly proposed as a means of increasing energy dissipation in stepped spillways, with numerically reported gains ranging from 5.6% to 34.7% for labyrinth configurations, in unresolved contradiction with air–water experimental evidence that detects no measurable difference.
[...] Read more.
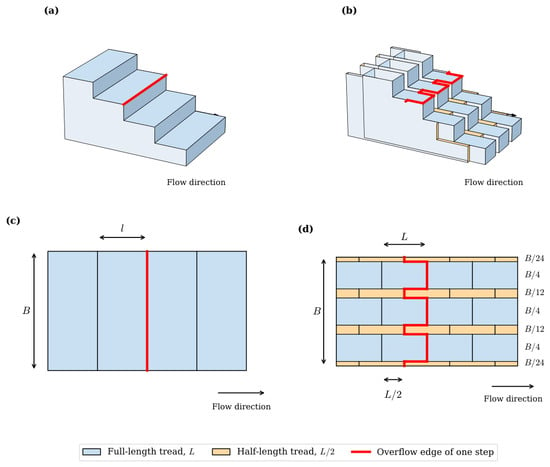
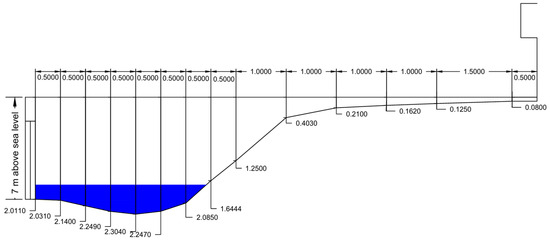
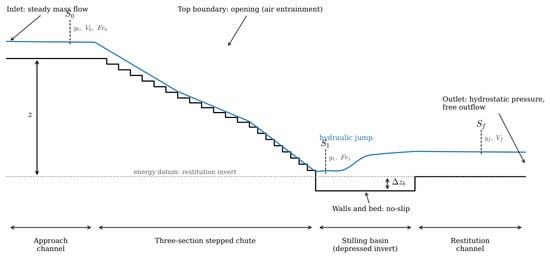
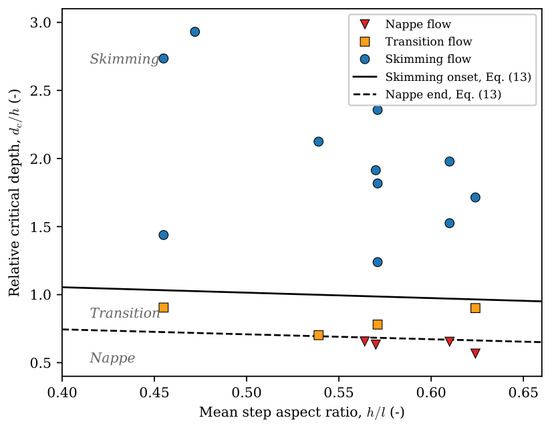
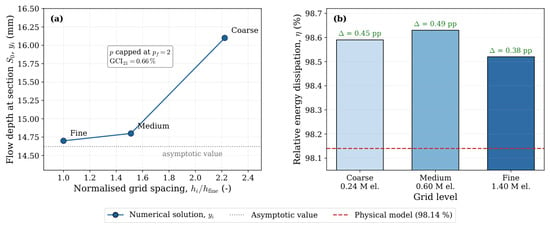
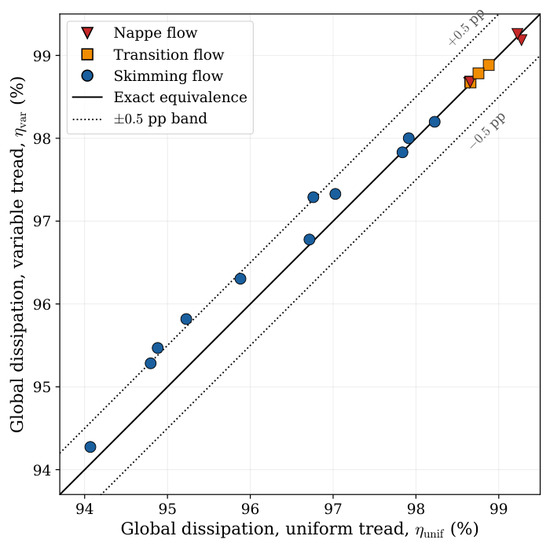
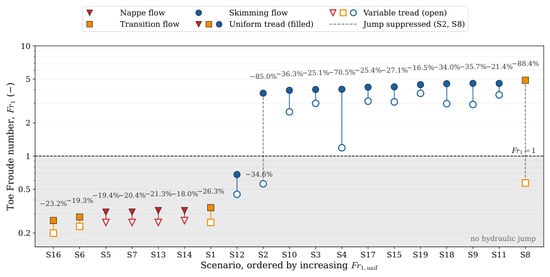
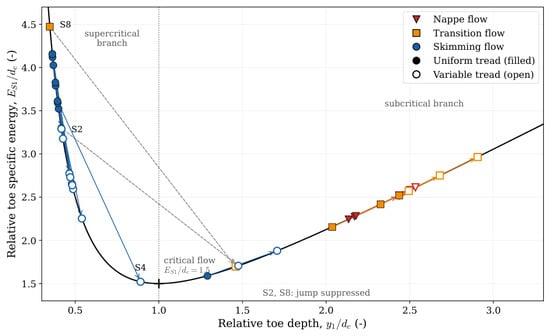
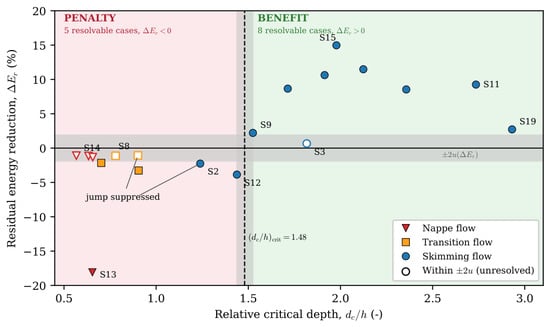
Transverse modification of step geometry has been repeatedly proposed as a means of increasing energy dissipation in stepped spillways, with numerically reported gains ranging from 5.6% to 34.7% for labyrinth configurations, in unresolved contradiction with air–water experimental evidence that detects no measurable difference. The objective of this study is threefold: to verify whether the transverse alternation of the tread length increases the net energy dissipation of the coupled chute–stilling basin system, to quantify its effect on the kinematic and energetic state of the flow delivered to the terminal energy dissipator, and to delimit its domain of applicability. That premise is subjected to verification through 38 three-dimensional Reynolds-averaged Navier–Stokes (RANS) simulations (k– shear-stress transport (SST) closure, homogeneous volume-of-fluid (VOF) formulation) performed in ANSYS CFX 2025 R2, comparing a three-section stepped spillway with a uniform rectilinear footprint against a configuration with transverse L– alternation, under 19 geometric–hydraulic combinations spanning the nappe, transition, and skimming flow regimes ( ). The model was verified through a mesh-convergence analysis of the uniform configuration (grid convergence index, GCI , on the approach depth) and validated against a physical scale model (0.38% discrepancy, exceeding the propagated experimental uncertainty); a three-level mesh study of the variable-tread configuration shows that its toe-flow response develops as the transverse tread strips become resolved and is not yet mesh-independent at the finest level, which is stated as a limitation of the quantitative results. Because the homogeneous multiphase formulation does not include an air-entrainment submodel, all results correspond to the modeled non-aerated flow conditions. The results do not support the hypothesis of a net dissipative gain: the global energy balance of the two topologies is equivalent within the numerical resolution of the study (bias pp; root-mean-square error (RMSE) 0.26 pp), of the order of the discretization uncertainty of the study itself. The actual effect is a redistribution of the dissipative partition that conditions the flow delivered to the energy dissipator: the toe Froude number is reduced in all 19 paired cases (16.5–88.4%; mean: 34.1%). In nine scenarios the hydraulic jump is conditioned without being suppressed ( from 3.95–4.57 to 1.19–3.71), the energy delivered to the stilling basin drops by 18.3–57.9%, and the residual energy decreases by up to 14.98%; under subcritical toe flow, the same thickening increases the delivered energy by 12.3–19.4% and penalizes the residual energy by up to 18.08%; in two intermediate-discharge scenarios the jump is suppressed, yielding no benefit whatsoever. The transition is expressed through a critical threshold, nominally within the observed separation interval : the thirteen resolvable scenarios preserve the predicted sign separation without exception. The variable footprint is not a dissipation intensifier but a chute–dissipator coupling element, applicable only to high relative discharges.
Full article
(This article belongs to the Special Issue Advancements in Measuring and Modelling River Flow Characteristics and Sediment Transport)
►▼
Show Figures

Figure 1
Open AccessArticle
Multi-Seasonal Analysis of Hydroclimate Variability and Anthropogenic Pressures on the Keta and Muni-Pomadze Wetlands
by
Francis Quayson and Xiaoli Ding
Hydrology 2026, 13(9), 249; https://doi.org/10.3390/hydrology13090249 - 15 Sep 2026
Abstract
►▼
Show Figures
Wetlands regulate hydrological processes, maintain biodiversity, and moderate local climate. However, long-term evidence on hydroclimatic variability and anthropogenic pressure in West African coastal wetlands remains limited. This study assesses rainfall, land surface temperature (LST), and land use/land cover (LULC) change in the Keta
[...] Read more.
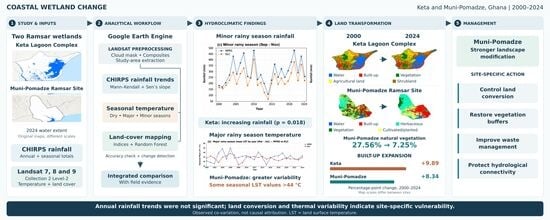
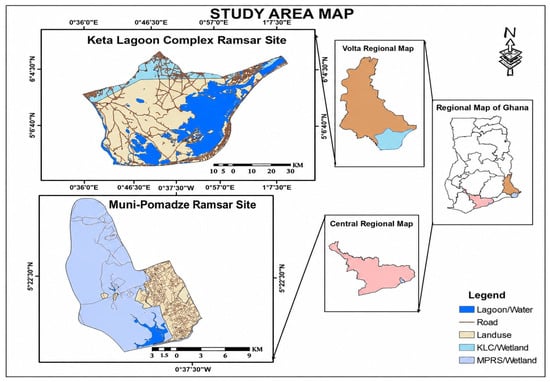
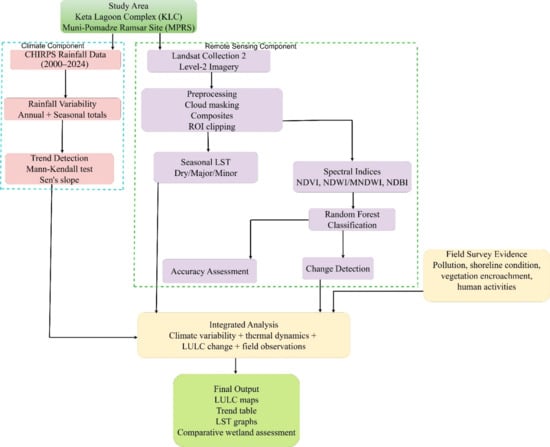
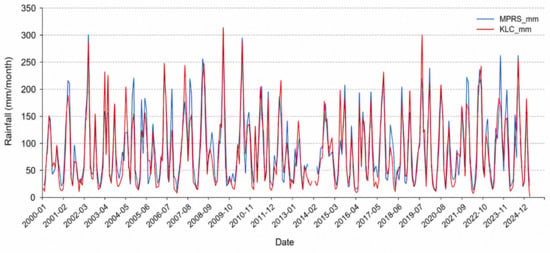
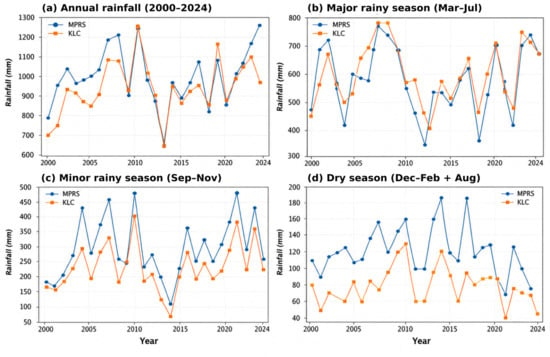
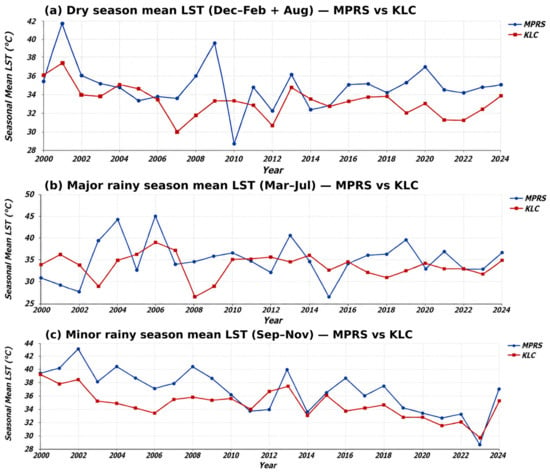
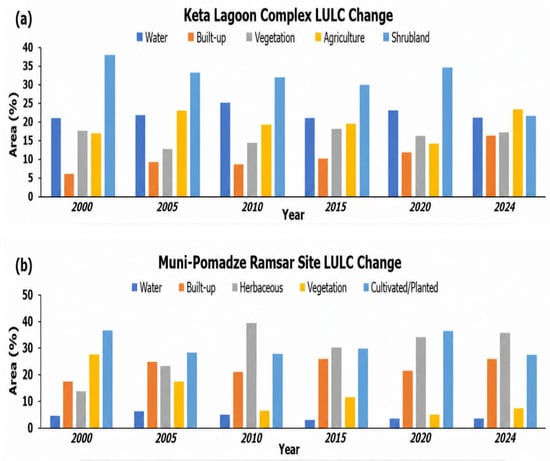
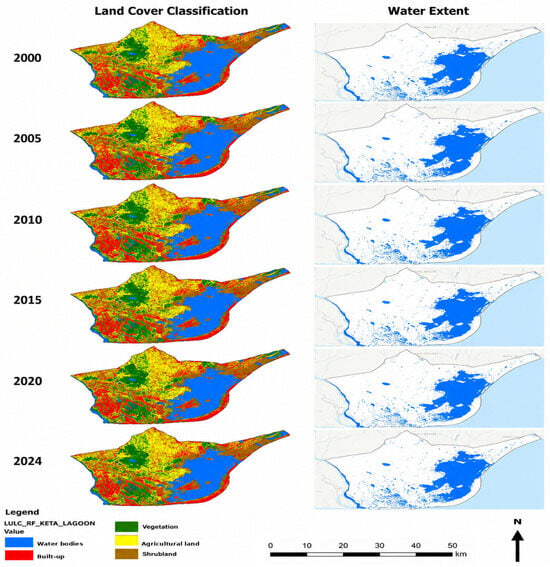
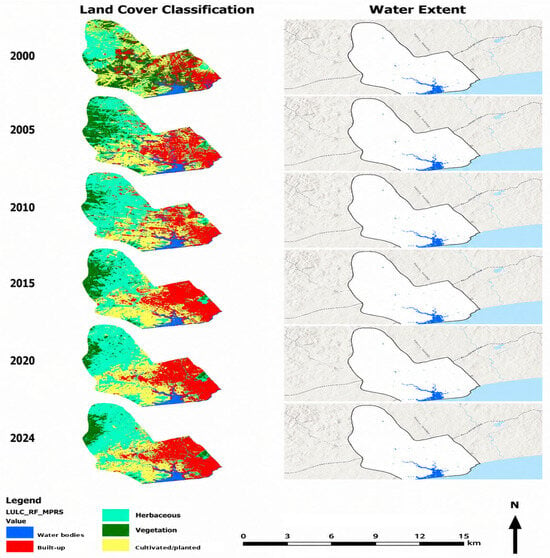
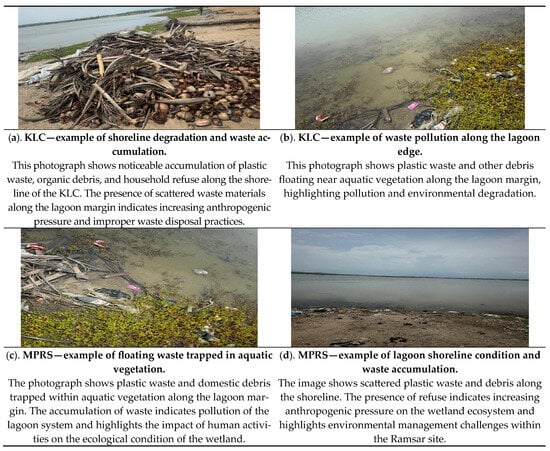
Wetlands regulate hydrological processes, maintain biodiversity, and moderate local climate. However, long-term evidence on hydroclimatic variability and anthropogenic pressure in West African coastal wetlands remains limited. This study assesses rainfall, land surface temperature (LST), and land use/land cover (LULC) change in the Keta Lagoon Complex (KLC) and Muni-Pomadze Ramsar Site (MPRS) from 2000 to 2024. Mann–Kendall tests and Sen’s slope estimators were applied to annual and seasonal rainfall, while Landsat observations were used to evaluate seasonal LST and classify LULC. The indicators were compared across sites and through time to assess their correspondence without attributing causality. Annual rainfall trends were weak and not statistically significant, although minor rainy-season rainfall increased significantly at KLC (p = 0.018). MPRS showed greater thermal variability, with some major rainy season LST values exceeding 44 °C. Built-up cover increased by 9.89 percentage points at KLC and 8.34 percentage points at MPRS, while natural vegetation at MPRS declined from 27.56% to 7.25%. These concurrent patterns indicate stronger landscape modification and lower apparent buffering capacity at MPRS. The findings support site-specific controls on land conversion, restoration of vegetation buffers, improved waste management, and protection of hydrological connectivity. Because the study is comparative rather than causal, the results identify co-variation among indicators but do not quantify the relative contributions of climatic and anthropogenic drivers.
Full article

Graphical abstract
Open AccessArticle
Rapid Development of Small Steep-Walled Sinkholes Associated with Forest Clearing and Later Water-Table Drawdown
by
Gregg Davidson and Yung-Yu Chiu
Hydrology 2026, 13(9), 248; https://doi.org/10.3390/hydrology13090248 - 15 Sep 2026
Abstract
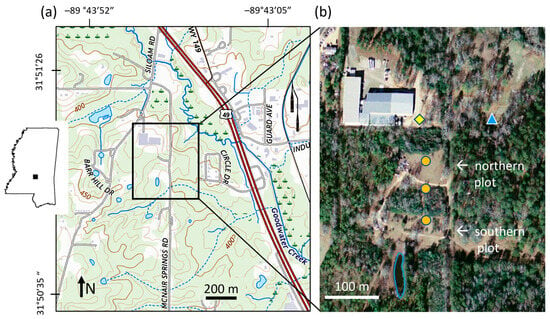
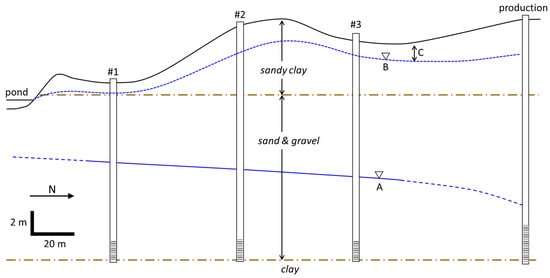
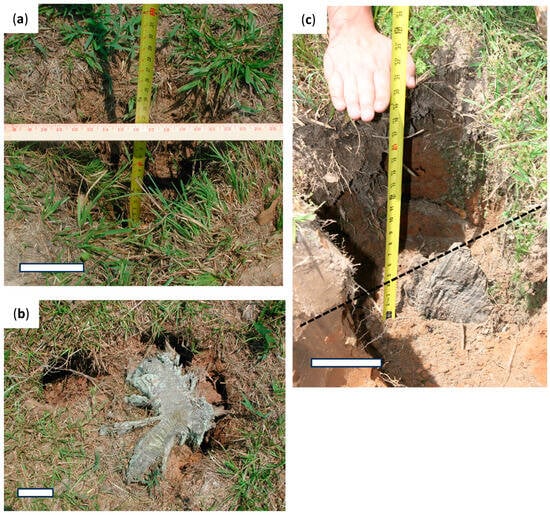
More than 100 small sinkholes, 12 to 50 cm wide and 10 to 80 cm deep, developed rapidly in sandy-clay soils in two adjacent plots in south-central Mississippi, USA, following the installation and operation of a nearby high-capacity water well. The local area
[...] Read more.
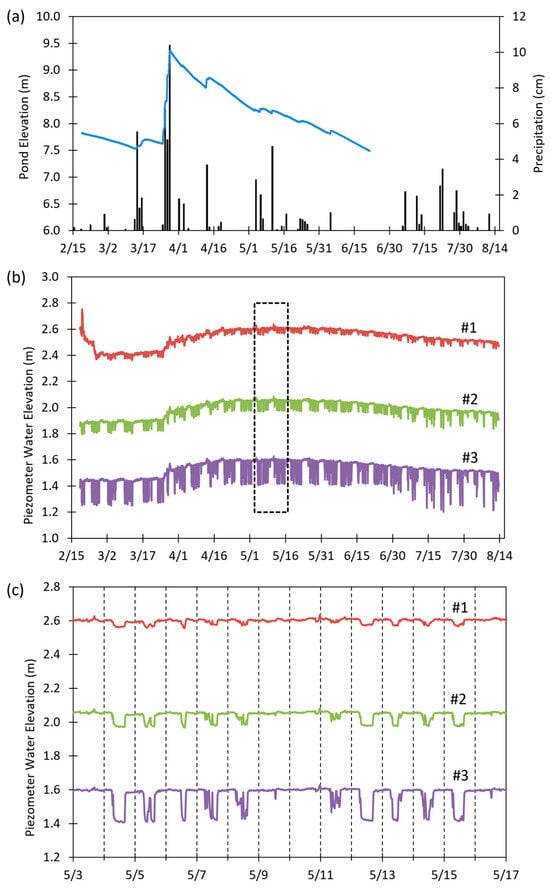
More than 100 small sinkholes, 12 to 50 cm wide and 10 to 80 cm deep, developed rapidly in sandy-clay soils in two adjacent plots in south-central Mississippi, USA, following the installation and operation of a nearby high-capacity water well. The local area is not known for karst features, evaporite dissolution cavities, underground mining, soil erosion around manmade structures, or desiccation fractures of shallow clays. When studied several years after first appearing, the sinkholes had nearly vertical walls, with some cavities widening with depth. Some had tree stumps visible in the center. Further investigation found remnants of stumps or roots in and radiating outward from multiple sinkholes. Installation of piezometers along a transect revealed a continuous hydraulic gradient under the impacted property toward the production well and evidence of reduced overall water levels. The most plausible causes of rapid sinkhole formation are (1) initial partial preservation of tree stumps in soils saturated by a high water table and capillary action in fine-grained surface sediments, (2) lowering of the water table and aeration of near-surface sediments, and (3) accelerated decomposition of stumps faster than soil could creep or cave into the cavities. We propose designating the resulting features as “decomposition sinkholes.”
Full article
(This article belongs to the Special Issue Hydrological Signatures of a Changing Landscape: Land Degradation Impacts, Monitoring, and Restoration)
►▼
Show Figures

Figure 1
Open AccessArticle
Evaluating the Combined Impacts of Anthropogenic Disturbances and Climate Change on Future Streamflow Variations in the Minjiang River Basin
by
Minghao Chen, Kaijie Chen, Taihua Wang and Cong Li
Hydrology 2026, 13(9), 247; https://doi.org/10.3390/hydrology13090247 - 12 Sep 2026
Abstract
►▼
Show Figures
Future streamflow projections are critical for water management. In this study, we coupled the Geomorphology-Based Ecohydrological Model (GBEHM) with the Physics-aware Hybrid Learning and eXtreme Gradient Boosting models to provide a preliminary assessment of streamflow variations in the Minjiang River basin (MRB) over
[...] Read more.
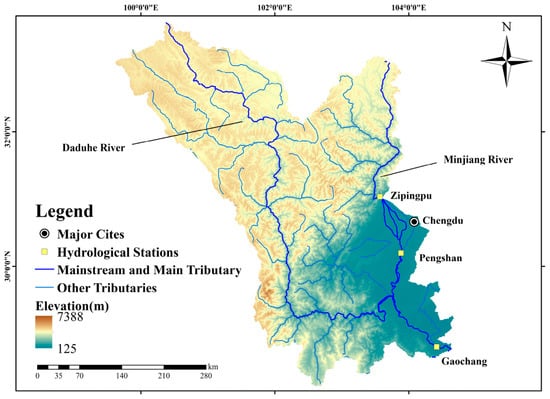
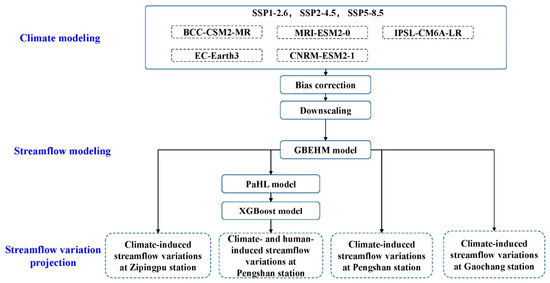
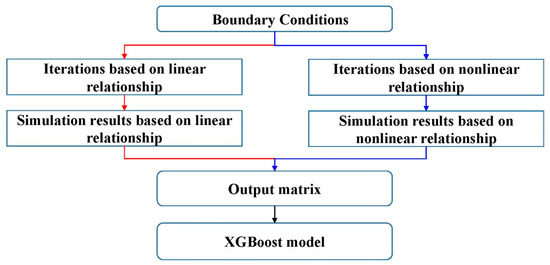
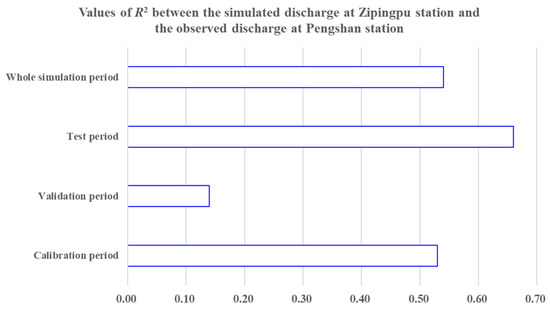
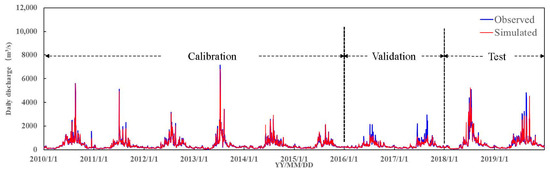
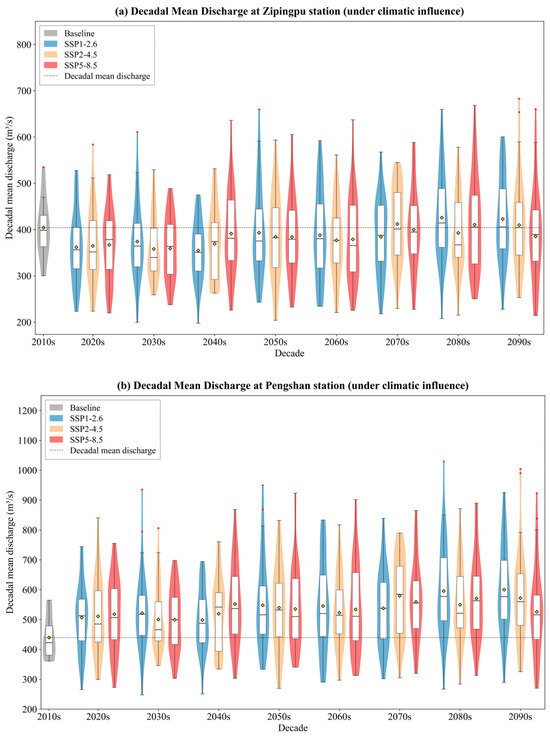
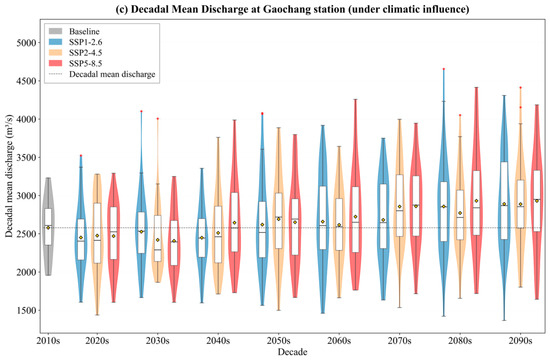
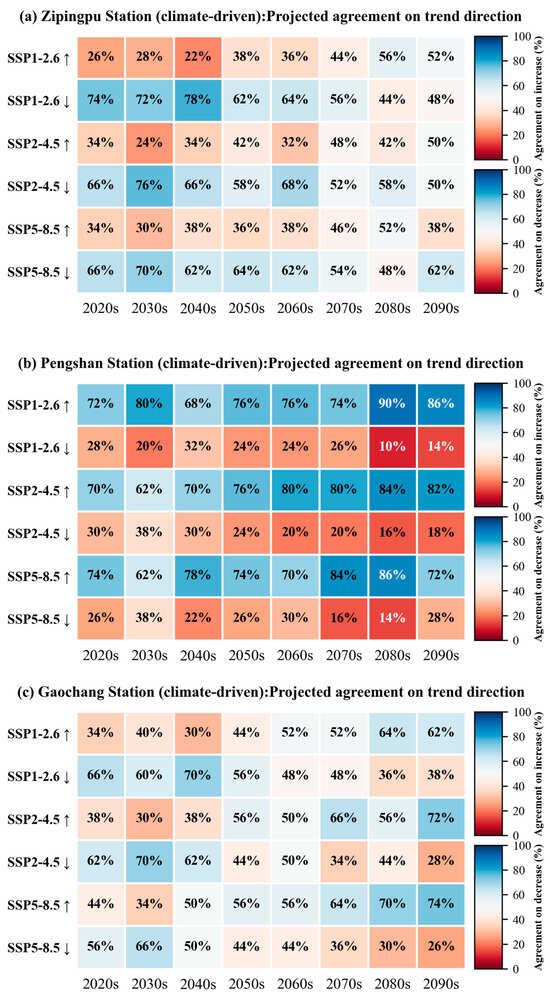
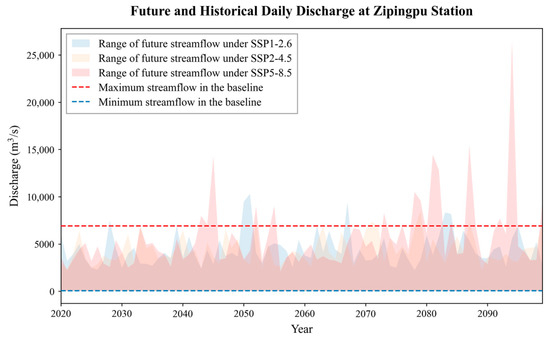
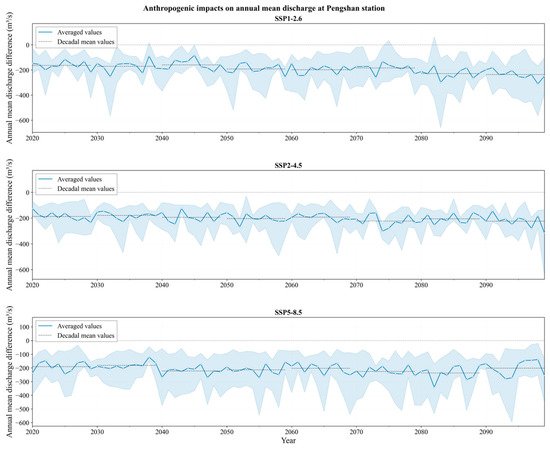
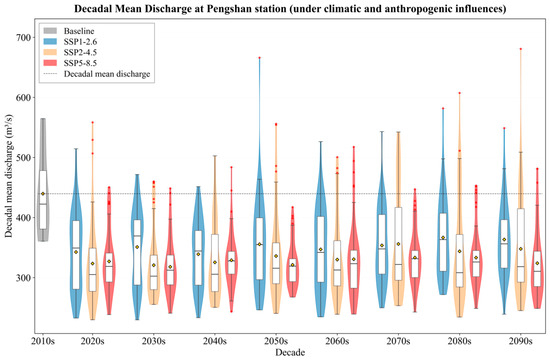
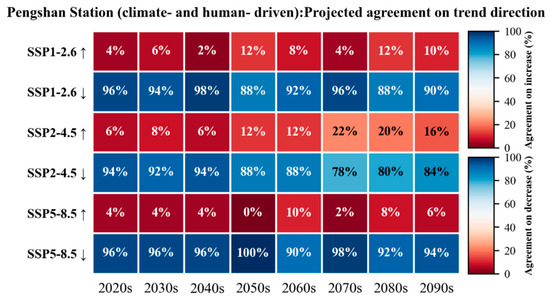
Future streamflow projections are critical for water management. In this study, we coupled the Geomorphology-Based Ecohydrological Model (GBEHM) with the Physics-aware Hybrid Learning and eXtreme Gradient Boosting models to provide a preliminary assessment of streamflow variations in the Minjiang River basin (MRB) over the period of 2020–2099 under the emission scenarios of five CMIP6 models, using data from the 2010s as the baseline. We considered both climatic and anthropogenic influences, assuming that the current anthropogenic disturbances and river network configuration will remain unchanged. The performance of the GBEHM is acceptable, with error metrics exceeding 0.80 and 0.60 before and after the impoundment of the Zipingpu Reservoir, respectively. The cascade of data-driven models demonstrates good performance, with error metrics exceeding 0.90 over the whole simulation period. Under the influence of climate change, the decadal mean streamflow at Zipingpu station will decrease by 2.73–12.16% before 2069 and increase thereafter, while at Gaochang station, it will generally increase by 1.44–13.67% after 2020. Moreover, the decadal mean streamflow at Pengshan station will increase by 13.22–36.41% over the coming decades. However, the combined effects of anthropogenic disturbances and climate change will significantly decrease future streamflow by 61.91–112.16 m3/s on average, corresponding to a reduction of 14.08–25.51% from the baseline. We also suggest strategies to mitigate future water risks and enhance basin management in the MRB.
Full article

Figure 1
Open AccessArticle
Analysis of the Drivers of Water-Level Changes in the Yamdrok Lake Basin During 2000–2023
by
Zhaocai Yi, Tongliang Gong, Cidan Yangzong, Qingqin Bai, Piaopiao Hu, Xiaoxian Li, Lei Li, Hao Zheng, Helin Qin, Shuyi He and Hanwen Liu
Hydrology 2026, 13(9), 246; https://doi.org/10.3390/hydrology13090246 - 12 Sep 2026
Abstract
►▼
Show Figures
Yamdrok Lake, a typical closed inland lake located in the southern Tibetan Plateau, is highly sensitive to climate change and human activities. Although previous studies have reported a declining lake-level trend, the mechanisms underlying the sharp decline since 2005 remain debated. In particular,
[...] Read more.
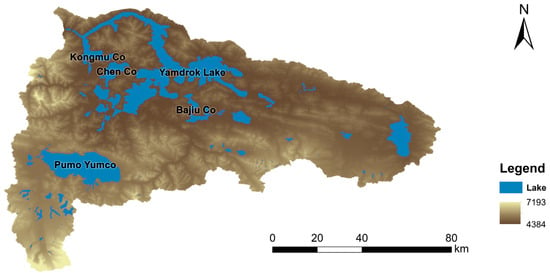
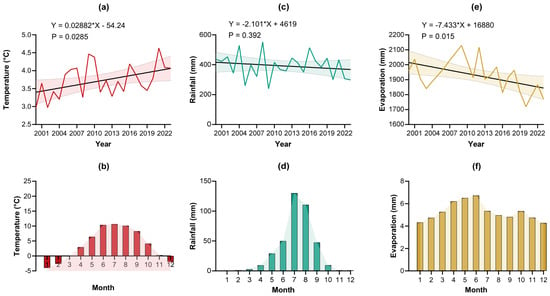
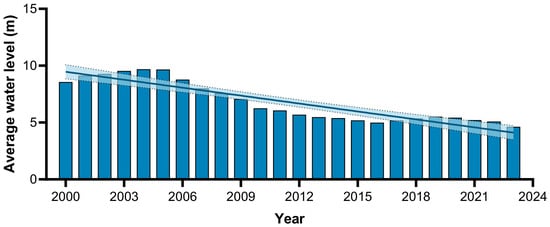
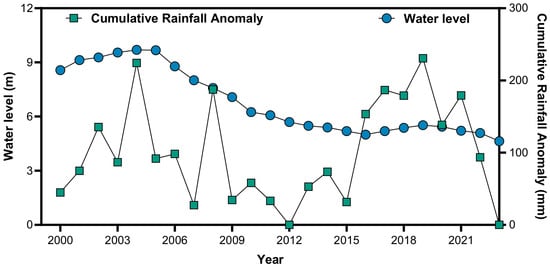
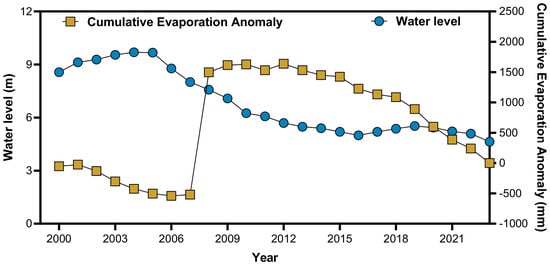
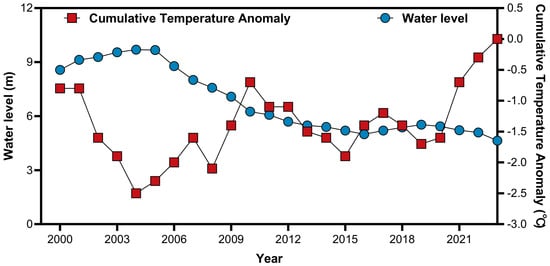
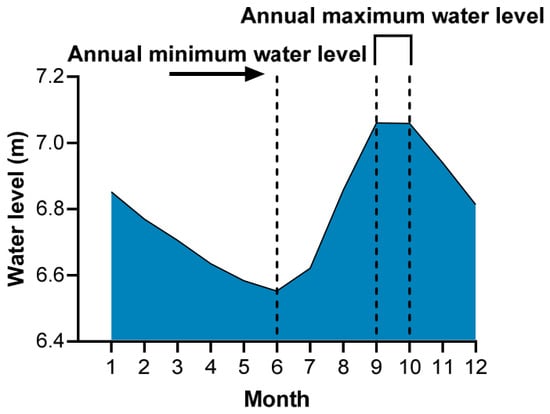
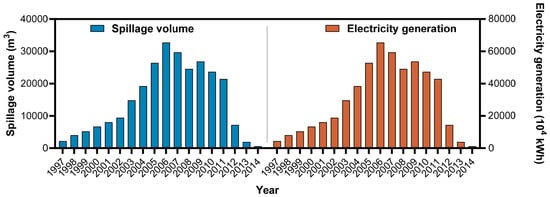
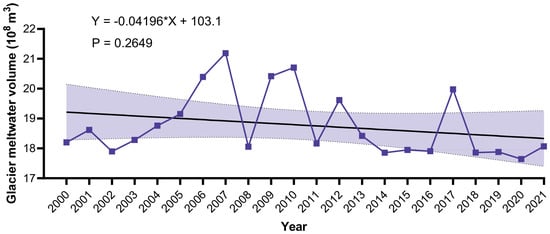
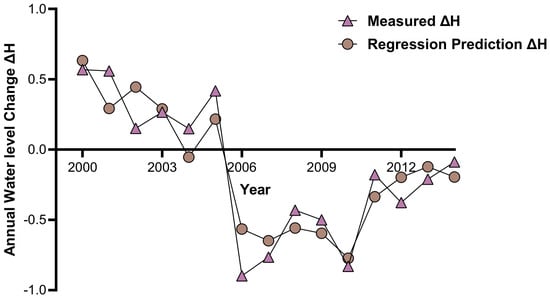
Yamdrok Lake, a typical closed inland lake located in the southern Tibetan Plateau, is highly sensitive to climate change and human activities. Although previous studies have reported a declining lake-level trend, the mechanisms underlying the sharp decline since 2005 remain debated. In particular, the disturbance effects of human activities, such as pumped-storage hydropower operations, have not been rigorously characterized, and quantitative attribution under the combined influence of multiple factors remains limited. This study aims to systematically identify the drivers of lake-level changes in Yamdrok Lake during 2000–2023 and to quantify the relative statistical explanatory power of climate change and human activities on lake-level fluctuations using Shapley R2 decomposition. We integrated 24 years of hydrological, meteorological, remote-sensing, and hydropower-operation data. Cumulative anomaly analysis, multiple linear regression, and Shapley R2 decomposition were employed to establish an attribution model incorporating rainfall, evaporation, temperature, glacier meltwater, and hydropower operation intensity, represented by annual electricity generation. The relative statistical explanatory power of these factors with respect to interannual lake-level changes (ΔH) was quantified using Shapley R2 decomposition for different periods, representing the proportion of variance in ΔH explained by each factor within the regression framework rather than absolute physical volumetric contributions, including hydropower-operation and non-operation periods. Results show that the annual mean water level of Yamdrok Lake declined significantly during 2000–2023, with a cumulative decrease of 5.1 m and an accelerated decline after 2005. The dominant controls shifted from an early rainfall–evaporation regime to a systematic water deficit dominated by rising temperature. Temperature increased significantly at a rate of 0.03 °C yr−1 (p < 0.05) and constituted the fundamental driver of the long-term lake-level decline. During the hydropower-operation period (2000–2014), the five factors jointly explained 84.51% of the variance in interannual lake-level changes, with hydropower operation intensity (32.32%), temperature (27.98%), and glacier meltwater (26.54%) being the three largest contributors in terms of statistical explanatory power. During the non-operation period (2015–2023), temperature consistently remained the most important individual contributor, accounting for 34.3–49.5% of the explained variance depending on whether missing glacier meltwater data for 2022–2023 were extrapolated or excluded from the analysis. Warming affects lake levels through two pathways: it directly enhances lake-surface evaporation and simultaneously promotes continuous glacier retreat within the basin. Glacier area decreased by approximately 30.5 km2 between 2000 and 2021, thereby weakening the long-term resilience of glacier-meltwater recharge. Consequently, the lake system has shifted from a dynamic balance toward a persistent state in which water losses exceed water inputs. Overall, lake-level changes in Yamdrok Lake represent the combined effects of progressive warming-induced water deficits and superimposed disturbances associated with hydropower operations. By extending observations to 2023 and incorporating dynamic glacier-area and hydropower-operation indicators, this study clarifies the temporal shift in dominant drivers, revises the previous interpretation that attributed lake-level decline primarily to reduced rainfall, and provides a scientific basis for lake-water-resource security assessment and climate-change adaptation on the Tibetan Plateau.
Full article

Figure 1
Open AccessArticle
Interpolation Strategy Selection for Areal Rainfall Estimation in an Extremely Sparse-Gauge Small Catchment: An Event-Scale Comparison Using Gauge and Radar References
by
Yongli Ma, Cheng Chen, Furong Xu, Haigang Li, Xiaojun Zhang, Yanzhi Liu, Qinghui Jiang and Xiaobo Zhang
Hydrology 2026, 13(9), 245; https://doi.org/10.3390/hydrology13090245 - 11 Sep 2026
Abstract
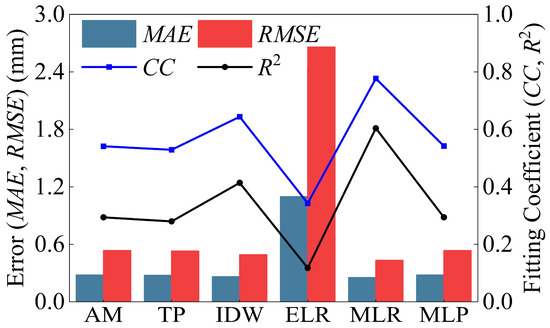
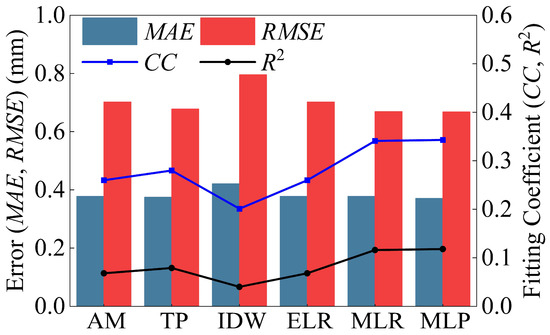
Accurate areal rainfall estimation is essential for hydrological modeling and flood forecasting, yet method selection remains uncertain in small catchments with extremely sparse gauge networks. This event-scale study compared arithmetic mean (AM), Thiessen polygon (TP), inverse distance weighting (IDW), precipitation–elevation linear regression (ELR),
[...] Read more.
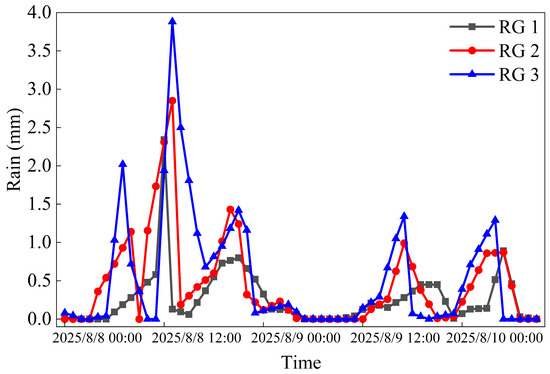
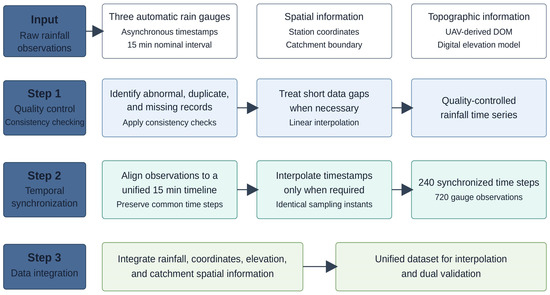
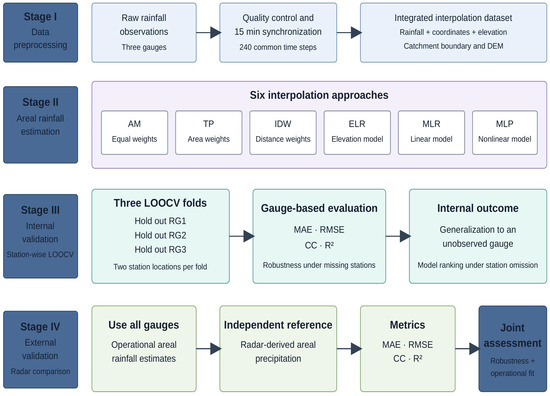
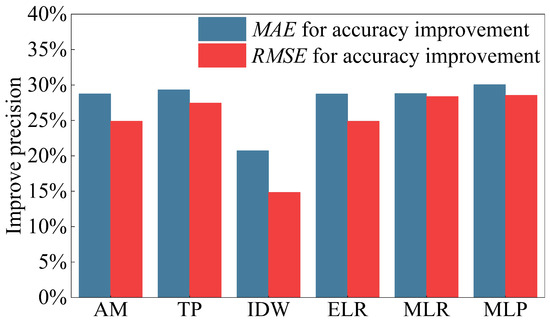
Accurate areal rainfall estimation is essential for hydrological modeling and flood forecasting, yet method selection remains uncertain in small catchments with extremely sparse gauge networks. This event-scale study compared arithmetic mean (AM), Thiessen polygon (TP), inverse distance weighting (IDW), precipitation–elevation linear regression (ELR), multiple linear regression (MLR), and a multi-layer perceptron (MLP) in a 0.719 km2 catchment monitored by three gauges. Two complementary evaluations were conducted. Station-wise leave-one-out cross-validation (LOOCV) assessed prediction at an omitted gauge, whereas a radar-referenced comparison assessed catchment-average estimates obtained from the complete gauge network. MLR produced the lowest LOOCV error (RMSE = 0.433 mm; CC = 0.777). In the radar comparison, MLP and MLR produced nearly identical RMSE values of 0.668 and 0.669 mm, respectively, and are therefore interpreted as practically similar rather than meaningfully different. All method rankings are conditional on the selected 60 h event, the three-gauge arrangement, and uncertainty in the radar reference. The findings demonstrate that station-omission performance and full-network areal estimation address different operational questions and should be considered together when selecting an interpolation method for extremely sparse networks.
Full article
(This article belongs to the Section Hydrological Measurements and Instrumentation)
►▼
Show Figures

Figure 1
Open AccessArticle
A Hierarchical Artificial Intelligence Framework for the Inverse Calibration of Spatially Distributed Manning’s Roughness Coefficients in HEC-RAS Models
by
Khabeer Al-Awad, Layth Abdulameer, Mahmoud Saleh Al-Khafaji, Aysar Tuama Al-Awadi, Ahmed N. Al-Dujaili, Anmar Dulaimi, Luís Filipe Almeida Bernardo and Hugo Alexandre Silva Pinto
Hydrology 2026, 13(9), 244; https://doi.org/10.3390/hydrology13090244 - 10 Sep 2026
Abstract
Accurate calibration of Manning’s roughness coefficients is essential for reliable river hydraulic modelling, flood prediction, and water resources management, yet conventional calibration methods often struggle with high-dimensional parameter spaces and nonlinear hydraulic interactions. This study proposes and evaluates a hierarchical artificial intelligence framework
[...] Read more.
Accurate calibration of Manning’s roughness coefficients is essential for reliable river hydraulic modelling, flood prediction, and water resources management, yet conventional calibration methods often struggle with high-dimensional parameter spaces and nonlinear hydraulic interactions. This study proposes and evaluates a hierarchical artificial intelligence framework for the inverse calibration of spatially distributed Manning’s roughness coefficients across three channel zones (left bank, main channel, and right bank), using a 48 km reach of the Tigris River in Baghdad as a case study. A one-dimensional HEC-RAS hydraulic model based on 30 measured cross-sections generated 18,360 simulations by systematically varying Manning’s roughness coefficients (0.02–0.045). Three calibration strategies were evaluated: (i) a simple Gradient Boosting Regression model based on a weighted composite roughness formula, (ii) conventional machine learning models (Random Forest, Gradient Boosting, and Multi-Layer Perceptron), and (iii) a deep learning framework combining a three-layer neural network (64 → 32 → 16 neurons), Differential Evolution optimisation, and cubic spline interpolation. Calibration accuracy increased with model complexity. The deep learning framework achieved the best performance, reducing the root mean square error by 96.6% (from 1.202 to 0.041 m), with R2 = 0.992 and negligible bias (−0.004 m). Conventional machine learning models produced spatially variable Manning’s roughness distributions, with the calibrated main-channel roughness (mean n = 0.0512) being 34.0–57.5% higher than the corresponding bank values. The proposed framework provides an effective approach for calibrating spatially distributed roughness coefficients in one-dimensional hydraulic models, with strong potential to improve river hydraulic simulations and support future applications to flood modelling.
Full article
(This article belongs to the Section Hydrological and Hydrodynamic Processes and Modelling)
►▼
Show Figures

Figure 1
Journal Menu
► ▼ Journal Menu-
- Hydrology Home
- Aims & Scope
- Editorial Board
- Topical Advisory Panel
- Early Career Editorial Board
- Instructions for Authors
- Special Issues
- Topics
- Sections & Collections
- Article Processing Charge
- Indexing & Archiving
- Editor’s Choice Articles
- Most Cited & Viewed
- Journal Statistics
- Journal History
- Journal Awards
- Society Collaborations
- Conferences
- Editorial Office
Journal Browser
► ▼ Journal BrowserHighly Accessed Articles
Latest Books
E-Mail Alert
News
Topics
Topic in
Energies, Environments, Hydrology, Sustainability
Green Technology, Environmental Management and Corporate Social Responsibility from a Global Perspective, 2nd Edition
Topic Editors: Pingping Luo, Guangwei Huang, Binaya Kumar Mishra, Mohd Remy Rozainy Bin Mohd Arif ZainolDeadline: 30 September 2026
Topic in
JoX, Sustainability, Water, Hydrology, Biology, Environments
Sustainable Water Resource Management: Controlling Nutrient and Contaminant Transport in Aquatic Systems
Topic Editors: Taotao Lu, Shuangcheng TangDeadline: 30 October 2026
Topic in
Applied Sciences, Hydrology, JMSE, Water, Eng
Hydraulic Engineering and Modelling
Topic Editors: Guohua Zhang, Feng Xiong, Xiaobo ZhangDeadline: 30 November 2026
Topic in
Environments, Hydrology, Sustainability, Water, Earth
Groundwater Sustainability: Innovations in Resource Management and Environmental Protection
Topic Editors: Jiannan Luo, Yu Wang, Yongkai AnDeadline: 31 December 2026
Conferences
Special Issues
Special Issue in
Hydrology
Integrated Approaches to Hydraulic and Sediment Transport Modeling for Flood Risk Management Using Advanced Models, Remote Sensing, GIS, and IoT
Guest Editors: Nikolaos P. Theodossiou, Evangelia D. Farsirotou, Yiannis KontosDeadline: 30 September 2026
Special Issue in
Hydrology
Mitigating Hydrologically Induced Slope Failures Through Nature-Based Solutions
Guest Editors: Qi Zhang, Haowen Guo, Chuanxiang QuDeadline: 30 September 2026
Special Issue in
Hydrology
Water Resources Management Under Uncertainty and Climate Change (Second Edition)
Guest Editors: Husam Musa Baalousha, Marwan FahsDeadline: 30 September 2026
Special Issue in
Hydrology
Advances in Urban Flood Modeling, Forecasting and Early Warning
Guest Editors: Omayma Amellah, Carmen Maftei, Romulus CostacheDeadline: 30 September 2026
Topical Collections
Topical Collection in
Hydrology
Feature Papers of Hydrology
Collection Editors: Ezio Todini, Tammo Steenhuis