Topic Editors

Dr. Taotao Lu
College of Hydraulic Science and Engineering, Yangzhou University, Yangzhou, China
Dr. Shuangcheng Tang
School of Water Conservancy Science and Engineering, Yangzhou University, Yangzhou 225009, China

Sustainable Water Resource Management: Controlling Nutrient and Contaminant Transport in Aquatic Systems
Abstract submission deadline
closed (30 August 2026)
Manuscript submission deadline
30 October 2026
Viewed by
6357

Topic Information

Dear Colleagues,

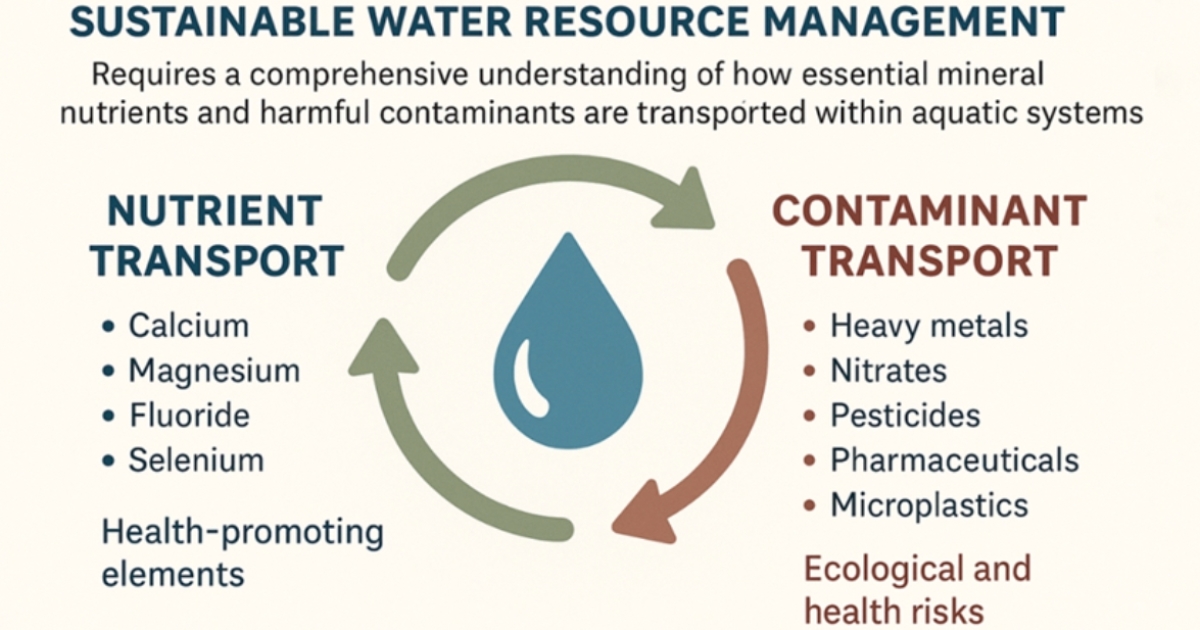
Sustainable water resource management requires a comprehensive understanding of how essential mineral nutrients and harmful contaminants are transported within aquatic systems. Water serves not only as a key carrier of health-promoting elements, such as calcium, magnesium, fluoride, and selenium, but also as a vector for pollutants that threaten environmental and public health. While mineral nutrients are critical for physiological functions including bone health, metabolism, and disease prevention, their spatial variability may lead to region-specific deficiencies or toxic accumulation. Simultaneously, the transport of contaminants, including inorganic compounds like heavy metals and nitrates, as well as organic pollutants such as pesticides, pharmaceuticals, and microplastics, poses serious ecological and health risks. These include carcinogenic, neurotoxic, and endocrine-disrupting effects, particularly under chronic low-level exposure scenarios. This Topic explores the mechanisms and drivers of nutrient and contaminant transport, aiming to inform sustainable strategies for water quality control. By integrating insights from hydrology, geochemistry, environmental engineering, and public health, it highlights the need for adaptive solutions that support both safe water access and long-term ecosystem resilience in the face of growing pollution pressures and water scarcity.

The list of specific topics covered in this Topic is as follows:

  1. Essential Mineral Nutrients in Water: Sources, Transport, and Health Implications.
  2. Aquatic Transport of Contaminants: From Heavy Metals to Microplastics.
  3. Geochemical and Hydrological Controls on Nutrient and Pollutant Mobility.
  4. Spatial Variability and Regional Risk of Nutrient Deficiency and Toxic Accumulation.
  5. Sustainable Water Resource Management under Pollution and Scarcity Stress.

Dr. Taotao Lu
Dr. Shuangcheng Tang
Topic Editors

Keywords

  • water resource management
  • nutrient transport
  • contaminant migration
  • aquatic systems
  • water quality
  • environmental health risks
  • sustainable pollution control

Participating Journals

Journal Name Impact Factor CiteScore Launched Year First Decision (median) APC
Biology
biology
4.3 7.3 2012 14.2 Days CHF 2700 Submit
Environments
environments
4.3 5.7 2014 18.6 Days CHF 1800 Submit
Hydrology
hydrology
3.1 6.0 2014 16.5 Days CHF 1800 Submit
Journal of Xenobiotics
jox
4.6 5.1 2011 14.9 Days CHF 1600 Submit
Sustainability
sustainability
4.1 8.9 2009 16.9 Days CHF 2400 Submit
Water
water
3.5 6.7 2009 17.7 Days CHF 2600 Submit

Preprints.org is a multidisciplinary platform offering a preprint service designed to facilitate the early sharing of your research. It supports and empowers your research journey from the very beginning.

MDPI Topics is collaborating with Preprints.org and has established a direct connection between MDPI journals and the platform. Authors are encouraged to take advantage of this opportunity by posting their preprints at Preprints.org prior to publication:

  1. Share your research immediately: disseminate your ideas prior to publication and establish priority for your work.
  2. Safeguard your intellectual contribution: Protect your ideas with a time-stamped preprint that serves as proof of your research timeline.
  3. Boost visibility and impact: Increase the reach and influence of your research by making it accessible to a global audience.
  4. Gain early feedback: Receive valuable input and insights from peers before submitting to a journal.
  5. Ensure broad indexing: Web of Science (Preprint Citation Index), Google Scholar, Crossref, SHARE, PrePubMed, Scilit and Europe PMC.

Published Papers (5 papers)

Order results
Result details
Journals
Select all
Export citation of selected articles as:
23 pages, 14577 KB  
Article
Evaluating Water and Soil Resource Carrying Capacity from the Production–Living–Ecological Space Perspective: A Case Study of Hunan Province, China
by Yu Tang, Yingran Li, Ting Li, Yuqi Fang, Borui Wang, Anze Dong, Dianqing Lv and Wei Wang
Sustainability 2026, 18(15), 7813; https://doi.org/10.3390/su18157813 - 2 Aug 2026
Viewed by 327
Abstract
Quantifying water and soil resource (WSR) carrying capacity is crucial for sustainable regional development. However, humid hilly regions like Hunan Province remain understudied, facing ecological vulnerability despite abundant water resources. This study constructs a comprehensive evaluation index system based on the Production–Living–Ecological Space [...] Read more.
Quantifying water and soil resource (WSR) carrying capacity is crucial for sustainable regional development. However, humid hilly regions like Hunan Province remain understudied, facing ecological vulnerability despite abundant water resources. This study constructs a comprehensive evaluation index system based on the Production–Living–Ecological Space (PLES) framework and applies an improved entropy weight technique for order preference by similarity to ideal solution (TOPSIS) method; a coupling coordination model among production, living, and ecological space subsystems; and an obstacle degree model to annual-scale data from 2011 to 2022 for Hunan’s 14 prefecture-level cities. The results show the following: (1) The overall WSR carrying capacity index increased from 0.28 in 2011 to 0.52 in 2022, indicating a continuous improvement in carrying capacity during the study period. Spatially, the carrying capacity is higher in central and eastern regions and lower in western and southern areas, with most cities falling into low, relatively low, or medium categories. (2) The coupling coordination degree among the three PLES subsystems improved but remained in a transitional stage (0.30–0.45), indicating unbalanced development. (3) The top five obstacle factors are water yield modulus, length of water supply pipelines, ecological water use rate, gross domestic product (GDP) per capita, and per capita water resources—with the ecological water use rate exceeding 19% in every year of the study period. These findings highlight the need to coordinate production, living, and ecological subsystems to improve WSR carrying capacity. Targeted strategies, including efficient water use, optimized resource allocation, and ecological protection, are recommended for sustainable water–soil resource management in Hunan Province. Full article
Show Figures

Figure 1

22 pages, 5638 KB  
Article
Water Footprint-Based Optimization of Crop Planting Structure for Sustainable Agricultural Water Management in Hunan Province, China
by Yu Tang, Yingran Li, Rong Chen, Rui Sun, Borui Wang, Anze Dong, Yuqi Fang and Wei Wang
Sustainability 2026, 18(12), 6034; https://doi.org/10.3390/su18126034 - 12 Jun 2026
Cited by 1 | Viewed by 453
Abstract
Given the mounting pressure on agricultural water resources in China, which poses a threat to agricultural production safety, this study focuses on Hunan Province and analyzes five major crops over the period 2012–2022. Using a water footprint (WF) accounting method, it quantifies grey [...] Read more.
Given the mounting pressure on agricultural water resources in China, which poses a threat to agricultural production safety, this study focuses on Hunan Province and analyzes five major crops over the period 2012–2022. Using a water footprint (WF) accounting method, it quantifies grey water from non-point source pollution and optimizes planting structures under 5%, 10%, and 15% water-saving scenarios. The results indicate that crop water footprints per unit mass follow the descending order: oilseeds, leaf tobacco, rice, fruits, and vegetables. Regarding water footprint components, green water footprint accounts for the largest proportion, playing a dominant role in crop water use, followed by grey water footprint. Blue water footprint and irrigation losses contribute the least. After optimization, under the 5% and 10% water-saving scenarios, the cultivated areas for rice, oilseeds, and leaf tobacco decreased compared to 2021, while those for vegetables and fruits increased. Under the 15% water-saving scenario, all crop planting areas were reduced relative to 2021. The optimized crop planting structure enhanced water use efficiency by 0.35%, 0.58% and 0.77%, respectively, under water-saving scenarios of 5%, 10% and 15%. These results provide a scientific basis for sustainable agricultural water management in Hunan Province. Full article
Show Figures

Figure 1

18 pages, 3510 KB  
Article
Impact of Continuous Rainfall on the Performance of LID Facilities in Different Climate Regions
by Shuangcheng Tang, Zhenghan Yu, Zhetao Lou, Yani Wang, Zhonghua Jia, Xing Gao and Taotao Lu
Sustainability 2026, 18(12), 5925; https://doi.org/10.3390/su18125925 - 10 Jun 2026
Viewed by 318
Abstract
Low-impact development (LID) facilities can significantly mitigate runoff and purify pollutants. However, their operational efficiency is highly influenced by regional rainfall characteristics, posing challenges to sustainable development in urban water management. This study investigates the degradation of runoff control efficacy in two LID [...] Read more.
Low-impact development (LID) facilities can significantly mitigate runoff and purify pollutants. However, their operational efficiency is highly influenced by regional rainfall characteristics, posing challenges to sustainable development in urban water management. This study investigates the degradation of runoff control efficacy in two LID installations located in Xi’an (semi-humid region) and Yangzhou (humid region) and examines the impact of continuous rainfall across different climatic zones. The results reveal that in both study areas, over 75% of annual rainy days experienced continuous rainfall, accounting for more than 80% of total rainfall volume. During continuous rainfall, the declining infiltration capacity of LID facilities reduces their performance, and the operational effectiveness of the LID facilities may deviate to some extent from the design goals. The lower attenuation coefficients observed in Yangzhou indicate that its LID facilities were more strongly affected by continuous rainfall than those in Xi’an. Regarding the designed annual runoff control targets, Xi’an achieved an average effectiveness of 83.7% at 60–85% design levels, outperforming Yangzhou by 12.09%. When increasing design rainfall, Xi’an exhibited increments of 41.0–200.7% for targets ranging from 60% to 80%, whereas Yangzhou required substantially larger increases for targets of 60–70%. Notably, achieving control targets above 85% in Xi’an and 75% in Yangzhou solely through increased design rainfall proved unfeasible. The study highlights that continuous rainfall affects LID performance in both humid and semi-humid regions, with facilities in more humid climates being particularly susceptible. These findings underscore the need for climate-adaptive LID design strategies to support long-term sustainable urban development goals. Full article
Show Figures

Figure 1

26 pages, 13484 KB  
Article
Application of Different Indices to Assess the Trophic Status of a Warm Monomictic Reservoir in the Lesotho Highlands, Southern Africa
by Motlalepula M. Moahloli, Paul J. Oberholster and Johannes N. Rossouw
Water 2026, 18(11), 1327; https://doi.org/10.3390/w18111327 - 30 May 2026
Viewed by 952
Abstract
The sustainable management of water supply reservoirs requires analysis of spatiotemporal variations in nutrient levels, phytoplankton composition, and trophic status. The Katse Dam (KD) is a strategic raw water supply source that generates hydropower and sustains aquaculture. However, it is exposed to nutrient [...] Read more.
The sustainable management of water supply reservoirs requires analysis of spatiotemporal variations in nutrient levels, phytoplankton composition, and trophic status. The Katse Dam (KD) is a strategic raw water supply source that generates hydropower and sustains aquaculture. However, it is exposed to nutrient enrichment from mining and aquaculture, whose impact on its trophic status necessitates monitoring. This study applies the organic pollution index (OPI), the modified pollution index (MPI), and Carlson’s trophic state index (CTSI) to assess the trophic status of KD. The results from the first decade (FD) (2003–2013), when the intensity of mining and aquaculture activities was minimal, were compared with the results from the second decade (SD) (2014–2024) when there was higher activity. The MPI revealed that KD transitioned from a contaminated status during the FD to a greatly contaminated status during the SD. KD shifted from mesotrophic to eutrophic in the transitional zone and from eutrophic to hypereutrophic in the lacustrine zone. The cyanobacteria Radiocystis sp. replaced Asterionella sp. and became the most abundant algae in the SD, followed by the diatom Flagilaria sp. Principal component analysis (PCA) indicated stronger correlations between NH4, PO4, NO3, and NO2, while canonical correspondence analysis (CCA) indicated a strong correlation between PO4 and Fragilaria sp. in the SD. The OPI classified KD water quality as excellent, with the exception of the lacustrine zone, where the water quality was polluted in 2016 and 2021. The data analysis revealed how long-term variations in KD water chemistry and phytoplankton influenced trophic status. This study thus provides water managers with a template for assessing water quality to secure the strategic value of the KD. Full article
Show Figures

Figure 1

15 pages, 3237 KB  
Article
Integrating Satellite Remote Sensing and Field Measurements for Assessing Nitrogen and Phosphorus Dynamics in Tropical Freshwater Ecosystems of Thailand
by Chuti Rakasachat, Ratcha Chaichana, Peangtawan Phonmat, Pawee Klongvessa, Sitthisak Moukomla and Wirong Chanthorn
Environments 2026, 13(1), 57; https://doi.org/10.3390/environments13010057 - 21 Jan 2026
Viewed by 2044
Abstract
Eutrophication increasingly threatens tropical freshwater systems, where nutrient enrichment drives harmful algal blooms and rapid water-quality decline. This study presents a validated satellite-based approach for retrieving total nitrogen (TN) and total phosphorus (TP) in Thai inland waters using Sentinel-2 imagery. A stratified sampling [...] Read more.
Eutrophication increasingly threatens tropical freshwater systems, where nutrient enrichment drives harmful algal blooms and rapid water-quality decline. This study presents a validated satellite-based approach for retrieving total nitrogen (TN) and total phosphorus (TP) in Thai inland waters using Sentinel-2 imagery. A stratified sampling campaign collected 264 water samples from 50 lentic water bodies during April–May 2024. Results showed that key environmental predictors were identified through correlation analysis and integrated into multiple linear regression (MLR) and polynomial regression (PO) algorithms, with performance evaluated using 10-fold cross-validation. PO consistently outperformed MLR for both nutrients. For TN, PO achieved higher calibration accuracy (R2 = 0.63; RMSE = 4.74 mg/L) than MLR (R2 = 0.47; RMSE = 5.73 mg/L) and maintained strong validation performance (R2 = 0.76). For TP, PO likewise yielded superior cross-validation accuracy (R2 = 0.69; RMSE = 0.07 mg/L; IoA = 0.89) compared with MLR (R2 = 0.38; RMSE = 0.10 mg/L; IoA = 0.70). Spatial distributions of TN and TP derived from the imagery reinforced these findings. The PO-derived TN maps effectively captured nutrient hotspots associated with agricultural runoff, whereas the PO-based TP maps produced more stable and consistent spatial patterns. The findings demonstrate that Sentinel-2 can reliably retrieve TN and TP in tropical waters and offer a scalable pathway for improving nutrient surveillance and supporting science-based freshwater management in regions experiencing accelerating eutrophication. Full article
Show Figures

Figure 1

Back to TopTop