Next Issue
Volume 8, July
Previous Issue
Volume 8, May
 
 
remotesensing-logo

Journal Browser

Journal Browser

Remote Sens., Volume 8, Issue 6 (June 2016) – 90 articles

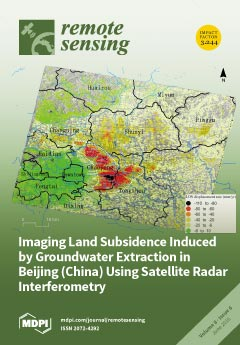
Cover Story (view full-size image): As one of the most water-stressed cities in the world, Beijing has been suffering from land subsidence since 1935 due to over-exploitation of groundwater. Based on detailed analyses of Envisat ASAR images acquired between 2003 and 2010 and TerraSAR-X images from 2010 to 2011, this paper provides new insights into the spatio-temporal distribution characteristics and the key triggering and conditioning factors of land subsidence in Beijing. The maximum subsidence is observed in the eastern part of Beijing with a rate greater than 100 mm/year. The good agreement between InSAR and GPS results suggests that InSAR is a powerful tool for monitoring land subsidence. Interesting relationships in terms of land subsidence were found with groundwater level, active faults, accumulated soft soil thickness, aquifer types and the distances to pumping wells. View this paper
  • Issues are regarded as officially published after their release is announced to the table of contents alert mailing list.
  • You may sign up for e-mail alerts to receive table of contents of newly released issues.
  • PDF is the official format for papers published in both, html and pdf forms. To view the papers in pdf format, click on the "PDF Full-text" link, and use the free Adobe Reader to open them.
Order results
Result details
Section
Select all
Export citation of selected articles as:

Editorial

Jump to: Research, Review, Other

4 pages, 158 KiB  
Editorial
Preface: Remote Sensing of Biodiversity
by Susan L. Ustin
Department of Land, Air and Water Resources, University of California-Davis, Davis, CA 95616, USA
Remote Sens. 2016, 8(6), 508; https://doi.org/10.3390/rs8060508 - 16 Jun 2016
Cited by 2 | Viewed by 4872
Abstract
Since the 1992 Earth Summit in Rio de Janeiro, the importance of biological diversity insupporting and maintaining ecosystem functions and processes has become increasingly understood [1]. Full article
(This article belongs to the Special Issue Remote Sensing of Biodiversity)

Research

Jump to: Editorial, Review, Other

18 pages, 9162 KiB  
Article
Quantifying Freshwater Mass Balance in the Central Tibetan Plateau by Integrating Satellite Remote Sensing, Altimetry, and Gravimetry
by Kuo-Hsin Tseng 1,2,3,*, Chung-Pai Chang 2, C. K. Shum 4,5, Chung-Yen Kuo 6, Kuan-Ting Liu 1, Kun Shang 4, Yuanyuan Jia 4 and Jian Sun 4
1 Department of Civil Engineering, National Central University, 32001 Taoyuan, Taiwan
2 Center for Space and Remote Sensing Research, National Central University, 32001 Taoyuan, Taiwan
3 Institute of Hydrological and Oceanic Sciences, National Central University, 32001 Taoyuan, Taiwan
4 Division of Geodetic Science, School of Earth Sciences, Ohio State University, Columbus, OH 43210, USA
5 State Key Laboratory of Geodesy and Earth’s Dynamics, Institute of Geodesy and Geophysics, Chinese Academy of Sciences, Wuhan 43077, China
6 Department of Geomatics, National Cheng-Kung University, 70101 Tainan, Taiwan
Remote Sens. 2016, 8(6), 441; https://doi.org/10.3390/rs8060441 - 24 May 2016
Cited by 15 | Viewed by 6350
Abstract
The Tibetan Plateau (TP) has been observed by satellite optical remote sensing, altimetry, and gravimetry for a variety of geophysical parameters, including water storage change. However, each of these sensors has its respective limitation in the parameters observed, accuracy and spatial-temporal resolution. Here, [...] Read more.
The Tibetan Plateau (TP) has been observed by satellite optical remote sensing, altimetry, and gravimetry for a variety of geophysical parameters, including water storage change. However, each of these sensors has its respective limitation in the parameters observed, accuracy and spatial-temporal resolution. Here, we utilized an integrated approach to combine remote sensing imagery, digital elevation model, and satellite radar and laser altimetry data, to quantify freshwater storage change in a twin lake system named Chibuzhang Co and Dorsoidong Co in the central TP, and compared that with independent observations including mass changes from the Gravity Recovery and Climate Experiment (GRACE) data. Our results show that this twin lake, located within the Tanggula glacier system, remained almost steady during 1973–2000. However, Dorsoidong Co has experienced a significant lake level rise since 2000, especially during 2000–2005, that resulted in the plausible connection between the two lakes. The contemporary increasing lake level signal at a rate of 0.89 ± 0.05 cm·yr−1, in a 2° by 2° grid equivalent water height since 2002, is higher than the GRACE observed trend at 0.41 ± 0.17 cm·yr−1 during the same time span. Finally, a down-turning trend or inter-annual variability shown in the GRACE signal is observed after 2012, while the lake level is still rising at a consistent rate. Full article
(This article belongs to the Special Issue Remote Sensing in Tibet and Siberia)
Show Figures

Graphical abstract

10 pages, 2346 KiB  
Article
Filling the Polar Data Gap in Sea Ice Concentration Fields Using Partial Differential Equations
by Courtenay Strong 1,* and Kenneth M. Golden 2
1 Department of Atmospheric Sciences, University of Utah, 135 S 1460 E, Rm 819, Salt Lake City, UT 84112-0102, USA
2 Department of Mathematics, University of Utah, 155 S 1400 E, RM 233, Salt Lake City, UT 84112-0090, USA
Remote Sens. 2016, 8(6), 442; https://doi.org/10.3390/rs8060442 - 24 May 2016
Cited by 14 | Viewed by 6600
Abstract
The “polar data gap” is a region around the North Pole where satellite orbit inclination and instrument swath for SMMR and SSM/I-SSMIS satellites preclude retrieval of sea ice concentrations. Data providers make the irregularly shaped data gap round by centering a circular “pole [...] Read more.
The “polar data gap” is a region around the North Pole where satellite orbit inclination and instrument swath for SMMR and SSM/I-SSMIS satellites preclude retrieval of sea ice concentrations. Data providers make the irregularly shaped data gap round by centering a circular “pole hole mask” over the North Pole. The area within the pole hole mask has conventionally been assumed to be ice-covered for the purpose of sea ice extent calculations, but recent conditions around the perimeter of the mask indicate that this assumption may already be invalid. Here we propose an objective, partial differential equation based model for estimating sea ice concentrations within the area of the pole hole mask. In particular, the sea ice concentration field is assumed to satisfy Laplace’s equation with boundary conditions determined by observed sea ice concentrations on the perimeter of the gap region. This type of idealization in the concentration field has already proved to be quite useful in establishing an objective method for measuring the “width” of the marginal ice zone—a highly irregular, annular-shaped region of the ice pack that interacts with the ocean, and typically surrounds the inner core of most densely packed sea ice. Realistic spatial heterogeneity in the idealized concentration field is achieved by adding a spatially autocorrelated stochastic field with temporally varying standard deviation derived from the variability of observations around the mask. To test the model, we examined composite annual cycles of observation-model agreement for three circular regions adjacent to the pole hole mask. The composite annual cycle of observation-model correlation ranged from approximately 0.6 to 0.7, and sea ice concentration mean absolute deviations were of order 10 2 or smaller. The model thus provides a computationally simple approach to solving the increasingly important problem of how to fill the polar data gap. Moreover, this approach based on solving an elliptic partial differential equation with given boundary conditions has sufficient generality to also provide more sophisticated models which could potentially be more accurate than the Laplace equation version. Such generalizations and potential validation opportunities are discussed. Full article
(This article belongs to the Special Issue Sea Ice Remote Sensing and Analysis)
Show Figures

Graphical abstract

18 pages, 21799 KiB  
Article
Advanced SAR Interferometric Analysis to Support Geomorphological Interpretation of Slow-Moving Coastal Landslides (Malta, Mediterranean Sea)
by Matteo Mantovani 1, Stefano Devoto 2, Daniela Piacentini 3, Mariacristina Prampolini 4,*, Mauro Soldati 4 and Alessandro Pasuto 1
1 National Research Council of Italy, Research Institute for Geo-Hydrological Protection (CNR-IRPI), Corso Stati Uniti 4, Padova 35127, Italy
2 Department of Mathematics and Geosciences, University of Trieste, Via Weiss 2, Trieste 34128, Italy
3 Department of Pure and Applied Sciences, University of Urbino, Campus Scientifico “E. Mattei”, Via Cà le Suore 2/4, Urbino 61029, Italy
4 Department of Chemical and Geological Sciences, University of Modena and Reggio Emilia, Via Campi 103, Modena 41125, Italy
Remote Sens. 2016, 8(6), 443; https://doi.org/10.3390/rs8060443 - 25 May 2016
Cited by 47 | Viewed by 6096
Abstract
An advanced SAR interferometric analysis has been combined with a methodology for the automatic classification of radar reflectors phase histories to interpret slope-failure kinematics and trend of displacements of slow-moving landslides. To accomplish this goal, the large dataset of radar images, acquired in [...] Read more.
An advanced SAR interferometric analysis has been combined with a methodology for the automatic classification of radar reflectors phase histories to interpret slope-failure kinematics and trend of displacements of slow-moving landslides. To accomplish this goal, the large dataset of radar images, acquired in more than 20 years by the two European Space Agency (ESA) missions ERS-1/2 and ENVISAT, was exploited. The analysis was performed over the northern sector of Island of Malta (central Mediterranean Sea), where extensive landslides occur. The study was assisted by field surveys and with the analysis of existing thematic maps and landslide inventories. The outcomes allowed definition of a model capable of describing the geomorphological evolution of slow-moving landslides, providing a key for interpreting such phenomena that, due to their slowness, are usually scarcely investigated. Full article
Show Figures

Graphical abstract

14 pages, 14575 KiB  
Article
GRACE-Derived Terrestrial Water Storage Changes in the Inter-Basin Region and Its Possible Influencing Factors: A Case Study of the Sichuan Basin, China
by Chaolong Yao 1,2, Zhicai Luo 1,3,4,5, Haihong Wang 1,*, Qiong Li 6 and Hao Zhou 6
1 School of Geodesy and Geomatics, Wuhan University, Wuhan 430079, Hubei, China
2 Guangxi Key Laboratory of Spatial Information and Geomatics, Guilin University of Technology, Guilin 541004, Guangxi, China
3 Key Laboratory of Geospace Environment and Geodesy, Ministry of Education, Wuhan University, Wuhan 430079, Hubei, China
4 State Key Laboratory of Information Engineering in Surveying, Mapping and Remote Sensing, Wuhan University, Wuhan 430079, Hubei, China
5 Collaborative Innovation Center for Geospatial Technology, Wuhan University, Wuhan 430079, Hubei, China
6 MOE Key Laboratory of Fundamental Physical Quantities Measurement, School of Physics, Huazhong University of Science and Technology, Wuhan 430074, Hubei, China
Remote Sens. 2016, 8(6), 444; https://doi.org/10.3390/rs8060444 - 26 May 2016
Cited by 34 | Viewed by 7912
Abstract
We investigate terrestrial water storage (TWS) changes over the Sichuan Basin and the related impacts of water variations in the adjacent basins from GRACE (Gravity Recovery and Climate Experiment), in situ river level, and precipitation data. Although GRACE shows water increased over the [...] Read more.
We investigate terrestrial water storage (TWS) changes over the Sichuan Basin and the related impacts of water variations in the adjacent basins from GRACE (Gravity Recovery and Climate Experiment), in situ river level, and precipitation data. Although GRACE shows water increased over the Sichuan Basin from January 2003 to February 2015, two heavy droughts in 2006 and 2011 have resulted in significant water deficits. Correlations of 0.74 and 0.56 were found between TWS and mean river level/precipitation within the Sichuan Basin, respectively, indicating that the Sichuan Basin TWS is influenced by both of the local rainfall and water recharge from the adjacent rivers. Moreover, water sources from the neighboring basins showed different impacts on water deficits observed by GRACE during the two severe droughts in the region. This provides valuable information for regional water management in response to serious dry conditions. Additionally, the Sichuan Basin TWS is shown to be influenced more by the Indian Ocean Dipole (IOD) than the El Niño-Southern Oscillation (ENSO), especially for the January 2003–July 2012 period with a correlation of −0.66. However, a strong positive correlation of 0.84 was found between TWS and ENSO after August 2012, which is a puzzle that needs further investigation. This study shows that the combination of other hydrological variables can provide beneficial applications of GRACE in inter-basin areas. Full article
(This article belongs to the Special Issue Remote Sensing in Tibet and Siberia)
Show Figures

Graphical abstract

18 pages, 14395 KiB  
Article
Tree Species Classification Using Hyperspectral Imagery: A Comparison of Two Classifiers
by Laurel Ballanti 1,2,*, Leonhard Blesius 2, Ellen Hines 1,2 and Bill Kruse 3
1 Romberg Tiburon Center for Environment Studies, San Francisco State University, 3150 Paradise Dr., Tiburon, CA 94920, USA
2 Geography and Environment, San Francisco State University, 1600 Holloway Avenue, San Francisco, CA 94132, USA
3 Kruse Imaging, 3230 Ross Road, Palo Alto, CA 94303, USA
Remote Sens. 2016, 8(6), 445; https://doi.org/10.3390/rs8060445 - 24 May 2016
Cited by 176 | Viewed by 15152
Abstract
The identification of tree species can provide a useful and efficient tool for forest managers for planning and monitoring purposes. Hyperspectral data provide sufficient spectral information to classify individual tree species. Two non-parametric classifiers, support vector machines (SVM) and random forest (RF), have [...] Read more.
The identification of tree species can provide a useful and efficient tool for forest managers for planning and monitoring purposes. Hyperspectral data provide sufficient spectral information to classify individual tree species. Two non-parametric classifiers, support vector machines (SVM) and random forest (RF), have resulted in high accuracies in previous classification studies. This research takes a comparative classification approach to examine the SVM and RF classifiers in the complex and heterogeneous forests of Muir Woods National Monument and Kent Creek Canyon in Marin County, California. The influence of object- or pixel-based training samples and segmentation size on the object-oriented classification is also explored. To reduce the data dimensionality, a minimum noise fraction transform was applied to the mosaicked hyperspectral image, resulting in the selection of 27 bands for the final classification. Each classifier was also assessed individually to identify any advantage related to an increase in training sample size or an increase in object segmentation size. All classifications resulted in overall accuracies above 90%. No difference was found between classifiers when using object-based training samples. SVM outperformed RF when additional training samples were used. An increase in training samples was also found to improve the individual performance of the SVM classifier. Full article
Show Figures

Graphical abstract

21 pages, 6889 KiB  
Article
Multi-Decadal Monitoring of Lake Level Changes in the Qinghai-Tibet Plateau by the TOPEX/Poseidon-Family Altimeters: Climate Implication
by Cheinway Hwang 1,*, Yung-Sheng Cheng 1, Jiancheng Han 1, Ricky Kao 1, Chi-Yun Huang 1, Shiang-Hung Wei 1 and Haihong Wang 2
1 Department of Civil Engineering, National Chiao Tung University, 1001 Ta Hsueh Rd., Hsinchu 300, Taiwan
2 School of Geodesy and Geomatics, Wuhan University, Wuhan 430079, China
Remote Sens. 2016, 8(6), 446; https://doi.org/10.3390/rs8060446 - 25 May 2016
Cited by 37 | Viewed by 6543
Abstract
Lake levels in the Qinghai-Tibet Plateau (QTP) provide valuable records for climate change studies. We use two decades of measurements (January 1993–December 2014) from the TOPEX/Poseidon (T/P)-family satellite altimeters (T/P, Jason-1 and -2) to detect lake level variations at 23 lakes along their [...] Read more.
Lake levels in the Qinghai-Tibet Plateau (QTP) provide valuable records for climate change studies. We use two decades of measurements (January 1993–December 2014) from the TOPEX/Poseidon (T/P)-family satellite altimeters (T/P, Jason-1 and -2) to detect lake level variations at 23 lakes along their repeat ground tracks every 10 days. We employ an optimal processing technique to obtain quality measurements, including outlier detection, averaging and filtering. The lake level accuracies are improved by subwaveform retracking. Jason-1 delivers few measurements after waveform retracking and a cluster classification at most lakes. From January 1993 to December 2014, most lake levels in eastern Tibet rose, while those in western Tibet declined. In Qinghai, lake levels dropped before 2005 and then rose afterwards, coinciding with the measure in 2005 that protects the Qinghai ecosystem (e.g., grassland conservation). The overall pattern of lake level change in the QTP is largely affected by monsoons and lake locations. Most lake levels show clear annual and inter-annual oscillations. Certain lakes show alternating level highs and lows in the same seasons and varying amplitudes of annual oscillations due to lake level changes. We detect a sudden rise of lake level by 7 m caused by floods, varying lake level trends associated with the 1997‒98 El Niño and other factors, and persistently rising and declining lake levels associated with the long-term precipitation trends in the QTP. The T/P-family satellites will continue to monitor lake levels here as long as the sea level monitoring program lasts, collecting a long-term climate record at highlands echoing sea level change. Full article
(This article belongs to the Special Issue Remote Sensing in Tibet and Siberia)
Show Figures

Graphical abstract

17 pages, 3689 KiB  
Article
Registration of Airborne LiDAR Point Clouds by Matching the Linear Plane Features of Building Roof Facets
by Hangbin Wu 1 and Hongchao Fan 2,*
1 College of Surveying and Geoinfomatics, Tongji University, Shanghai 200092, China
2 GIScience Research Group, Institute of Geography, Heidelberg University, Berliner Street 48, Heidelberg D-69120, Germany
Remote Sens. 2016, 8(6), 447; https://doi.org/10.3390/rs8060447 - 25 May 2016
Cited by 11 | Viewed by 8166
Abstract
This paper presents a new approach for the registration of airborne LiDAR point clouds by finding and matching corresponding linear plane features. Linear plane features are a type of common feature in an urban area and are convenient for obtaining feature parameters from [...] Read more.
This paper presents a new approach for the registration of airborne LiDAR point clouds by finding and matching corresponding linear plane features. Linear plane features are a type of common feature in an urban area and are convenient for obtaining feature parameters from point clouds. Using such linear feature parameters, the 3D rigid body coordination transformation model is adopted to register the point clouds from different trajectories. The approach is composed of three steps. In the first step, an OpenStreetMap-aided method is applied to select simply-structured roof pairs as the corresponding roof facets for the registration. In the second step, the normal vectors of the selected roof facets are calculated and input into an over-determined observation system to estimate the registration parameters. In the third step, the registration is be carried out by using these parameters. A case dataset with a two trajectory point cloud was selected to verify the proposed method. To evaluate the accuracy of the point cloud after registration, 40 checkpoints were manually selected; the results of the evaluation show that the general accuracy is 0.96 m, which is approximately 1.6 times the point cloud resolution. Furthermore, two overlap zones were selected to measure the surface-difference between the two trajectories. According to the analysis results, the average surface-distance is approximately 0.045–0.129 m. Full article
Show Figures

Graphical abstract

22 pages, 12596 KiB  
Article
Snow Extent Variability in Lesotho Derived from MODIS Data (2000–2014)
by Stefan Wunderle 1,*, Timm Gross 2 and Fabia Hüsler 1
1 Institute of Geography and Oeschger Center for Climate Change Research, University of Bern, Hallerstrasse 12, CH-3012 Bern, Switzerland
2 Institute of Geography, University of Bern, Hallerstrasse 12, CH-3012 Bern, Switzerland
Remote Sens. 2016, 8(6), 448; https://doi.org/10.3390/rs8060448 - 26 May 2016
Cited by 16 | Viewed by 6204
Abstract
In Lesotho, snow cover is not only highly relevant to the climate system, but also affects socio-economic factors such as water storage for irrigation or hydro-electricity. However, while sound knowledge of annual and inter-annual snow dynamics is strongly required by local stakeholders, in-situ [...] Read more.
In Lesotho, snow cover is not only highly relevant to the climate system, but also affects socio-economic factors such as water storage for irrigation or hydro-electricity. However, while sound knowledge of annual and inter-annual snow dynamics is strongly required by local stakeholders, in-situ snow information remains limited. In this study, satellite data are used to generate a time series of snow cover and to provide the missing information on a national scale. A snow retrieval method, which is based on MODIS data and considers the concept of a normalized difference snow index (NDSI), has been implemented. Monitoring gaps due to cloud cover are filled by temporal and spatial post-processing. The comparison is based on the use of clear sky reference images from Landsat-TM and ENVISAT-MERIS. While the snow product is considered to be of good quality (mean accuracy: 68%), a slight bias towards snow underestimation is observed. Based on the daily product, a consistent time series of snow cover for Lesotho from 2000–2014 was generated for the first time. Analysis of the time series showed that the high annual variability of snow coverage and the short duration of single snow events require daily monitoring with a gap-filling procedure. Full article
Show Figures

Graphical abstract

16 pages, 4321 KiB  
Article
MERIS Phytoplankton Time Series Products from the SW Iberian Peninsula (Sagres) Using Seasonal-Trend Decomposition Based on Loess
by Sónia Cristina 1,2,*, Clara Cordeiro 3,4, Samantha Lavender 5, Priscila Costa Goela 1,2, John Icely 1,6 and Alice Newton 1,7
1 Centre for Marine and Environmental Research (CIMA), FCT, University of Algarve, Campus de Gambelas, 8005-139 Faro, Portugal
2 Faculty of Marine and Environmental Sciences, University of Cadiz, Campus of Puerto Real, Polígono San Pedro s/n, Puerto Real, 11510 Cadiz, Spain
3 Faculty of Sciences and Technology (FCT), University of Algarve, Campus de Gambelas, 8005-139 Faro, Portugal
4 Center of Statistics and Applications (CEAUL), Faculty of Sciences of the University of Lisbon, Bloco C6—Piso 4, Campo Grande, 1749-016 Lisbon, Portugal
5 Pixalytics Ltd., 1 Davy Road, Plymouth Science Park, Plymouth, Devon PL6 8BX, UK
6 Sagremarisco Lda., Apartado 21, 8650-999 Vila do Bispo, Portugal
7 Norwegian Institute for Air Research (NILU)-IMPEC, Box 100, 2027 Kjeller, Norway
Remote Sens. 2016, 8(6), 449; https://doi.org/10.3390/rs8060449 - 26 May 2016
Cited by 35 | Viewed by 10192
Abstract
The European Space Agency has acquired 10 years of data on the temporal and spatial distribution of phytoplankton biomass from the MEdium Resolution Imaging Spectrometer (MERIS) sensor for ocean color. The phytoplankton biomass was estimated with the MERIS product Algal Pigment Index 1 [...] Read more.
The European Space Agency has acquired 10 years of data on the temporal and spatial distribution of phytoplankton biomass from the MEdium Resolution Imaging Spectrometer (MERIS) sensor for ocean color. The phytoplankton biomass was estimated with the MERIS product Algal Pigment Index 1 (API 1). Seasonal-Trend decomposition of time series based on Loess (STL) identified the temporal variability of the dynamical features in the MERIS products for water leaving reflectance (ρw(λ)) and API 1. The advantages of STL is that it can identify seasonal components changing over time, it is responsive to nonlinear trends, and it is robust in the presence of outliers. One of the novelties in this study is the development and the implementation of an automatic procedure, stl.fit(), that searches the best data modeling by varying the values of the smoothing parameters, and by selecting the model with the lowest error measure. This procedure was applied to 10 years of monthly time series from Sagres in the Southwestern Iberian Peninsula at three Stations, 2, 10 and 18 km from the shore. Decomposing the MERIS products into seasonal, trend and irregular components with stl.fit(), the ρw(λ) indicated dominance of the seasonal and irregular components while API 1 was mainly dominated by the seasonal component, with an increasing effect from inshore to offshore. A comparison of the seasonal components between the ρw(λ) and the API 1 product, showed that the variations decrease along this time period due to the changes in phytoplankton functional types. Furthermore, inter-annual seasonal variation for API 1 showed the influence of upwelling events and in which month of the year these occur at each of the three Sagres stations. The stl.fit() is a good tool for any remote sensing study of time series, particularly those addressing inter-annual variations. This procedure will be made available in R software. Full article
Show Figures

Graphical abstract

20 pages, 22032 KiB  
Article
Satellite Remote Sensing of Snow Depth on Antarctic Sea Ice: An Inter-Comparison of Two Empirical Approaches
by Stefan Kern 1,* and Burcu Ozsoy-Çiçek 2
1 Integrated Climate Data Center (ICDC), Center for Earth System Research and Sustainability (CEN), University of Hamburg, Hamburg 20144, Germany
2 Polar Research Center (PolReC), Maritime Faculty, Istanbul Technical University (ITU), Istanbul 34940, Turkey
Remote Sens. 2016, 8(6), 450; https://doi.org/10.3390/rs8060450 - 26 May 2016
Cited by 28 | Viewed by 8350
Abstract
Snow on Antarctic sea ice plays a key role for sea ice physical processes and complicates retrieval of sea ice thickness using altimetry. Current methods of snow depth retrieval are based on satellite microwave radiometry, which perform best for dry, homogeneous snow packs [...] Read more.
Snow on Antarctic sea ice plays a key role for sea ice physical processes and complicates retrieval of sea ice thickness using altimetry. Current methods of snow depth retrieval are based on satellite microwave radiometry, which perform best for dry, homogeneous snow packs on level sea ice. We introduce an alternative approach based on in-situ measurements of total (sea ice plus snow) freeboard and snow depth, which we use to compute snow depth on sea ice from Ice, Cloud, and land Elevation Satellite (ICESat) total freeboard observations. We compare ICESat snow depth for early winter and spring of the years 2004 through 2006 with the Advanced Scanning Microwave Radiometer aboard EOS (AMSR-E) snow depth product. We find ICESat snow depths agree more closely with ship-based visual and air-borne snow radar observations than AMSR-E snow depths. We obtain average modal and mean ICESat snow depths, which exceed AMSR-E snow depths by 5–10 cm in winter and 10–15 cm in spring. We observe an increase in ICESat snow depth from winter to spring for most Antarctic regions in accordance with ground-based observations, in contrast to AMSR-E snow depths, which we find to stay constant or to decrease. We suggest satellite laser altimetry as an alternative method to derive snow depth on Antarctic sea ice, which is independent of snow physical properties. Full article
(This article belongs to the Special Issue Sea Ice Remote Sensing and Analysis)
Show Figures

Graphical abstract

27 pages, 5251 KiB  
Article
Spatial Assessment of the Bioclimatic and Environmental Factors Driving Mangrove Tree Species’ Distribution along the Brazilian Coastline
by Arimatéa C. Ximenes 1,2,*, Eduardo Eiji Maeda 3, Gustavo Felipe Balué Arcoverde 4 and Farid Dahdouh-Guebas 1,2
1 Laboratory of Systems Ecology and Resource Management, Université Libre de Bruxelles—ULB, Brussels 1050, Belgium
2 Laboratory of Plant Biology and Nature Management, Vrije Universiteit Brussel—VUB, Brussels 1050, Belgium
3 Department of Geosciences and Geography, University of Helsinki, P.O. Box 68, Helsinki FI-00014, Finland
4 Science Center of Earth System, National Institute for Space Research—INPE, São José dos Campos 1227-010, Brazil
Remote Sens. 2016, 8(6), 451; https://doi.org/10.3390/rs8060451 - 27 May 2016
Cited by 28 | Viewed by 8517
Abstract
Brazil has one of the largest mangrove surfaces worldwide. Due to a wide latitudinal distribution, Brazilian mangroves can be found within a large range of environmental conditions. However, little attention has been given to the description of environmental variables driving the distribution of [...] Read more.
Brazil has one of the largest mangrove surfaces worldwide. Due to a wide latitudinal distribution, Brazilian mangroves can be found within a large range of environmental conditions. However, little attention has been given to the description of environmental variables driving the distribution of mangrove species in Brazil. In this study, we present a novel and unprecedented description of environmental conditions for all mangroves along the Brazilian coast focusing on species limits. We apply a descriptive statistics and data-driven approach using Self-Organizing Maps and we combine data from terrestrial and marine environmental geodatabases in a Geographical Information System. We evaluate 25 environmental variables (21 bioclimatic variables, three sea surface temperature derivates, and salinity). The results reveal three groups of correlated variables: (i) air temperature derivates and sea surface temperature derivates; (ii) air temperature, potential evapotranspiration and precipitation derivates; and (iii) precipitation derivates, aridity and salinity. Our results unveil new locations of extreme values of temperature and precipitation. We conclude that Rhizophora harrisonii and Rhizophora racemosa are more limited by precipitation and aridity and that they do not necessarily follow a latitudinal gradient. Our data also reveal that the lowest air temperatures of the coldest month are not necessarily found at the southernmost limits of mangroves in Brazil; instead they are localized at the Mesoregion of Vale do Itajaí. However, the minimum sea surface temperature drops gradually with higher latitudes in the Brazilian southern hemisphere and is probably a better indicator for the decrease of species at the latitudinal limits of mangroves than the air temperature and precipitation. Full article
(This article belongs to the Special Issue Remote Sensing in Coastal Environments)
Show Figures

Graphical abstract

23 pages, 14161 KiB  
Article
Bayesian Method for Building Frequent Landsat-Like NDVI Datasets by Integrating MODIS and Landsat NDVI
by Limin Liao, Jinling Song *, Jindi Wang, Zhiqiang Xiao and Jian Wang
State Key Laboratory of Remote Sensing Science, School of Geography, Beijing Normal University, Beijing 100875, China
Remote Sens. 2016, 8(6), 452; https://doi.org/10.3390/rs8060452 - 27 May 2016
Cited by 81 | Viewed by 8764
Abstract
Studies related to vegetation dynamics in heterogeneous landscapes often require Normalized Difference Vegetation Index (NDVI) datasets with both high spatial resolution and frequent coverage, which cannot be satisfied by a single sensor due to technical limitations. In this study, we propose a new [...] Read more.
Studies related to vegetation dynamics in heterogeneous landscapes often require Normalized Difference Vegetation Index (NDVI) datasets with both high spatial resolution and frequent coverage, which cannot be satisfied by a single sensor due to technical limitations. In this study, we propose a new method called NDVI-Bayesian Spatiotemporal Fusion Model (NDVI-BSFM) for accurately and effectively building frequent high spatial resolution Landsat-like NDVI datasets by integrating Moderate Resolution Imaging Spectroradiometer (MODIS) and Landsat NDVI. Experimental comparisons with the results obtained using other popular methods (i.e., the Spatial and Temporal Adaptive Reflectance Fusion Model (STARFM), the Enhanced Spatial and Temporal Adaptive Reflectance Fusion Model (ESTARFM), and the Flexible Spatiotemporal DAta Fusion (FSDAF) method) showed that our proposed method has the following advantages: (1) it can obtain more accurate estimates; (2) it can retain more spatial detail; (3) its prediction accuracy is less dependent on the quality of the MODIS NDVI on the specific prediction date; and (4) it produces smoother NDVI time series profiles. All of these advantages demonstrate the strengths and the robustness of the proposed NDVI-BSFM in providing reliable high spatial and temporal resolution NDVI datasets to support other land surface process studies. Full article
(This article belongs to the Special Issue Multi-Sensor and Multi-Data Integration in Remote Sensing)
Show Figures

Graphical abstract

15 pages, 6063 KiB  
Article
Woody Biomass Estimation in a Southwestern U.S. Juniper Savanna Using LiDAR-Derived Clumped Tree Segmentation and Existing Allometries
by Dan J. Krofcheck 1,*, Marcy E. Litvak 1, Christopher D. Lippitt 2 and Amy Neuenschwander 3
1 Department of Biology, University of New Mexico, Albuquerque, NM 87131, USA
2 Department of Geography, University of New Mexico, Albuquerque, NM 87131, USA
3 Applied Research Laboratories, University of Texas at Austin, Austin, TX 78712, USA
Remote Sens. 2016, 8(6), 453; https://doi.org/10.3390/rs8060453 - 27 May 2016
Cited by 31 | Viewed by 6240
Abstract
The rapid and accurate assessment of above ground biomass (AGB) of woody vegetation is a critical component of climate mitigation strategies, land management practices and process-based models of ecosystem function. This is especially true of semi-arid ecosystems, where the high variability in precipitation [...] Read more.
The rapid and accurate assessment of above ground biomass (AGB) of woody vegetation is a critical component of climate mitigation strategies, land management practices and process-based models of ecosystem function. This is especially true of semi-arid ecosystems, where the high variability in precipitation and disturbance regimes can have dramatic impacts on the global carbon budget by rapidly transitioning AGB between live and dead pools. Measuring regional AGB requires scaling ground-based measurements using remote sensing, an inherently challenging task in the sparsely-vegetated, spatially-heterogeneous landscapes characteristic of semi-arid regions. Here, we test the ability of canopy segmentation and statistic generation based on aerial LiDAR (light detection and ranging)-derived 3D point clouds to derive AGB in clumps of vegetation in a juniper savanna in central New Mexico. We show that single crown segmentation, often an error-prone and challenging task, is not required to produce accurate estimates of AGB. We leveraged the relationship between the volume of the segmented vegetation clumps and the equivalent stem diameter of the corresponding trees (R2 = 0.83, p < 0.001) to drive the allometry for J. monosperma on a per segment basis. Further, we showed that making use of the full 3D point cloud from LiDAR for the generation of canopy object statistics improved that relationship by including canopy segment point density as a covariate (R2 = 0.91). This work suggests the potential for LiDAR-derived estimates of AGB in spatially-heterogeneous and highly-clumped ecosystems. Full article
Show Figures

Graphical abstract

16 pages, 4924 KiB  
Article
Improved Quality of MODIS Sea Surface Temperature Retrieval and Data Coverage Using Physical Deterministic Methods
by Prabhat K. Koner 1,2,* and Andy Harris 1,2
1 NOAA/NESDIS Center for Satellite Applications and Research (STAR), E/RA3, 5830 University Research Ct., College Park, MD 20740, USA
2 CICS/Earth System Science Interdisciplinary Center, University of Maryland, 5825 University Research Ct., College Park, MD 20740, USA
Remote Sens. 2016, 8(6), 454; https://doi.org/10.3390/rs8060454 - 27 May 2016
Cited by 14 | Viewed by 5449
Abstract
Sea surface temperature (SST) retrievals from satellite imager measurements are often performed using only two or three channels, and employ a regression methodology. As there are 16 thermal infrared (IR) channels available for MODIS, we demonstrate a new SST retrieval methodology using more [...] Read more.
Sea surface temperature (SST) retrievals from satellite imager measurements are often performed using only two or three channels, and employ a regression methodology. As there are 16 thermal infrared (IR) channels available for MODIS, we demonstrate a new SST retrieval methodology using more channels and a physically deterministic method, the modified total least squares (MTLS), to improve the quality of SST. Since cloud detection is always a part of any parameter estimation from IR satellite measurements, we hereby extend our recently-published novel cloud detection technique, which is based on both functional spectral differences and radiative transfer modeling for GOES-13. We demonstrate that the cloud detection coefficients derived for GOES-13 are working well for MODIS, while further improvements are made possible by the extra channels replacing some of the previous tests. The results are compared with available operational MODIS SST through the Group for High Resolution SST website–the data themselves are originally processed by the NASA Goddard Ocean Biology Processing Group. It is observed the data coverage can be more than doubled compared to the currently-available operational product, and at the same time the quality can be improved significantly. Two other SST retrieval methods, offline-calculated coefficients using the same form of the operational regression equation, and radiative transfer based optimal estimation, are included for comparison purposes. Full article
Show Figures

Graphical abstract

13 pages, 1500 KiB  
Article
Relating the Age of Arctic Sea Ice to its Thickness, as Measured during NASA’s ICESat and IceBridge Campaigns
by Mark A. Tschudi 1,*, Julienne C. Stroeve 2 and J. Scott Stewart 3
1 CCAR, University of Colorado, Boulder, CO 80309, USA
2 NSIDC, University of Colorado, Boulder, CO 80303, USA
3 Exploratory Thinking, Longmont, CO 80501, USA
Remote Sens. 2016, 8(6), 457; https://doi.org/10.3390/rs8060457 - 27 May 2016
Cited by 69 | Viewed by 10878
Abstract
Recent satellite observations yield estimates of the distribution of sea ice thickness across the entire Arctic Ocean. While these sensors were only placed in operation within the last few years, information from other sensors may assist us with estimating the distribution of sea [...] Read more.
Recent satellite observations yield estimates of the distribution of sea ice thickness across the entire Arctic Ocean. While these sensors were only placed in operation within the last few years, information from other sensors may assist us with estimating the distribution of sea ice thickness in the Arctic beginning in the 1980s. A previous study found that the age of sea ice is correlated to sea ice thickness from 2003 to 2006, but an extension of the temporal analysis is needed to better quantify this relationship and its variability from year to year. Estimates of the ice age/thickness relationship may allow the thickness record to be extended back to 1985, the beginning of our ice age dataset. Comparisons of ice age and thickness estimates derived from both ICESat (2004–2008) and IceBridge (2009–2015) reveal that the relationship between age and thickness differs between these two campaigns, due in part to the difference in area of coverage. Nonetheless, sea ice thickness and age exhibit a direct relationship when compared on pan-Arctic or regional spatial scales. Full article
(This article belongs to the Special Issue Sea Ice Remote Sensing and Analysis)
Show Figures

Graphical abstract

19 pages, 2876 KiB  
Article
Effects of Spatial Sampling Interval on Roughness Parameters and Microwave Backscatter over Agricultural Soil Surfaces
by Matías Ernesto Barber 1,*, Francisco Matías Grings 1,†, Jesús Álvarez-Mozos 2,†, Marcela Piscitelli 3, Pablo Alejandro Perna 1 and Haydee Karszenbaum 1
1 Grupo de Teledetección Cuantitativa, Instituto de Astronomía y Física del Espacio (IAFE, CONICET-UBA), Int. Guiraldez 2700, Buenos Aires 1428, Argentina
2 Departamento de Proyectos e Ingeniería Rural, Universidad Pública de Navarra, Campus de Arrosadía, Pamplona 31006, Spain
3 Cátedra de Conservación y Manejo de Suelos, Facultad de Agronomía, Universidad Nacional del Centro de la Pcia. de Buenos Aires (UNICEN), Gral. Pinto 399, Tandil 7000, Argentina
These authors contributed equally to this work.
Remote Sens. 2016, 8(6), 458; https://doi.org/10.3390/rs8060458 - 8 Jun 2016
Cited by 16 | Viewed by 6922
Abstract
The spatial sampling interval, as related to the ability to digitize a soil profile with a certain number of features per unit length, depends on the profiling technique itself. From a variety of profiling techniques, roughness parameters are estimated at different sampling intervals. [...] Read more.
The spatial sampling interval, as related to the ability to digitize a soil profile with a certain number of features per unit length, depends on the profiling technique itself. From a variety of profiling techniques, roughness parameters are estimated at different sampling intervals. Since soil profiles have continuous spectral components, it is clear that roughness parameters are influenced by the sampling interval of the measurement device employed. In this work, we contributed to answer which sampling interval the profiles needed to be measured at to accurately account for the microwave response of agricultural surfaces. For this purpose, a 2-D laser profiler was built and used to measure surface soil roughness at field scale over agricultural sites in Argentina. Sampling intervals ranged from large (50 mm) to small ones (1 mm), with several intermediate values. Large- and intermediate-sampling-interval profiles were synthetically derived from nominal, 1 mm ones. With these data, the effect of sampling-interval-dependent roughness parameters on backscatter response was assessed using the theoretical backscatter model IEM2M. Simulations demonstrated that variations of roughness parameters depended on the working wavelength and was less important at L-band than at C- or X-band. In any case, an underestimation of the backscattering coefficient of about 1-4 dB was observed at larger sampling intervals. As a general rule a sampling interval of 15 mm can be recommended for L-band and 5 mm for C-band. Full article
(This article belongs to the Special Issue Remote Sensing Applied to Soils: From Ground to Space)
Show Figures

Graphical abstract

18 pages, 3030 KiB  
Article
Effects of Per-Pixel Variability on Uncertainties in Bathymetric Retrievals from High-Resolution Satellite Images
by Elizabeth J. Botha 1,*, Vittorio E. Brando 1,2 and Arnold G. Dekker 3
1 Coastal Development and Management Program, CSIRO Oceans and Atmosphere, GPO Box 1666, Canberra, ACT 2601, Australia
2 National Research Council of Italy, Institute of Atmospheric Sciences and Climate (CNR-ISAC), Rome 00133, Italy
3 Earth Observation and Informatics FSP, CSIRO Land and Water, GPO Box 1666, Canberra ACT 2601, Australia
Remote Sens. 2016, 8(6), 459; https://doi.org/10.3390/rs8060459 - 28 May 2016
Cited by 32 | Viewed by 6721
Abstract
Increased sophistication of high spatial resolution multispectral satellite sensors provides enhanced bathymetric mapping capability. However, the enhancements are counter-acted by per-pixel variability in sunglint, atmospheric path length and directional effects. This case-study highlights retrieval errors from images acquired at non-optimal geometrical combinations. The [...] Read more.
Increased sophistication of high spatial resolution multispectral satellite sensors provides enhanced bathymetric mapping capability. However, the enhancements are counter-acted by per-pixel variability in sunglint, atmospheric path length and directional effects. This case-study highlights retrieval errors from images acquired at non-optimal geometrical combinations. The effects of variations in the environmental noise on water surface reflectance and the accuracy of environmental variable retrievals were quantified. Two WorldView-2 satellite images were acquired, within one minute of each other, with Image 1 placed in a near-optimal sun-sensor geometric configuration and Image 2 placed close to the specular point of the Bidirectional Reflectance Distribution Function (BRDF). Image 2 had higher total environmental noise due to increased surface glint and higher atmospheric path-scattering. Generally, depths were under-estimated from Image 2, compared to Image 1. A partial improvement in retrieval error after glint correction of Image 2 resulted in an increase of the maximum depth to which accurate depth estimations were returned. This case-study indicates that critical analysis of individual images, accounting for the entire sun elevation and azimuth and satellite sensor pointing and geometry as well as anticipated wave height and direction, is required to ensure an image is fit for purpose for aquatic data analysis. Full article
(This article belongs to the Special Issue Remote Sensing in Coastal Environments)
Show Figures

Graphical abstract

26 pages, 13833 KiB  
Article
Evaluation of MODIS LAI/FPAR Product Collection 6. Part 2: Validation and Intercomparison
by Kai Yan 1,2, Taejin Park 2, Guangjian Yan 1,*, Zhao Liu 2, Bin Yang 2,3, Chi Chen 2, Ramakrishna R. Nemani 4, Yuri Knyazikhin 2 and Ranga B. Myneni 2
1 School of Geography, State Key Laboratory of Remote Sensing Science, Beijing Normal University, Beijing 100875, China
2 Department of Earth and Environment, Boston University, Boston, MA 02215, USA
3 Beijing Key Lab of Spatial Information Integration and Its Applications, Institute of RS and GIS, Peking University, Beijing 100871, China
4 The National Aeronautics and Space Administration (NASA) Ames Research Center, Moffett Field, CA 94035, USA
Remote Sens. 2016, 8(6), 460; https://doi.org/10.3390/rs8060460 - 30 May 2016
Cited by 247 | Viewed by 14343
Abstract
The aim of this paper is to assess the latest version of the MODIS LAI/FPAR product (MOD15A2H), namely Collection 6 (C6). We comprehensively evaluate this product through three approaches: validation with field measurements, intercomparison with other LAI/FPAR products and comparison with climate variables. [...] Read more.
The aim of this paper is to assess the latest version of the MODIS LAI/FPAR product (MOD15A2H), namely Collection 6 (C6). We comprehensively evaluate this product through three approaches: validation with field measurements, intercomparison with other LAI/FPAR products and comparison with climate variables. Comparisons between ground measurements and C6, as well as C5 LAI/FPAR indicate: (1) MODIS LAI is closer to true LAI than effective LAI; (2) the C6 product is considerably better than C5 with RMSE decreasing from 0.80 down to 0.66; (3) both C5 and C6 products overestimate FPAR over sparsely-vegetated areas. Intercomparisons with three existing global LAI/FPAR products (GLASS, CYCLOPES and GEOV1) are carried out at site, continental and global scales. MODIS and GLASS (CYCLOPES and GEOV1) agree better with each other. This is expected because the surface reflectances, from which these products were derived, were obtained from the same instrument. Considering all biome types, the RMSE of LAI (FPAR) derived from any two products ranges between 0.36 (0.05) and 0.56 (0.09). Temporal comparisons over seven sites for the 2001–2004 period indicate that all products properly capture the seasonality in different biomes, except evergreen broadleaf forests, where infrequent observations due to cloud contamination induce unrealistic variations. Thirteen years of C6 LAI, temperature and precipitation time series data are used to assess the degree of correspondence between their variations. The statistically-significant associations between C6 LAI and climate variables indicate that C6 LAI has the potential to provide reliable biophysical information about the land surface when diagnosing climate-driven vegetation responses. Full article
(This article belongs to the Special Issue Remote Sensing of Vegetation Structure and Dynamics)
Show Figures

Graphical abstract

25 pages, 14477 KiB  
Article
Joint Multi-Image Saliency Analysis for Region of Interest Detection in Optical Multispectral Remote Sensing Images
by Jie Chen and Libao Zhang *
The College of Information Science and Technology, Beijing Normal University, Beijing 100875, China
Remote Sens. 2016, 8(6), 461; https://doi.org/10.3390/rs8060461 - 31 May 2016
Cited by 15 | Viewed by 7627
Abstract
The automatic detection of regions of interest (ROI) is useful for remote sensing image analysis, such as land cover classification, object recognition, image compression, and various computer vision related applications. Recently, approaches based on visual saliency have been utilized for ROI detection. However, [...] Read more.
The automatic detection of regions of interest (ROI) is useful for remote sensing image analysis, such as land cover classification, object recognition, image compression, and various computer vision related applications. Recently, approaches based on visual saliency have been utilized for ROI detection. However, most existing methods focus on detecting ROIs from a single image, which generally cannot precisely extract ROIs against a complicated background or exclude images with no ROIs. In this paper, we propose a joint multi-image saliency (JMS) algorithm to simultaneously extract the common ROIs in a set of optical multispectral remote sensing images with the additional ability to identify images that do not contain the common ROIs. First, bisecting K-means clustering on the entire image set allows us to extract the global correspondence among multiple images in RGB and CIELab color spaces. Second, clusterwise saliency computation aggregating global color and shape contrast efficiently assigns common ROIs with high saliency, while effectively depressing interfering background that is salient only within its own image. Finally, binary ROI masks are generated by thresholding saliency maps. In addition, we construct an edge-preserving JMS model through edge-preserving mask optimization strategy, so as to facilitate the generation of a uniformly highlighted ROI mask with sharp borders. Experimental results demonstrate the advantages of our model in detection accuracy consistency and runtime efficiency. Full article
Show Figures

Graphical abstract

22 pages, 7638 KiB  
Article
Landscape-Level Associations of Wintering Waterbird Diversity and Abundance from Remotely Sensed Wetland Characteristics of Poyang Lake
by Iryna Dronova 1,*, Steven R. Beissinger 2, James W. Burnham 3,4 and Peng Gong 2,5,6
1 Department of Landscape Architecture & Environmental Planning, College of Environmental Design, University of California Berkeley, Berkeley, CA 94720-2000, USA
2 Department of Environmental Science, Policy and Management, Division of Ecosystem Science, College of Natural Resources, University of California, Berkeley, CA 94720-3114, USA
3 Department of Forest and Wildlife Ecology, College of Agriculture and Life Sciences, University of Wisconsin-Madison, Madison, WI 53706-1598, USA
4 The International Crane Foundation, Baraboo, WI 53913, USA
5 Ministry of Education Key Laboratory for Earth System Modeling, Center for Earth System Science, Tsinghua University, Beijing 100084, China
6 Poyang Lake Ecological Research Station for Environment and Health, Duchang 332600, China
Remote Sens. 2016, 8(6), 462; https://doi.org/10.3390/rs8060462 - 31 May 2016
Cited by 38 | Viewed by 8707
Abstract
Poyang Lake, the largest freshwater wetland in China, provides critical habitat for wintering waterbirds from the East Asian Flyway; however, landscape drivers of non-uniform bird diversity and abundance are not yet well understood. Using a winter 2006 waterbird survey, we examined the relationships [...] Read more.
Poyang Lake, the largest freshwater wetland in China, provides critical habitat for wintering waterbirds from the East Asian Flyway; however, landscape drivers of non-uniform bird diversity and abundance are not yet well understood. Using a winter 2006 waterbird survey, we examined the relationships among metrics of bird community diversity and abundance and landscape characteristics of 51 wetland sub-lakes derived by an object-based classification of Landsat satellite data. Relative importance of predictors and their sets was assessed using information-theoretic model selection and the Akaike Information Criterion. Ordinary least squares regression models were diagnosed and corrected for spatial autocorrelation using spatial autoregressive lag and error models. The strongest and most consistent landscape predictors included Normalized Difference Vegetation Index for mudflat (negative effect) and emergent grassland (positive effect), total sub-lake area (positive effect), and proportion of submerged vegetation (negative effect). Significant spatial autocorrelation in linear regression was associated with local clustering of response and predictor variables, and should be further explored for selection of wetland sampling units and management of protected areas. Overall, results corroborate the utility of remote sensing to elucidate potential indicators of waterbird diversity that complement logistically challenging ground observations and offer new hypotheses on factors underlying community distributions. Full article
(This article belongs to the Special Issue What can Remote Sensing Do for the Conservation of Wetlands?)
Show Figures

Graphical abstract

23 pages, 11386 KiB  
Article
Hyperspectral Unmixing via Double Abundance Characteristics Constraints Based NMF
by Rong Liu 1, Bo Du 2,* and Liangpei Zhang 1
1 The State Key Laboratory of Information Engineering in Surveying, Mapping, and Remote Sensing, Wuhan University, Wuhan 430079, China
2 School of Computer, Wuhan University, Wuhan 430079, China
Remote Sens. 2016, 8(6), 464; https://doi.org/10.3390/rs8060464 - 31 May 2016
Cited by 36 | Viewed by 6006
Abstract
Hyperspectral unmixing aims to obtain the hidden constituent materials and the corresponding fractional abundances from mixed pixels, and is an important technique for hyperspectral image (HSI) analysis. In this paper, two characteristics of the abundance variables, namely, the local spatial structural feature and [...] Read more.
Hyperspectral unmixing aims to obtain the hidden constituent materials and the corresponding fractional abundances from mixed pixels, and is an important technique for hyperspectral image (HSI) analysis. In this paper, two characteristics of the abundance variables, namely, the local spatial structural feature and the statistical distribution, are incorporated into nonnegative matrix factorization (NMF) to alleviate the non-convex problem of NMF and enhance the hyperspectral unmixing accuracy. An adaptive local neighborhood weight constraint is proposed for the abundance matrix by taking advantage of the spatial-spectral information of the HSI. The spectral information is utilized to calculate the similarities between pixels, which are taken as the measurement of the smoothness levels. Furthermore, because abrupt changes may appear in transition areas or outliers may exist in spatially neighboring regions, any inappropriate smoothness constraint on these pixels is removed, which can better express the local smoothness characteristic of the abundance variables. In addition, a separation constraint is used to prevent the result from over-smoothing, preserving the inner diversity of the same kind of material. Extensive experiments were carried out on both simulated and real HSIs, confirming the effectiveness of the proposed approach. Full article
Show Figures

Graphical abstract

31 pages, 18917 KiB  
Article
Shadow-Based Hierarchical Matching for the Automatic Registration of Airborne LiDAR Data and Space Imagery
by Alireza Safdarinezhad, Mehdi Mokhtarzade * and Mohammad Javad Valadan Zoej
Faculty of Geodesy and Geomatics, K. N. Toosi University of Technology, Tehran 19667-15433, Iran
Remote Sens. 2016, 8(6), 466; https://doi.org/10.3390/rs8060466 - 3 Jun 2016
Cited by 13 | Viewed by 7419
Abstract
The automatic registration of LiDAR data and optical images, which are heterogeneous data sources, has been a major research challenge in recent years. In this paper, a novel hierarchical method is proposed in which the least amount of interaction of a skilled operator [...] Read more.
The automatic registration of LiDAR data and optical images, which are heterogeneous data sources, has been a major research challenge in recent years. In this paper, a novel hierarchical method is proposed in which the least amount of interaction of a skilled operator is required. Thereby, two shadow extraction schemes, one from LiDAR and the other from high-resolution satellite images, were used, and the obtained 2D shadow maps were then considered as prospective matching entities. Taken as the base, the reconstructed LiDAR shadows were transformed to image shadows using a four-step hierarchical method starting from a coarse 2D registration model and leading to a fine 3D registration model. In the first step, a general matching was performed in the frequency domain that yielded a rough 2D similarity model that related the LiDAR and image shadow masks. This model was further improved by modeling and compensating for the local geometric distortions that existed between the two heterogeneous data sources. In the third step, shadow masks, which were organized as segmented matched patches, were the subjects of a coinciding procedure that resulted in a coarse 3D registration model. In the last hierarchical step, that model was ultimately reinforced via a precise matching between the LiDAR and image edges. The evaluation results, which were conducted on six datasets and from different relative and absolute aspects, demonstrated the efficiency of the proposed method, which had a very promising accuracy on the order of one pixel. Full article
Show Figures

Graphical abstract

23 pages, 27236 KiB  
Article
Defuzzification Strategies for Fuzzy Classifications of Remote Sensing Data
by Peter Hofmann
Interfaculty Department of Geoinformatics—Z_GIS, University of Salzburg, Schillerstr. 30, 5020 Salzburg, Austria
Remote Sens. 2016, 8(6), 467; https://doi.org/10.3390/rs8060467 - 7 Jun 2016
Cited by 18 | Viewed by 7009
Abstract
The classes in fuzzy classification schemes are defined as fuzzy sets, partitioning the feature space through fuzzy rules, defined by fuzzy membership functions. Applying fuzzy classification schemes in remote sensing allows each pixel or segment to be an incomplete member of more than [...] Read more.
The classes in fuzzy classification schemes are defined as fuzzy sets, partitioning the feature space through fuzzy rules, defined by fuzzy membership functions. Applying fuzzy classification schemes in remote sensing allows each pixel or segment to be an incomplete member of more than one class simultaneously, i.e., one that does not fully meet all of the classification criteria for any one of the classes and is member of more than one class simultaneously. This can lead to fuzzy, ambiguous and uncertain class assignation, which is unacceptable for many applications, indicating the need for a reliable defuzzification method. Defuzzification in remote sensing has to date, been performed by “crisp-assigning” each fuzzy-classified pixel or segment to the class for which it best fulfills the fuzzy classification rules, regardless of its classification fuzziness, uncertainty or ambiguity (maximum method). The defuzzification of an uncertain or ambiguous fuzzy classification leads to a more or less reliable crisp classification. In this paper the most common parameters for expressing classification uncertainty, fuzziness and ambiguity are analysed and discussed in terms of their ability to express the reliability of a crisp classification. This is done by means of a typical practical example from Object Based Image Analysis (OBIA). Full article
Show Figures

Figure 1

21 pages, 52170 KiB  
Article
Imaging Land Subsidence Induced by Groundwater Extraction in Beijing (China) Using Satellite Radar Interferometry
by Mi Chen 1,2,*, Roberto Tomás 2,3, Zhenhong Li 2, Mahdi Motagh 4, Tao Li 2,5, Leyin Hu 2,6, Huili Gong 1, Xiaojuan Li 1, Jun Yu 7 and Xulong Gong 7
1 College of Resources Environment and Tourism, Capital Normal University, Beijing 10048, China
2 Center for Observation & Modeling of Earthquakes, Volcanoes & Tectonics (COMET), School of Civil Engineering and Geosciences, Newcastle University, Newcastle upon Tyne, Tyne and Wear NE1 7RU, UK
3 Department of Civil Engineering, Escuela Politécnica Superior, University of Alicante, P.O. Box 99, Alicante 03080, Spain
4 GFZ German Research Centre for Geosciences, Department of Geodesy, Potsdam 14473, Germany
5 GNSS Research Center, Wuhan University, Wuhan 430079, China
6 Earthquake Administration of Beijing Municipality, Beijing 100080, China
7 Key Laboratory of Earth Fissures Geological Disaster, Ministry of Land and Resources (Geological Survey of Jiangsu Province), Nanjing 210018, China
Remote Sens. 2016, 8(6), 468; https://doi.org/10.3390/rs8060468 - 2 Jun 2016
Cited by 197 | Viewed by 37918
Abstract
Beijing is one of the most water-stressed cities in the world. Due to over-exploitation of groundwater, the Beijing region has been suffering from land subsidence since 1935. In this study, the Small Baseline InSAR technique has been employed to process Envisat ASAR images [...] Read more.
Beijing is one of the most water-stressed cities in the world. Due to over-exploitation of groundwater, the Beijing region has been suffering from land subsidence since 1935. In this study, the Small Baseline InSAR technique has been employed to process Envisat ASAR images acquired between 2003 and 2010 and TerraSAR-X stripmap images collected from 2010 to 2011 to investigate land subsidence in the Beijing region. The maximum subsidence is seen in the eastern part of Beijing with a rate greater than 100 mm/year. Comparisons between InSAR and GPS derived subsidence rates show an RMS difference of 2.94 mm/year with a mean of 2.41 ± 1.84 mm/year. In addition, a high correlation was observed between InSAR subsidence rate maps derived from two different datasets (i.e., Envisat and TerraSAR-X). These demonstrate once again that InSAR is a powerful tool for monitoring land subsidence. InSAR derived subsidence rate maps have allowed for a comprehensive spatio-temporal analysis to identify the main triggering factors of land subsidence. Some interesting relationships in terms of land subsidence were found with groundwater level, active faults, accumulated soft soil thickness and different aquifer types. Furthermore, a relationship with the distances to pumping wells was also recognized in this work. Full article
(This article belongs to the Special Issue Earth Observations for Geohazards)
Show Figures

Graphical abstract

26 pages, 3695 KiB  
Article
Examining Spectral Reflectance Saturation in Landsat Imagery and Corresponding Solutions to Improve Forest Aboveground Biomass Estimation
by Panpan Zhao 1, Dengsheng Lu 1,2,*, Guangxing Wang 1,3, Chuping Wu 4, Yujie Huang 4 and Shuquan Yu 5
1 Key Laboratory of Carbon Cycling in Forest Ecosystems and Carbon Sequestration of Zhejiang Province, School of Environmental & Resource Sciences, Zhejiang Agriculture and Forestry University, Lin’an 311300, China
2 Center for Global Change and Earth Observations, Michigan State University, East Lansing, MI 48823, USA
3 Department of Geography, Southern Illinois University Carbondale, Carbondale, IL 62901, USA
4 Zhejiang Forestry Academy, Hangzhou 310023, China
5 School of Forestry and Biotechnology, Zhejiang Agriculture and Forestry University, Lin’an 311300, China
Remote Sens. 2016, 8(6), 469; https://doi.org/10.3390/rs8060469 - 2 Jun 2016
Cited by 222 | Viewed by 13620
Abstract
The data saturation problem in Landsat imagery is well recognized and is regarded as an important factor resulting in inaccurate forest aboveground biomass (AGB) estimation. However, no study has examined the saturation values for different vegetation types such as coniferous and broadleaf forests. [...] Read more.
The data saturation problem in Landsat imagery is well recognized and is regarded as an important factor resulting in inaccurate forest aboveground biomass (AGB) estimation. However, no study has examined the saturation values for different vegetation types such as coniferous and broadleaf forests. The objective of this study is to estimate the saturation values in Landsat imagery for different vegetation types in a subtropical region and to explore approaches to improving forest AGB estimation. Landsat Thematic Mapper imagery, digital elevation model data, and field measurements in Zhejiang province of Eastern China were used. Correlation analysis and scatterplots were first used to examine specific spectral bands and their relationships with AGB. A spherical model was then used to quantitatively estimate the saturation value of AGB for each vegetation type. A stratification of vegetation types and/or slope aspects was used to determine the potential to improve AGB estimation performance by developing a specific AGB estimation model for each category. Stepwise regression analysis based on Landsat spectral signatures and textures using grey-level co-occurrence matrix (GLCM) was used to develop AGB estimation models for different scenarios: non-stratification, stratification based on either vegetation types, slope aspects, or the combination of vegetation types and slope aspects. The results indicate that pine forest and mixed forest have the highest AGB saturation values (159 and 152 Mg/ha, respectively), Chinese fir and broadleaf forest have lower saturation values (143 and 123 Mg/ha, respectively), and bamboo forest and shrub have the lowest saturation values (75 and 55 Mg/ha, respectively). The stratification based on either vegetation types or slope aspects provided smaller root mean squared errors (RMSEs) than non-stratification. The AGB estimation models based on stratification of both vegetation types and slope aspects provided the most accurate estimation with the smallest RMSE of 24.5 Mg/ha. Relatively low AGB (e.g., less than 40 Mg/ha) sites resulted in overestimation and higher AGB (e.g., greater than 140 Mg/ha) sites resulted in underestimation. The smallest RMSE was obtained when AGB was 80–120 Mg/ha. This research indicates the importance of stratification in mitigating the data saturation problem, thus improving AGB estimation. Full article
(This article belongs to the Special Issue Digital Forest Resource Monitoring and Uncertainty Analysis)
Show Figures

Graphical abstract

17 pages, 5032 KiB  
Article
Detection of High-Density Crowds in Aerial Images Using Texture Classification
by Oliver Meynberg *, Shiyong Cui and Peter Reinartz
German Aerospace Center (DLR), Remote Sensing Technology Institute, Wessling 82234, Germany
Remote Sens. 2016, 8(6), 470; https://doi.org/10.3390/rs8060470 - 2 Jun 2016
Cited by 24 | Viewed by 8941
Abstract
Automatic crowd detection in aerial images is certainly a useful source of information to prevent crowd disasters in large complex scenarios of mass events. A number of publications employ regression-based methods for crowd counting and crowd density estimation. However, these methods work only [...] Read more.
Automatic crowd detection in aerial images is certainly a useful source of information to prevent crowd disasters in large complex scenarios of mass events. A number of publications employ regression-based methods for crowd counting and crowd density estimation. However, these methods work only when a correct manual count is available to serve as a reference. Therefore, it is the objective of this paper to detect high-density crowds in aerial images, where counting– or regression–based approaches would fail. We compare two texture–classification methodologies on a dataset of aerial image patches which are grouped into ranges of different crowd density. These methodologies are: (1) a Bag–of–words (BoW) model with two alternative local features encoded as Improved Fisher Vectors and (2) features based on a Gabor filter bank. Our results show that a classifier using either BoW or Gabor features can detect crowded image regions with 97% classification accuracy. In our tests of four classes of different crowd-density ranges, BoW–based features have a 5%–12% better accuracy than Gabor. Full article
Show Figures

Graphical abstract

18 pages, 13825 KiB  
Article
Evaluation of IMERG and TRMM 3B43 Monthly Precipitation Products over Mainland China
by Fengrui Chen 1,2,* and Xi Li 3,4,*
1 Collaborative Innovation Center of Yellow River Civilization, Henan University, Kaifeng 475001, China
2 Key Laboratory of Geospatial Technology for the Middle and Lower Yellow River Regions, Ministry of Education, Henan University, Kaifeng 475001, China
3 State Key Laboratory of Information Engineering in Surveying, Mapping and Remote Sensing, Wuhan University, Wuhan 430079, China
4 Collaborative Innovation Centre of Geospatial Technology, Wuhan 430079, China
Remote Sens. 2016, 8(6), 472; https://doi.org/10.3390/rs8060472 - 2 Jun 2016
Cited by 198 | Viewed by 9639
Abstract
As the successor of the Tropical Rainfall Measuring Mission (TRMM), the Global Precipitation Measurement (GPM) mission significantly improves the spatial resolution of precipitation estimates from 0.25° to 0.1°. The present study analyzed the error structures of Integrated Multisatellite Retrievals for GPM (IMERG) monthly [...] Read more.
As the successor of the Tropical Rainfall Measuring Mission (TRMM), the Global Precipitation Measurement (GPM) mission significantly improves the spatial resolution of precipitation estimates from 0.25° to 0.1°. The present study analyzed the error structures of Integrated Multisatellite Retrievals for GPM (IMERG) monthly precipitation products over Mainland China from March 2014 to February 2015 using gauge measurements at multiple spatiotemporal scales. Moreover, IMERG products were also compared with TRMM 3B43 products. The results show that: (1) overall, IMERG can capture the spatial patterns of precipitation over China well. It performs a little better than TRMM 3B43 at seasonal and monthly scales; (2) the performance of IMERG varies greatly spatially and temporally. IMERG performs better at low latitudes than at middle latitudes, and shows worse performance in winter than at other times; (3) compared with TRMM 3B43, IMERG significantly improves the estimation accuracy of precipitation over the Xinjiang region and the Qinghai-Tibetan Plateau, especially over the former where IMERG increases Pearson correlation coefficient by 0.18 and decreases root-mean-square error by 54.47 mm for annual precipitation estimates. However, most IMERG products over these areas are unreliable; and (4) IMERG shows poor performance in winter as TRMM 3B43 even if GPM improved its ability to sense frozen precipitation. Most of them over North China are unreliable during this period. Full article
Show Figures

Figure 1

20 pages, 11492 KiB  
Article
Estimation of Water Quality Parameters in Lake Erie from MERIS Using Linear Mixed Effect Models
by Kiana Zolfaghari * and Claude R. Duguay
Interdisciplinary Centre on Climate Change and Department of Geography and Environmental Management, University of Waterloo, Waterloo, ON N2L 3G1, Canada
Remote Sens. 2016, 8(6), 473; https://doi.org/10.3390/rs8060473 - 3 Jun 2016
Cited by 23 | Viewed by 8203
Abstract
Linear Mixed Effect (LME) models are applied to the CoastColour atmospherically-corrected Medium Resolution Imaging Spectrometer (MERIS) reflectance, L2R full resolution product, to derive chlorophyll-a (chl-a) concentration and Secchi disk depth (SDD) in Lake Erie, which is considered as a Case II water ( [...] Read more.
Linear Mixed Effect (LME) models are applied to the CoastColour atmospherically-corrected Medium Resolution Imaging Spectrometer (MERIS) reflectance, L2R full resolution product, to derive chlorophyll-a (chl-a) concentration and Secchi disk depth (SDD) in Lake Erie, which is considered as a Case II water (i.e., turbid and productive). A LME model considers the correlation that exists in the field measurements which have been performed repeatedly in space and time. In this study, models are developed based on the relation between the logarithmic scale of the water quality parameters and band ratios: B07:665 nm to B09:708.75 nm for log10chl-a and B06:620 nm to B04:510 nm for log10SDD. Cross validation is performed on the models. The results show good performance of the models, with Root Mean Square Errors (RMSE) and Mean Bias Errors (MBE) of 0.31 and 0.018 for log10chl-a, and 0.19 and 0.006 for log10SDD, respectively. The models are then applied to a time series of MERIS images acquired over Lake Erie from 2004–2012 to investigate the spatial and temporal variations of the water quality parameters. Produced maps reveal distinct monthly patterns for different regions of Lake Erie that are in agreement with known biogeochemical properties of the lake. The Detroit River and Maumee River carry sediments and nutrients to the shallow western basin. Hence, the shallow western basin of Lake Erie experiences the most intense algal blooms and the highest turbidity compared to the other sections of the lake. Maumee Bay, Sandusky Bay, Rondeau Bay and Long Point Bay are estimated to have prolonged intense algal bloom. Full article
(This article belongs to the Special Issue Water Optics and Water Colour Remote Sensing)
Show Figures

Graphical abstract

19 pages, 2822 KiB  
Article
Determination of the Optimal Mounting Depth for Calculating Effective Soil Temperature at L-Band: Maqu Case
by Shaoning Lv 1,2,*, Yijian Zeng 1, Jun Wen 2, Donghai Zheng 1 and Zhongbo Su 1
1 Department of Water Resources, Faculty of Geo-Information Science and Earth Observation (ITC), University of Twente, 7500AE Enschede, The Netherlands
2 Key Laboratory of Land Surface Process and Climate Change in Cold and Arid Regions, Cold and Arid Regions Environmental and Engineering Research Institute, Chinese Academy of Sciences, Lanzhou 730000, China
Remote Sens. 2016, 8(6), 476; https://doi.org/10.3390/rs8060476 - 4 Jun 2016
Cited by 13 | Viewed by 5749
Abstract
Effective soil temperature T e f f is one of the basic parameters in passive microwave remote sensing of soil moisture. At present, dedicated satellite soil moisture monitoring missions use the L-band as the operating frequency. However, T e f f at the [...] Read more.
Effective soil temperature T e f f is one of the basic parameters in passive microwave remote sensing of soil moisture. At present, dedicated satellite soil moisture monitoring missions use the L-band as the operating frequency. However, T e f f at the L-band is strongly affected by soil moisture and temperature profiles. Recently, a two-layer scheme and a corresponding multilayer form have been developed to accommodate such influences. In this study, the soil moisture/temperature data collected and simulated by the Noah land surface model across the Maqu Network are used to verify the newly developed schemes. There are two key findings. Firstly, the new two-layer scheme is able to assess which site provides relatively higher accuracy when estimating T e f f . It is found that, on average, nearly 20% of the T e f f signal cannot be captured by the Maqu Network, in the currently assumed common installation configuration. This knowledge is important, since the spatial averaged brightness temperature (a function of T e f f ) is used to determine soil moisture. Secondly, the developed method has made it possible to identify that the optimal mounting depths for the observation pair are 5 cm and 20 cm for calculating T e f f at the center station in the Maqu Network. It has been suggested that the newly developed method can provide an objective way to configure an optimal soil moisture/temperature network and improve the representativeness of the existing networks regarding the calculation of T e f f . Full article
Show Figures

Graphical abstract

22 pages, 9770 KiB  
Article
Examination of Abiotic Drivers and Their Influence on Spartina alterniflora Biomass over a Twenty-Eight Year Period Using Landsat 5 TM Satellite Imagery of the Central Georgia Coast
by John P. R. O’Donnell 1,* and John F. Schalles 2
1 Department of Atmospheric Science, Creighton University, Omaha, NE 68178, USA
2 Department of Biology, Creighton University, Omaha, NE 68178, USA
Remote Sens. 2016, 8(6), 477; https://doi.org/10.3390/rs8060477 - 4 Jun 2016
Cited by 57 | Viewed by 13910
Abstract
We examined the influence of abiotic drivers on inter-annual and phenological patterns of aboveground biomass for Marsh Cordgrass, Spartina alterniflora, on the Central Georgia Coast. The linkages between drivers and plant response via soil edaphic factors are captured in our graphical conceptual [...] Read more.
We examined the influence of abiotic drivers on inter-annual and phenological patterns of aboveground biomass for Marsh Cordgrass, Spartina alterniflora, on the Central Georgia Coast. The linkages between drivers and plant response via soil edaphic factors are captured in our graphical conceptual model. We used geospatial techniques to scale up in situ measurements of aboveground S. alterniflora biomass to landscape level estimates using 294 Landsat 5 TM scenes acquired between 1984 and 2011. For each scene we extracted data from the same 63 sampling polygons, containing 1222 pixels covering about 1.1 million m2. Using univariate and multiple regression tests, we compared Landsat derived biomass estimates for three S. alterniflora size classes against a suite of abiotic drivers. River discharge, total precipitation, minimum temperature, and mean sea level had positive relationships with and best explained biomass for all dates. Additional results, using seasonally binned data, indicated biomass was responsive to changing combinations of variables across the seasons. Our 28-year analysis revealed aboveground biomass declines of 33%, 35%, and 39% for S. alterniflora tall, medium, and short size classes, respectively. This decline correlated with drought frequency and severity trends and coincided with marsh die-backs events and increased snail herbivory in the second half of the study period. Full article
(This article belongs to the Special Issue Remote Sensing in Coastal Environments)
Show Figures

Graphical abstract

18 pages, 4124 KiB  
Article
Distinguishing Land Change from Natural Variability and Uncertainty in Central Mexico with MODIS EVI, TRMM Precipitation, and MODIS LST Data
by Zachary Christman 1,*, John Rogan 2, J. Ronald Eastman 2,3 and B. L. Turner 4
1 Department of Geography and Environment, Rowan University, Glassboro, NJ 08028, USA
2 Graduate School of Geography, Clark University, 950 Main Street, Worcester, MA 01610, USA
3 Clark Labs, Clark University, 950 Main Street, Worcester, MA 01610, USA
4 School of Geographical Sciences and Urban Planning, Arizona State University, COOR 5628, Tempe, AZ 85287-0104, USA
Remote Sens. 2016, 8(6), 478; https://doi.org/10.3390/rs8060478 - 7 Jun 2016
Cited by 4 | Viewed by 5376
Abstract
Precipitation and temperature enact variable influences on vegetation, impacting the type and condition of land cover, as well as the assessment of change over broad landscapes. Separating the influence of vegetative variability independent and discrete land cover change remains a major challenge to [...] Read more.
Precipitation and temperature enact variable influences on vegetation, impacting the type and condition of land cover, as well as the assessment of change over broad landscapes. Separating the influence of vegetative variability independent and discrete land cover change remains a major challenge to landscape change assessments. The heterogeneous Lerma-Chapala-Santiago watershed of central Mexico exemplifies both natural and anthropogenic forces enacting variability and change on the landscape. This study employed a time series of Enhanced Vegetation Index (EVI) composites from the Moderate Resolution Imaging Spectoradiometer (MODIS) for 2001–2007 and per-pixel multiple linear regressions in order to model changes in EVI as a function of precipitation, temperature, and elevation. Over the seven-year period, 59.1% of the variability in EVI was explained by variability in the independent variables, with highest model performance among changing and heterogeneous land cover types, while intact forest cover demonstrated the greatest resistance to changes in temperature and precipitation. Model results were compared to an independent change uncertainty assessment, and selected regional samples of change confusion and natural variability give insight to common problems afflicting land change analyses. Full article
(This article belongs to the Special Issue Uncertainties in Remote Sensing)
Show Figures

Graphical abstract

20 pages, 5601 KiB  
Article
An Object-Based Paddy Rice Classification Using Multi-Spectral Data and Crop Phenology in Assam, Northeast India
by Mrinal Singha 1,2, Bingfang Wu 2,* and Miao Zhang 2
1 University of Chinese Academy of Sciences, Beijing 100049, China
2 Division for Digital Agriculture, Institute of Remote Sensing and Digital Earth, Chinese Academy of Sciences, Olympic Village Science Park, West Beichen Road, Chaoyang District, Beijing 100101, China
Remote Sens. 2016, 8(6), 479; https://doi.org/10.3390/rs8060479 - 7 Jun 2016
Cited by 63 | Viewed by 11444
Abstract
Rice is the staple food for half of the world’s population. Therefore, accurate information of rice area is vital for food security. This study investigates the effect of phenology for rice mapping using an object-based image analysis (OBIA) approach. Crop phenology is combined [...] Read more.
Rice is the staple food for half of the world’s population. Therefore, accurate information of rice area is vital for food security. This study investigates the effect of phenology for rice mapping using an object-based image analysis (OBIA) approach. Crop phenology is combined with high spatial resolution multispectral data to accurately classify the rice. Phenology was used to capture the seasonal dynamics of the crops, while multispectral data provided the spatial variation patterns. Phenology was extracted from MODIS NDVI time series, and the distribution of rice was mapped from China’s Environmental Satellite (HJ-1A/B) data. Classification results were evaluated by a confusion matrix using 100 sample points. The overall accuracy of the resulting map of rice area generated by both spectral and phenology is 93%. The results indicate that the use of phenology improved the overall classification accuracy from 2%–4%. The comparison between the estimated rice areas and the State’s statistics shows underestimated values with a percentage difference of −34.53%. The results highlight the potential of the combined use of crop phenology and multispectral satellite data for accurate rice classification in a large area. Full article
Show Figures

Graphical abstract

16 pages, 9613 KiB  
Article
Automatic Detection of the Ice Edge in SAR Imagery Using Curvelet Transform and Active Contour
by Jiange Liu 1,2,*, K. Andrea Scott 2, Ahmed Gawish 2 and Paul Fieguth 2
1 Department of Automation, Northwestern Polytechnical University, Xi’an 710072, China
2 Department of Systems Design Engineering, University of Waterloo, Waterloo, ON N2L 3G1, Canada
Remote Sens. 2016, 8(6), 480; https://doi.org/10.3390/rs8060480 - 8 Jun 2016
Cited by 25 | Viewed by 7563
Abstract
A novel method based on the curvelet transform and active contour method to automatically detect the ice edge in Synthetic Aperture Radar (SAR) imagery is proposed. The method utilizes the location of high curvelet coefficients to determine regions in the image likely to [...] Read more.
A novel method based on the curvelet transform and active contour method to automatically detect the ice edge in Synthetic Aperture Radar (SAR) imagery is proposed. The method utilizes the location of high curvelet coefficients to determine regions in the image likely to contain the ice edge. Using an ice edge from passive microwave sea ice concentration for initialization, these regions are then joined using the active contour method to obtain the final ice edge. The method is evaluated on four dual polarization SAR scenes of the Labrador sea. Through comparison of the ice edge with that from image analysis charts, it is demonstrated that the proposed method can detect the ice edge effectively in SAR images. This is particularly relevant when the marginal ice zone is diffuse or the ice is thin, and using the definition of ice edge from the passive microwave ice concentration would underestimate the ice edge location. It is expected that the method may be useful for operations in marginal ice zones, such as offshore drilling, where a high resolution estimate of the ice edge location is required. It could also be useful as a first guess for an ice analyst, or for the assimilation of SAR data. Full article
(This article belongs to the Special Issue Sea Ice Remote Sensing and Analysis)
Show Figures

Graphical abstract

21 pages, 10559 KiB  
Article
On the Importance of High-Resolution Time Series of Optical Imagery for Quantifying the Effects of Snow Cover Duration on Alpine Plant Habitat
by Jean-Pierre Dedieu 1,2,3,*,†, Bradley Z. Carlson 4,5,6,†, Sylvain Bigot 1,2,3,6, Pascal Sirguey 7, Vincent Vionnet 8,9 and Philippe Choler 4,5,6,10
1 Laboratoire d’étude des Transferts en Hydrologie et Environnement, Université Grenoble Alpes, 460 rue de la Piscine, Saint Martin d’Hères 38400, France
2 Institut de Recherche pour le Développement, Laboratoire d’étude des Transferts en Hydrologie et Environnement, 460 rue de la Piscine, Saint Martin d’Hères 38400, France
3 Centre National de la Recherche Scientifique, Laboratoire d’étude des Transferts en Hydrologie et Environnement, 460 rue de la Piscine, Saint Martin d’Hères 38400, France
4 Université Grenoble Alpes, Laboratoire d’Ecologie Alpine, 2233 rue de la Piscine, Saint Martin d’Hères 38400, France
5 Centre National de la Recherche Scientifique, Laboratoire d’Ecologie Alpine, 2233 rue de la Piscine, Saint Martin d’Hères 38400, France
6 Long Term Ecological Research Network “Zone Atelier Alpes”, Saint Martin d’Hères 38400, France
7 University of Otago, National School of Surveying, P.O. Box 56, Dunedin 9054, New Zealand
8 Météo-France, Centre d’Etudes de la Neige, 1441 rue de la Piscine, Saint Martin d’Hères 38400, France
9 Centre National de la Recherche Scientifique, Centre d’Etudes de la Neige, 1441 rue de la Piscine, Saint Martin d’Hères 38400, France
10 Centre National de la Recherche Scientifique, Station Alpine Joseph Fourier, 2233 rue de la Piscine, Saint Martin d’Hères 38400, France
These authors contributed equally to this work.
add Show full affiliation list remove Hide full affiliation list
Remote Sens. 2016, 8(6), 481; https://doi.org/10.3390/rs8060481 - 7 Jun 2016
Cited by 39 | Viewed by 8526
Abstract
We investigated snow cover dynamics using time series of moderate (MODIS) to high (SPOT-4/5, Landsat-8) spatial resolution satellite imagery in a 3700 km2 region of the southwestern French Alps. Our study was carried out in the context of the SPOT (Take 5) [...] Read more.
We investigated snow cover dynamics using time series of moderate (MODIS) to high (SPOT-4/5, Landsat-8) spatial resolution satellite imagery in a 3700 km2 region of the southwestern French Alps. Our study was carried out in the context of the SPOT (Take 5) Experiment initiated by the Centre National d’Etudes Spatiales (CNES), with the aim of exploring the utility of high spatial and temporal resolution multispectral satellite imagery for snow cover mapping and applications in alpine ecology. Our three objectives were: (i) to validate remote sensing observations of first snow free day derived from the Normalized Difference Snow Index (NDSI) relative to ground-based measurements; (ii) to generate regional-scale maps of first snow free day and peak standing biomass derived from the Normalized Difference Vegetation Index (NDVI); and (iii) to examine the usefulness of these maps for habitat mapping of herbaceous vegetation communities above the tree line. Imagery showed strong agreement with ground-based measurements of snow melt-out date, although R2 was higher for SPOT and Landsat time series (0.92) than for MODIS (0.79). Uncertainty surrounding estimates of first snow free day was lower in the case of MODIS, however (±3 days as compared to ±9 days for SPOT and Landsat), emphasizing the importance of high temporal as well as high spatial resolution for capturing local differences in snow cover duration. The main floristic differences between plant communities were clearly visible in a two-dimensional habitat template defined by the first snow free day and NDVI at peak standing biomass, and these differences were accentuated when axes were derived from high spatial resolution imagery. Our work demonstrates the enhanced potential of high spatial and temporal resolution multispectral imagery for quantifying snow cover duration and plant phenology in temperate mountain regions, and opens new avenues to examine to what extent plant community diversity and functioning are controlled by snow cover duration. Full article
Show Figures

Graphical abstract

27 pages, 13051 KiB  
Article
Change Detection in Synthetic Aperture Radar Images Using a Multiscale-Driven Approach
by Olaniyi A. Ajadi *, Franz J. Meyer and Peter W. Webley
Geophysical Institute, University of Alaska Fairbanks, 903 Koyukuk Drive, P.O. Box 757320, Fairbanks, AK 99775, USA
Remote Sens. 2016, 8(6), 482; https://doi.org/10.3390/rs8060482 - 8 Jun 2016
Cited by 69 | Viewed by 12176
Abstract
Despite the significant progress that was achieved throughout the recent years, to this day, automatic change detection and classification from synthetic aperture radar (SAR) images remains a difficult task. This is, in large part, due to (a) the high level of speckle noise [...] Read more.
Despite the significant progress that was achieved throughout the recent years, to this day, automatic change detection and classification from synthetic aperture radar (SAR) images remains a difficult task. This is, in large part, due to (a) the high level of speckle noise that is inherent to SAR data; (b) the complex scattering response of SAR even for rather homogeneous targets; (c) the low temporal sampling that is often achieved with SAR systems, since sequential images do not always have the same radar geometry (incident angle, orbit path, etc.); and (d) the typically limited performance of SAR in delineating the exact boundary of changed regions. With this paper we present a promising change detection method that utilizes SAR images and provides solutions for these previously mentioned difficulties. We will show that the presented approach enables automatic and high-performance change detection across a wide range of spatial scales (resolution levels). The developed method follows a three-step approach of (i) initial pre-processing; (ii) data enhancement/filtering; and (iii) wavelet-based, multi-scale change detection. The stand-alone property of our approach is the high flexibility in applying the change detection approach to a wide range of change detection problems. The performance of the developed approach is demonstrated using synthetic data as well as a real-data application to wildfire progression near Fairbanks, Alaska. Full article
Show Figures

Graphical abstract

17 pages, 4703 KiB  
Article
Remote Sensing Image Scene Classification Using Multi-Scale Completed Local Binary Patterns and Fisher Vectors
by Longhui Huang 1, Chen Chen 2, Wei Li 1,* and Qian Du 3
1 College of Information Science and Technology, Beijing University of Chemical Technology, 100029 Beijing, China
2 Department of Electrical Engineering, University of Texas at Dallas, Dallas, TX 75080, USA
3 Department of Electrical and Computer Engineering, Mississippi State University, Starkville, MS 39762, USA
Remote Sens. 2016, 8(6), 483; https://doi.org/10.3390/rs8060483 - 8 Jun 2016
Cited by 154 | Viewed by 9717
Abstract
An effective remote sensing image scene classification approach using patch-based multi-scale completed local binary pattern (MS-CLBP) features and a Fisher vector (FV) is proposed. The approach extracts a set of local patch descriptors by partitioning an image and its multi-scale versions into dense [...] Read more.
An effective remote sensing image scene classification approach using patch-based multi-scale completed local binary pattern (MS-CLBP) features and a Fisher vector (FV) is proposed. The approach extracts a set of local patch descriptors by partitioning an image and its multi-scale versions into dense patches and using the CLBP descriptor to characterize local rotation invariant texture information. Then, Fisher vector encoding is used to encode the local patch descriptors (i.e., patch-based CLBP features) into a discriminative representation. To improve the discriminative power of feature representation, multiple sets of parameters are used for CLBP to generate multiple FVs that are concatenated as the final representation for an image. A kernel-based extreme learning machine (KELM) is then employed for classification. The proposed method is extensively evaluated on two public benchmark remote sensing image datasets (i.e., the 21-class land-use dataset and the 19-class satellite scene dataset) and leads to superior classification performance (93.00% for the 21-class dataset with an improvement of approximately 3% when compared with the state-of-the-art MS-CLBP and 94.32% for the 19-class dataset with an improvement of approximately 1%). Full article
Show Figures

Graphical abstract

18 pages, 2638 KiB  
Article
Joint Model and Observation Cues for Single-Image Shadow Detection
by Jiayuan Li 1, Qingwu Hu 1,2,* and Mingyao Ai 1,3
1 School of Remote Sensing and Information Engineering, Wuhan University, Wuhan 430079, China
2 Beijing Advanced Innovation Center for Imaging Technology, Key Laboratory of 3-Dimensional Information Acquisition and Application, Ministry of Education Capital Normal University, Beijing 100048, China
3 State Key Laboratory of Information Engineering, Surveying, Mapping and Remote Sensing, Wuhan University, Wuhan 430079, China
Remote Sens. 2016, 8(6), 484; https://doi.org/10.3390/rs8060484 - 8 Jun 2016
Cited by 21 | Viewed by 5690
Abstract
Shadows, which are cast by clouds, trees, and buildings, degrade the accuracy of many tasks in remote sensing, such as image classification, change detection, object recognition, etc. In this paper, we address the problem of shadow detection for complex scenes. Unlike traditional [...] Read more.
Shadows, which are cast by clouds, trees, and buildings, degrade the accuracy of many tasks in remote sensing, such as image classification, change detection, object recognition, etc. In this paper, we address the problem of shadow detection for complex scenes. Unlike traditional methods which only use pixel information, our method joins model and observation cues. Firstly, we improve the bright channel prior (BCP) to model and extract the occlusion map in an image. Then, we combine the model-based result with observation cues (i.e., pixel values, luminance, and chromaticity properties) to refine the shadow mask. Our method is suitable for both natural images and satellite images. We evaluate the proposed approach from both qualitative and quantitative aspects on four datasets. The results demonstrate the power of our method. It shows that the proposed method can achieve almost 85% F-measure accuracy both on natural images and remote sensing images, which is much better than the compared state-of-the-art methods. Full article
Show Figures

Graphical abstract

13 pages, 3289 KiB  
Article
An Assessment of HIRS Surface Air Temperature with USCRN Data
by Steve T. Stegall 1,* and Lei Shi 2
1 NOAA’s Cooperative Institute for Climate and Satellites, North Carolina (CICS-NC), NC State University, Asheville, NC 28801, USA
2 NOAA’s National Centers for Environmental Information (NCEI), Asheville, NC 28801, USA
Remote Sens. 2016, 8(6), 485; https://doi.org/10.3390/rs8060485 - 8 Jun 2016
Cited by 1 | Viewed by 3962
Abstract
The surface air temperature retrievals from the High Resolution Infrared Radiation Sounder (HIRS) are evaluated by using observations from the U.S. Climate Reference Network (USCRN) for the period of 2006 to 2013. One year of the USCRN data is also used as ground [...] Read more.
The surface air temperature retrievals from the High Resolution Infrared Radiation Sounder (HIRS) are evaluated by using observations from the U.S. Climate Reference Network (USCRN) for the period of 2006 to 2013. One year of the USCRN data is also used as ground truth in calibrating retrieval biases. The final retrieval results show that mean biases of HIRS retrievals from comparisons to all surface stations for each year are mostly in the range of ±0.2 °C, and the root mean square difference (RMSD) values are 3.2–3.5 °C. Results for biases of individual stations are mostly within ±2 °C. In average, RMSDs are smaller over the eastern U.S. than over the western U.S., smaller at nighttime than at daytime, and smaller at lower elevations. The comparison patterns are consistent from year to year and for different satellites, showing the potential of HIRS data for long-term studies. Full article
(This article belongs to the Special Issue Satellite Climate Data Records and Applications)
Show Figures

Graphical abstract

13 pages, 1853 KiB  
Article
Drivers of Productivity Trends in Cork Oak Woodlands over the Last 15 Years
by Maria João Santos 1,*, Matthias Baumann 2 and Catarina Esgalhado 1
1 Department of Innovation, Environmental and Energy Sciences, Utrecht University, Heidelberglaan 2, 3572TC Utrecht, The Netherlands
2 Geography Department, Humboldt-University Berlin, Unter den Linden 6, 10099 Berlin, Germany
Remote Sens. 2016, 8(6), 486; https://doi.org/10.3390/rs8060486 - 8 Jun 2016
Cited by 12 | Viewed by 6313
Abstract
Higher biodiversity leads to more productive ecosystems which, in turn, supports more biodiversity. Ongoing global changes affect ecosystem productivity and, therefore, are expected to affect productivity-biodiversity relationships. However, the magnitude of these relationships may be affected by baseline biodiversity and its lifeforms. Cork [...] Read more.
Higher biodiversity leads to more productive ecosystems which, in turn, supports more biodiversity. Ongoing global changes affect ecosystem productivity and, therefore, are expected to affect productivity-biodiversity relationships. However, the magnitude of these relationships may be affected by baseline biodiversity and its lifeforms. Cork oak (Quercus suber) woodlands are a highly biodiverse Mediterranean ecosystem managed for cork extraction; as a result of this management cork oak woodlands may have both tree and shrub canopies, just tree and just shrub canopies, and just grasslands. Trees, shrubs, and grasses may respond differently to climatic variables and their combination may, therefore, affect measurements of productivity and the resulting productivity-biodiversity relationships. Here, we asked whether the relationship between productivity and climate is affected by the responses of trees, shrubs, and grasses in cork oak woodlands in Southern Portugal. To answer this question, we linked a 15-year time series of Enhanced Vegetation Index (EVI) derived from Landsat satellites to micrometeorological data to assess the relationship between trends in EVI and climate. Between 2000 and 2013 we observed an overall decrease in EVI. However, EVI increased over cork oaks and decreased over shrublands. EVI trends were strongly positively related to changes in relative humidity and negatively related to temperature. The intra-annual EVI cycle of grasslands and sparse cork oak woodland without understorey (savannah-like ecosystem) had higher variation than the other land-cover types. These results suggest that oaks and shrubs have different responses to changes in water availability, which can be either related to oak physiology, to oaks being either more resilient or having lagged responses to changes in climate, or to the fact that shrublands start senesce earlier than oaks. Our results also suggest that in the future EVI could improve because the rate of increase in minimum EVI is greater than the rate of decrease in maximum EVI, and that this is contingent on management of the shrub understorey as it affects the rate of decrease in maximum EVI. This will be the challenge for the persistence of cork oak woodlands, their associated biodiversity and social-ecological system. Full article
(This article belongs to the Special Issue Remote Sensing of Biodiversity)
Show Figures

Graphical abstract

20 pages, 5802 KiB  
Article
Submerged Kelp Detection with Hyperspectral Data
by Florian Uhl 1,*, Inka Bartsch 2 and Natascha Oppelt 1
1 Department of Geography, Kiel University, Ludewig-Meyn-Str. 14, Kiel 24118, Germany
2 Alfred-Wegener-Institute, Helmholtz Centre for Polar and Marine Research, Am Handelshafen 12, Bremerhaven 27570, Germany
Remote Sens. 2016, 8(6), 487; https://doi.org/10.3390/rs8060487 - 8 Jun 2016
Cited by 35 | Viewed by 12850
Abstract
Submerged marine forests of macroalgae known as kelp are one of the key structures for coastal ecosystems worldwide. These communities are responding to climate driven habitat changes and are therefore appropriate indicators of ecosystem status and health. Hyperspectral remote sensing provides a tool [...] Read more.
Submerged marine forests of macroalgae known as kelp are one of the key structures for coastal ecosystems worldwide. These communities are responding to climate driven habitat changes and are therefore appropriate indicators of ecosystem status and health. Hyperspectral remote sensing provides a tool for a spatial kelp habitat mapping. The difficulty in optical kelp mapping is the retrieval of a significant kelp signal through the water column. Detecting submerged kelp habitats is challenging, in particular in turbid coastal waters. We developed a fully automated simple feature detection processor to detect the presence of kelp in submerged habitats. We compared the performance of this new approach to a common maximum likelihood classification using hyperspectral AisaEAGLE data from the subtidal zones of Helgoland, Germany. The classification results of 13 flight stripes were validated with transect diving mappings. The feature detection showed a higher accuracy till a depth of 6 m (overall accuracy = 80.18%) than the accuracy of a maximum likelihood classification (overall accuracy = 57.66%). The feature detection processor turned out as a time-effective approach to assess and monitor submerged kelp at the limit of water visibility depth. Full article
(This article belongs to the Special Issue Remote Sensing in Coastal Environments)
Show Figures

Graphical abstract

28 pages, 1363 KiB  
Article
Sentinel-2’s Potential for Sub-Pixel Landscape Feature Detection
by Julien Radoux *,†, Guillaume Chomé, Damien Christophe Jacques, François Waldner, Nicolas Bellemans, Nicolas Matton, Céline Lamarche, Raphaël D’Andrimont and Pierre Defourny
1 Earth and Life Institute—Environment, Université catholique de Louvain, Croix du Sud 2, Louvain-la-Neuve 1348, Belgium
These authors contributed equally to this work.
Remote Sens. 2016, 8(6), 488; https://doi.org/10.3390/rs8060488 - 9 Jun 2016
Cited by 159 | Viewed by 19407
Abstract
Land cover and land use maps derived from satellite remote sensing imagery are critical to support biodiversity and conservation, especially over large areas. With its 10 m to 20 m spatial resolution, Sentinel-2 is a promising sensor for the detection of a variety [...] Read more.
Land cover and land use maps derived from satellite remote sensing imagery are critical to support biodiversity and conservation, especially over large areas. With its 10 m to 20 m spatial resolution, Sentinel-2 is a promising sensor for the detection of a variety of landscape features of ecological relevance. However, many components of the ecological network are still smaller than the 10 m pixel, i.e., they are sub-pixel targets that stretch the sensor’s resolution to its limit. This paper proposes a framework to empirically estimate the minimum object size for an accurate detection of a set of structuring landscape foreground/background pairs. The developed method combines a spectral separability analysis and an empirical point spread function estimation for Sentinel-2. The same approach was also applied to Landsat-8 and SPOT-5 (Take 5), which can be considered as similar in terms of spectral definition and spatial resolution, respectively. Results show that Sentinel-2 performs consistently on both aspects. A large number of indices have been tested along with the individual spectral bands and target discrimination was possible in all but one case. Overall, results for Sentinel-2 highlight the critical importance of a good compromise between the spatial and spectral resolution. For instance, the Sentinel-2 roads detection limit was of 3 m and small water bodies are separable with a diameter larger than 11 m. In addition, the analysis of spectral mixtures draws attention to the uneven sensitivity of a variety of spectral indices. The proposed framework could be implemented to assess the fitness for purpose of future sensors within a large range of applications. Full article
Show Figures

Graphical abstract

20 pages, 19711 KiB  
Article
A New Neighboring Pixels Method for Reducing Aerosol Effects on the NDVI Images
by Dandan Wang 1, Yunhao Chen 1,*, Mengjie Wang 1, Jingling Quan 2 and Tao Jiang 1
1 State Key Laboratory of Earth Surface Processes and Resource Ecology, College of Resources Science and Technology, Beijing Normal University, Beijing 100875, China
2 State Key Laboratory of Resources and Environmental Information System, Institute of Geographical Sciences and Natural Resources Research, CAS, Beijing 100101, China
Remote Sens. 2016, 8(6), 489; https://doi.org/10.3390/rs8060489 - 9 Jun 2016
Cited by 4 | Viewed by 6152
Abstract
A new algorithm was developed in this research to minimize aerosol effects on the normalized difference vegetation index (NDVI). Simulation results show that in red-NIR reflectance space, variations in red and NIR channels to aerosol optical depth (AOD) follow a specific pattern. Based [...] Read more.
A new algorithm was developed in this research to minimize aerosol effects on the normalized difference vegetation index (NDVI). Simulation results show that in red-NIR reflectance space, variations in red and NIR channels to aerosol optical depth (AOD) follow a specific pattern. Based on this rational, the apparent reflectance in these two bands of neighboring pixels were used to reduce aerosol effects on NDVI values of the central pixel. We call this method the neighboring pixels (NP) algorithm. Validation was performed over vegetated regions in the border area between China and Russia using Landsat 8 Operational Land Imager (OLI) imagery. Results reveal good agreement between the aerosol corrected NDVI using our algorithm and that derived from the Landsat 8 surface reflectance products. The accuracy is related to the gradient of NDVI variation. This algorithm can achieve high accuracy in homogeneous forest or cropland with the root mean square error (RMSE) being equal to 0.046 and 0.049, respectively. This algorithm can also be applied to atmospheric correction and does not require any information about atmospheric conditions. The use of the moving window analysis technique reduces errors caused by the spatial heterogeneity of aerosols. Detections of regions with homogeneous NDVI are the primary sources of biases. This new method is operational and can prove useful at different aerosol concentration levels. In the future, this approach may also be used to examine other indexes composed of bands attenuated by noises in remote sensing. Full article
Show Figures

Graphical abstract

21 pages, 5127 KiB  
Article
Identification of Woodland Vernal Pools with Seasonal Change PALSAR Data for Habitat Conservation
by Laura L. Bourgeau-Chavez 1,*, Yu Man Lee 2, Michael Battaglia 1, Sarah L. Endres 1, Zachary M. Laubach 1 and Kirk Scarbrough 1
1 Michigan Tech Research Institute, Michigan Technological University, 3600 Green Ct. Suite 100, Ann Arbor, MI 48105, USA
2 Michigan Natural Features Inventory, Michigan State University Extension, P.O. Box 13036, Lansing, MI 48901, USA
Remote Sens. 2016, 8(6), 490; https://doi.org/10.3390/rs8060490 - 10 Jun 2016
Cited by 19 | Viewed by 9836
Abstract
Woodland vernal pools are important, small, cryptic, ephemeral wetland ecosystems that are vulnerable to a changing climate and anthropogenic influences. To conserve woodland vernal pools for the state of Michigan USA, vernal pool detection and mapping methods were sought that would be efficient, [...] Read more.
Woodland vernal pools are important, small, cryptic, ephemeral wetland ecosystems that are vulnerable to a changing climate and anthropogenic influences. To conserve woodland vernal pools for the state of Michigan USA, vernal pool detection and mapping methods were sought that would be efficient, cost-effective, repeatable and accurate. Satellite-based L-band radar data from the high (10 m) resolution Japanese ALOS PALSAR sensor were evaluated for suitability in vernal pool detection beneath forest canopies. In a two phase study, potential vernal pool (PVP) detection was first assessed with unsupervised PALSAR (LHH) two season change detection (spring when flooded—summer when dry) and validated with 268, 1 ha field-sampled test cells. This resulted in low false negatives (14%–22%), overall map accuracy of 48% to 62% and high commission error (66%). These results make this blind two-season PALSAR approach for cryptic PVP detection of use for locating areas of high vernal pool likelihood. In a second phase of the research, PALSAR was integrated with 10 m USGS DEM derivatives in a machine learning classifier, which greatly improved overall PVP map accuracies (91% to 93%). This supervised approach with PALSAR was found to produce better mapping results than using LiDAR intensity or C-band SAR data in a fusion with the USGS DEM-derivatives. Full article
(This article belongs to the Special Issue What can Remote Sensing Do for the Conservation of Wetlands?)
Show Figures

Graphical abstract

20 pages, 2524 KiB  
Article
Vegetation Indices for Mapping Canopy Foliar Nitrogen in a Mixed Temperate Forest
by Zhihui Wang 1,2,*, Tiejun Wang 1, Roshanak Darvishzadeh 1, Andrew K. Skidmore 1, Simon Jones 2, Lola Suarez 2, William Woodgate 2,3,4, Uta Heiden 5, Marco Heurich 6 and John Hearne 2
1 Faculty of Geo-Information Science and Earth Observation (ITC), University of Twente, P.O. Box 217, 7500 AE Enschede, The Netherlands
2 School of Mathematical and Geospatial Sciences, RMIT University, GPO Box 2476, Melbourne, VIC 3001, Australia
3 Cooperative Research Centre for Spatial Information, Carlton, VIC 3053, Australia
4 Oceans and Atmosphere, Commonwealth Scientific and Industrial Research Organisation, Yarralumla, ACT 2600, Australia
5 Department of Land Surface, German Remote Sensing Data Center (DFD), German Aerospace Center (DLR), Oberpfaffenhofen, 82234 Wessling, Germany
6 Bavarian Forest National Park, Freyunger Straße 2, 94481 Grafenau, Germany
Remote Sens. 2016, 8(6), 491; https://doi.org/10.3390/rs8060491 - 10 Jun 2016
Cited by 77 | Viewed by 13489
Abstract
Hyperspectral remote sensing serves as an effective tool for estimating foliar nitrogen using a variety of techniques. Vegetation indices (VIs) are a simple means of retrieving foliar nitrogen. Despite their popularity, few studies have been conducted to examine the utility of VIs for [...] Read more.
Hyperspectral remote sensing serves as an effective tool for estimating foliar nitrogen using a variety of techniques. Vegetation indices (VIs) are a simple means of retrieving foliar nitrogen. Despite their popularity, few studies have been conducted to examine the utility of VIs for mapping canopy foliar nitrogen in a mixed forest context. In this study, we assessed the performance of 32 vegetation indices derived from HySpex airborne hyperspectral images for estimating canopy mass-based foliar nitrogen concentration (%N) in the Bavarian Forest National Park. The partial least squares regression (PLSR) was performed for comparison. These vegetation indices were classified into three categories that are mostly correlated to nitrogen, chlorophyll, and structural properties such as leaf area index (LAI). %N was destructively measured in 26 broadleaf, needle leaf, and mixed stand plots to represent the different species and canopy structure. The canopy foliar %N is defined as the plot-level mean foliar %N of all species weighted by species canopy foliar mass fraction. Our results showed that the variance of canopy foliar %N is mainly explained by functional type and species composition. The normalized difference nitrogen index (NDNI) produced the most accurate estimation of %N (R2CV = 0.79, RMSECV = 0.26). A comparable estimation of %N was obtained by the chlorophyll index Boochs2 (R2CV = 0.76, RMSECV = 0.27). In addition, the mean NIR reflectance (800–850 nm), representing canopy structural properties, also achieved a good accuracy in %N estimation (R2CV = 0.73, RMSECV = 0.30). The PLSR model provided a less accurate estimation of %N (R2CV = 0.69, RMSECV = 0.32). We argue that the good performance of all three categories of vegetation indices in %N estimation can be attributed to the synergy among plant traits (i.e., canopy structure, leaf chemical and optical properties) while these traits may converge across plant species for evolutionary reasons. Our findings demonstrated the feasibility of using hyperspectral vegetation indices to estimate %N in a mixed temperate forest which may relate to the effect of the physical basis of nitrogen absorption features on canopy reflectance, or the biological links between nitrogen, chlorophyll, and canopy structure. Full article
Show Figures

Graphical abstract

15 pages, 1626 KiB  
Article
Comparing Three Approaches of Evapotranspiration Estimation in Mixed Urban Vegetation: Field-Based, Remote Sensing-Based and Observational-Based Methods
by Hamideh Nouri 1,*, Edward P. Glenn 2, Simon Beecham 1, Sattar Chavoshi Boroujeni 1,3, Paul Sutton 1, Sina Alaghmand 1,4, Behnaz Noori 5 and Pamela Nagler 6
1 School of Natural and Built Environments, University of South Australia, Adelaide, SA 5095, Australia
2 Department of Soil, Water and Environmental Science, University of Arizona, Tucson, AZ 85726, USA
3 Soil Conservation and Watershed Management Research Institute of Iran, Tehran 1136-13445, Iran
4 Discipline of Civil Engineering, School of Engineering, Monash University Malaysia, Selangor 47500, Malaysia
5 College of Agriculture and Natural Resources, University of Tehran, Tehran 31587-77871, Iran
6 US Geological Survey, Southwest Biological Science Center, Tucson, AZ 85721, USA
Remote Sens. 2016, 8(6), 492; https://doi.org/10.3390/rs8060492 - 10 Jun 2016
Cited by 51 | Viewed by 12224
Abstract
Despite being the driest inhabited continent, Australia has one of the highest per capita water consumptions in the world. In addition, instead of having fit-for-purpose water supplies (using different qualities of water for different applications), highly treated drinking water is used for nearly [...] Read more.
Despite being the driest inhabited continent, Australia has one of the highest per capita water consumptions in the world. In addition, instead of having fit-for-purpose water supplies (using different qualities of water for different applications), highly treated drinking water is used for nearly all of Australia’s urban water supply needs, including landscape irrigation. The water requirement of urban landscapes, particularly urban parklands, is of growing concern. The estimation of evapotranspiration (ET) and subsequently plant water requirements in urban vegetation needs to consider the heterogeneity of plants, soils, water, and climate characteristics. This research contributes to a broader effort to establish sustainable irrigation practices within the Adelaide Parklands in Adelaide, South Australia. In this paper, two practical ET estimation approaches are compared to a detailed Soil Water Balance (SWB) analysis over a one year period. One approach is the Water Use Classification of Landscape Plants (WUCOLS) method, which is based on expert opinion on the water needs of different classes of landscape plants. The other is a remote sensing approach based on the Enhanced Vegetation Index (EVI) from Moderate Resolution Imaging Spectroradiometer (MODIS) sensors on the Terra satellite. Both methods require knowledge of reference ET calculated from meteorological data. The SWB determined that plants consumed 1084 mm·yr−1 of water in ET with an additional 16% lost to drainage past the root zone, an amount sufficient to keep salts from accumulating in the root zone. ET by MODIS EVI was 1088 mm·yr−1, very close to the SWB estimate, while WUCOLS estimated the total water requirement at only 802 mm·yr−1, 26% lower than the SWB estimate and 37% lower than the amount actually added including the drainage fraction. Individual monthly ET by MODIS was not accurate, but these errors were cancelled out to give good agreement on an annual time step. We conclude that the MODIS EVI method can provide accurate estimates of urban water requirements in mixed landscapes large enough to be sampled by MODIS imagery with 250-m resolution such as parklands and golf courses. Full article
Show Figures

Graphical abstract

17 pages, 3101 KiB  
Article
Analysis of the Qinghai-Xizang Plateau Monsoon Evolution and Its Linkages with Soil Moisture
by Juan Zhou 1,2, Jun Wen 1,*, Xin Wang 1, Dongyu Jia 1,2 and Jinlei Chen 1,2
1 Key Laboratory of Land Surface Process and Climate Change in Cold and Arid Regions, Cold and Arid Regions Environmental and Engineering Research Institute, Chinese Academy of Sciences, Lanzhou 730000, China
2 University of Chinese Academy of Sciences, Beijing 100049, China
Remote Sens. 2016, 8(6), 493; https://doi.org/10.3390/rs8060493 - 10 Jun 2016
Cited by 15 | Viewed by 7717
Abstract
The evolution of plateau monsoons is essential to synoptic climatology processes over the Qinghai-Xizang Plateau. Based on ERA-Interim Reanalysis data covering 1979–2014 from the European Centre for Medium-Range Weather Forecasts (ECMWF), we propose a new plateau monsoon index (ZPMI) that can effectively reflect [...] Read more.
The evolution of plateau monsoons is essential to synoptic climatology processes over the Qinghai-Xizang Plateau. Based on ERA-Interim Reanalysis data covering 1979–2014 from the European Centre for Medium-Range Weather Forecasts (ECMWF), we propose a new plateau monsoon index (ZPMI) that can effectively reflect the evolution of monsoons and compare this new index with the existing Plateau Monsoon Indices (PMI), i.e., the Traditional Plateau Monsoon Index (TPMI), the Dynamic Plateau Monsoon Index (DPMI), and the PMI proposed by Qi et al. (QPMI). The results show that the onset and retreat of plateau monsoons determined by the TPMI are approximately 1–2 months earlier than those of the ZPMI and DPMI and that the ZPMI can better reflect seasonal and inter-annual variations in precipitation over the plateau. The plateau summer and winter monsoons have similar inter-annual and inter-decadal variation characteristics and show a rising trend, but the increasing trend of the summer monsoon is more significant. The ZPMI is also capable of effectively reflecting meteorological elements. In stronger plateau summer monsoon years, more (less) precipitation and a higher (lower) air temperature appear over the eastern and central (western) plateau. The ZPMI and soil moisture in April and May are used to explore the influence of soil moisture on plateau monsoons, and a significant correlation is found between the plateau soil moisture in the spring (April–May) and plateau summer monsoons. It is found that when the soil moisture over the central and eastern plateau is higher (lower) than normal (while the soil moisture over the western plateau is lower (higher)), the plateau summer monsoon may be stronger (weaker). Full article
Show Figures

Graphical abstract

18 pages, 8046 KiB  
Article
Abiotic Controls on Macroscale Variations of Humid Tropical Forest Height
by Yan Yang 1,2, Sassan S. Saatchi 1,3,*, Liang Xu 1, Yifan Yu 3, Michael A. Lefsky 4, Lee White 5, Yuri Knyazikhin 2 and Ranga B. Myneni 2
1 Institute of the Environment and Sustainability, University of California, Los Angeles, CA 90095, USA
2 Earth and Environment, Boston University, Boston, MA 02215, USA
3 Jet Propulsion Laboratory, California Institute of Technology, Pasadena, CA 91109, USA
4 Natural Resource Ecology Laboratory, Colorado State University, Fort Collins, CO 80523, USA
5 Agence National des Parks Nationaux, Battery 4, Libreville B.P. 20379, Gabon
Remote Sens. 2016, 8(6), 494; https://doi.org/10.3390/rs8060494 - 14 Jun 2016
Cited by 14 | Viewed by 6848
Abstract
Spatial variation of tropical forest tree height is a key indicator of ecological processes associated with forest growth and carbon dynamics. Here we examine the macroscale variations of tree height of humid tropical forests across three continents and quantify the climate and edaphic [...] Read more.
Spatial variation of tropical forest tree height is a key indicator of ecological processes associated with forest growth and carbon dynamics. Here we examine the macroscale variations of tree height of humid tropical forests across three continents and quantify the climate and edaphic controls on these variations. Forest tree heights are systematically sampled across global humid tropical forests with more than 2.5 million measurements from Geoscience Laser Altimeter System (GLAS) satellite observations (2004–2008). We used top canopy height (TCH) of GLAS footprints to grid the statistical mean and variance and the 90 percentile height of samples at 0.5 degrees to capture the regional variability of average and large trees globally. We used the spatial regression method (spatial eigenvector mapping-SEVM) to evaluate the contributions of climate, soil and topography in explaining and predicting the regional variations of forest height. Statistical models suggest that climate, soil, topography, and spatial contextual information together can explain more than 60% of the observed forest height variation, while climate and soil jointly explain 30% of the height variations. Soil basics, including physical compositions such as clay and sand contents, chemical properties such as PH values and cation-exchange capacity, as well as biological variables such as the depth of organic matter, all present independent but statistically significant relationships to forest height across three continents. We found significant relations between the precipitation and tree height with shorter trees on the average in areas of higher annual water stress, and large trees occurring in areas with low stress and higher annual precipitation but with significant differences across the continents. Our results confirm other landscape and regional studies by showing that soil fertility, topography and climate may jointly control a significant variation of forest height and influencing patterns of aboveground biomass stocks and dynamics. Other factors such as biotic and disturbance regimes, not included in this study, may have less influence on regional variations but strongly mediate landscape and small-scale forest structure and dynamics. Full article
(This article belongs to the Special Issue Remote Sensing of Vegetation Structure and Dynamics)
Show Figures

Graphical abstract

23 pages, 7240 KiB  
Article
Detecting Different Types of Directional Land Cover Changes Using MODIS NDVI Time Series Dataset
by Lili Xu 1,2, Baolin Li 1,3,*, Yecheng Yuan 1, Xizhang Gao 1, Tao Zhang 1,2 and Qingling Sun 1,2
1 State Key Lab of Resources and Environmental Information System, Institute of Geographic Sciences and Natural Resources Research, Chinese Academy of Sciences, Beijing 100101, China
2 University of Chinese Academy of Sciences, Beijing 100049, China
3 Jiangsu Center for Collaborative Innovation in Geographical Information Resource Development and Application, Nanjing 210023, China
Remote Sens. 2016, 8(6), 495; https://doi.org/10.3390/rs8060495 - 14 Jun 2016
Cited by 41 | Viewed by 8223
Abstract
This study proposed a multi-target hierarchical detection (MTHD) method to simultaneously and automatically detect multiple directional land cover changes. MTHD used a hierarchical strategy to detect both abrupt and trend land cover changes successively. First, Grubbs’ test eliminated short-lived changes by considering them [...] Read more.
This study proposed a multi-target hierarchical detection (MTHD) method to simultaneously and automatically detect multiple directional land cover changes. MTHD used a hierarchical strategy to detect both abrupt and trend land cover changes successively. First, Grubbs’ test eliminated short-lived changes by considering them outliers. Then, the Brown-Forsythe test and the combination of Tomé’s method and the Chow test were applied to determine abrupt changes. Finally, Sen’s slope estimation coordinated with the Mann-Kendall test detection method was used to detect trend changes. Results demonstrated that both abrupt and trend land cover changes could be detected accurately and automatically. The overall accuracy of abrupt land cover changes was 87.0% and the kappa index was 0.74. Detected trends of land cover change indicated high consistency between NDVI (Normalized Difference Vegetation Index), change trends from LTS (Landsat Thematic Mapper and Enhanced Thematic Mapper Plus time series dataset), and MODIS (Moderate Resolution Imaging Spectroradiometer) time series datasets with the percentage of samples indicating consistency of 100%. For cropland, trends of millet yield per unit and average NDVI of cropland indicated high consistency with a linear regression determination coefficient of 0.94 (p < 0.01). Compared with other multi-target change detection methods, the changes detected by the MTHD could be related closely with specific ecosystem changes, reducing the risk of false changes in the area with frequent and strong interannual fluctuations. Full article
(This article belongs to the Special Issue Monitoring of Land Changes)
Show Figures

Graphical abstract

22 pages, 8661 KiB  
Article
A Comparative Study of Urban Expansion in Beijing, Tianjin and Tangshan from the 1970s to 2013
by Zengxiang Zhang 1, Na Li 1,2,*, Xiao Wang 1, Fang Liu 1 and Linping Yang 1
1 Institute of Remote Sensing and Digital Earth, Chinese Academy of Sciences, Beijing 100101, China
2 University of Chinese Academy of Sciences, Beijing 100049, China
Remote Sens. 2016, 8(6), 496; https://doi.org/10.3390/rs8060496 - 14 Jun 2016
Cited by 77 | Viewed by 10146
Abstract
Although the mapping of spatiotemporal patterns of urban expansion has been widely studied, relatively little attention has been paid to detailed comparative studies on spatiotemporal patterns of urban growth at the regional level over a relatively longer timeframe. This paper was based on [...] Read more.
Although the mapping of spatiotemporal patterns of urban expansion has been widely studied, relatively little attention has been paid to detailed comparative studies on spatiotemporal patterns of urban growth at the regional level over a relatively longer timeframe. This paper was based on multi-sensor remote sensing image data and employs several landscape metrics and the centroid shift model to conduct a multi-angle quantitative analysis on urban expansion in Beijing, Tianjin and Tangshan (Jing-Jin-Tang) in the period from 1970–2013. In addition, the impact analysis of urban growth on land use was adopted in this research. The results showed that Beijing, Tianjin and Tangshan all experienced rapid urbanization, with an average annual urban growth rate of 7.28%, 3.9%, and 0.97%, respectively. Beijing has especially presented a single choropleth map pattern, whereas Tianjin and Tangshan have presented a double surface network pattern in orientation analysis. Furthermore, urban expansion in Beijing was mainly concentrated in Ring 4 to Ring 6 in the northwest and southeast directions, whereas the major expansion was observed in the southeast in Tianjin, primarily affected by dramatic development of Binhai New Area and Tianjin South Railway Station. Naturally, the urban expansion in Tangshan was significantly influenced by the expansion of Beijing and was primarily southwestward. The hot-zones of urbanization were observed within the ranges of 7–25 km, 6–18 km, and 0–15 km, accounting for 93.49%, 89.44% and 72.44% of the total expansion area in Beijing, Tianjin and Tangshan, respectively. The majority of the newly developed urban land was converted from cultivated land and integrated from other built-up land over the past four decades. Of all new urban land in the Beijing, Tianjin and Tangshan, more than 50% was converted from cultivated land, and there was a general tendency for smaller cities to have higher percentages of converted land, accounting for 50.84%, 51.19%, and 51.58%, respectively. The study revealed significant details of the temporal and spatial distributions of urban expansion in Beijing, Tianjin and Tangshan and provided scientific support for the collaborative development of the Beijing, Tianjin and Hebei (Jing-Jin-Ji) regions. Full article
(This article belongs to the Special Issue Monitoring of Land Changes)
Show Figures

Graphical abstract

15 pages, 3235 KiB  
Article
Remote Sensing of Black Lakes and Using 810 nm Reflectance Peak for Retrieving Water Quality Parameters of Optically Complex Waters
by Tiit Kutser 1,2,*, Birgot Paavel 1, Charles Verpoorter 2,3, Martin Ligi 4, Tuuli Soomets 1, Kaire Toming 1 and Gema Casal 1
1 Estonian Marine Institute, University of Tartu, Mäealuse 14, 12618 Tallinn, Estonia
2 Evolutionary Biology Centre, Limnology, University of Uppsala, Norbyvägen 18D, 75236 Uppsala, Sweden
3 Laboratoire d’Oceanologie et des Geosciences, Universite de Lille Nord de France, ULCO, 32 Avenue Foch, 62930 Wimereux, France
4 Tartu Observatory, 61602 Tõravere, Tartumaa, Estonia
Remote Sens. 2016, 8(6), 497; https://doi.org/10.3390/rs8060497 - 14 Jun 2016
Cited by 170 | Viewed by 13821
Abstract
Many lakes in boreal and arctic regions have high concentrations of CDOM (coloured dissolved organic matter). Remote sensing of such lakes is complicated due to very low water leaving signals. There are extreme (black) lakes where the water reflectance values are negligible in [...] Read more.
Many lakes in boreal and arctic regions have high concentrations of CDOM (coloured dissolved organic matter). Remote sensing of such lakes is complicated due to very low water leaving signals. There are extreme (black) lakes where the water reflectance values are negligible in almost entire visible part of spectrum (400–700 nm) due to the absorption by CDOM. In these lakes, the only water-leaving signal detectable by remote sensing sensors occurs as two peaks—near 710 nm and 810 nm. The first peak has been widely used in remote sensing of eutrophic waters for more than two decades. We show on the example of field radiometry data collected in Estonian and Swedish lakes that the height of the 810 nm peak can also be used in retrieving water constituents from remote sensing data. This is important especially in black lakes where the height of the 710 nm peak is still affected by CDOM. We have shown that the 810 nm peak can be used also in remote sensing of a wide variety of lakes. The 810 nm peak is caused by combined effect of slight decrease in absorption by water molecules and backscattering from particulate material in the water. Phytoplankton was the dominant particulate material in most of the studied lakes. Therefore, the height of the 810 peak was in good correlation with all proxies of phytoplankton biomass—chlorophyll-a (R2 = 0.77), total suspended matter (R2 = 0.70), and suspended particulate organic matter (R2 = 0.68). There was no correlation between the peak height and the suspended particulate inorganic matter. Satellite sensors with sufficient spatial and radiometric resolution for mapping lake water quality (Landsat 8 OLI and Sentinel-2 MSI) were launched recently. In order to test whether these satellites can capture the 810 nm peak we simulated the spectral performance of these two satellites from field radiometry data. Actual satellite imagery from a black lake was also used to study whether these sensors can detect the peak despite their band configuration. Sentinel 2 MSI has a nearly perfectly positioned band at 705 nm to characterize the 700–720 nm peak. We found that the MSI 783 nm band can be used to detect the 810 nm peak despite the location of this band is not in perfect to capture the peak. Full article
(This article belongs to the Special Issue Water Optics and Water Colour Remote Sensing)
Show Figures

Graphical abstract

15 pages, 4654 KiB  
Article
Wake Component Detection in X-Band SAR Images for Ship Heading and Velocity Estimation
by Maria Daniela Graziano 1,*, Marco D’Errico 2 and Giancarlo Rufino 1
1 Department of Industrial Engineering, University of Naples “Federico II”, Piazzale Tecchio, 80, 80125 Naples, Italy
2 Department of Industrial and Information Engineering, Second University of Naples, via Roma, 29, 81031 Aversa, Italy
Remote Sens. 2016, 8(6), 498; https://doi.org/10.3390/rs8060498 - 14 Jun 2016
Cited by 65 | Viewed by 7263
Abstract
A new algorithm for ship wake detection is developed with the aim of ship heading and velocity estimation. It exploits the Radon transform and utilizes merit indexes in the intensity domain to validate the detected linear features as real components of the ship [...] Read more.
A new algorithm for ship wake detection is developed with the aim of ship heading and velocity estimation. It exploits the Radon transform and utilizes merit indexes in the intensity domain to validate the detected linear features as real components of the ship wake. Finally, ship velocity is estimated by state-of-the-art techniques of azimuth shift and Kelvin arm wavelength. The algorithm is applied to 13 X-band SAR images from the TerraSAR-X and COSMO/SkyMed missions with different polarization and incidence angles. Results show that the vast majority of wake features are correctly detected and validated also in critical situations, i.e., when multiple wake appearances or dark areas not related to wake features are imaged. The ship route estimations are validated with truth-at-sea in seven cases. Finally, it is also verified that the algorithm does not detect wakes in the surroundings of 10 ships without wake appearances. Full article
Show Figures

Graphical abstract

20 pages, 2282 KiB  
Article
Reference Information Based Remote Sensing Image Reconstruction with Generalized Nonconvex Low-Rank Approximation
by Hongyang Lu 1,2, Jingbo Wei 2,3, Lizhe Wang 3,4,*, Peng Liu 3, Qiegen Liu 1, Yuhao Wang 1 and Xiaohua Deng 1,2
1 Department of Electronic Information Engineering, Nanchang University, Nanchang 330031, China
2 Institute of Space Science and Technology, Nanchang University, Nanchang 330031, China
3 Institute of Remote Sensing and Digital Earth, Chinese Academy of Sciences, Beijing 100094, China
4 School of Computer Science, China University of Geosciences, Wuhan 430074, China
Remote Sens. 2016, 8(6), 499; https://doi.org/10.3390/rs8060499 - 14 Jun 2016
Cited by 22 | Viewed by 5654
Abstract
Because of the contradiction between the spatial and temporal resolution of remote sensing images (RSI) and quality loss in the process of acquisition, it is of great significance to reconstruct RSI in remote sensing applications. Recent studies have demonstrated that reference image-based reconstruction [...] Read more.
Because of the contradiction between the spatial and temporal resolution of remote sensing images (RSI) and quality loss in the process of acquisition, it is of great significance to reconstruct RSI in remote sensing applications. Recent studies have demonstrated that reference image-based reconstruction methods have great potential for higher reconstruction performance, while lacking accuracy and quality of reconstruction. For this application, a new compressed sensing objective function incorporating a reference image as prior information is developed. We resort to the reference prior information inherent in interior and exterior data simultaneously to build a new generalized nonconvex low-rank approximation framework for RSI reconstruction. Specifically, the innovation of this paper consists of the following three respects: (1) we propose a nonconvex low-rank approximation for reconstructing RSI; (2) we inject reference prior information to overcome over smoothed edges and texture detail losses; (3) on this basis, we combine conjugate gradient algorithms and a single-value threshold (SVT) simultaneously to solve the proposed algorithm. The performance of the algorithm is evaluated both qualitatively and quantitatively. Experimental results demonstrate that the proposed algorithm improves several dBs in terms of peak signal to noise ratio (PSNR) and preserves image details significantly compared to most of the current approaches without reference images as priors. In addition, the generalized nonconvex low-rank approximation of our approach is naturally robust to noise, and therefore, the proposed algorithm can handle low resolution with noisy inputs in a more unified framework. Full article
Show Figures

Graphical abstract

18 pages, 13931 KiB  
Article
Mapping Crop Planting Quality in Sugarcane from UAV Imagery: A Pilot Study in Nicaragua
by Inti Luna 1,* and Agustín Lobo 2
1 Evolo Company, Reparto San Juan 142-A, Managua, Nicaragua
2 Instituto de Ciencias de la Tierra “Jaume Almera” (CSIC), Lluis Solé Sabarís s/n, 08028 Barcelona, Spain
Remote Sens. 2016, 8(6), 500; https://doi.org/10.3390/rs8060500 - 14 Jun 2016
Cited by 63 | Viewed by 13080
Abstract
Sugarcane is an important economic resource for many tropical countries and optimizing plantations is a serious concern with economic and environmental benefits. One of the best ways to optimize the use of resources in those plantations is to minimize the occurrence of gaps. [...] Read more.
Sugarcane is an important economic resource for many tropical countries and optimizing plantations is a serious concern with economic and environmental benefits. One of the best ways to optimize the use of resources in those plantations is to minimize the occurrence of gaps. Typically, gaps open in the crop canopy because of damaged rhizomes, unsuccessful sprouting or death young stalks. In order to avoid severe yield decrease, farmers need to fill the gaps with new plants. Mapping gap density is therefore critical to evaluate crop planting quality and guide replanting. Current field practices of linear gap evaluation are very labor intensive and cannot be performed with sufficient intensity as to provide detailed spatial information for mapping, which makes replanting difficult to perform. Others have used sensors carried by land vehicles to detect gaps, but these are complex and require circulating over the entire area. We present a method based on processing digital mosaics of conventional images acquired from a small Unmanned Aerial Vehicle (UAV) that produced a map of gaps at 23.5 cm resolution in a study area of 8.7 ha with 92.9% overall accuracy. Linear Gap percentage estimated from this map for a grid with cells of 10 m × 10 m linearly correlates with photo-interpreted linear gap percentage with a coefficient of determination (R2)= 0.9; a root mean square error (RMSE) = 5.04; and probability (p) << 0.01. Crop Planting Quality levels calculated from image-derived gaps agree with those calculated from a photo-interpreted version of currently used field methods (Spearman coefficient = 0.92). These results clearly demonstrate the effectiveness of processing mosaics of Unmanned Aerial System (UAS) images for mapping gap density and, together with previous studies using satellite and hand-held spectroradiometry, suggests the extension towards multi-spectral imagery to add insight on plant condition. Full article
Show Figures

Graphical abstract

22 pages, 4589 KiB  
Article
An Easy-to-Use Airborne LiDAR Data Filtering Method Based on Cloth Simulation
by Wuming Zhang 1, Jianbo Qi 1,*, Peng Wan 1, Hongtao Wang 2, Donghui Xie 1, Xiaoyan Wang 1 and Guangjian Yan 1
1 State Key Laboratory of Remote Sensing Science, Beijing Key Laboratory of Environmental Remote Sensing and Digital City, School of Geography, Beijing Normal University, Beijing 100875, China
2 School of Surveying and Land Information Engineering, Henan Polytechnic University, Jiaozuo 454003, China
Remote Sens. 2016, 8(6), 501; https://doi.org/10.3390/rs8060501 - 15 Jun 2016
Cited by 1247 | Viewed by 57108
Abstract
Separating point clouds into ground and non-ground measurements is an essential step to generate digital terrain models (DTMs) from airborne LiDAR (light detection and ranging) data. However, most filtering algorithms need to carefully set up a number of complicated parameters to achieve high [...] Read more.
Separating point clouds into ground and non-ground measurements is an essential step to generate digital terrain models (DTMs) from airborne LiDAR (light detection and ranging) data. However, most filtering algorithms need to carefully set up a number of complicated parameters to achieve high accuracy. In this paper, we present a new filtering method which only needs a few easy-to-set integer and Boolean parameters. Within the proposed approach, a LiDAR point cloud is inverted, and then a rigid cloth is used to cover the inverted surface. By analyzing the interactions between the cloth nodes and the corresponding LiDAR points, the locations of the cloth nodes can be determined to generate an approximation of the ground surface. Finally, the ground points can be extracted from the LiDAR point cloud by comparing the original LiDAR points and the generated surface. Benchmark datasets provided by ISPRS (International Society for Photogrammetry and Remote Sensing) working Group III/3 are used to validate the proposed filtering method, and the experimental results yield an average total error of 4.58%, which is comparable with most of the state-of-the-art filtering algorithms. The proposed easy-to-use filtering method may help the users without much experience to use LiDAR data and related technology in their own applications more easily. Full article
(This article belongs to the Special Issue Airborne Laser Scanning)
Show Figures

Graphical abstract

16 pages, 1604 KiB  
Article
Synergistic Use of Citizen Science and Remote Sensing for Continental-Scale Measurements of Forest Tree Phenology
by Andrew J. Elmore *, Cathlyn D. Stylinski and Kavya Pradhan
Appalachian Laboratory, University of Maryland Center for Environmental Science, Frostburg, MD 21532, USA
Remote Sens. 2016, 8(6), 502; https://doi.org/10.3390/rs8060502 - 14 Jun 2016
Cited by 32 | Viewed by 8216
Abstract
There is great potential value in linking geographically dispersed multitemporal observations collected by lay volunteers (or “citizen scientists”) with remotely-sensed observations of plant phenology, which are recognized as useful indicators of climate change. However, challenges include a large mismatch in spatial scale and [...] Read more.
There is great potential value in linking geographically dispersed multitemporal observations collected by lay volunteers (or “citizen scientists”) with remotely-sensed observations of plant phenology, which are recognized as useful indicators of climate change. However, challenges include a large mismatch in spatial scale and diverse sources of uncertainty in the two measurement types. These challenges must be overcome if the data from each source are to be compared and jointly used to understand spatial and temporal variation in phenology, or if remote observations are to be used to predict ground-based observations. We investigated the correlation between land surface phenology derived from Moderate Resolution Imaging Spectrometer (MODIS) data and citizen scientists’ phenology observations from the USA National Phenology Network (NPN). The volunteer observations spanned 2004 to 2013 and represented 25 plant species and nine phenophases. We developed quality control procedures that removed observations outside of an a priori determined acceptable period and observations that were made more than 10 days after a preceding observation. We found that these two quality control steps improved the correlation between ground- and remote-observations, but the largest improvement was achieved when the analysis was restricted to forested MODIS pixels. These results demonstrate a high degree of correlation between the phenology of individual trees (particularly dominant forest trees such as quaking aspen, white oak, and American beech) and the phenology of the surrounding forested landscape. These results provide helpful guidelines for the joint use of citizen scientists’ observations and remote sensing phenology in work aimed at understanding continental scale variation and temporal trends. Full article
(This article belongs to the Special Issue Citizen Science and Earth Observation)
Show Figures

Graphical abstract

20 pages, 1714 KiB  
Article
Improving Streamflow Prediction Using Remotely-Sensed Soil Moisture and Snow Depth
by Haishen Lü 1,2,*, Wade T. Crow 2, Yonghua Zhu 1, Fen Ouyang 1 and Jianbin Su 1
1 State Key Laboratory of Hydrology-Water Resources and Hydraulic Engineering, College of Hydrology and Water Resources, Hohai University, Nanjing 210098, China
2 USDA Hydrology and Remote Sensing Laboratory, Beltsville, MD 20705-2350, USA
Remote Sens. 2016, 8(6), 503; https://doi.org/10.3390/rs8060503 - 15 Jun 2016
Cited by 16 | Viewed by 6453
Abstract
The monitoring of both cold and warm season hydrologic processes in headwater watersheds is critical for accurate water resource monitoring in many alpine regions. This work presents a new method that explores the simultaneous use of remotely sensed surface soil moisture (SM) and [...] Read more.
The monitoring of both cold and warm season hydrologic processes in headwater watersheds is critical for accurate water resource monitoring in many alpine regions. This work presents a new method that explores the simultaneous use of remotely sensed surface soil moisture (SM) and snow depth (SD) retrievals to improve hydrological modeling in such areas. In particular, remotely sensed SM and SD retrievals are applied to filter errors present in both solid and liquid phase precipitation accumulation products acquired from satellite remote sensing. Simultaneously, SM and SD retrievals are also used to correct antecedent SM and SD states within a hydrological model. In synthetic data assimilation experiments, results suggest that the simultaneous correction of both precipitation forcing and SM/SD antecedent conditions is more efficient at improving streamflow simulation than data assimilation techniques which focus solely on the constraint of antecedent SM or SD conditions. In a real assimilation case, results demonstrate the potential benefits of remotely sensed SM and SD retrievals for improving the representation of hydrological processes in a headwater basin. In particular, it is demonstrated that dual precipitation/state correction represents an efficient strategy for improving the simulation of cold-region hydrological processes. Full article
Show Figures

Graphical abstract

24 pages, 6051 KiB  
Article
Estimation of Daily Solar Radiation Budget at Kilometer Resolution over the Tibetan Plateau by Integrating MODIS Data Products and a DEM
by Laure Roupioz 1,*, Li Jia 2, Françoise Nerry 1 and Massimo Menenti 2,3
1 ICube Laboratory, UMR 7357 CNRS-University of Strasbourg, F-67412 Illkirch Cedex, France
2 State Key Laboratory of Remote Sensing Science, Institute of Remote Sensing and Digital Earth, Chinese Academy of Sciences, Beijing 100101, China
3 Delft University of Technology, 2628 CN Delft, The Netherlands
Remote Sens. 2016, 8(6), 504; https://doi.org/10.3390/rs8060504 - 16 Jun 2016
Cited by 27 | Viewed by 8327
Abstract
Considering large and complex areas like the Tibetan Plateau, an analysis of the spatial distribution of the solar radiative budget over time not only requires the use of satellite remote sensing data, but also of an algorithm that accounts for strong variations of [...] Read more.
Considering large and complex areas like the Tibetan Plateau, an analysis of the spatial distribution of the solar radiative budget over time not only requires the use of satellite remote sensing data, but also of an algorithm that accounts for strong variations of topography. Therefore, this research aims at developing a method to produce time series of solar radiative fluxes at high temporal and spatial resolution based on observed surface and atmosphere properties and topography. The objective is to account for the heterogeneity of the land surface using multiple land surface and atmospheric MODIS data products combined with a digital elevation model to produce estimations daily at the kilometric level. The developed approach led to the production of a three-year time series (2008–2010) of daily solar radiation budget at one kilometer spatial resolution across the Tibetan Plateau. The validation showed that the main improvement from the proposed method is a higher spatial and temporal resolution as compared to existing products. However, even if the solar radiation estimates are satisfying on clear sky conditions, the algorithm is less reliable under cloudy sky condition and the albedo product used here has a too coarse temporal resolution and is not accurate enough over rugged terrain. Full article
Show Figures

Graphical abstract

18 pages, 3873 KiB  
Article
Estimating Snow Water Equivalent with Backscattering at X and Ku Band Based on Absorption Loss
by Yurong Cui 1, Chuan Xiong 1,*, Juha Lemmetyinen 2, Jiancheng Shi 1, Lingmei Jiang 3, Bin Peng 1, Huixuan Li 4, Tianjie Zhao 1, Dabin Ji 1 and Tongxi Hu 1
1 State Key Laboratory of Remote Sensing Science, Institute of Remote Sensing and Digital Earth, Chinese Academy of Sciences, Beijing 100101, China
2 Finnish Meteorological Institute, P.O. Box 503, Helsinki Fin-00101, Finland
3 State Key Laboratory of Remote Sensing Science, Beijing Normal University, Beijing 100875, China
4 Department of Geography, University of South Carolina, Callcott Building 709 Bull Street, Columbia, SC 29208, USA
Remote Sens. 2016, 8(6), 505; https://doi.org/10.3390/rs8060505 - 16 Jun 2016
Cited by 47 | Viewed by 8171
Abstract
Snow water equivalent (SWE) is a key parameter in the Earth’s energy budget and water cycle. It has been demonstrated that SWE can be retrieved using active microwave remote sensing from space. This necessitates the development of forward models that are capable of [...] Read more.
Snow water equivalent (SWE) is a key parameter in the Earth’s energy budget and water cycle. It has been demonstrated that SWE can be retrieved using active microwave remote sensing from space. This necessitates the development of forward models that are capable of simulating the interactions of microwaves and the snow medium. Several proposed models have described snow as a collection of sphere- or ellipsoid-shaped ice particles embedded in air, while the microstructure of snow is, in reality, more complex. Natural snow usually forms a sintered structure following mechanical and thermal metamorphism processes. In this research, the bi-continuous vector radiative transfer (bi-continuous-VRT) model, which firstly constructs snow microstructure more similar to real snow and then simulates the snow backscattering signal, is used as the forward model for SWE estimation. Based on this forward model, a parameterization scheme of snow volume backscattering is proposed. A relationship between snow optical thickness and single scattering albedo at X and Ku bands is established by analyzing the database generated from the bi-continuous-VRT model. A cost function with constraints is used to solve effective albedo and optical thickness, while the absorption part of optical thickness is obtained from these two parameters. SWE is estimated after a correction for physical temperature. The estimated SWE is correlated with the measured SWE with an acceptable accuracy. Validation against two-year measurements, using the SnowScat instrument from the Nordic Snow Radar Experiment (NoSREx), shows that the estimated SWE using the presented algorithm has a root mean square error (RMSE) of 16.59 mm for the winter of 2009–2010 and 19.70 mm for the winter of 2010–2011. Full article
Show Figures

Graphical abstract

22 pages, 2864 KiB  
Article
Learning a Transferable Change Rule from a Recurrent Neural Network for Land Cover Change Detection
by Haobo Lyu 1,†, Hui Lu 1,2,* and Lichao Mou 3,4,†
1 The Ministry of Education Key Laboratory for Earth System Modeling, Center for Earth System Science, Tsinghua University, Beijing 100084, China
2 The Joint Center for Global Change Studies, Beijing 100875, China
3 Remote Sensing Technology Institute (IMF), German Aerospace Center (DLR), Wessling 82234, Germany
4 Signal Processing in Earth Observation (SiPEO), Technical University of Munich (TUM), Munich 80333, Germany
These authors contributed equally to this work.
Remote Sens. 2016, 8(6), 506; https://doi.org/10.3390/rs8060506 - 16 Jun 2016
Cited by 299 | Viewed by 18502
Abstract
When exploited in remote sensing analysis, a reliable change rule with transfer ability can detect changes accurately and be applied widely. However, in practice, the complexity of land cover changes makes it difficult to use only one change rule or change feature learned [...] Read more.
When exploited in remote sensing analysis, a reliable change rule with transfer ability can detect changes accurately and be applied widely. However, in practice, the complexity of land cover changes makes it difficult to use only one change rule or change feature learned from a given multi-temporal dataset to detect any other new target images without applying other learning processes. In this study, we consider the design of an efficient change rule having transferability to detect both binary and multi-class changes. The proposed method relies on an improved Long Short-Term Memory (LSTM) model to acquire and record the change information of long-term sequence remote sensing data. In particular, a core memory cell is utilized to learn the change rule from the information concerning binary changes or multi-class changes. Three gates are utilized to control the input, output and update of the LSTM model for optimization. In addition, the learned rule can be applied to detect changes and transfer the change rule from one learned image to another new target multi-temporal image. In this study, binary experiments, transfer experiments and multi-class change experiments are exploited to demonstrate the superiority of our method. Three contributions of this work can be summarized as follows: (1) the proposed method can learn an effective change rule to provide reliable change information for multi-temporal images; (2) the learned change rule has good transferability for detecting changes in new target images without any extra learning process, and the new target images should have a multi-spectral distribution similar to that of the training images; and (3) to the authors’ best knowledge, this is the first time that deep learning in recurrent neural networks is exploited for change detection. In addition, under the framework of the proposed method, changes can be detected under both binary detection and multi-class change detection. Full article
(This article belongs to the Special Issue Monitoring of Land Changes)
Show Figures

Graphical abstract

17 pages, 12992 KiB  
Article
Transformation Model with Constraints for High-Accuracy of 2D-3D Building Registration in Aerial Imagery
by Guoqing Zhou 1,2,*, Qingli Luo 2, Wenhan Xie 3, Tao Yue 1, Jingjin Huang 2,4 and Yuzhong Shen 5
1 Guangxi Key Laboratory for Geospatial Informatics, Guilin University of Technology, Guilin 541004, China
2 The Center for Remote Sensing, Tianjin University, No. 92, Weijin Road, Nankai District, Tianjin 300072, China
3 Chinese Academy of Surveying and Mapping, 28 Lianhuachi West Road, Beijing 100830, China
4 School of Precision Instrument and Opto-Electronics Engineering, Tianjin University, No. 92, Weijin Road, Nankai District, Tianjin 300072, China
5 Department of Modeling, Simulation, and Visualization Engineering, Old Dominion University, Norfolk, VA 23529, USA
Remote Sens. 2016, 8(6), 507; https://doi.org/10.3390/rs8060507 - 16 Jun 2016
Cited by 4 | Viewed by 5944
Abstract
This paper proposes a novel rigorous transformation model for 2D-3D registration to address the difficult problem of obtaining a sufficient number of well-distributed ground control points (GCPs) in urban areas with tall buildings. The proposed model applies two types of geometric constraints, co-planarity [...] Read more.
This paper proposes a novel rigorous transformation model for 2D-3D registration to address the difficult problem of obtaining a sufficient number of well-distributed ground control points (GCPs) in urban areas with tall buildings. The proposed model applies two types of geometric constraints, co-planarity and perpendicularity, to the conventional photogrammetric collinearity model. Both types of geometric information are directly obtained from geometric building structures, with which the geometric constraints are automatically created and combined into the conventional transformation model. A test field located in downtown Denver, Colorado, is used to evaluate the accuracy and reliability of the proposed method. The comparison analysis of the accuracy achieved by the proposed method and the conventional method is conducted. Experimental results demonstrated that: (1) the theoretical accuracy of the solved registration parameters can reach 0.47 pixels, whereas the other methods reach only 1.23 and 1.09 pixels; (2) the RMS values of 2D-3D registration achieved by the proposed model are only two pixels along the x and y directions, much smaller than the RMS values of the conventional model, which are approximately 10 pixels along the x and y directions. These results demonstrate that the proposed method is able to significantly improve the accuracy of 2D-3D registration with much fewer GCPs in urban areas with tall buildings. Full article
Show Figures

Graphical abstract

16 pages, 4407 KiB  
Article
Time Series MODIS and in Situ Data Analysis for Mongolia Drought
by Munkhzul Dorjsuren 1,2,3, Yuei-An Liou 1,2,4,* and Chi-Han Cheng 4,5
1 Graduate Institute of Space Science, National Central University, Jhongli District, Taoyuan City 320, Taiwan
2 Center for Space and Remote Sensing Research, National Central University, Jhongli District, Taoyuan City 320, Taiwan
3 Information and Research Institute of Meteorology, Hydrology and Environment, Ulaanbaatar 15160, Mongolia
4 Taiwan Group on Earth Observation, Zhubei City 30274, Hsinchu County, Taiwan
5 Applied Hydrometeorological Research Institute, Nanjing University of Information Science & Technology, Nanjing 210044, China
Remote Sens. 2016, 8(6), 509; https://doi.org/10.3390/rs8060509 - 16 Jun 2016
Cited by 45 | Viewed by 10178
Abstract
Drought is a period of abnormally dry weather with a serious shortage of water supply. Drought indices can be an advantageous indicator to assess drought for taking further response actions. However, drought indices based on ground meteorological measurements could not completely reveal the [...] Read more.
Drought is a period of abnormally dry weather with a serious shortage of water supply. Drought indices can be an advantageous indicator to assess drought for taking further response actions. However, drought indices based on ground meteorological measurements could not completely reveal the land use effects over a regional scale. On the other hand, the satellite-derived products provide consistent, spatial and temporal comparisons of global signatures for the regional-scale drought events. This research is to investigate the drought signatures over Mongolia by using satellite remote sensing imagery. The evapotranspiration (ET), potential evapotranspiration (PET) and two-band Enhanced Vegetation Index (EVI2) were extracted from MODIS data. Based on the standardized ratio of ET to PET (ET/PET) and EVI2, the Modified Drought Severity Index (MDSI) anomaly during the growing season from May–August for the years 2000–2013 was acquired. Fourteen-year summer monthly data for air temperature, precipitation and soil moisture content of in situ measurements from sixteen meteorological stations for four various land use areas were analyzed. We also calculated the percentage deviation of climatological variables at the sixteen stations to compare to the MDSI anomaly. Both comparisons of satellite-derived and observed anomalies and variations were analyzed by using the existing common statistical methods. The results demonstrated that the air temperature anomaly (T anomaly) and the precipitation anomaly (P anomaly) were negatively (correlation coefficient r = −0.66) and positively (r = 0.81) correlated with the MDSI anomaly, respectively. The MDSI anomaly distributions revealed that the wettest area occupied 57% of the study area in 2003, while the driest (drought) area occurred over 54% of the total area in 2007. The results also showed very similar variations between the MDSI and T anomalies. The highest (wettest) MDSI anomaly indicated the lowest T anomaly, such as in the year 2003, while the lowest (driest) MDSI anomaly had the highest T anomaly in 2007. By comparing the MDSI anomaly and soil moisture content at a 10-cm depth during the study period, it is found that their correlation coefficient is 0.74. Full article
(This article belongs to the Special Issue Earth Observations for a Better Future Earth)
Show Figures

Graphical abstract

18 pages, 1670 KiB  
Article
Using the NASA EOS A-Train to Probe the Performance of the NOAA PATMOS-x Cloud Fraction CDR
by Andrew Heidinger 1,*, Michael Foster 2,†, Denis Botambekov 2,†, Michael Hiley 2,†, Andi Walther 2,† and Yue Li 2,†
1 NOAA NESDIS Center for Satellite Applications and Research, Madison, WI 53706, USA
2 Space Science and Engineering Center (SSEC), University of Wisconsin, Madison, WI 53706, USA
These authors contributed equally to this work.
Remote Sens. 2016, 8(6), 511; https://doi.org/10.3390/rs8060511 - 18 Jun 2016
Cited by 19 | Viewed by 7229
Abstract
An important component of the AVHRR PATMOS-x climate date record (CDR)—or any satellite cloud climatology—is the performance of its cloud detection scheme and the subsequent quality of its cloud fraction CDR. PATMOS-x employs the NOAA Enterprise Cloud Mask for this, which is based [...] Read more.
An important component of the AVHRR PATMOS-x climate date record (CDR)—or any satellite cloud climatology—is the performance of its cloud detection scheme and the subsequent quality of its cloud fraction CDR. PATMOS-x employs the NOAA Enterprise Cloud Mask for this, which is based on a naïve Bayesian approach. The goal of this paper is to generate analysis of the PATMOS-x cloud fraction CDR to facilitate its use in climate studies. Performance of PATMOS-x cloud detection is compared to that of the well-established MYD35 and CALIPSO products from the EOS A-Train. Results show the AVHRR PATMOS-x CDR compares well against CALIPSO with most regions showing proportional correct values of 0.90 without any spatial filtering and 0.95 when a spatial filter is applied. Values are similar for the NASA MODIS MYD35 mask. A direct comparison of PATMOS-x and MYD35 from 2003 to 2014 also shows agreement over most regions in terms of mean cloud amount, inter-annual variability, and linear trends. Regional and seasonal differences are discussed. The analysis demonstrates that PATMOS-x cloud amount uncertainty could effectively screen regions where PATMOS-x differs from MYD35. Full article
(This article belongs to the Special Issue Satellite Climate Data Records and Applications)
Show Figures

Graphical abstract

13 pages, 2513 KiB  
Article
Mangroves at Their Limits: Detection and Area Estimation of Mangroves along the Sahara Desert Coast
by Viviana Otero 1,*, Katrien Quisthoudt 1, Nico Koedam 2,† and Farid Dahdouh-Guebas 1,2,†
1 Laboratory of Systems Ecology and Resource Management, Faculté des Sciences, Université Libre de Bruxelles (ULB), Avenue F.D. Roosevelt 50, CPI 264/1, B-1050 Brussels, Belgium
2 Laboratory of Plant Biology and Nature Management, Ecology and Biodiversity, Faculty of Science and Bio-Engineering Sciences, Vrije Universiteit Brussel (VUB), Pleinlaan 2, VUB-APNA-WE, B-1050 Brussels, Belgium
These authors contributed equally to this work.
Remote Sens. 2016, 8(6), 512; https://doi.org/10.3390/rs8060512 - 18 Jun 2016
Cited by 16 | Viewed by 7938
Abstract
The northernmost and most arid mangrove ecosystem of West Africa is found in Mauritania, in the Parc National du Banc d’Arguin (PNBA). The existing global and regional maps of Mauritania’s mangroves have little detail, and available estimates of the mangrove area differ among [...] Read more.
The northernmost and most arid mangrove ecosystem of West Africa is found in Mauritania, in the Parc National du Banc d’Arguin (PNBA). The existing global and regional maps of Mauritania’s mangroves have little detail, and available estimates of the mangrove area differ among studies. We assessed the use of automated Remote Sensing classification techniques to calculate the extent and map the distribution of the mangrove patches located at Cap Timiris, PNBA, using QuickBird and GeoEye imagery. It was possible to detect the northernmost contiguous mangrove patches of West Africa with an accuracy of 87% ± 2% using the Maximum Likelihood algorithm. The main source of error was the low spectral difference between mangroves and other types of terrestrial vegetation, which resulted in an erroneous classification between these two types of land cover. The most reliable estimate for the mangrove area obtained in this study was 19.48 ± 5.54 ha in 2011. Moreover, we present a special validation procedure that enables a detailed and reliable validation of the land cover maps. Full article
(This article belongs to the Special Issue Remote Sensing in Coastal Environments)
Show Figures

Graphical abstract

19 pages, 3712 KiB  
Article
Object-Based Greenhouse Mapping Using Very High Resolution Satellite Data and Landsat 8 Time Series
by Manuel A. Aguilar 1,*, Abderrahim Nemmaoui 1, Antonio Novelli 2, Fernando J. Aguilar 1 and Andrés García Lorca 3
1 Department of Engineering, University of Almería, Ctra. de Sacramento s/n, La Cañada de San Urbano, Almería 04120, Spain
2 Politecnico di Bari, via Orabona n. 4, I-70125 Bari, Italy
3 Department of Geography, University of Almería, Ctra Sacramento s/n, La Cañada de San Urbano, Almería 04120, Spain
Remote Sens. 2016, 8(6), 513; https://doi.org/10.3390/rs8060513 - 18 Jun 2016
Cited by 80 | Viewed by 12714
Abstract
Greenhouse mapping through remote sensing has received extensive attention over the last decades. In this article, the innovative goal relies on mapping greenhouses through the combined use of very high resolution satellite data (WorldView-2) and Landsat 8 Operational Land Imager (OLI) time series [...] Read more.
Greenhouse mapping through remote sensing has received extensive attention over the last decades. In this article, the innovative goal relies on mapping greenhouses through the combined use of very high resolution satellite data (WorldView-2) and Landsat 8 Operational Land Imager (OLI) time series within a context of an object-based image analysis (OBIA) and decision tree classification. Thus, WorldView-2 was mainly used to segment the study area focusing on individual greenhouses. Basic spectral information, spectral and vegetation indices, textural features, seasonal statistics and a spectral metric (Moment Distance Index, MDI) derived from Landsat 8 time series and/or WorldView-2 imagery were computed on previously segmented image objects. In order to test its temporal stability, the same approach was applied for two different years, 2014 and 2015. In both years, MDI was pointed out as the most important feature to detect greenhouses. Moreover, the threshold value of this spectral metric turned to be extremely stable for both Landsat 8 and WorldView-2 imagery. A simple decision tree always using the same threshold values for features from Landsat 8 time series and WorldView-2 was finally proposed. Overall accuracies of 93.0% and 93.3% and kappa coefficients of 0.856 and 0.861 were attained for 2014 and 2015 datasets, respectively. Full article
Show Figures

Graphical abstract

27 pages, 12604 KiB  
Article
A Comparison of Machine Learning Algorithms for Mapping of Complex Surface-Mined and Agricultural Landscapes Using ZiYuan-3 Stereo Satellite Imagery
by Xianju Li 1, Weitao Chen 2,3,*, Xinwen Cheng 1 and Lizhe Wang 2
1 Faculty of Information Engineering, China University of Geosciences, Wuhan 430074, China
2 Faculty of Computer Science and Hubei Key Laboratory of Intelligent Geo-Information Processing, China University of Geosciences, Wuhan 430074, China
3 Faculty of Geo-Information Science and Earth Observation (ITC), University of Twente, 7500 AE Enschede, The Netherlands
Remote Sens. 2016, 8(6), 514; https://doi.org/10.3390/rs8060514 - 18 Jun 2016
Cited by 125 | Viewed by 11674
Abstract
Land cover mapping (LCM) in complex surface-mined and agricultural landscapes could contribute greatly to regulating mine exploitation and protecting mine geo-environments. However, there are some special and spectrally similar land covers in these landscapes which increase the difficulty in LCM when employing high [...] Read more.
Land cover mapping (LCM) in complex surface-mined and agricultural landscapes could contribute greatly to regulating mine exploitation and protecting mine geo-environments. However, there are some special and spectrally similar land covers in these landscapes which increase the difficulty in LCM when employing high spatial resolution images. There is currently no research on these mixed complex landscapes. The present study focused on LCM in such a mixed complex landscape located in Wuhan City, China. A procedure combining ZiYuan-3 (ZY-3) stereo satellite imagery, the feature selection (FS) method, and machine learning algorithms (MLAs) (random forest, RF; support vector machine, SVM; artificial neural network, ANN) was proposed and first examined for both LCM of surface-mined and agricultural landscapes (MSMAL) and classification of surface-mined land (CSML), respectively. The mean and standard deviation filters of spectral bands and topographic features derived from ZY-3 stereo images were newly introduced. Comparisons of three MLAs, including their sensitivities to FS and whether FS resulted in significant influences, were conducted for the first time in the present study. The following conclusions are drawn. Textures were of little use, and the novel features contributed to improve classification accuracy. Regarding the influence of FS: FS substantially reduced feature set (by 68% for MSMAL and 87% for CSML), and often improved classification accuracies (with an average value of 4.48% for MSMAL using three MLAs, and 11.39% for CSML using RF and SVM); FS showed statistically significant improvements except for ANN-based MSMAL; SVM was most sensitive to FS, followed by ANN and RF. Regarding comparisons of MLAs: for MSMAL based on feature subset, RF achieved the greatest overall accuracy of 77.57%, followed by SVM and ANN; for CSML, SVM had the highest accuracies (87.34%), followed by RF and ANN; based on the feature subsets, significant differences were observed for MSMAL and CSML using any pair of MLAs. In general, the proposed approach can contribute to LCM in complex surface-mined and agricultural landscapes. Full article
Show Figures

Graphical abstract

23 pages, 5513 KiB  
Article
Large-Area, High-Resolution Tree Cover Mapping with Multi-Temporal SPOT5 Imagery, New South Wales, Australia
by Adrian Fisher 1,2,*, Michael Day 3, Tony Gill 1,3, Adam Roff 2,3, Tim Danaher 1,3 and Neil Flood 1,4
1 Joint Remote Sensing Research Program, School of Geography, Planning and Environmental Management, University of Queensland, Brisbane, QLD 4072, Australia
2 Centre for Ecosystem Science, School of Biological, Earth and Environmental Sciences, University of New South Wales, Sydney, NSW 2052, Australia
3 Office of Environment and Heritage, 10 Valentine Ave, Parramatta, NSW 2150, Australia
4 Remote Sensing Centre, Science Delivery, Department of Science, Information Technology and Innovation, 41 Boggo Road, Dutton Park, QLD 4102, Australia
Remote Sens. 2016, 8(6), 515; https://doi.org/10.3390/rs8060515 - 18 Jun 2016
Cited by 38 | Viewed by 10469
Abstract
Tree cover maps are used for many purposes, such as vegetation mapping, habitat connectivity and fragmentation studies. Small remnant patches of native vegetation are recognised as ecologically important, yet they are underestimated in remote sensing products derived from Landsat. High spatial resolution sensors [...] Read more.
Tree cover maps are used for many purposes, such as vegetation mapping, habitat connectivity and fragmentation studies. Small remnant patches of native vegetation are recognised as ecologically important, yet they are underestimated in remote sensing products derived from Landsat. High spatial resolution sensors are capable of mapping small patches of trees, but their use in large-area mapping has been limited. In this study, multi-temporal Satellite pour l’Observation de la Terre 5 (SPOT5) High Resolution Geometrical data was pan-sharpened to 5 m resolution and used to map tree cover for the Australian state of New South Wales (NSW), an area of over 800,000 km2. Complete coverages of SPOT5 panchromatic and multispectral data over NSW were acquired during four consecutive summers (2008–2011) for a total of 1256 images. After pre-processing, the imagery was used to model foliage projective cover (FPC), a measure of tree canopy density commonly used in Australia. The multi-temporal imagery, FPC models and 26,579 training pixels were used in a binomial logistic regression model to estimate the probability of each pixel containing trees. The probability images were classified into a binary map of tree cover using local thresholds, and then visually edited to reduce errors. The final tree map was then attributed with the mean FPC value from the multi-temporal imagery. Validation of the binary map based on visually assessed high resolution reference imagery revealed an overall accuracy of 88% (±0.51% standard error), while comparison against airborne lidar derived data also resulted in an overall accuracy of 88%. A preliminary assessment of the FPC map by comparing against 76 field measurements showed a very good agreement (r2 = 0.90) with a root mean square error of 8.57%, although this may not be representative due to the opportunistic sampling design. The map represents a regionally consistent and locally relevant record of tree cover for NSW, and is already widely used for natural resource management in the state. Full article
Show Figures

Graphical abstract

19 pages, 40326 KiB  
Article
Source Parameters of the 2003–2004 Bange Earthquake Sequence, Central Tibet, China, Estimated from InSAR Data
by Lingyun Ji 1,*, Jing Xu 1, Qiang Zhao 1 and Chengsheng Yang 2
1 Second Monitoring and Application Center, China Earthquake Administration, 316 Xiying Rd., Xi’an 710054, China
2 College of Geology Engineering and Geomatics, Chang’an University, 126 Yanta Rd., Xi’an 710054, China
Remote Sens. 2016, 8(6), 516; https://doi.org/10.3390/rs8060516 - 18 Jun 2016
Cited by 7 | Viewed by 7310
Abstract
A sequence of Ms ≥ 5.0 earthquakes occurred in 2003 and 2004 in Bange County, Tibet, China, all with similar depths and focal mechanisms. However, the source parameters, kinematics and relationships between these earthquakes are poorly known because of their moderately-sized magnitude and [...] Read more.
A sequence of Ms ≥ 5.0 earthquakes occurred in 2003 and 2004 in Bange County, Tibet, China, all with similar depths and focal mechanisms. However, the source parameters, kinematics and relationships between these earthquakes are poorly known because of their moderately-sized magnitude and the sparse distribution of seismic stations in the region. We utilize interferometric synthetic aperture radar (InSAR) data from the European Space Agency’s Envisat satellite to determine the location, fault geometry and slip distribution of three large events of the sequence that occurred on 7 July 2003 (Ms 6.0), 27 March 2004 (Ms 6.2), and 3 July 2004 (Ms 5.1). The modeling results indicate that the 7 July 2003 event was a normal-faulting event with a right-lateral slip component, the 27 March 2004 earthquake was associated with a normal fault striking northeast–southwest and dipping northwest with a moderately oblique right-lateral slip, and the 3 July 2004 event was caused by a normal fault. A calculation of the static stress changes on the fault planes demonstrates that the third earthquake may have been triggered by the previous ones. Full article
(This article belongs to the Special Issue Earth Observations for Geohazards)
Show Figures

Figure 1

24 pages, 5714 KiB  
Article
Developing a Comprehensive Spectral-Biogeochemical Database of Midwestern Rivers for Water Quality Retrieval Using Remote Sensing Data: A Case Study of the Wabash River and Its Tributary, Indiana
by Jing Tan 1,*, Keith A. Cherkauer 1 and Indrajeet Chaubey 1,2
1 Agricultural and Biological Engineering, Purdue University, 225 South University Street, West Lafayette, IN 47906, USA
2 Department of Earth, Atmospheric, and Planetary Sciences, Purdue University, 550 Stadium Mall Drive, West Lafayette, IN 47907, USA
Remote Sens. 2016, 8(6), 517; https://doi.org/10.3390/rs8060517 - 21 Jun 2016
Cited by 16 | Viewed by 7495
Abstract
A comprehensive spectral-biogeochemical database was developed for the Wabash River and the Tippecanoe River in Indiana, United States. This database includes spectral measurements of river water, coincident in situ measurements of water quality parameters (chlorophyll (chl), non-algal particles (NAP), and colored dissolved organic [...] Read more.
A comprehensive spectral-biogeochemical database was developed for the Wabash River and the Tippecanoe River in Indiana, United States. This database includes spectral measurements of river water, coincident in situ measurements of water quality parameters (chlorophyll (chl), non-algal particles (NAP), and colored dissolved organic matter (CDOM)), nutrients (total nitrogen (TN), total phosphorus (TP), and dissolved organic carbon (DOC)), water-column inherent optical properties (IOPs), water depths, substrate types, and bottom reflectance spectra collected in summer 2014. With this dataset, the temporal variability of water quality observations was first analyzed and studied. Second, radiative transfer models were inverted to retrieve water quality parameters using a look-up table (LUT) based spectrum matching methodology. Results found that the temporal variability of water quality parameters and nutrients in the Wabash River was closely associated with hydrologic conditions. Meanwhile, there were no significant correlations found between these parameters and streamflow for the Tippecanoe River, due to the two upstream reservoirs, which increase the settling of sediment and uptake of nutrients. The poor relationship between CDOM and DOC indicates that most DOC in the rivers was from human sources such as wastewater. It was also found that the source of water (surface runoff or combined sewer overflow (CSO)), water temperature, and nutrients were important factors controlling instream concentrations of phytoplankton. The LUT retrieved NAP concentrations were in good agreement with field measurements with slope close to 1.0 and the average estimation error was 4.1% of independently obtained lab measurements. The error for chl estimation was larger (37.7%), which is attributed to the fact that the specific absorption spectrum of chl was not well represented in this study. The LUT retrievals for CDOM experienced large variability, probably due to the small data range collected in this study and the insensitivity of Rrs to CDOM change. It is concluded that the success of the LUT method requires accurate spectral measurements and enough a priori information of the environment to construct a representative database for water quality retrieval. Therefore, future work will focus on continuing data collection in other seasons of the year and better characterization of the study area. Full article
Show Figures

Graphical abstract

16 pages, 5662 KiB  
Article
Merging Alternate Remotely-Sensed Soil Moisture Retrievals Using a Non-Static Model Combination Approach
by Seokhyeon Kim 1, Robert M. Parinussa 1, Yi Y. Liu 2, Fiona M. Johnson 1 and Ashish Sharma 1,*
1 School of Civil and Environmental Engineering, University of New South Wales, Sydney, NSW 2052, Australia
2 Australian Research Council’s Centre of Excellence for Climate Systems Science & Climate Change Research Centre, University of New South Wales, Sydney, NSW 2052, Australia
Remote Sens. 2016, 8(6), 518; https://doi.org/10.3390/rs8060518 - 21 Jun 2016
Cited by 18 | Viewed by 6518
Abstract
Soil moisture is an important variable in the coupled hydrologic and climate system. In recent years, microwave-based soil moisture products have been shown to be a viable alternative to in situ measurements. A popular way to measure the performance of soil moisture products [...] Read more.
Soil moisture is an important variable in the coupled hydrologic and climate system. In recent years, microwave-based soil moisture products have been shown to be a viable alternative to in situ measurements. A popular way to measure the performance of soil moisture products is to calculate the temporal correlation coefficient (R) against in situ measurements or other appropriate reference datasets. In this study, an existing linear combination method improving R was modified to allow for a non-static or nonstationary model combination as the basis for improving remotely-sensed surface soil moisture. Previous research had noted that two soil moisture products retrieved using the Japan Aerospace Exploration Agency (JAXA) and Land Parameter Retrieval Model (LPRM) algorithms from the same Advanced Microwave Scanning Radiometer 2 (AMSR2) sensor are spatially complementary in terms of R against a suitable reference over a fixed period. Accordingly, a linear combination was proposed to maximize R using a set of spatially-varying, but temporally-fixed weights. Even though this approach showed promising results, there was room for further improvements, in particular using non-static or dynamic weights that take account of the time-varying nature of the combination algorithm being approximated. The dynamic weighting was achieved by using a moving window. A number of different window sizes was investigated. The optimal weighting factors were determined for the data lying within the moving window and then used to dynamically combine the two parent products. We show improved performance for the dynamically-combined product over the static linear combination. Generally, shorter time windows outperform the static approach, and a 60-day time window is suggested to be the optimum. Results were validated against in situ measurements collected from 124 stations over different continents. The mean R of the dynamically-combined products was found to be 0.57 and 0.62 for the cases using the European Centre for Medium-Range Weather Forecasts Reanalysis-Interim (ERA-Interim) and Modern-Era Retrospective Analysis for Research and Applications Land (MERRA-Land) reanalysis products as the reference, respectively, outperforming the statically-combined products (0.55 and 0.54). Full article
(This article belongs to the Special Issue Multi-Sensor and Multi-Data Integration in Remote Sensing)
Show Figures

Graphical abstract

11 pages, 13973 KiB  
Article
Space Geodetic Observations and Modeling of 2016 Mw 5.9 Menyuan Earthquake: Implications on Seismogenic Tectonic Motion
by Yongsheng Li 1,2, Wenliang Jiang 1,2,*, Jingfa Zhang 1,2 and Yi Luo 1,2
1 Institute of Crustal Dynamics, China Earthquake Administration, Beijing 100085, China
2 Key Laboratory of Crustal Dynamics, China Earthquake Administration, Beijing 100085, China
Remote Sens. 2016, 8(6), 519; https://doi.org/10.3390/rs8060519 - 22 Jun 2016
Cited by 48 | Viewed by 7764
Abstract
Determining the relationship between crustal movement and faulting in thrust belts is essential for understanding the growth of geological structures and addressing the proposed models of a potential earthquake hazard. A Mw 5.9 earthquake occurred on 21 January 2016 in Menyuan, NE Qinghai [...] Read more.
Determining the relationship between crustal movement and faulting in thrust belts is essential for understanding the growth of geological structures and addressing the proposed models of a potential earthquake hazard. A Mw 5.9 earthquake occurred on 21 January 2016 in Menyuan, NE Qinghai Tibetan plateau. We combined satellite interferometry from Sentinel-1A Terrain Observation with Progressive Scans (TOPS) images, historical earthquake records, aftershock relocations and geological data to determine fault seismogenic structural geometry and its relationship with the Lenglongling faults. The results indicate that the reverse slip of the 2016 earthquake is distributed on a southwest dipping shovel-shaped fault segment. The main shock rupture was initiated at the deeper part of the fault plane. The focal mechanism of the 2016 earthquake is quite different from that of a previous Ms 6.5 earthquake which occurred in 1986. Both earthquakes occurred at the two ends of a secondary fault. Joint analysis of the 1986 and 2016 earthquakes and aftershocks distribution of the 2016 event reveals an intense connection with the tectonic deformation of the Lenglongling faults. Both earthquakes resulted from the left-lateral strike-slip of the Lenglongling fault zone and showed distinct focal mechanism characteristics. Under the shearing influence, the normal component is formed at the releasing bend of the western end of the secondary fault for the left-order alignment of the fault zone, while the thrust component is formed at the restraining bend of the east end for the right-order alignment of the fault zone. Seismic activity of this region suggests that the left-lateral strike-slip of the Lenglongling fault zone plays a significant role in adjustment of the tectonic deformation in the NE Tibetan plateau. Full article
(This article belongs to the Special Issue Earth Observations for Geohazards)
Show Figures

Graphical abstract

23 pages, 11555 KiB  
Article
An Automated Approach for Sub-Pixel Registration of Landsat-8 Operational Land Imager (OLI) and Sentinel-2 Multi Spectral Instrument (MSI) Imagery
by Lin Yan *, David P. Roy, Hankui Zhang, Jian Li and Haiyan Huang
Geospatial Sciences Center of Excellence, South Dakota State University, Brookings, SD 57007, USA
Remote Sens. 2016, 8(6), 520; https://doi.org/10.3390/rs8060520 - 21 Jun 2016
Cited by 114 | Viewed by 15925
Abstract
Moderate spatial resolution satellite data from the Landsat-8 OLI and Sentinel-2A MSI sensors together offer 10 m to 30 m multi-spectral reflective wavelength global coverage, providing the opportunity for improved combined sensor mapping and monitoring of the Earth’s surface. However, the standard geolocated [...] Read more.
Moderate spatial resolution satellite data from the Landsat-8 OLI and Sentinel-2A MSI sensors together offer 10 m to 30 m multi-spectral reflective wavelength global coverage, providing the opportunity for improved combined sensor mapping and monitoring of the Earth’s surface. However, the standard geolocated Landsat-8 OLI L1T and Sentinel-2A MSI L1C data products are currently found to be misaligned. An approach for automated registration of Landsat-8 OLI L1T and Sentinel-2A MSI L1C data is presented and demonstrated using contemporaneous sensor data. The approach is computationally efficient because it implements feature point detection across four image pyramid levels to identify a sparse set of tie-points. Area-based least squares matching around the feature points with mismatch detection across the image pyramid levels is undertaken to provide reliable tie-points. The approach was assessed by examination of extracted tie-point spatial distributions and tie-point mapping transformations (translation, affine and second order polynomial), dense-matching prediction-error assessment, and by visual registration assessment. Two test sites over Cape Town and Limpopo province in South Africa that contained cloud and shadows were selected. A Landsat-8 L1T image and two Sentinel-2A L1C images sensed 16 and 26 days later were registered (Cape Town) to examine the robustness of the algorithm to surface, atmosphere and cloud changes, in addition to the registration of a Landsat-8 L1T and Sentinel-2A L1C image pair sensed 4 days apart (Limpopo province). The automatically extracted tie-points revealed sensor misregistration greater than one 30 m Landsat-8 pixel dimension for the two Cape Town image pairs, and greater than one 10 m Sentinel-2A pixel dimension for the Limpopo image pair. Transformation fitting assessments showed that the misregistration can be effectively characterized by an affine transformation. Hundreds of automatically located tie-points were extracted and had affine-transformation root-mean-square error fits of approximately 0.3 pixels at 10 m resolution and dense-matching prediction errors of similar magnitude. These results and visual assessment of the affine transformed data indicate that the methodology provides sub-pixel registration performance required for meaningful Landsat-8 OLI and Sentinel-2A MSI data comparison and combined data applications. Full article
Show Figures

Graphical abstract

19 pages, 7479 KiB  
Article
Generation of Land Cover Maps through the Fusion of Aerial Images and Airborne LiDAR Data in Urban Areas
by Yongmin Kim
National Disaster Management Research Institute, Ulsan 44538, Korea
Remote Sens. 2016, 8(6), 521; https://doi.org/10.3390/rs8060521 - 22 Jun 2016
Cited by 7 | Viewed by 6718
Abstract
Satellite images and aerial images with high spatial resolution have improved visual interpretation capabilities. The use of high-resolution images has rapidly grown and has been extended to various fields, such as military surveillance, disaster monitoring, and cartography. However, many problems were encountered in [...] Read more.
Satellite images and aerial images with high spatial resolution have improved visual interpretation capabilities. The use of high-resolution images has rapidly grown and has been extended to various fields, such as military surveillance, disaster monitoring, and cartography. However, many problems were encountered in which one object has a variety of spectral properties and different objects have similar spectral characteristics in terms of land cover. The problems are quite noticeable, especially for building objects in urban environments. In the land cover classification process, these issues directly decrease the classification accuracy by causing misclassification of single objects as well as between objects. This study proposes a method of increasing the accuracy of land cover classification by addressing the problem of misclassifying building objects through the output-level fusion of aerial images and airborne Light Detection and Ranging (LiDAR) data. The new method consists of the following three steps: (1) generation of the segmented image via a process that performs adaptive dynamic range linear stretching and modified seeded region growth algorithms; (2) extraction of building information from airborne LiDAR data using a planar filter and binary supervised classification; and (3) generation of a land cover map using the output-level fusion of two results and object-based classification. The new method was tested at four experimental sites with the Min-Max method and the SSI-nDSM method followed by a visual assessment and a quantitative accuracy assessment through comparison with reference data. In the accuracy assessment, the new method exhibits various advantages, including reduced noise and more precise classification results. Additionally, the new method improved the overall accuracy by more than 5% over the comparative evaluation methods. The high and low patterns between the overall and building accuracies were similar. Thus, the new method is judged to have successfully solved the inaccuracy problem of classification that is often produced by high-resolution images of urban environments through an output-level fusion technique. Full article
(This article belongs to the Special Issue Multi-Sensor and Multi-Data Integration in Remote Sensing)
Show Figures

Figure 1

18 pages, 2462 KiB  
Article
Sensitivity of L-Band SAR Backscatter to Aboveground Biomass of Global Forests
by Yifan Yu * and Sassan Saatchi
Jet Propulsion Laboratory, California Institue of Technology, Pasadena, CA 91109, USA
Remote Sens. 2016, 8(6), 522; https://doi.org/10.3390/rs8060522 - 22 Jun 2016
Cited by 134 | Viewed by 13621
Abstract
Synthetic Aperture Radar (SAR) backscatter measurements are sensitive to forest aboveground biomass (AGB), and the observations from space can be used for mapping AGB globally. However, the radar sensitivity saturates at higher AGB values depending on the wavelength and geometry of radar measurements, [...] Read more.
Synthetic Aperture Radar (SAR) backscatter measurements are sensitive to forest aboveground biomass (AGB), and the observations from space can be used for mapping AGB globally. However, the radar sensitivity saturates at higher AGB values depending on the wavelength and geometry of radar measurements, and is influenced by the structure of the forest and environmental conditions. Here, we examine the sensitivity of SAR at the L-band frequency (~25 cm wavelength) to AGB in order to examine the performance of future joint National Aeronautics and Space Administration, Indian Space Research Organisation NASA-ISRO SAR mission in mapping the AGB of global forests. For SAR data, we use the Phased Array L-Band SAR (PALSAR) backscatter from the Advanced Land Observing Satellite (ALOS) aggregated at a 100-m spatial resolution; and for AGB data, we use more than three million AGB values derived from the Geoscience Laser Altimeter System (GLAS) LiDAR height metrics at about 0.16–0.25 ha footprints across eleven different forest types globally. The results from statistical analysis show that, over all eleven forest types, saturation level of L-band radar at HV polarization on average remains ≥100 Mg·ha−1. Fresh water swamp forests have the lowest saturation with AGB at ~80 Mg·ha−1, while needleleaf forests have the highest saturation at ~250 Mg·ha−1. Swamp forests show a strong backscatter from the vegetation-surface specular reflection due to inundation that requires to be treated separately from those on terra firme. Our results demonstrate that L-Band backscatter relations to AGB can be significantly different depending on forest types and environmental effects, requiring multiple algorithms to map AGB from time series of satellite radar observations globally. Full article
(This article belongs to the Special Issue Remote Sensing of Vegetation Structure and Dynamics)
Show Figures

Graphical abstract

20 pages, 5978 KiB  
Article
Sea and Freshwater Ice Concentration from VIIRS on Suomi NPP and the Future JPSS Satellites
by Yinghui Liu 1,*, Jeffrey Key 2 and Robert Mahoney 3
1 Cooperative Institute for Meteorological Satellite Studies, University of Wisconsin-Madison, 1225 West Dayton St., Madison, WI 53706, USA
2 NOAA/NESDIS, 1225 West Dayton St., Madison, WI 53706, USA
3 Northrop Grumman Aerospace Systems, Redondo Beach, CA 90278, USA
Remote Sens. 2016, 8(6), 523; https://doi.org/10.3390/rs8060523 - 22 Jun 2016
Cited by 48 | Viewed by 10424
Abstract
Information on ice is important for shipping, weather forecasting, and climate monitoring. Historically, ice cover has been detected and ice concentration has been measured using relatively low-resolution space-based passive microwave data. This study presents an algorithm to detect ice and estimate ice concentration [...] Read more.
Information on ice is important for shipping, weather forecasting, and climate monitoring. Historically, ice cover has been detected and ice concentration has been measured using relatively low-resolution space-based passive microwave data. This study presents an algorithm to detect ice and estimate ice concentration in clear-sky areas over the ocean and inland lakes and rivers using high-resolution data from the Visible Infrared Imaging Radiometer Suite (VIIRS) onboard the Suomi National Polar Orbiting Partnership (S-NPP) and on future Joint Polar Satellite System (JPSS) satellites, providing spatial detail that cannot be obtained with passive microwave data. A threshold method is employed with visible and infrared observations to identify ice, then a tie-point algorithm is used to determine the representative reflectance/temperature of pure ice, estimate the ice concentration, and refine the ice cover mask. The VIIRS ice concentration is validated using observations from Landsat 8. Results show that VIIRS has an overall bias of −0.3% compared to Landsat 8 ice concentration, with a precision (uncertainty) of 9.5%. Biases and precision values for different ice concentration subranges from 0% to 100% can be larger. Full article
(This article belongs to the Special Issue Sea Ice Remote Sensing and Analysis)
Show Figures

Graphical abstract

20 pages, 6604 KiB  
Article
Crop Monitoring Based on SPOT-5 Take-5 and Sentinel-1A Data for the Estimation of Crop Water Requirements
by Ana Navarro 1,*, João Rolim 2, Irina Miguel 3, João Catalão 1, Joel Silva 4, Marco Painho 4 and Zoltán Vekerdy 5
1 IDL, Departamento de Engenharia Geográfica, Geofísica e Energia, Faculdade de Ciências, Universidade de Lisboa, 1749-016 Lisboa, Portugal
2 LEAF, Departamento de Ciências e Engenharia de Biossistemas, Instituto Superior de Agronomia, Universidade de Lisboa, 1349-017 Lisboa, Portugal
3 Departamento de Geologia, Faculdade de Ciências, Universidade Agostinho Neto, 1231 Luanda, Angola
4 NOVA IMS, Information Management School, Universidade Nova de Lisboa, 1070-312 Lisboa, Portugal
5 ITC, Department of Water Resources, Faculty of Geo-information Science and Earth Observation, University of Twente, P.O. Box 6, 7500 AA Enschede, The Netherlands
Remote Sens. 2016, 8(6), 525; https://doi.org/10.3390/rs8060525 - 22 Jun 2016
Cited by 74 | Viewed by 10874
Abstract
Optical and microwave images have been combined for land cover monitoring in different agriculture scenarios, providing useful information on qualitative and quantitative land cover changes. This study aims to assess the complementarity and interoperability of optical (SPOT-5 Take-5) and synthetic aperture radar (SAR) [...] Read more.
Optical and microwave images have been combined for land cover monitoring in different agriculture scenarios, providing useful information on qualitative and quantitative land cover changes. This study aims to assess the complementarity and interoperability of optical (SPOT-5 Take-5) and synthetic aperture radar (SAR) (Sentinel-1A) data for crop parameter (basal crop coefficient (Kcb) values and the length of the crop’s development stages) retrieval and crop type classification, with a focus on crop water requirements, for an irrigation perimeter in Angola. SPOT-5 Take-5 images are used as a proxy of Sentinel-2 data to evaluate the potential of their enhanced temporal resolution for agricultural applications. In situ data are also used to complement the Earth Observation (EO) data. The Normalized Difference Vegetation Index (NDVI) and dual (VV + VH) polarization backscattering time series are used to compute the Kcb curve for four crop types (maize, soybean, bean and pasture) and to estimate the length of each phenological growth stage. The Kcb values are then used to compute the crop’s evapotranspiration and to subsequently estimate the crop irrigation requirements based on a soil water balance model. A significant R2 correlation between NDVI and backscatter time series was observed for all crops, demonstrating that optical data can be replaced by microwave data in the presence of cloud cover. However, it was not possible to properly identify each stage of the crop cycle due to the lack of EO data for the complete growing season. Full article
Show Figures

Graphical abstract

14 pages, 923 KiB  
Article
Using Different Regression Methods to Estimate Leaf Nitrogen Content in Rice by Fusing Hyperspectral LiDAR Data and Laser-Induced Chlorophyll Fluorescence Data
by Lin Du 1,2, Shuo Shi 2,3,4,*, Jian Yang 2, Jia Sun 2 and Wei Gong 2,3,*
1 School of Physics and Technology, Wuhan University, Wuhan 430072, China
2 State Key Laboratory of Information Engineering in Surveying, Mapping and Remote Sensing, Wuhan University, Wuhan 430079, China
3 Collaborative Innovation Center of Geospatial Technology, Wuhan 430079, China
4 School of Resource and Environmental Sciences, Wuhan University, Wuhan 430072, China
Remote Sens. 2016, 8(6), 526; https://doi.org/10.3390/rs8060526 - 22 Jun 2016
Cited by 34 | Viewed by 6592
Abstract
Nitrogen is an essential nutrient element in crop photosynthesis and yield improvement. Thus, it is urgent and important to accurately estimate the leaf nitrogen contents (LNC) of crops for precision nitrogen management. Based on the correlation between LNC and reflectance spectra, the hyperspectral [...] Read more.
Nitrogen is an essential nutrient element in crop photosynthesis and yield improvement. Thus, it is urgent and important to accurately estimate the leaf nitrogen contents (LNC) of crops for precision nitrogen management. Based on the correlation between LNC and reflectance spectra, the hyperspectral LiDAR (HSL) system can determine three-dimensional structural parameters and biochemical changes of crops. Thereby, HSL technology has been widely used to monitor the LNC of crops at leaf and canopy levels. In addition, the laser-induced fluorescence (LIF) of chlorophyll, related to the histological structure and physiological conditions of green plants, can also be utilized to detect nutrient stress in crops. In this study, four regression algorithms, support vector machines (SVMs), partial least squares (PLS) and two artificial neural networks (ANNs), back propagation NNs (BP-NNs) and radial basic function NNs (RBF-NNs), were selected to estimate rice LNC in booting and heading stages based on reflectance and LIF spectra. These four regression algorithms were used for 36 input variables, including the reflectance spectral variables on 32 wavelengths and four peaks of the LIF spectra. A feature weight algorithm was proposed to select different band combinations for the LNC retrieval models. The determination coefficient (R2) and the root mean square error (RMSE) of the retrieval models were utilized to compare their abilities of estimating the rice LNC. The experimental results demonstrate that (I) these four regression methods are useful for estimating rice LNC in the order of RBF-NNs > SVMs > BP-NNs > PLS; (II) The LIF data in two forms, including peaks and indices, display potential in rice LNC retrieval, especially when using the PLS regression (PLSR) model for the relationship of rice LNC with spectral variables. The feature weighting algorithm is an effective and necessary method to determine appropriate band combinations for rice LNC estimation. Full article
Show Figures

Graphical abstract

19 pages, 1704 KiB  
Article
An IPCC-Compliant Technique for Forest Carbon Stock Assessment Using Airborne LiDAR-Derived Tree Metrics and Competition Index
by Chinsu Lin 1,*, Gavin Thomson 2 and Sorin C. Popescu 3
1 Department of Forestry and Natural Resources, National Chiayi University, 300 University Road, Chiayi 60004, Taiwan
2 Department of Applied Foreign Languages, National Formosa University, 64 Wunhua Road, Huwei Township, Yunlin County 63201, Taiwan
3 Department of Ecosystem Science and Management, Texas A&M University, 1500 Research Parkway Suite B 217, College Station, TX 77843, USA
Remote Sens. 2016, 8(6), 528; https://doi.org/10.3390/rs8060528 - 22 Jun 2016
Cited by 52 | Viewed by 8192
Abstract
This study developed an IPCC (Intergovernmental Panel on Climate Change) compliant method for the estimation of above-ground carbon (AGC) in forest stands using remote sensing technology. A multi-level morphological active contour (MMAC) algorithm was employed to obtain tree-level metrics (tree height (LH), crown [...] Read more.
This study developed an IPCC (Intergovernmental Panel on Climate Change) compliant method for the estimation of above-ground carbon (AGC) in forest stands using remote sensing technology. A multi-level morphological active contour (MMAC) algorithm was employed to obtain tree-level metrics (tree height (LH), crown radius (LCR), competition index (LCI), and stem diameter (LDBH)) from an airborne LiDAR-derived canopy height model. Seven biomass-based AGC models and 13 volume-based AGC models were developed using a training dataset and validated using a separate validation dataset. Four accuracy measures, mean absolute error (MAE), root-mean-square error (RMSE), percentage RMSE (PRMSE), and root-mean-square percentage error (RMSPE) were calculated for each of the 20 models. These measures were transformed into a new index, accuracy improvement percentage (AIP), for post hoc testing of model performance in estimating forest stand AGC stock. Results showed that the tree-level AGC models explained 84% to 91% of the variance in tree-level AGC within the training dataset. Prediction errors (RMSEs) for these models ranged between 15 ton/ha and 210 ton/ha in mature forest stands, which is equal to an error percentage in the range 6% to 86%. At the stand-level, several models achieved accurate and reliable predictions of AGC stock. Some models achieved 90% to 95% accuracy, which was equal to or superior to the R-squared of the tree-level AGC models. The first recommended model was a biomass-based model using the metrics LDBH, LH, and LCI and the others were volume-based models using LH, LCI, and LCR and LDBH and LH. One metric, LCI, played a critical role in upgrading model performance when banded together with LH and LCR or LDBH and LCR. We conclude by proposing an IPCC-compatible method that is suitable for calculating tree-level AGC and predicting AGC stock of forest stands from airborne LiDAR data. Full article
Show Figures

Graphical abstract

18 pages, 2872 KiB  
Article
Posterior Probability Modeling and Image Classification for Archaeological Site Prospection: Building a Survey Efficacy Model for Identifying Neolithic Felsite Workshops in the Shetland Islands
by William P. Megarry 1,2,3,*, Gabriel Cooney 2, Douglas C. Comer 1 and Carey E. Priebe 3
1 Cultural Site Research and Management, 2113 St Paul, Baltimore, MD 21218, USA
2 School of Archaeology, University College Dublin, Belfield, Dublin, Ireland
3 Department of Applied Mathematics and Statistics, Johns Hopkins University, 3400 North Charles Street, Baltimore, MD 21218, USA
Remote Sens. 2016, 8(6), 529; https://doi.org/10.3390/rs8060529 - 22 Jun 2016
Cited by 15 | Viewed by 6753
Abstract
The application of custom classification techniques and posterior probability modeling (PPM) using Worldview-2 multispectral imagery to archaeological field survey is presented in this paper. Research is focused on the identification of Neolithic felsite stone tool workshops in the North Mavine region of the [...] Read more.
The application of custom classification techniques and posterior probability modeling (PPM) using Worldview-2 multispectral imagery to archaeological field survey is presented in this paper. Research is focused on the identification of Neolithic felsite stone tool workshops in the North Mavine region of the Shetland Islands in Northern Scotland. Sample data from known workshops surveyed using differential GPS are used alongside known non-sites to train a linear discriminant analysis (LDA) classifier based on a combination of datasets including Worldview-2 bands, band difference ratios (BDR) and topographical derivatives. Principal components analysis is further used to test and reduce dimensionality caused by redundant datasets. Probability models were generated by LDA using principal components and tested with sites identified through geological field survey. Testing shows the prospective ability of this technique and significance between 0.05 and 0.01, and gain statistics between 0.90 and 0.94, higher than those obtained using maximum likelihood and random forest classifiers. Results suggest that this approach is best suited to relatively homogenous site types, and performs better with correlated data sources. Finally, by combining posterior probability models and least-cost analysis, a survey least-cost efficacy model is generated showing the utility of such approaches to archaeological field survey. Full article
(This article belongs to the Special Issue Archaeological Prospecting and Remote Sensing)
Show Figures

Graphical abstract

20 pages, 8459 KiB  
Article
Sixteen Years of Agricultural Drought Assessment of the BioBío Region in Chile Using a 250 m Resolution Vegetation Condition Index (VCI)
by Francisco Zambrano 1,*,†, Mario Lillo-Saavedra 1,2,*,†, Koen Verbist 3,4,† and Octavio Lagos 1,2,†
1 Departament of Water Resources, Universidad de Concepción, Chillán 3801061, Chile
2 Water Research Center for Agriculture and Mining (CRHIAM) (CONICYT-FONDAP-15130015), Concepción 4070411, Chile
3 UNESCO-IHP, Hydrological Systems and Global Change Section, Santiago 7511019, Chile
4 International Centre for Eremology, Department of Soil Management, Ghent University, Ghent B-9000 Gent, Belgium
These authors contributed equally to this work.
Remote Sens. 2016, 8(6), 530; https://doi.org/10.3390/rs8060530 - 22 Jun 2016
Cited by 88 | Viewed by 10946
Abstract
Drought is one of the most complex natural hazards because of its slow onset and long-term impact; it has the potential to negatively affect many people. There are several advantages to using remote sensing to monitor drought, especially in developing countries with limited [...] Read more.
Drought is one of the most complex natural hazards because of its slow onset and long-term impact; it has the potential to negatively affect many people. There are several advantages to using remote sensing to monitor drought, especially in developing countries with limited historical meteorological records and a low weather station density. In the present study, we assessed agricultural drought in the croplands of the BioBío Region in Chile. The vegetation condition index (VCI) allows identifying the temporal and spatial variations of vegetation conditions associated with stress because of rainfall deficit. The VCI was derived at a 250 m spatial resolution for the 2000–2015 period with the Moderate Resolution Imaging Spectroradiometer (MODIS) MOD13Q1 product. We evaluated VCI for cropland areas using the land cover MCD12Q1 version 5.1 product and compared it to the in situ Standardized Precipitation Index (SPI) for six-time scales (1–6 months) from 26 weather stations. Results showed that the 3-month SPI (SPI-3), calculated for the modified growing season (November–April) instead of the regular growing season (September–April), has the best Pearson correlation with VCI values with an overall correlation of 0.63 and between 0.40 and 0.78 for the administrative units. These results show a very short-term vegetation response to rainfall deficit in September, which is reflected in the vegetation in November, and also explains to a large degree the variation in vegetation stress. It is shown that for the last 16 years in the BioBío Region we could identify the 2007/2008, 2008/2009, and 2014/2015 seasons as the three most important drought events; this is reflected in both the overall regional and administrative unit analyses. These results concur with drought emergencies declared by the regional government. Future studies are needed to associate the remote sensing values observed at high resolution (250 m) with the measured crop yield to identify more detailed individual crop responses. Full article
Show Figures

Graphical abstract

18 pages, 7163 KiB  
Article
Quantifying Fertilizer Application Response Variability with VHR Satellite NDVI Time Series in a Rainfed Smallholder Cropping System of Mali
by Xavier Blaes 1,*, Guillaume Chomé 1, Marie-Julie Lambert 1, Pierre Sibiry Traoré 2, Antonius G. T. Schut 3 and Pierre Defourny 1
1 Earth and Life Institute—Environment, Université Catholique de Louvain, Croix du Sud L5.07.16, B-1348 Louvain-la-Neuve, Belgium
2 International Crops Research Institute for the Semi-Arid Tropics (ICRISAT), Samanko Stn., POB 320 Bamako, Mali
3 Plant Production Systems Group, Wageningen University (WU), Droevendaalsesteeg 1, 6708PB Wageningen, The Netherlands
Remote Sens. 2016, 8(6), 531; https://doi.org/10.3390/rs8060531 - 22 Jun 2016
Cited by 28 | Viewed by 11992
Abstract
Soil fertility in smallholder farming areas is known to vary strongly on multiple scales. This study measures the sensitivity of the recorded satellite signal to on-farm soil fertility treatments applied to five crop types, and quantifies this fertilization effect with respect to within-field [...] Read more.
Soil fertility in smallholder farming areas is known to vary strongly on multiple scales. This study measures the sensitivity of the recorded satellite signal to on-farm soil fertility treatments applied to five crop types, and quantifies this fertilization effect with respect to within-field variation, between-field variation and field position in the catena. Plant growth was assessed in 5–6 plots per field in 48 fields located in the Sudano-Sahelian agro-ecological zone of southeastern Mali. A unique series of Very High Resolution (VHR) satellite and Unmanned Aerial Vehicle (UAV) images were used to calculate the Normalized Difference Vegetation Index (NDVI). In this experiment, for half of the fields at least 50% of the NDVI variance within a field was due to fertilization. Moreover, the sensitivity of NDVI to fertilizer application was crop-dependent and varied through the season, with optima at the end of August for peanut and cotton and early October for sorghum and maize. The influence of fertilizer on NDVI was comparatively small at the landscape scale (up to 35% of total variation), relative to the influence of other components of variation such as field management and catena position. The NDVI response could only partially be benchmarked against a fertilization reference within the field. We conclude that comparisons of the spatial and temporal responses of NDVI, with respect to fertilization and crop management, requires a stratification of soil catena-related crop growth conditions at the landscape scale. Full article
(This article belongs to the Special Issue Remote Sensing in Precision Agriculture)
Show Figures

Graphical abstract

19 pages, 15942 KiB  
Article
Deformation and Related Slip Due to the 2011 Van Earthquake (Turkey) Sequence Imaged by SAR Data and Numerical Modeling
by Elisa Trasatti *, Cristiano Tolomei, Giuseppe Pezzo, Simone Atzori and Stefano Salvi
Istituto Nazionale di Geofisica e Vulcanologia, Rome 00143, Italy
Remote Sens. 2016, 8(6), 532; https://doi.org/10.3390/rs8060532 - 22 Jun 2016
Cited by 8 | Viewed by 7927
Abstract
A Mw 7.1 earthquake struck the Eastern Anatolia, near the city of Van (Turkey), on 23 October 2011. We investigated the coseismic surface displacements using the InSAR technique, exploiting adjacent ENVISAT tracks and COSMO-SkyMed images. Multi aperture interferometry was also applied, measuring ground [...] Read more.
A Mw 7.1 earthquake struck the Eastern Anatolia, near the city of Van (Turkey), on 23 October 2011. We investigated the coseismic surface displacements using the InSAR technique, exploiting adjacent ENVISAT tracks and COSMO-SkyMed images. Multi aperture interferometry was also applied, measuring ground displacements in the azimuth direction. We solved for the fault geometry and mechanism, and we inverted the slip distribution employing a numerical forward model that includes the available regional structural data. Results show a horizontally elongated high slip area (7–9 m) at 12–17 km depth, while the upper part of the fault results unruptured, enhancing its seismogenic potential. We also investigated the post-seismic phase acquiring most of the available COSMO-SkyMed, ENVISAT and TERRASAR-X SAR images. The computed afterslip distributions show that the shallow section of the fault underwent considerable aseismic slip during the early days after the mainshock, of tens of centimeters. Our results support the hypothesis of a seismogenic potential reduction within the first 8–10 km of the fault through the energy release during the post-seismic phase. Despite non-optimal data coverage and coherence issues, we demonstrate that useful information about the Van earthquake could still be retrieved from SAR data through detailed analysis. Full article
(This article belongs to the Special Issue Earth Observations for Geohazards)
Show Figures

Graphical abstract

Review

Jump to: Editorial, Research, Other

29 pages, 2171 KiB  
Review
Slums from Space—15 Years of Slum Mapping Using Remote Sensing
by Monika Kuffer 1,*, Karin Pfeffer 2 and Richard Sliuzas 1
1 Faculty of Geo-Information Science and Earth Observation (ITC), University of Twente, PO Box 217, 7500 AE Enschede, The Netherlands
2 Faculty of Social and Behavioural Sciences, University of Amsterdam, Nieuwe Achtergracht 166, 1018 WV Amsterdam, The Netherlands
Remote Sens. 2016, 8(6), 455; https://doi.org/10.3390/rs8060455 - 27 May 2016
Cited by 285 | Viewed by 32027
Abstract
The body of scientific literature on slum mapping employing remote sensing methods has increased since the availability of more very-high-resolution (VHR) sensors. This improves the ability to produce information for pro-poor policy development and to build methods capable of supporting systematic global slum [...] Read more.
The body of scientific literature on slum mapping employing remote sensing methods has increased since the availability of more very-high-resolution (VHR) sensors. This improves the ability to produce information for pro-poor policy development and to build methods capable of supporting systematic global slum monitoring required for international policy development such as the Sustainable Development Goals. This review provides an overview of slum mapping-related remote sensing publications over the period of 2000–2015 regarding four dimensions: contextual factors, physical slum characteristics, data and requirements, and slum extraction methods. The review has shown the following results. First, our contextual knowledge on the diversity of slums across the globe is limited, and slum dynamics are not well captured. Second, a more systematic exploration of physical slum characteristics is required for the development of robust image-based proxies. Third, although the latest commercial sensor technologies provide image data of less than 0.5 m spatial resolution, thereby improving object recognition in slums, the complex and diverse morphology of slums makes extraction through standard methods difficult. Fourth, successful approaches show diversity in terms of extracted information levels (area or object based), implemented indicator sets (single or large sets) and methods employed (e.g., object-based image analysis (OBIA) or machine learning). In the context of a global slum inventory, texture-based methods show good robustness across cities and imagery. Machine-learning algorithms have the highest reported accuracies and allow working with large indicator sets in a computationally efficient manner, while the upscaling of pixel-level information requires further research. For local slum mapping, OBIA approaches show good capabilities of extracting both area- and object-based information. Ultimately, establishing a more systematic relationship between higher-level image elements and slum characteristics is essential to train algorithms able to analyze variations in slum morphologies to facilitate global slum monitoring. Full article
Show Figures

Graphical abstract

29 pages, 728 KiB  
Review
Application of Remote Sensing Data to Constrain Operational Rainfall-Driven Flood Forecasting: A Review
by Yuan Li *, Stefania Grimaldi, Jeffrey P. Walker and Valentijn R. N. Pauwels
Department of Civil Engineering, Monash University, Clayton, Victoria 3800, Australia
Remote Sens. 2016, 8(6), 456; https://doi.org/10.3390/rs8060456 - 28 May 2016
Cited by 73 | Viewed by 11450
Abstract
Fluvial flooding is one of the most catastrophic natural disasters threatening people’s lives and possessions. Flood forecasting systems, which simulate runoff generation and propagation processes, provide information to support flood warning delivery and emergency response. The forecasting models need to be driven by [...] Read more.
Fluvial flooding is one of the most catastrophic natural disasters threatening people’s lives and possessions. Flood forecasting systems, which simulate runoff generation and propagation processes, provide information to support flood warning delivery and emergency response. The forecasting models need to be driven by input data and further constrained by historical and real-time observations using batch calibration and/or data assimilation techniques so as to produce relatively accurate and reliable flow forecasts. Traditionally, flood forecasting models are forced, calibrated and updated using in-situ measurements, e.g., gauged precipitation and discharge. The rapid development of hydrologic remote sensing offers a potential to provide additional/alternative forcing and constraint to facilitate timely and reliable forecasts. This has brought increasing interest to exploring the use of remote sensing data for flood forecasting. This paper reviews the recent advances on integration of remotely sensed precipitation and soil moisture with rainfall-runoff models for rainfall-driven flood forecasting. Scientific and operational challenges on the effective and optimal integration of remote sensing data into forecasting models are discussed. Full article
Show Figures

Figure 1

21 pages, 818 KiB  
Review
In Situ/Remote Sensing Integration to Assess Forest Health—A Review
by Marion Pause 1,*, Christian Schweitzer 2, Michael Rosenthal 3, Vanessa Keuck 4, Jan Bumberger 1, Peter Dietrich 1, Marco Heurich 5, András Jung 6 and Angela Lausch 7
1 Department Monitoring & Exploration Technologies, Helmholtz Center for Environmental Research—UFZ, Permoserstr. 15, D-04318 Leipzig, Germany
2 German Environment Agency, Wörlitzer Platz 1, D-06844 Dessau-Roßlau, Germany
3 Chair of Forest Utilization, Technische Universität Dresden, Pienner Str. 19, D-01737 Tharandt, Germany
4 German Aerospace Center, Space Administration, Koenigswinterer Str. 522-524, D-53227 Bonn, Germany
5 Bavarian Forest National Park, Department of Conservation and Research, Freyunger Straße 2, 94481 Grafenau, Germany
6 MTA-SZIE Plant Ecological Research Group, Szent István University (SZIU), 2100, Gödöllő, Páter Károly u. 1. and SZIU Technical Department, 1118 Budapest, Villányi út 29-43, Hungary
7 Department Computational Landscape Ecology, Helmholtz Center for Environmental Research—UFZ, Permoser Street 15, 04318 Leipzig, Germany
Remote Sens. 2016, 8(6), 471; https://doi.org/10.3390/rs8060471 - 3 Jun 2016
Cited by 105 | Viewed by 19277
Abstract
For mapping, quantifying and monitoring regional and global forest health, satellite remote sensing provides fundamental data for the observation of spatial and temporal forest patterns and processes. While new remote-sensing technologies are able to detect forest data in high quality and large quantity, [...] Read more.
For mapping, quantifying and monitoring regional and global forest health, satellite remote sensing provides fundamental data for the observation of spatial and temporal forest patterns and processes. While new remote-sensing technologies are able to detect forest data in high quality and large quantity, operational applications are still limited by deficits of in situ verification. In situ sampling data as input is required in order to add value to physical imaging remote sensing observations and possibilities to interlink the forest health assessment with biotic and abiotic factors. Numerous methods on how to link remote sensing and in situ data have been presented in the scientific literature using e.g. empirical and physical-based models. In situ data differs in type, quality and quantity between case studies. The irregular subsets of in situ data availability limit the exploitation of available satellite remote sensing data. To achieve a broad implementation of satellite remote sensing data in forest monitoring and management, a standardization of in situ data, workflows and products is essential and necessary for user acceptance. The key focus of the review is a discussion of concept and is designed to bridge gaps of understanding between forestry and remote sensing science community. Methodological approaches for in situ/remote-sensing implementation are organized and evaluated with respect to qualifying for forest monitoring. Research gaps and recommendations for standardization of remote-sensing based products are discussed. Concluding the importance of outstanding organizational work to provide a legally accepted framework for new information products in forestry are highlighted. Full article
(This article belongs to the Special Issue Remote Sensing of Forest Health)
Show Figures

Graphical abstract

Other

8 pages, 25560 KiB  
Technical Note
Joint Terrestrial and Aerial Measurements to Study Ground Deformation: Application to the Sciara Del Fuoco at the Stromboli Volcano (Sicily)
by Alessandro Bonforte 1,*, Pablo J. González 2 and José Fernández 3
1 Istituto Nazionale di Geofisica e Vulcanologia, Sezione di Catania-Osservatorio Etneo, Catania 95125, Italy
2 COMET, Institute of Geophysics and Tectonics, School of Earth and Environment, University of Leeds, Leeds LS2 9JT, UK
3 Institute of Geosciences, CSIC, UCM, School of Mathematics, Ciudad Universitaria, 28040-Madrid, Spain
Remote Sens. 2016, 8(6), 463; https://doi.org/10.3390/rs8060463 - 31 May 2016
Cited by 9 | Viewed by 4775
Abstract
The 2002–2003 Stromboli eruption triggered the failure of part of the Sciara del Fuoco slope, which generated a tsunami that struck the island and the northern coastline of Sicily. The Sciara del Fuoco is a very steep slope where all lava flows from [...] Read more.
The 2002–2003 Stromboli eruption triggered the failure of part of the Sciara del Fuoco slope, which generated a tsunami that struck the island and the northern coastline of Sicily. The Sciara del Fuoco is a very steep slope where all lava flows from the craters’ emplacement; most lateral eruptions usually take place from fissures propagating in this sector of the volcano. The eruption went on to produce a lava field that filled the area affected by the landslide. This in turn led to further instability, renewing the threat of another slope failure and a potentially related tsunami. This work describes a new joint approach, combining surveying data and aerial image correlometry methods, to study the motion of this unstable slope. The combination has the advantage of very precise surveying measurements, which can be considered the ground truth to constrain the very-high-resolution aerial photogrammetric data, thereby obtaining highly detailed and accurate ground deformation maps. The joint use of the two methods can be very useful to obtain a more complete image of the deformation field for monitoring dangerous and/or rather inaccessible places. The proposed combined methodology improves our ability to study and assess hazardous processes associated with significant ground deformation. Full article
Show Figures

Graphical abstract

18 pages, 14204 KiB  
Technical Note
Assessing the Accuracy of High Resolution Digital Surface Models Computed by PhotoScan® and MicMac® in Sub-Optimal Survey Conditions
by Marion Jaud 1,*, Sophie Passot 2, Réjanne Le Bivic 1, Christophe Delacourt 1, Philippe Grandjean 2 and Nicolas Le Dantec 1,3
1 Laboratoire Domaines Océaniques—UMR 6538, Université de Bretagne Occidentale, IUEM, Technopôle Brest-Iroise, Rue Dumont D’Urville, F-29280 Plouzané, France
2 Laboratoire de Géologie de Lyon—UMR 5276, Université Claude Bernard Lyon 1, Campus de la Doua, 2 rue Raphaël Dubois, F-69622 Villeurbanne, France
3 CEREMA—Centre d’Etudes et d’expertise sur les Risques, l’Environnement, la Mobilité et l’Aménagement, DTecEMF, F-29280 Plouzané, France
Remote Sens. 2016, 8(6), 465; https://doi.org/10.3390/rs8060465 - 1 Jun 2016
Cited by 165 | Viewed by 13124
Abstract
For monitoring purposes and in the context of geomorphological research, Unmanned Aerial Vehicles (UAV) appear to be a promising solution to provide multi-temporal Digital Surface Models (DSMs) and orthophotographs. There are a variety of photogrammetric software tools available for UAV-based data. The objective [...] Read more.
For monitoring purposes and in the context of geomorphological research, Unmanned Aerial Vehicles (UAV) appear to be a promising solution to provide multi-temporal Digital Surface Models (DSMs) and orthophotographs. There are a variety of photogrammetric software tools available for UAV-based data. The objective of this study is to investigate the level of accuracy that can be achieved using two of these software tools: Agisoft PhotoScan® Pro and an open-source alternative, IGN© MicMac®, in sub-optimal survey conditions (rugged terrain, with a large variety of morphological features covering a range of roughness sizes, poor GPS reception). A set of UAV images has been taken by a hexacopter drone above the Rivière des Remparts, a river on Reunion Island. This site was chosen for its challenging survey conditions: the topography of the study area (i) involved constraints on the flight plan; (ii) implied errors on some GPS measurements; (iii) prevented an optimal distribution of the Ground Control Points (GCPs) and; (iv) was very complex to reconstruct. Several image processing tests are performed with different scenarios in order to analyze the sensitivity of each software package to different parameters (image quality, numbers of GCPs, etc.). When computing the horizontal and vertical errors within a control region on a set of ground reference targets, both methods provide rather similar results. A precision up to 3–4 cm is achievable with these software packages. The DSM quality is also assessed over the entire study area comparing PhotoScan DSM and MicMac DSM with a Terrestrial Laser Scanner (TLS) point cloud. PhotoScan and MicMac DSM are also compared at the scale of particular features. Both software packages provide satisfying results: PhotoScan is more straightforward to use but its source code is not open; MicMac is recommended for experimented users as it is more flexible. Full article
Show Figures

Graphical abstract

3 pages, 1073 KiB  
Erratum
Erratum: Cavender-Bares, J.; Meireles, J.E.; Couture, J.; Kaproth, M.A.; Kingdon, C.C; Singh, A; Serbin, S.P.; Center, A; Zuniga, E; Pilz, G; Townsend, P.A. Associations of Leaf Spectra with Genetic and Phylogenetic Variation in Oaks: Prospects for Remote Detection of Biodiversity. Remote Sens. 2016, 8, 221
by Remote Sensing Editorial Office
MDPI AG, Klybeckstrasse 64, CH-4057 Basel, Switzerland; Tel.: +41-61-683-7735
Remote Sens. 2016, 8(6), 475; https://doi.org/10.3390/rs8060475 - 16 Jun 2016
Viewed by 3876
Abstract
The authors would like to correct the abstract and Figures 3 and 4 of this article [1] as follows:[...] Full article
Show Figures

Figure 3

14 pages, 16299 KiB  
Letter
Analysis of Aerosol Radiative Forcing over Beijing under Different Air Quality Conditions Using Ground-Based Sun-Photometers between 2013 and 2015
by Wei Chen 1,2,3,*, Lei Yan 2,*, Nan Ding 1, Mengdie Xie 1, Ming Lu 1, Fan Zhang 1, Yongxu Duan 1 and Shuo Zong 1
1 School of Geoscience and Surveying Engineering, China University of Mining and Technology, Beijing 100083, China
2 Beijing Key Lab of Spatial Information Integration and Its Applications, Peking University, Beijing 100871, China
3 State Key Laboratory of Remote Sensing Science, Beijing Normal University, Beijing 100875, China
Remote Sens. 2016, 8(6), 510; https://doi.org/10.3390/rs8060510 - 17 Jun 2016
Cited by 8 | Viewed by 6341
Abstract
Aerosol particles can strongly affect both air quality and the radiation budget of the atmosphere. Above Beijing, the capital city of China, large amounts of aerosols within the atmospheric column have caused the deterioration of local air quality and have influenced radiative forcings [...] Read more.
Aerosol particles can strongly affect both air quality and the radiation budget of the atmosphere. Above Beijing, the capital city of China, large amounts of aerosols within the atmospheric column have caused the deterioration of local air quality and have influenced radiative forcings at both the top and the bottom of the atmosphere (BOA and TOA). Observations of aerosol radiative forcing and its efficiency have been made using two sun-photometers in urban Beijing between 2013 and 2015, and have been analyzed alongside two air quality monitoring stations’ data by dividing air quality conditions into unpolluted, moderately polluted, and heavily polluted days. Daily average PM2.5 concentrations varied greatly in urban Beijing (5.5–485.0 µg/m3) and more than one-third of the analyzed period is classified as being polluted according to the national ambient air quality standards of China. The heavily polluted days had the largest bottom of atmosphere (BOA) and top of atmosphere (TOA) radiative forcings, but the smallest radiative forcing efficiencies, while the unpolluted days showed the opposite characteristics. On heavily polluted days, the averaged BOA aerosol radiative forcing occasionally exceeded −150 W/m2, which represents a value about three-times greater than that for unpolluted days. BOA aerosol radiative forcing was around two-to-three times as large as TOA aerosol radiative forcing under various air quality conditions, although both were mostly negative, suggesting that aerosols had different magnitudes of cooling effects at both the surface and the top of the atmosphere. Unpolluted days had the largest average values of aerosol radiative forcing efficiencies at BOA (and TOA) levels, which exceeded −190 W/m2 (−70 W/m2), compared with the lowest average values in heavily polluted days of around −120 W/m2 (−55 W/m2). These results suggest that the high concentrations of particulate matter pollution in the urban Beijing area had a strong cooling effect at both BOA and TOA levels. Full article
Show Figures

Graphical abstract

2 pages, 1048 KiB  
Erratum
Erratum: Dupuy, E.; et al. Comparison of XH2O Retrieved from GOSAT Short-Wavelength Infrared Spectra with Observations from the TCCON Network. Remote Sensing 2016, 8, 414
by Remote Sensing Editorial Office
MDPI AG, Klybeckstrasse 64, CH-4057 Basel, Switzerland
Remote Sens. 2016, 8(6), 527; https://doi.org/10.3390/rs8060527 - 22 Jun 2016
Viewed by 3525
Abstract
In the published paper [1], the plot sizes of Figures 4, 6 and 9 were incorrect.[...] Full article
Show Figures

Figure 4

Previous Issue
Next Issue
Back to TopTop