
Identification of Woodland Vernal Pools with Seasonal Change PALSAR Data for Habitat Conservation

Abstract
:
1. Introduction
2. Materials and Methods
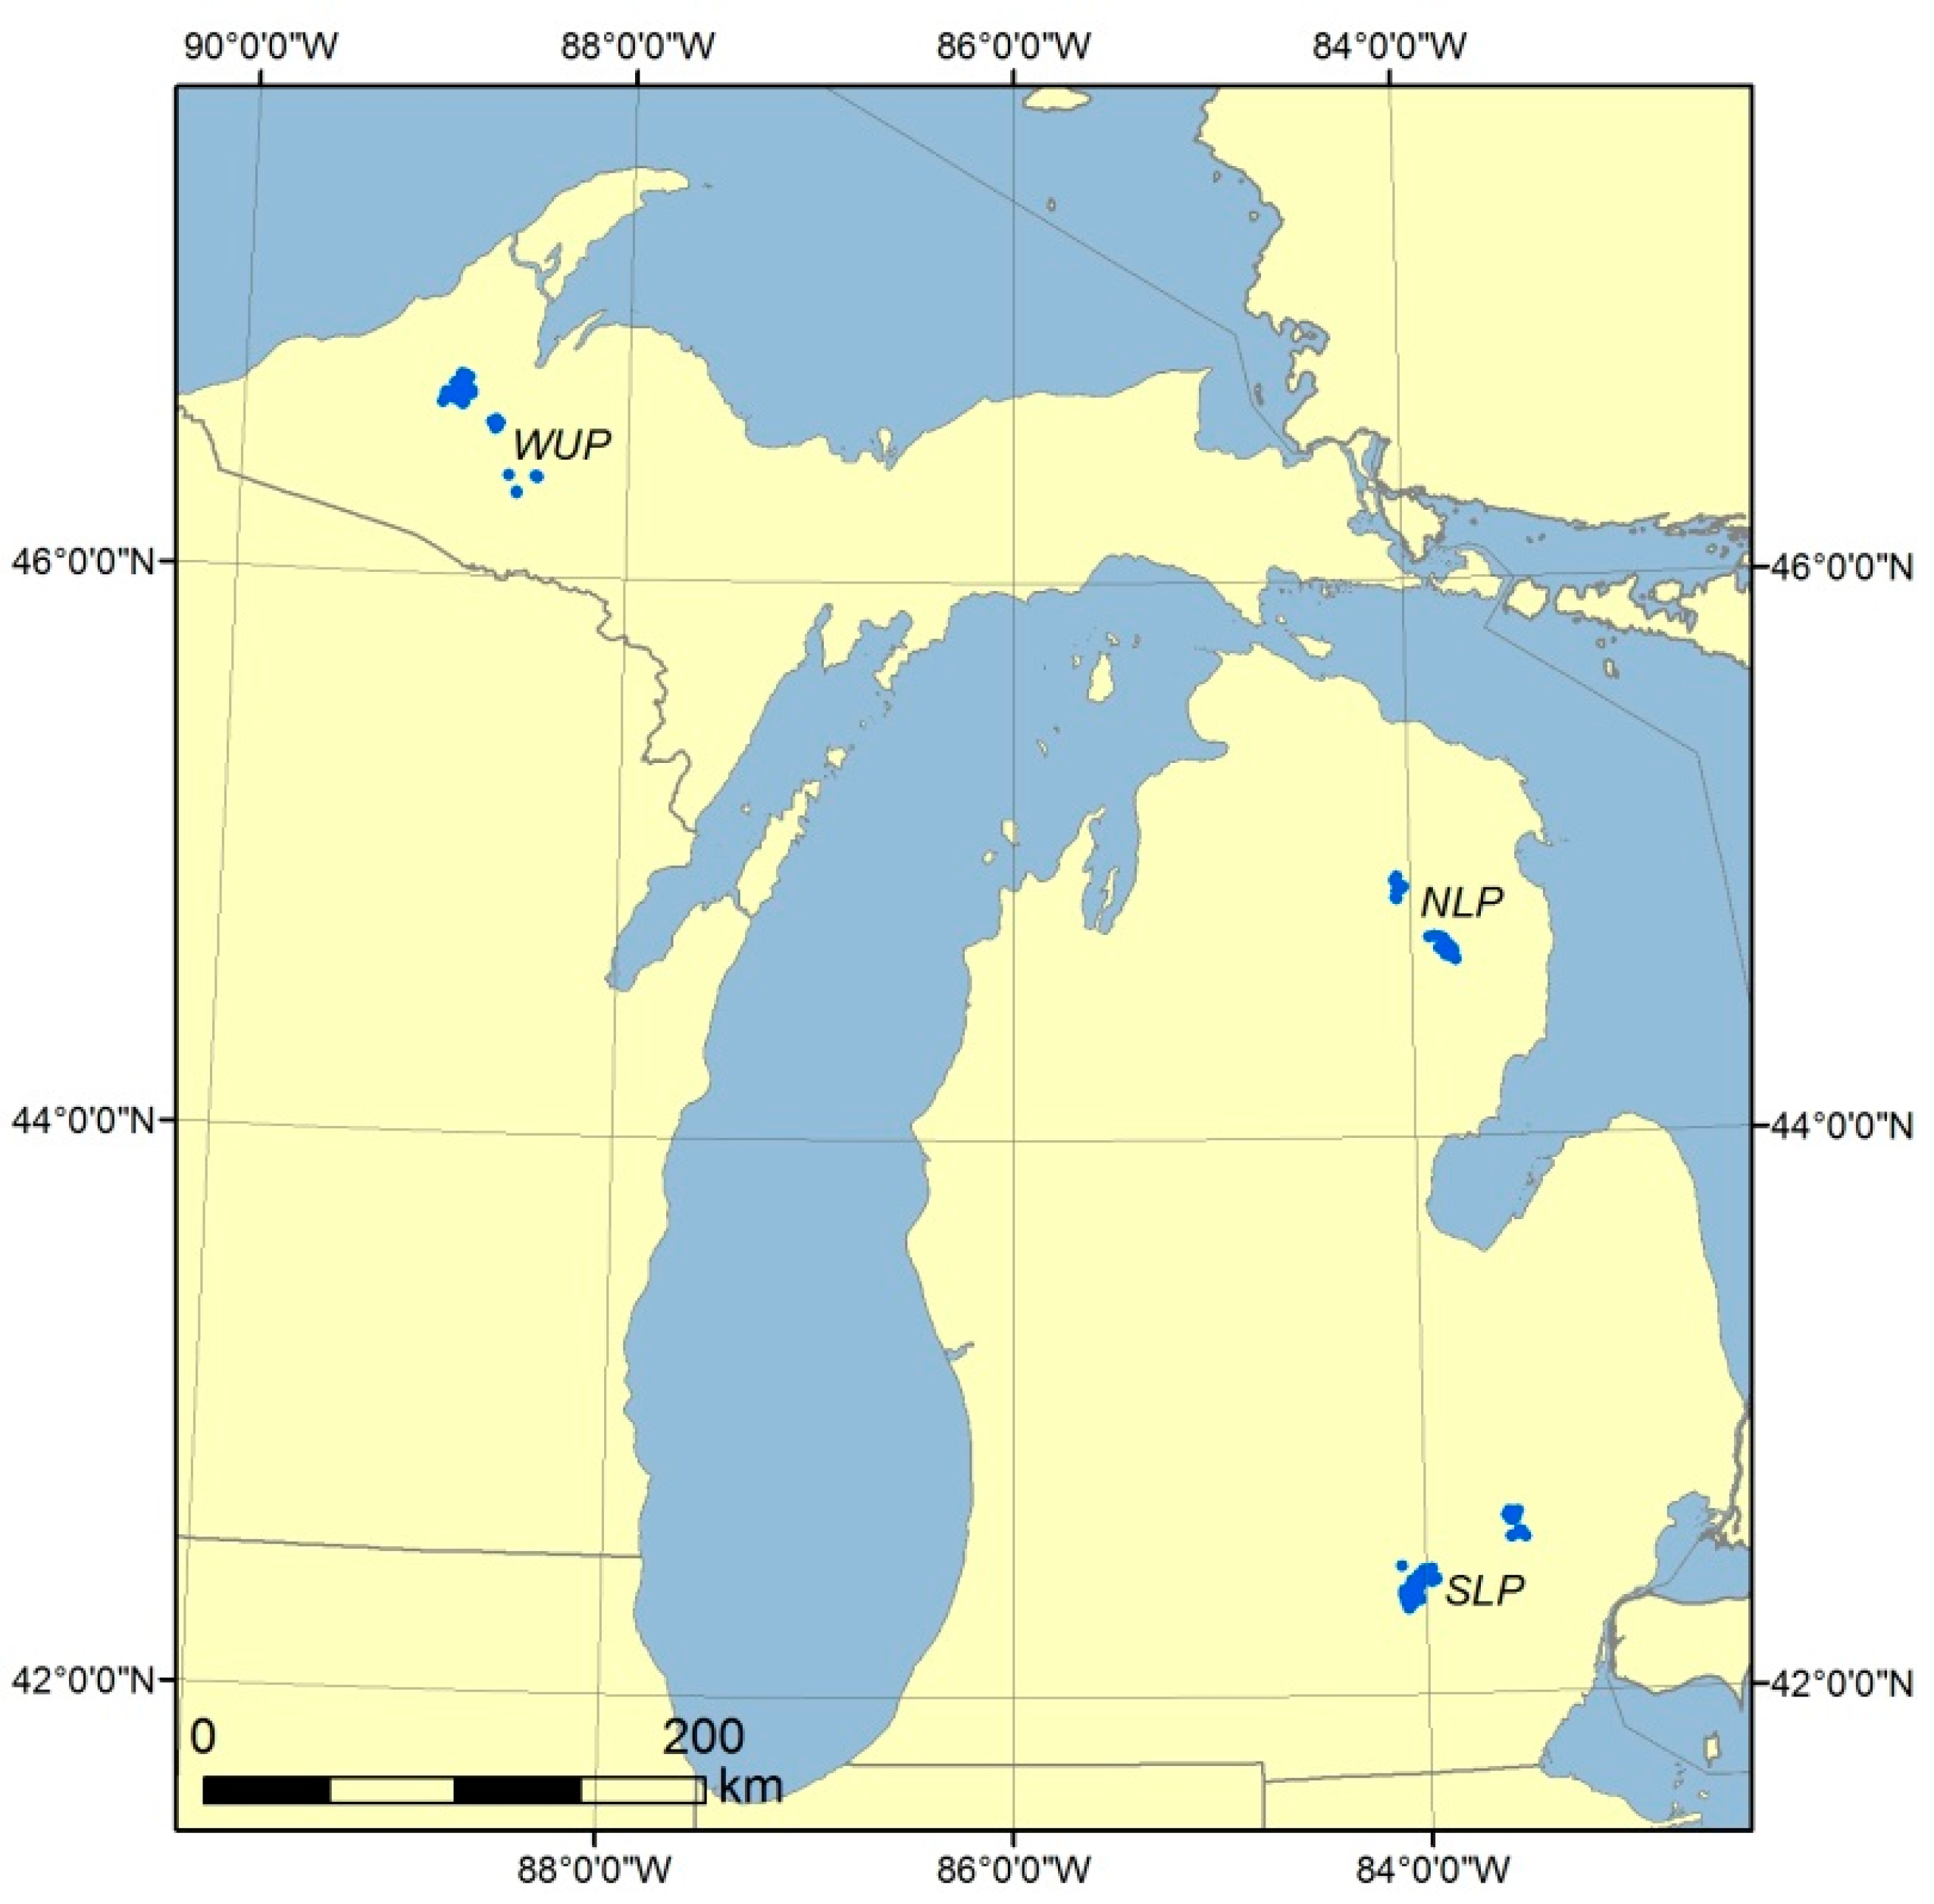
2.1. Criteria for Selection of Study Areas
2.2. Field Sampling Methods
Sampling Design and Surveying Methods
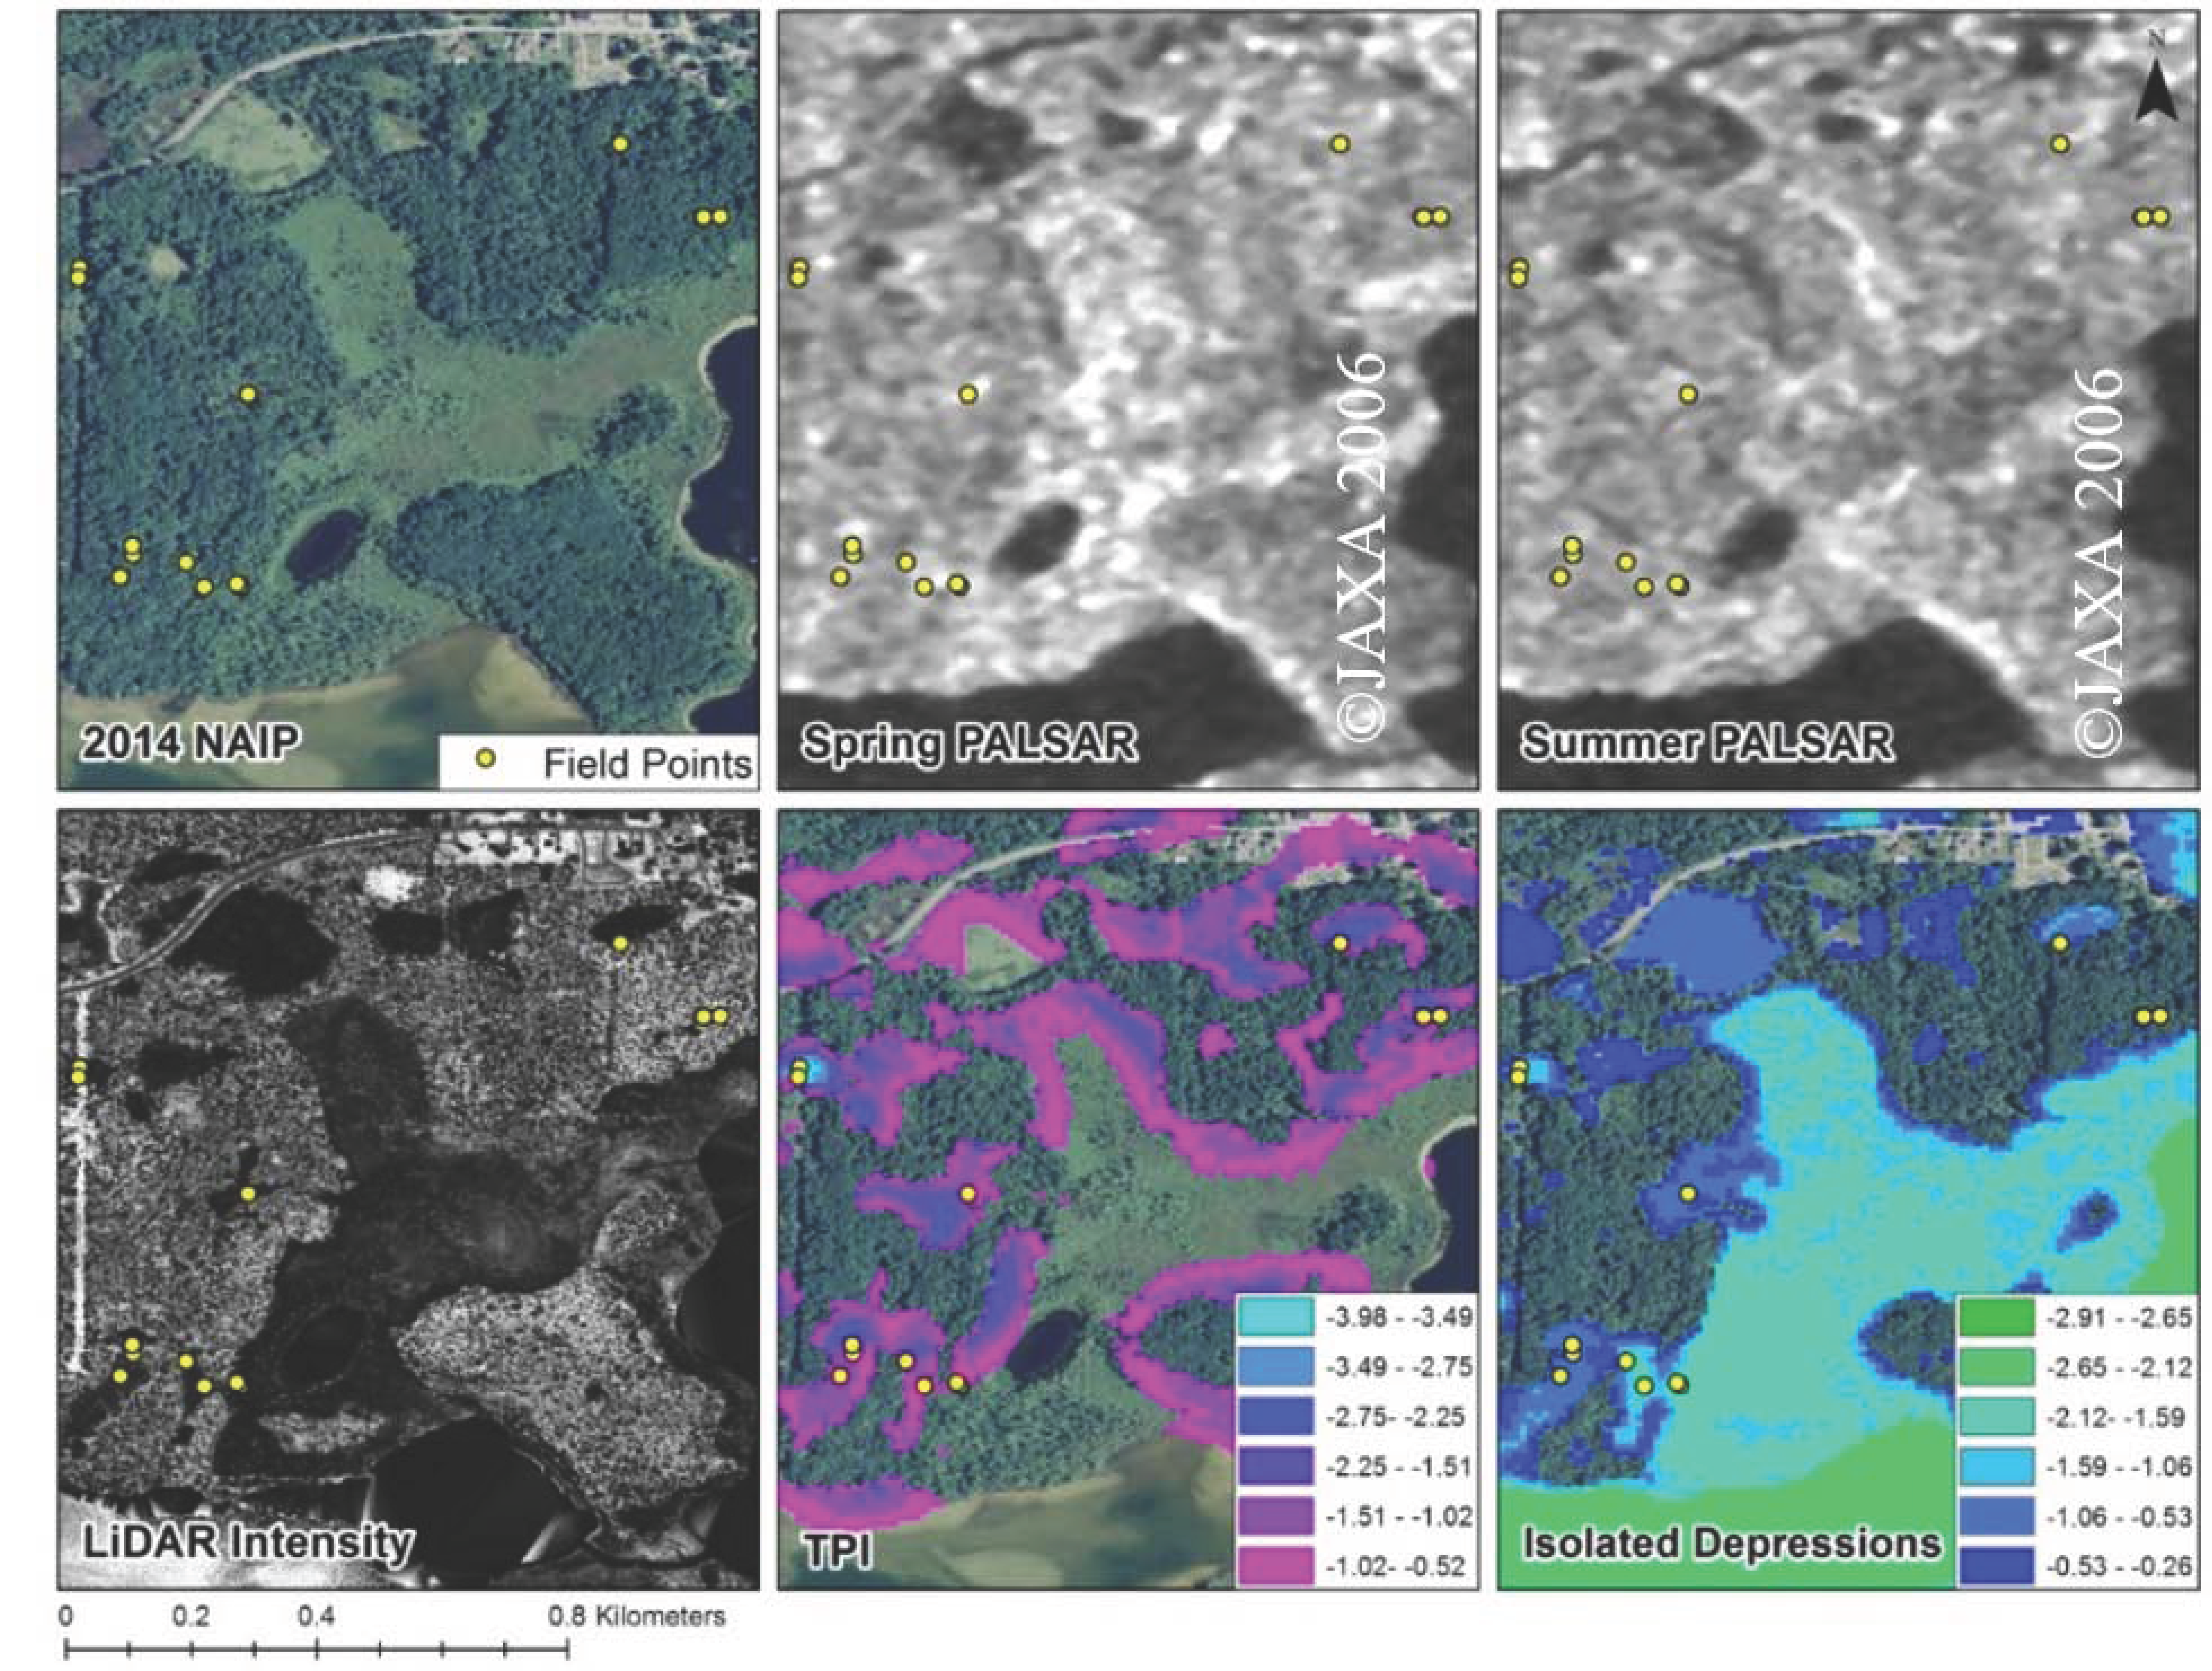
2.3. Remote Sensing Datasets
2.3.1. LiDAR
2.3.2. USGS 10 m DEM
Development of Isolated Depressions Maps from USGS DEM
Development of the TPI from USGS DEM
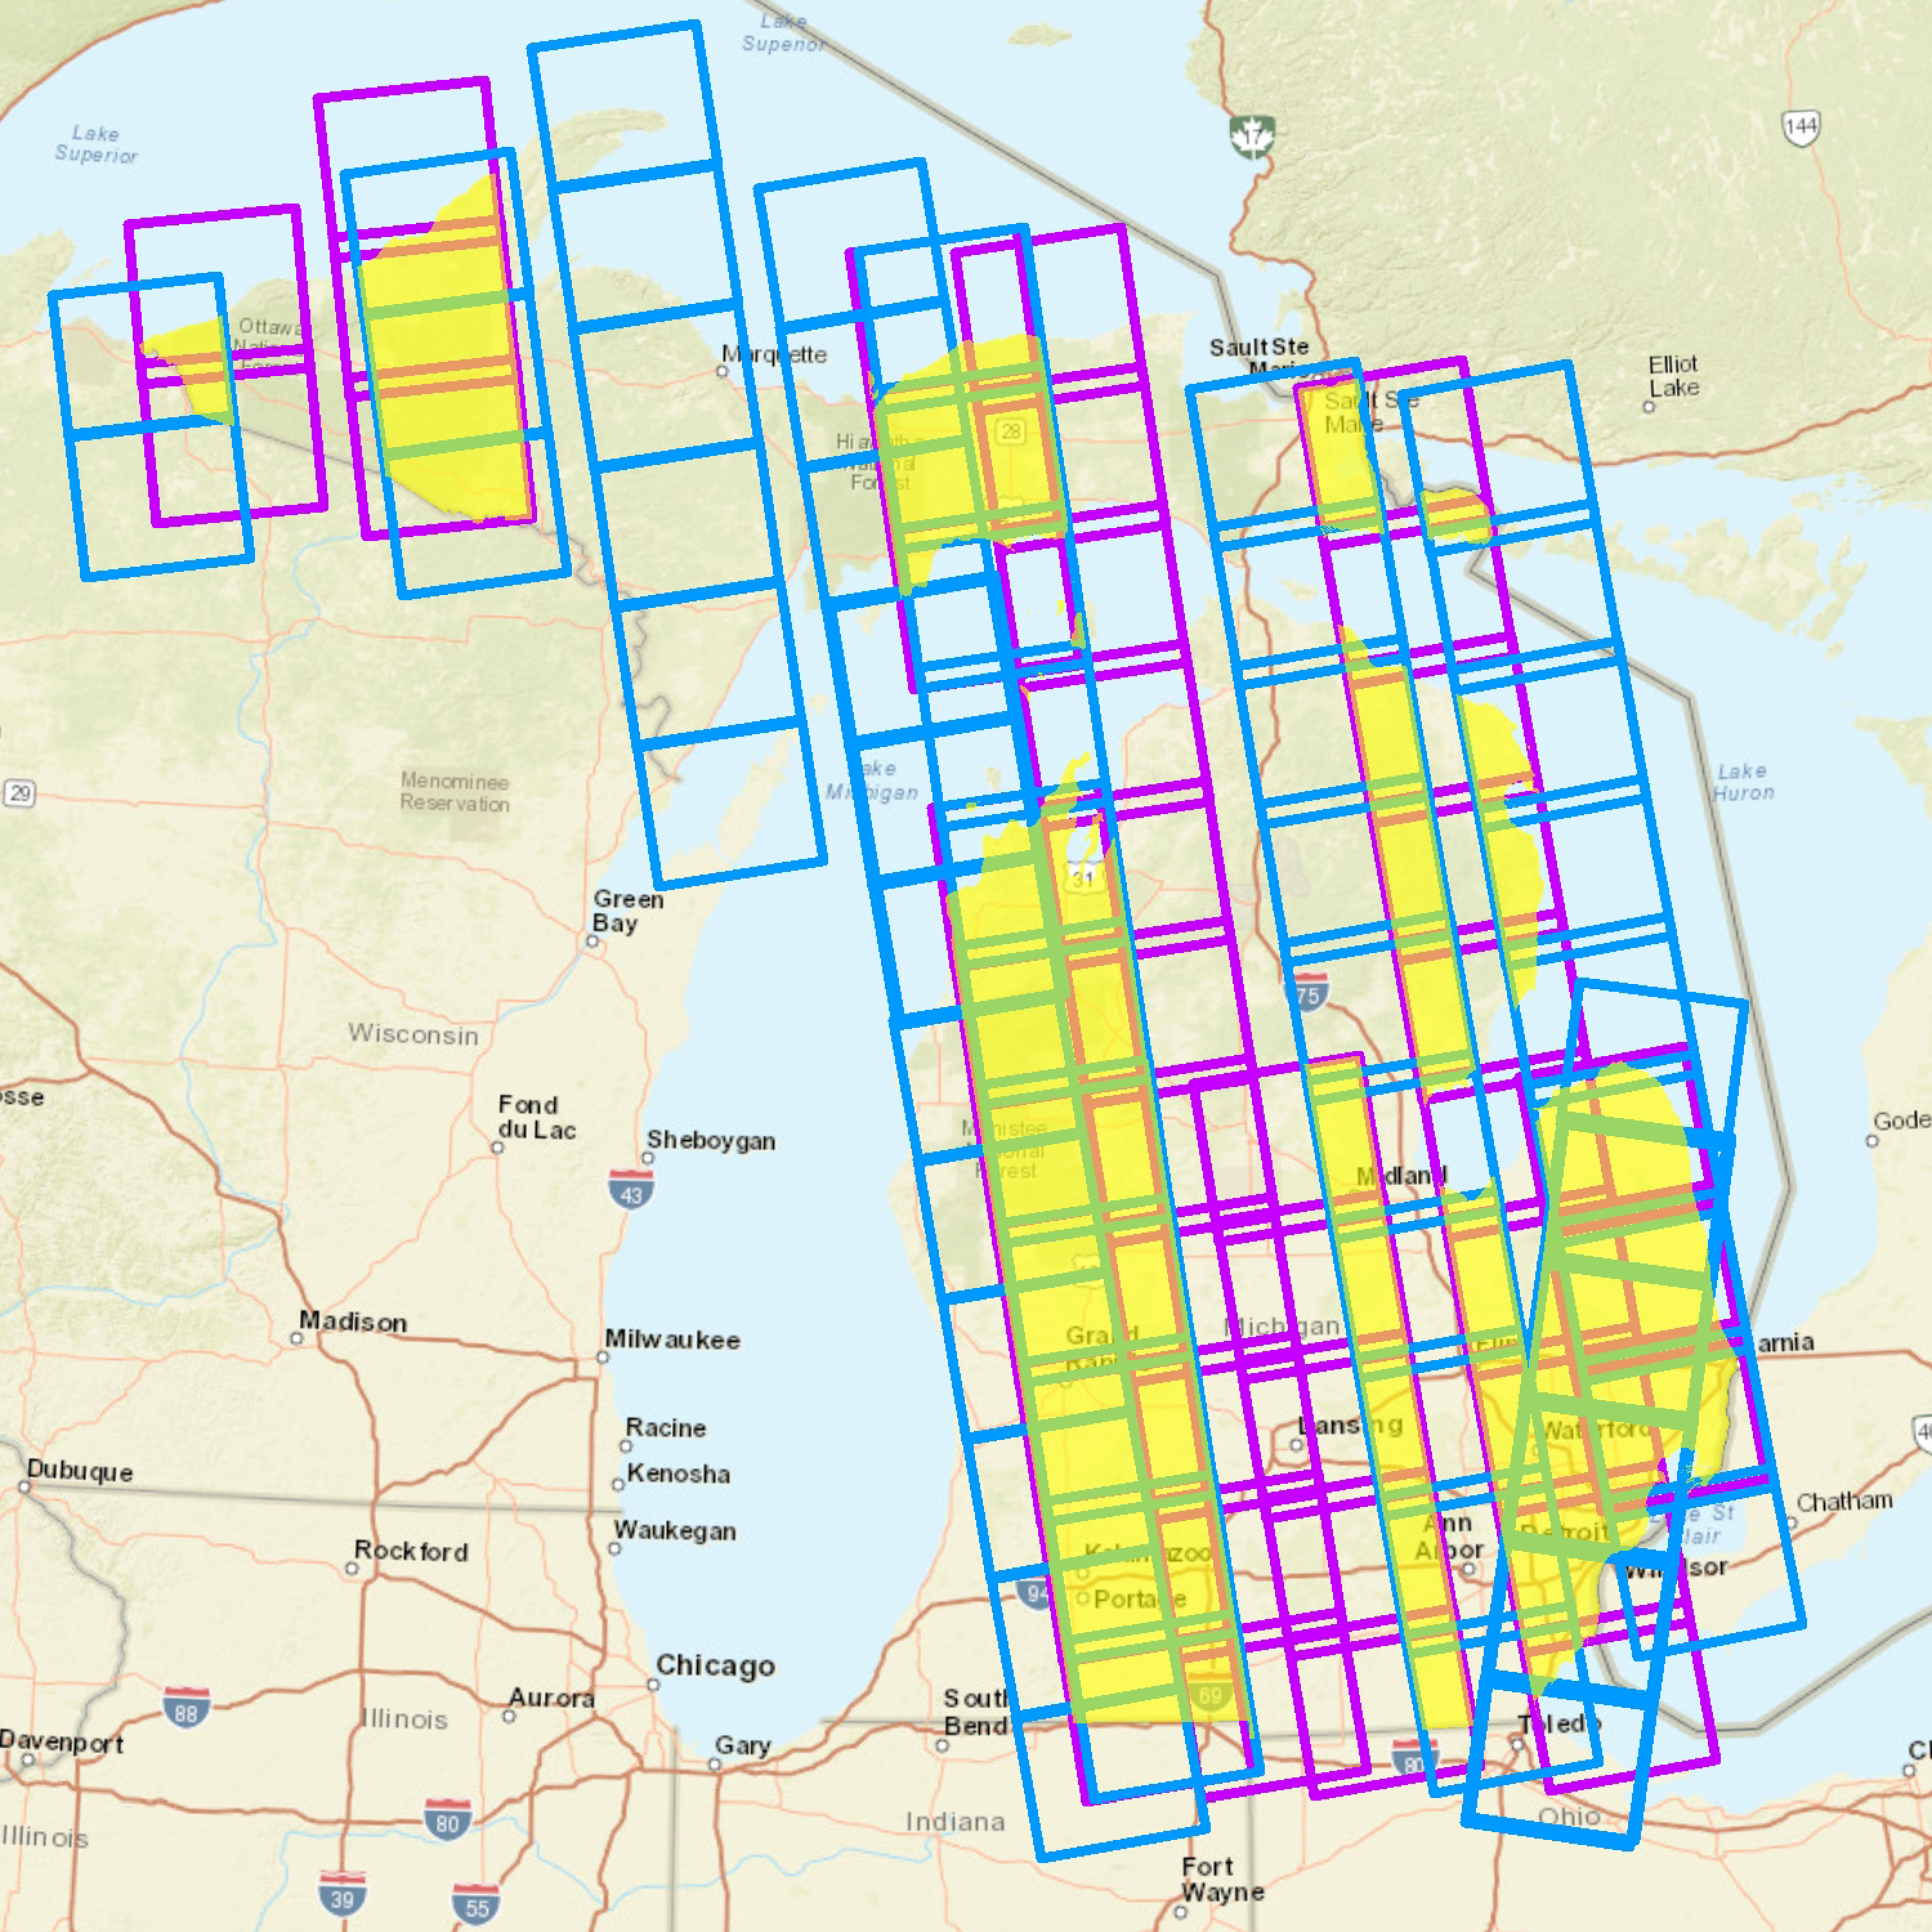
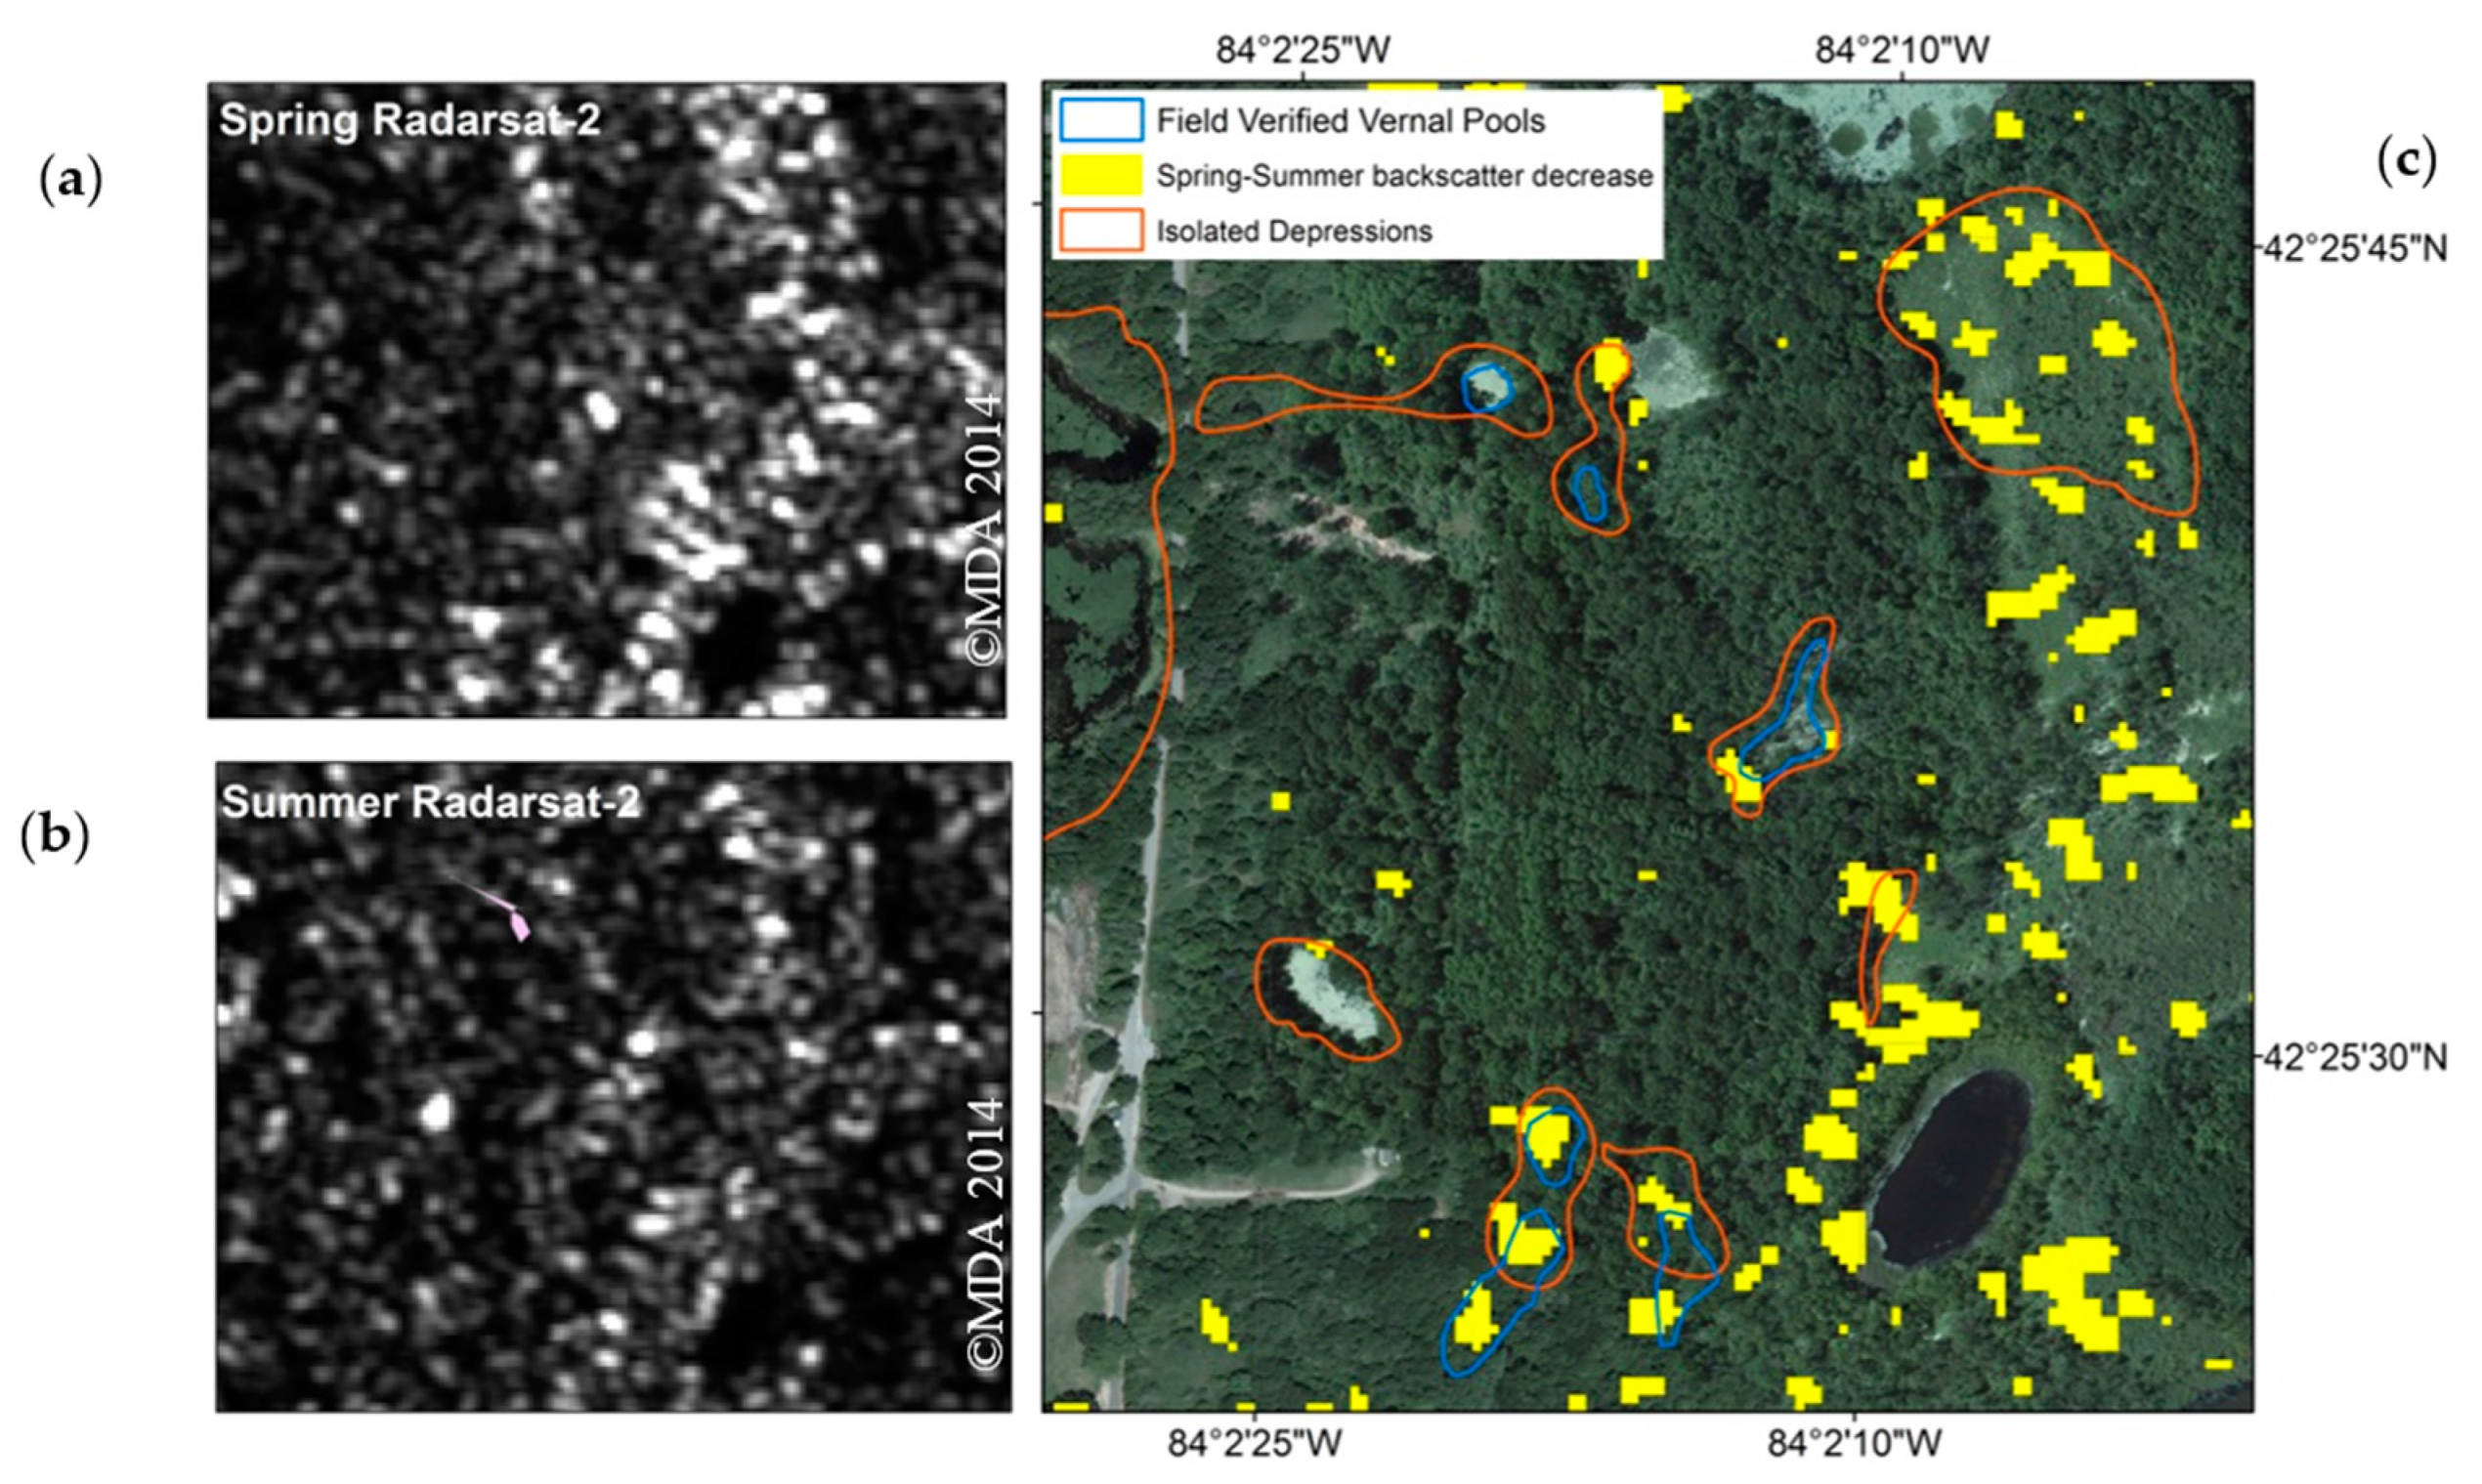
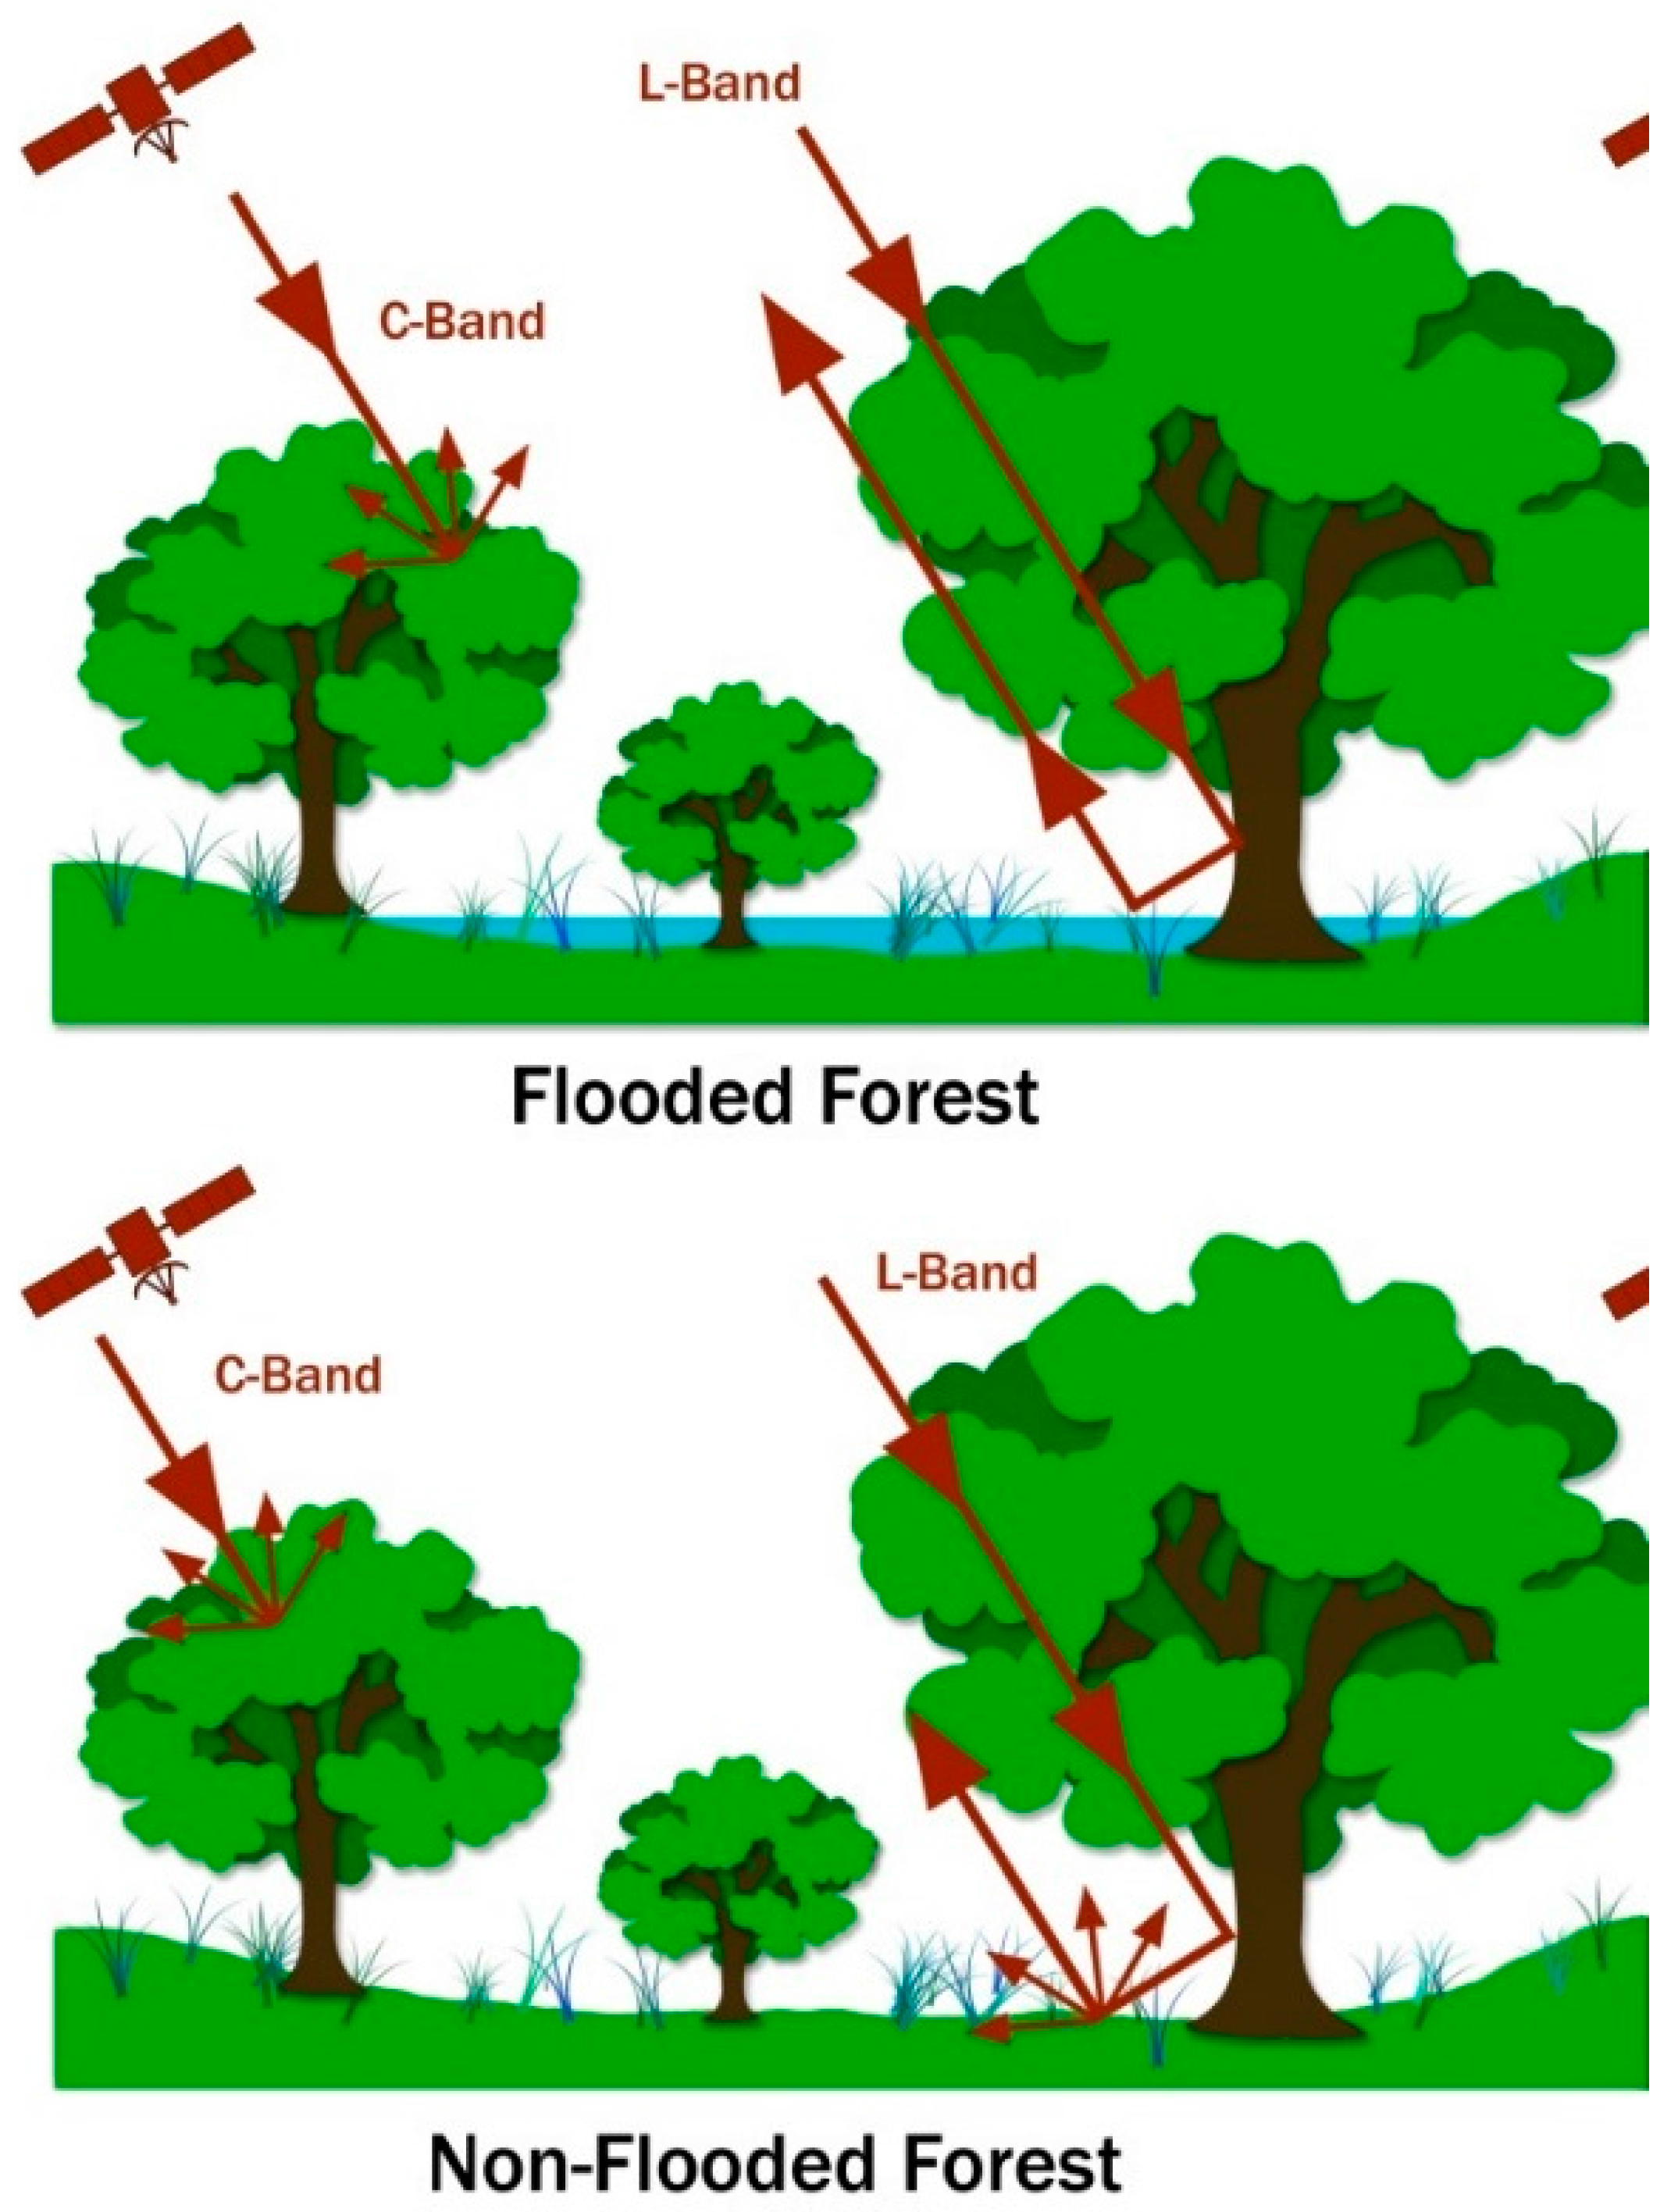
2.3.3. SAR Data
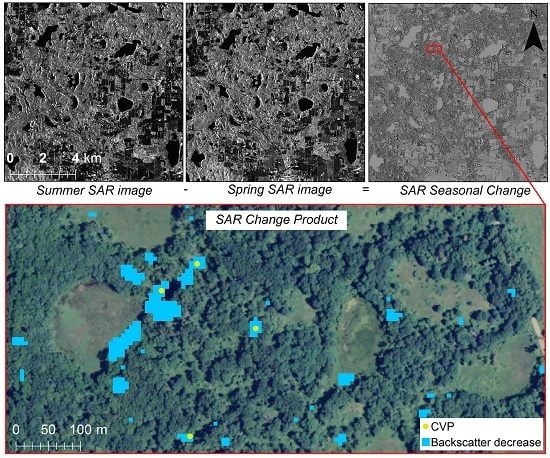
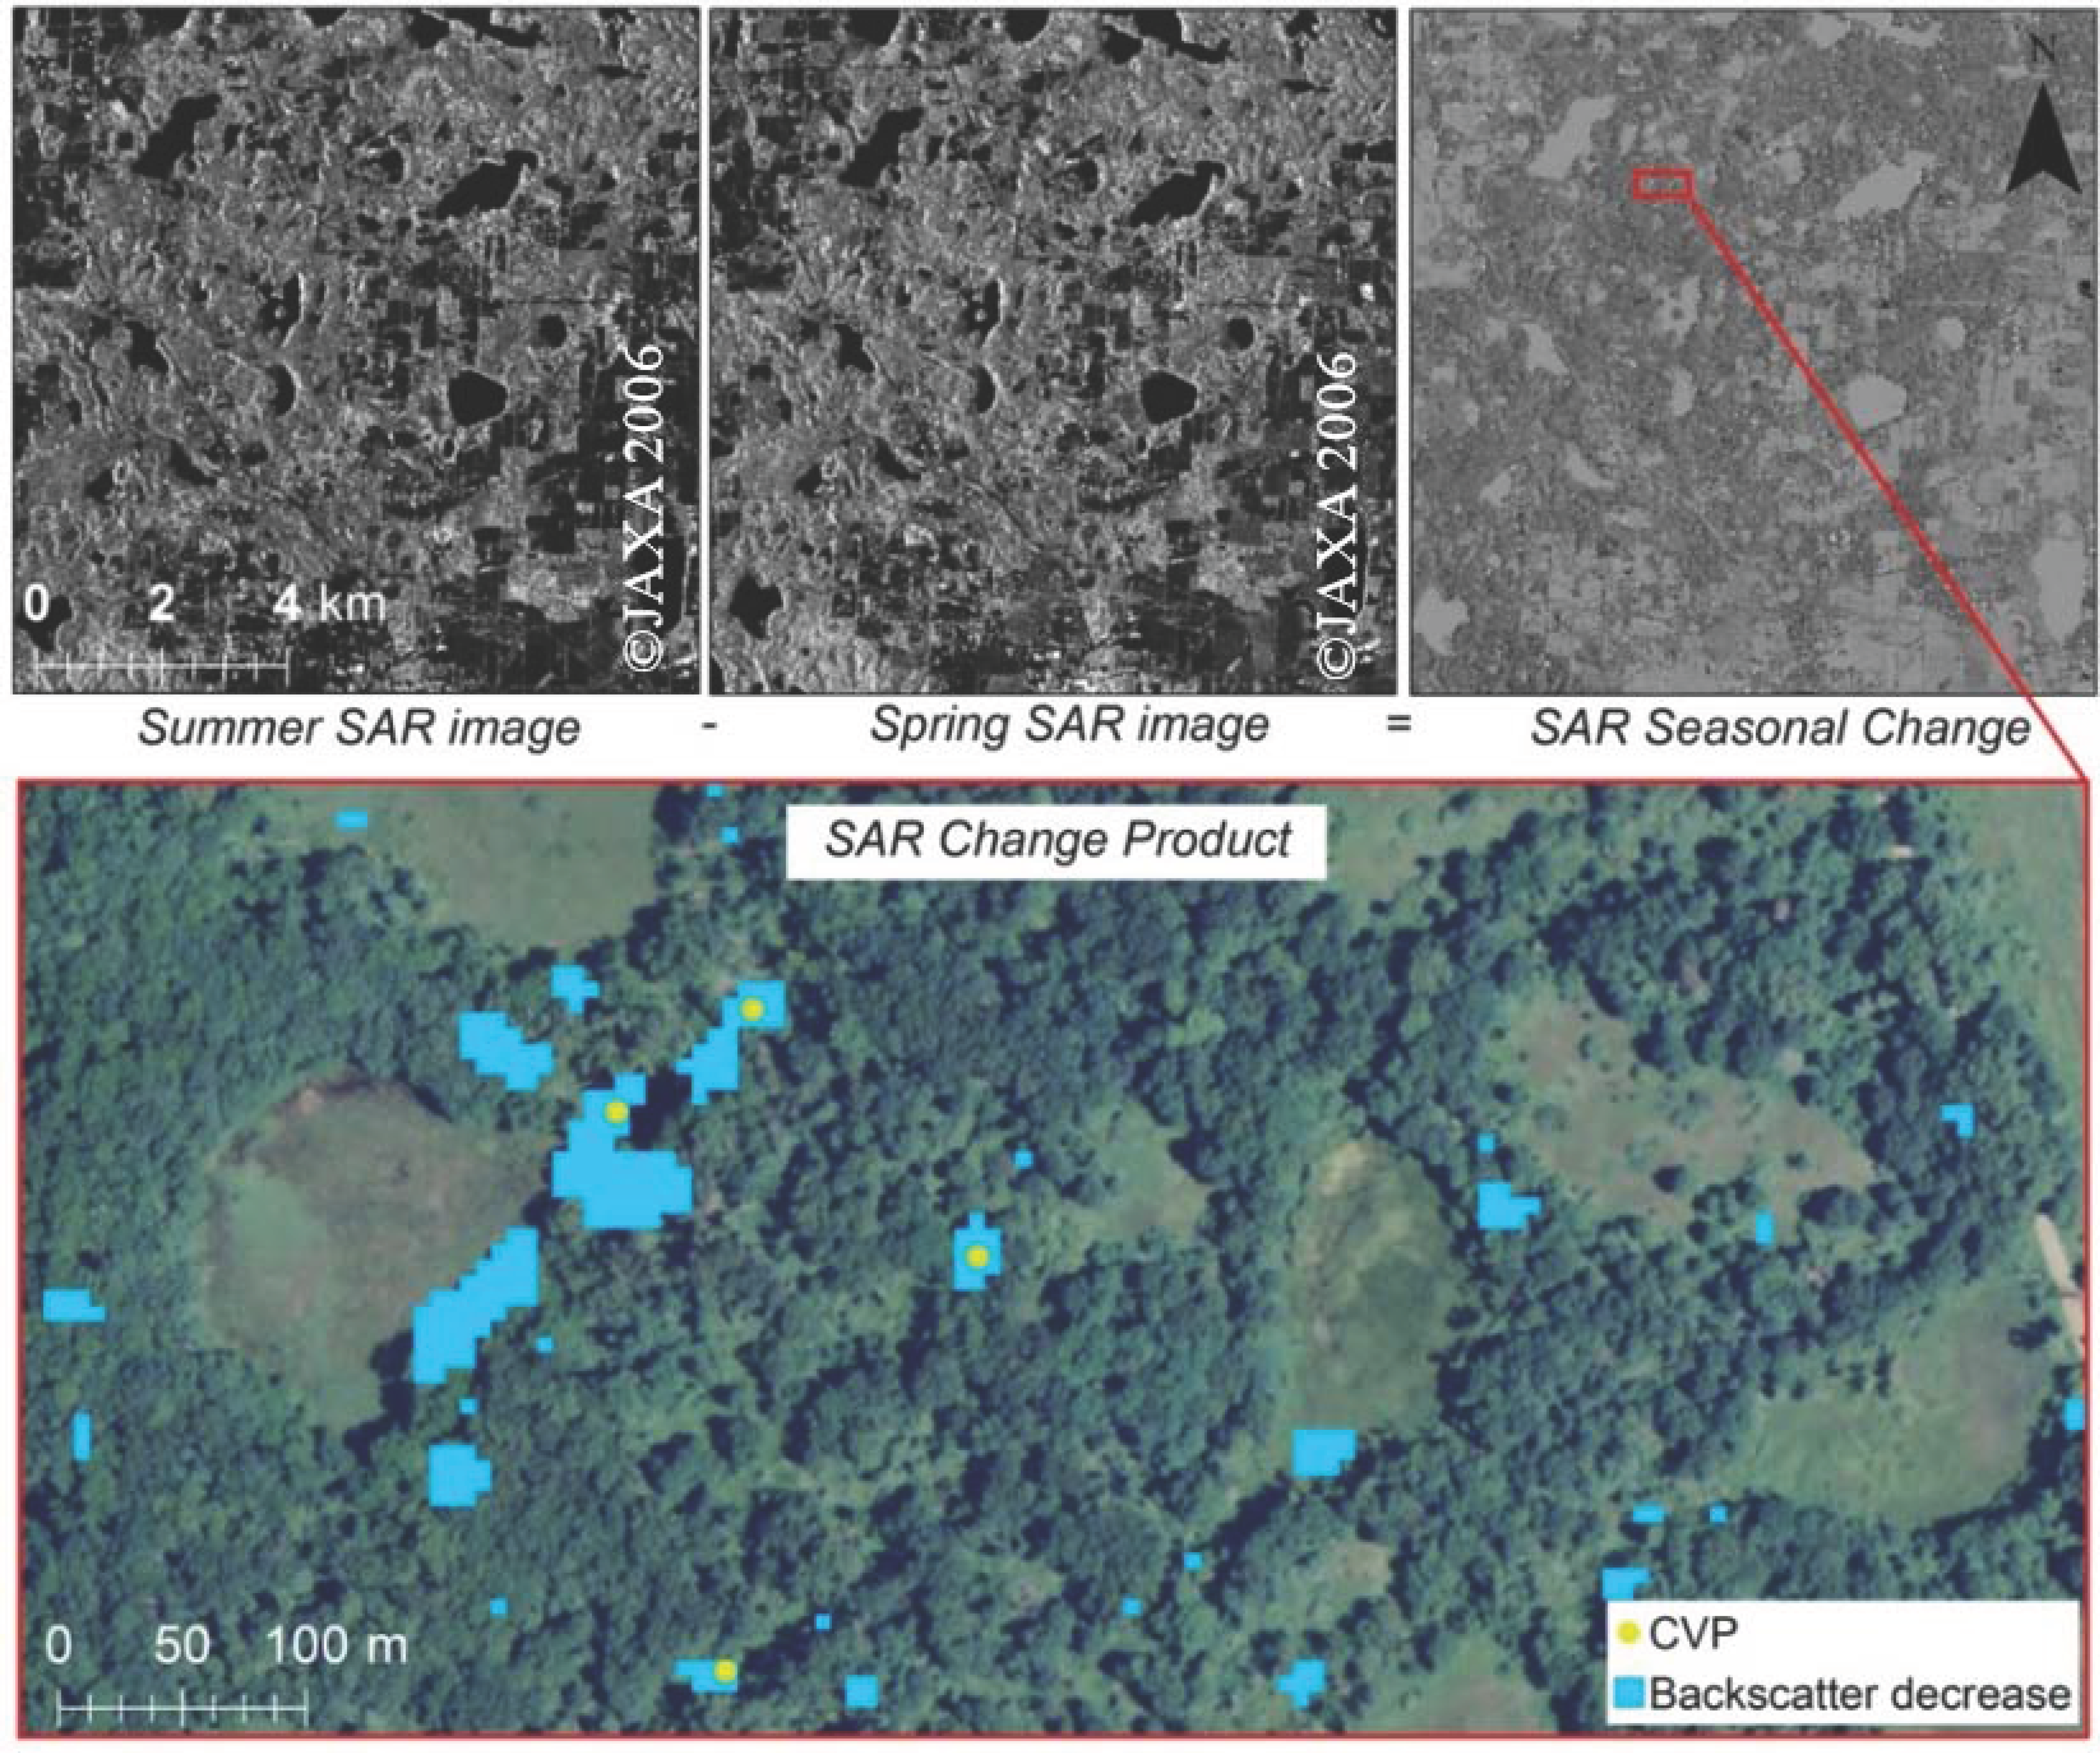
Development of SAR Seasonal Change Images
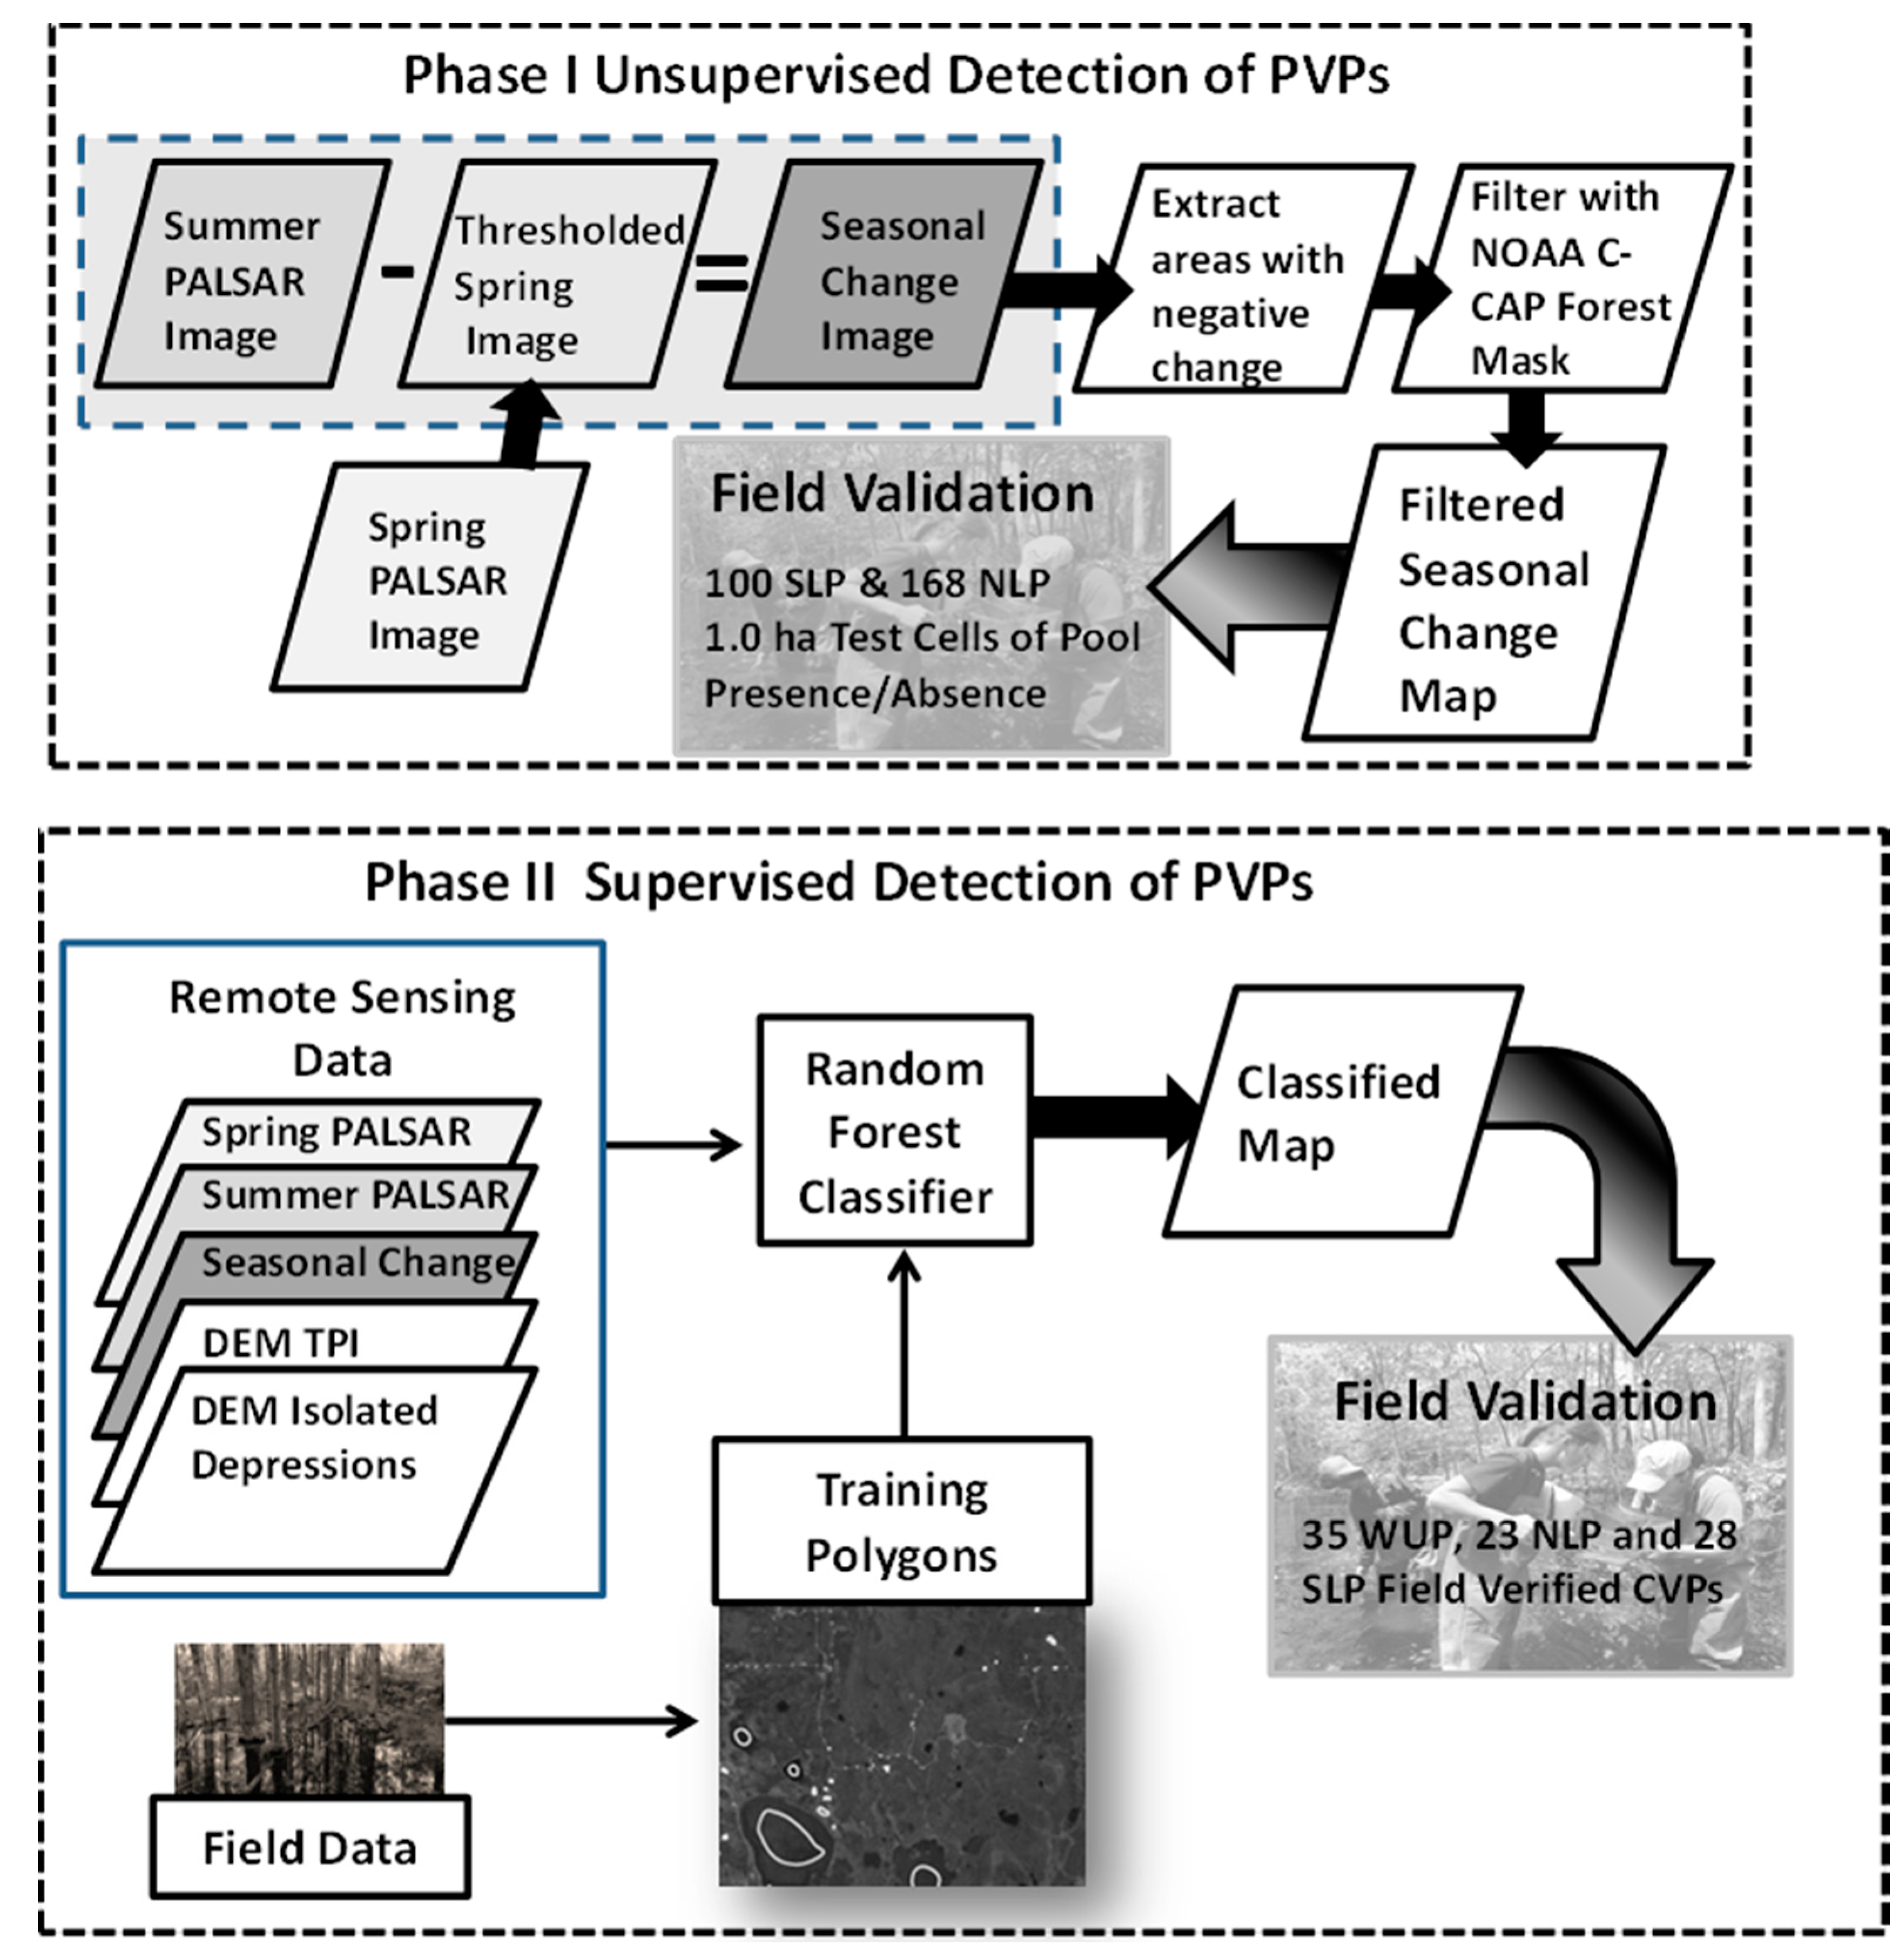
2.4. Remote Sensing Approach
2.5. Accuracy Assessments
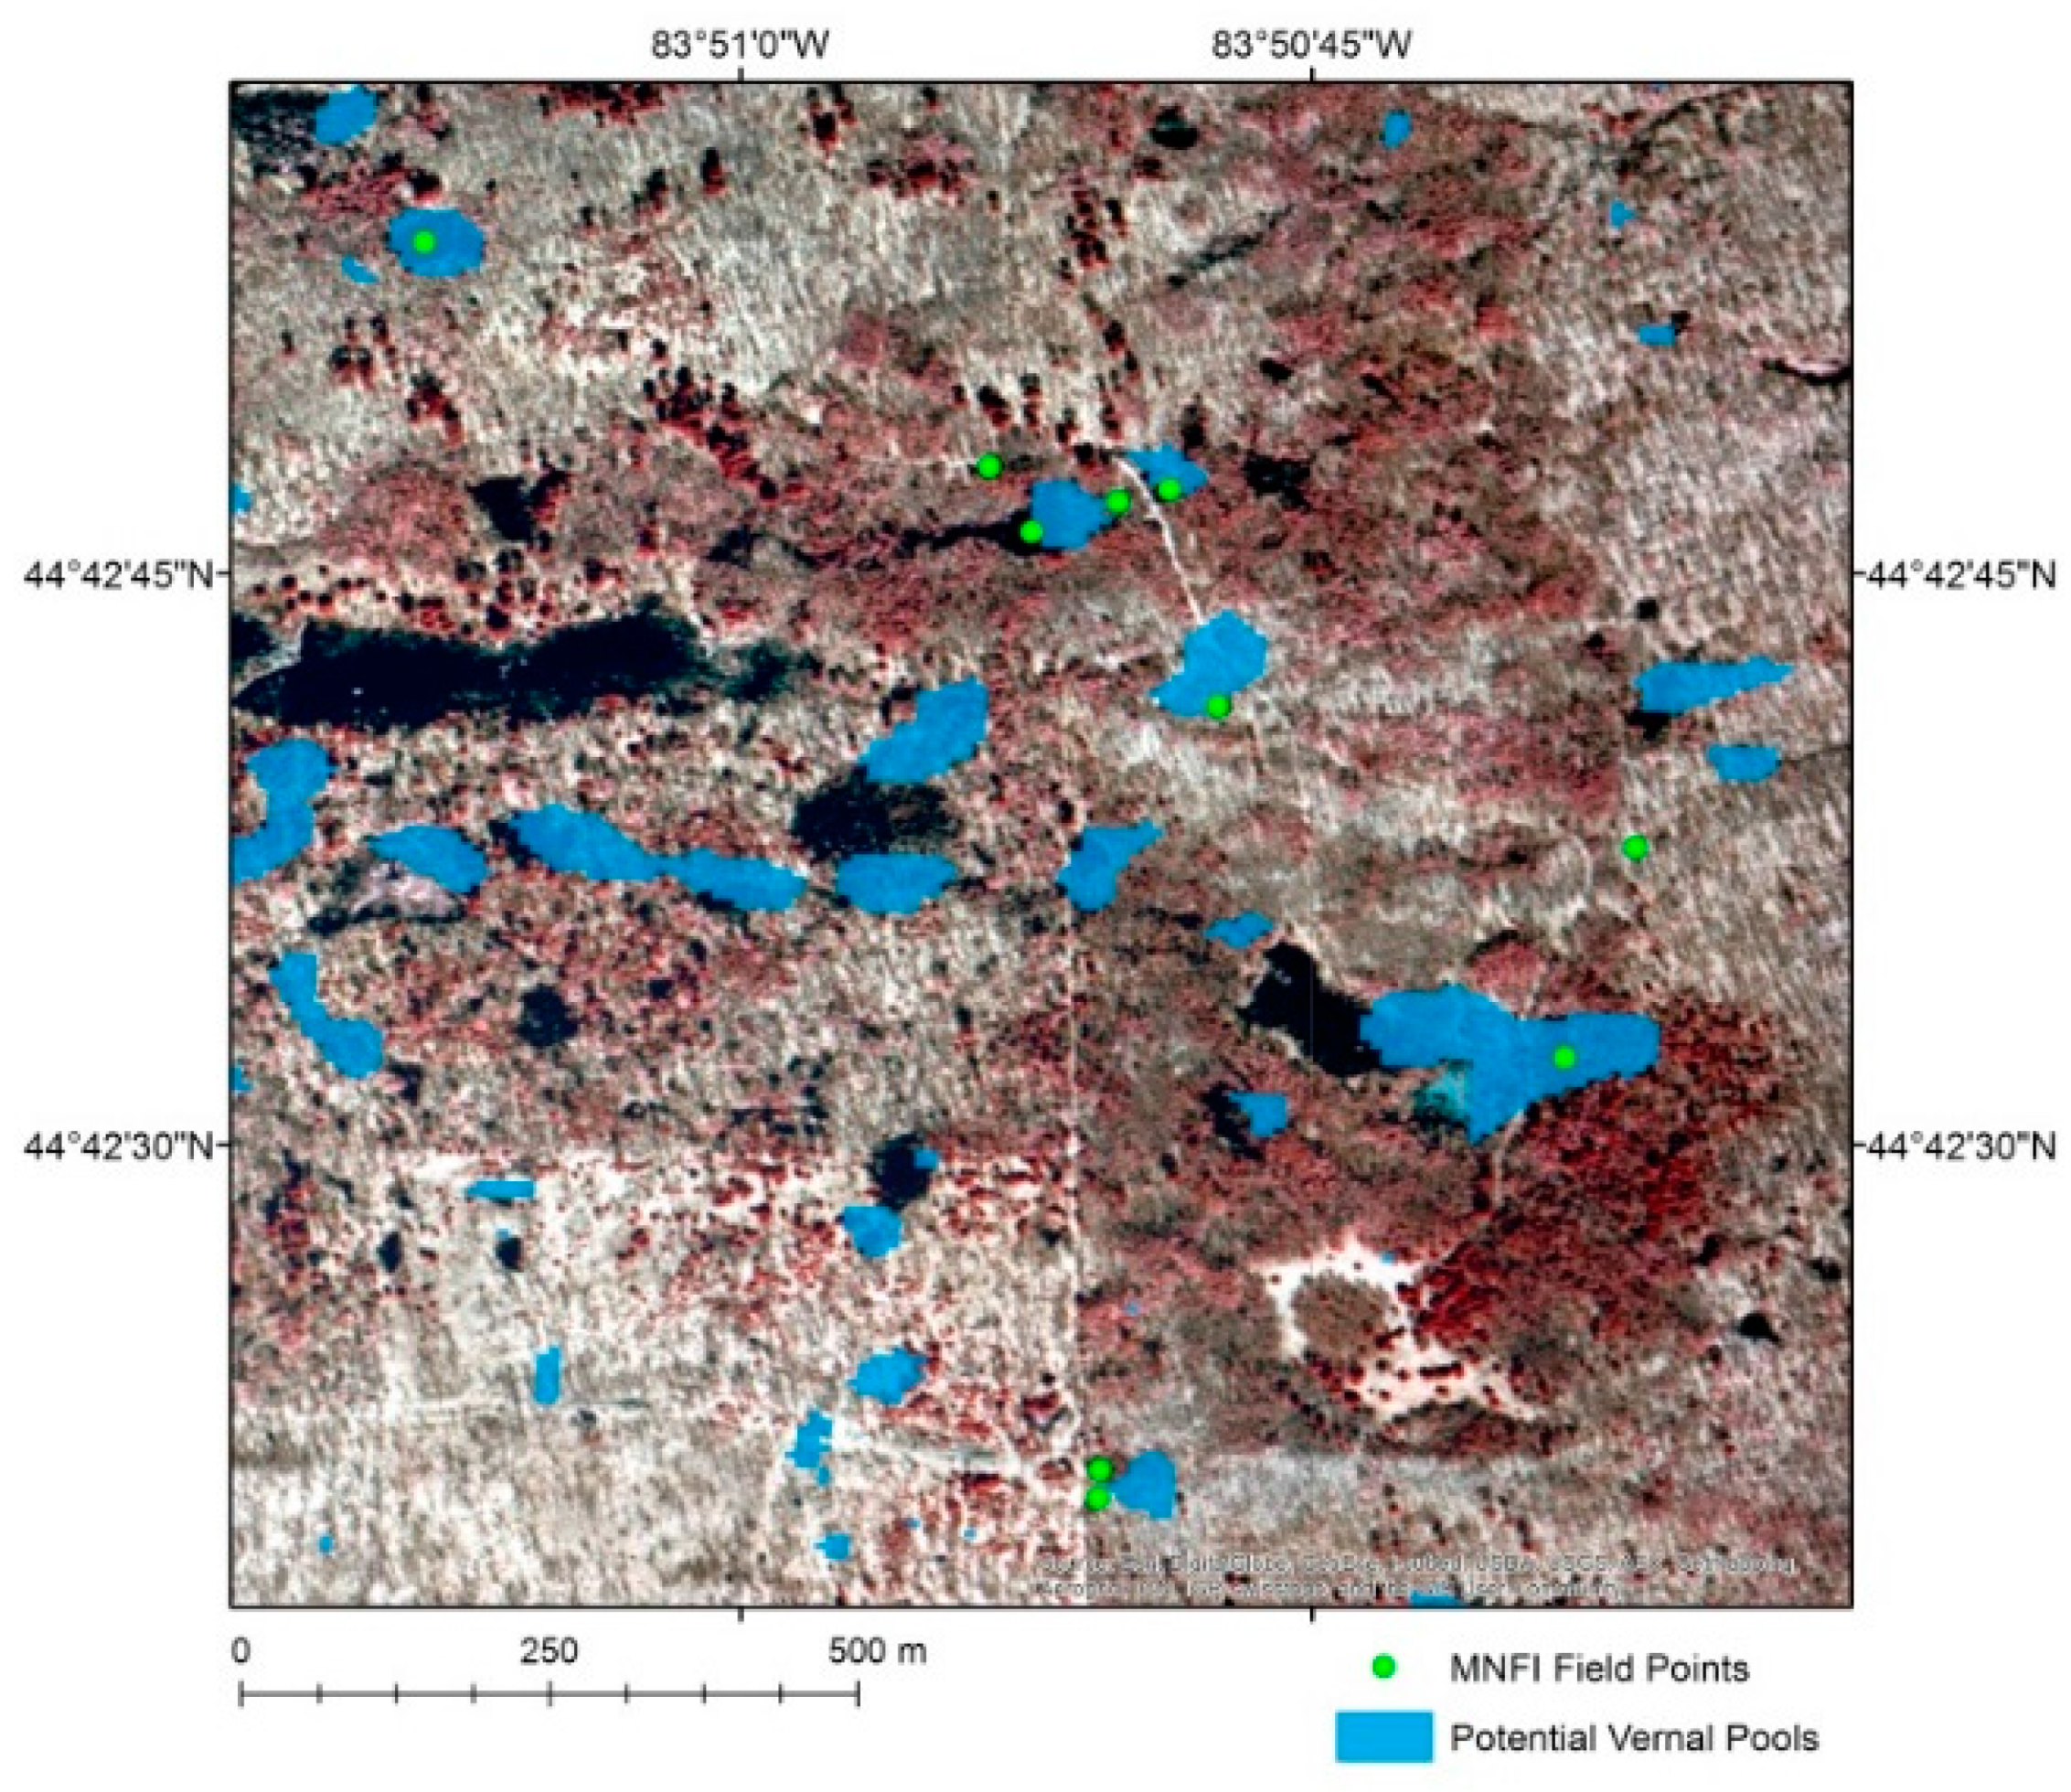
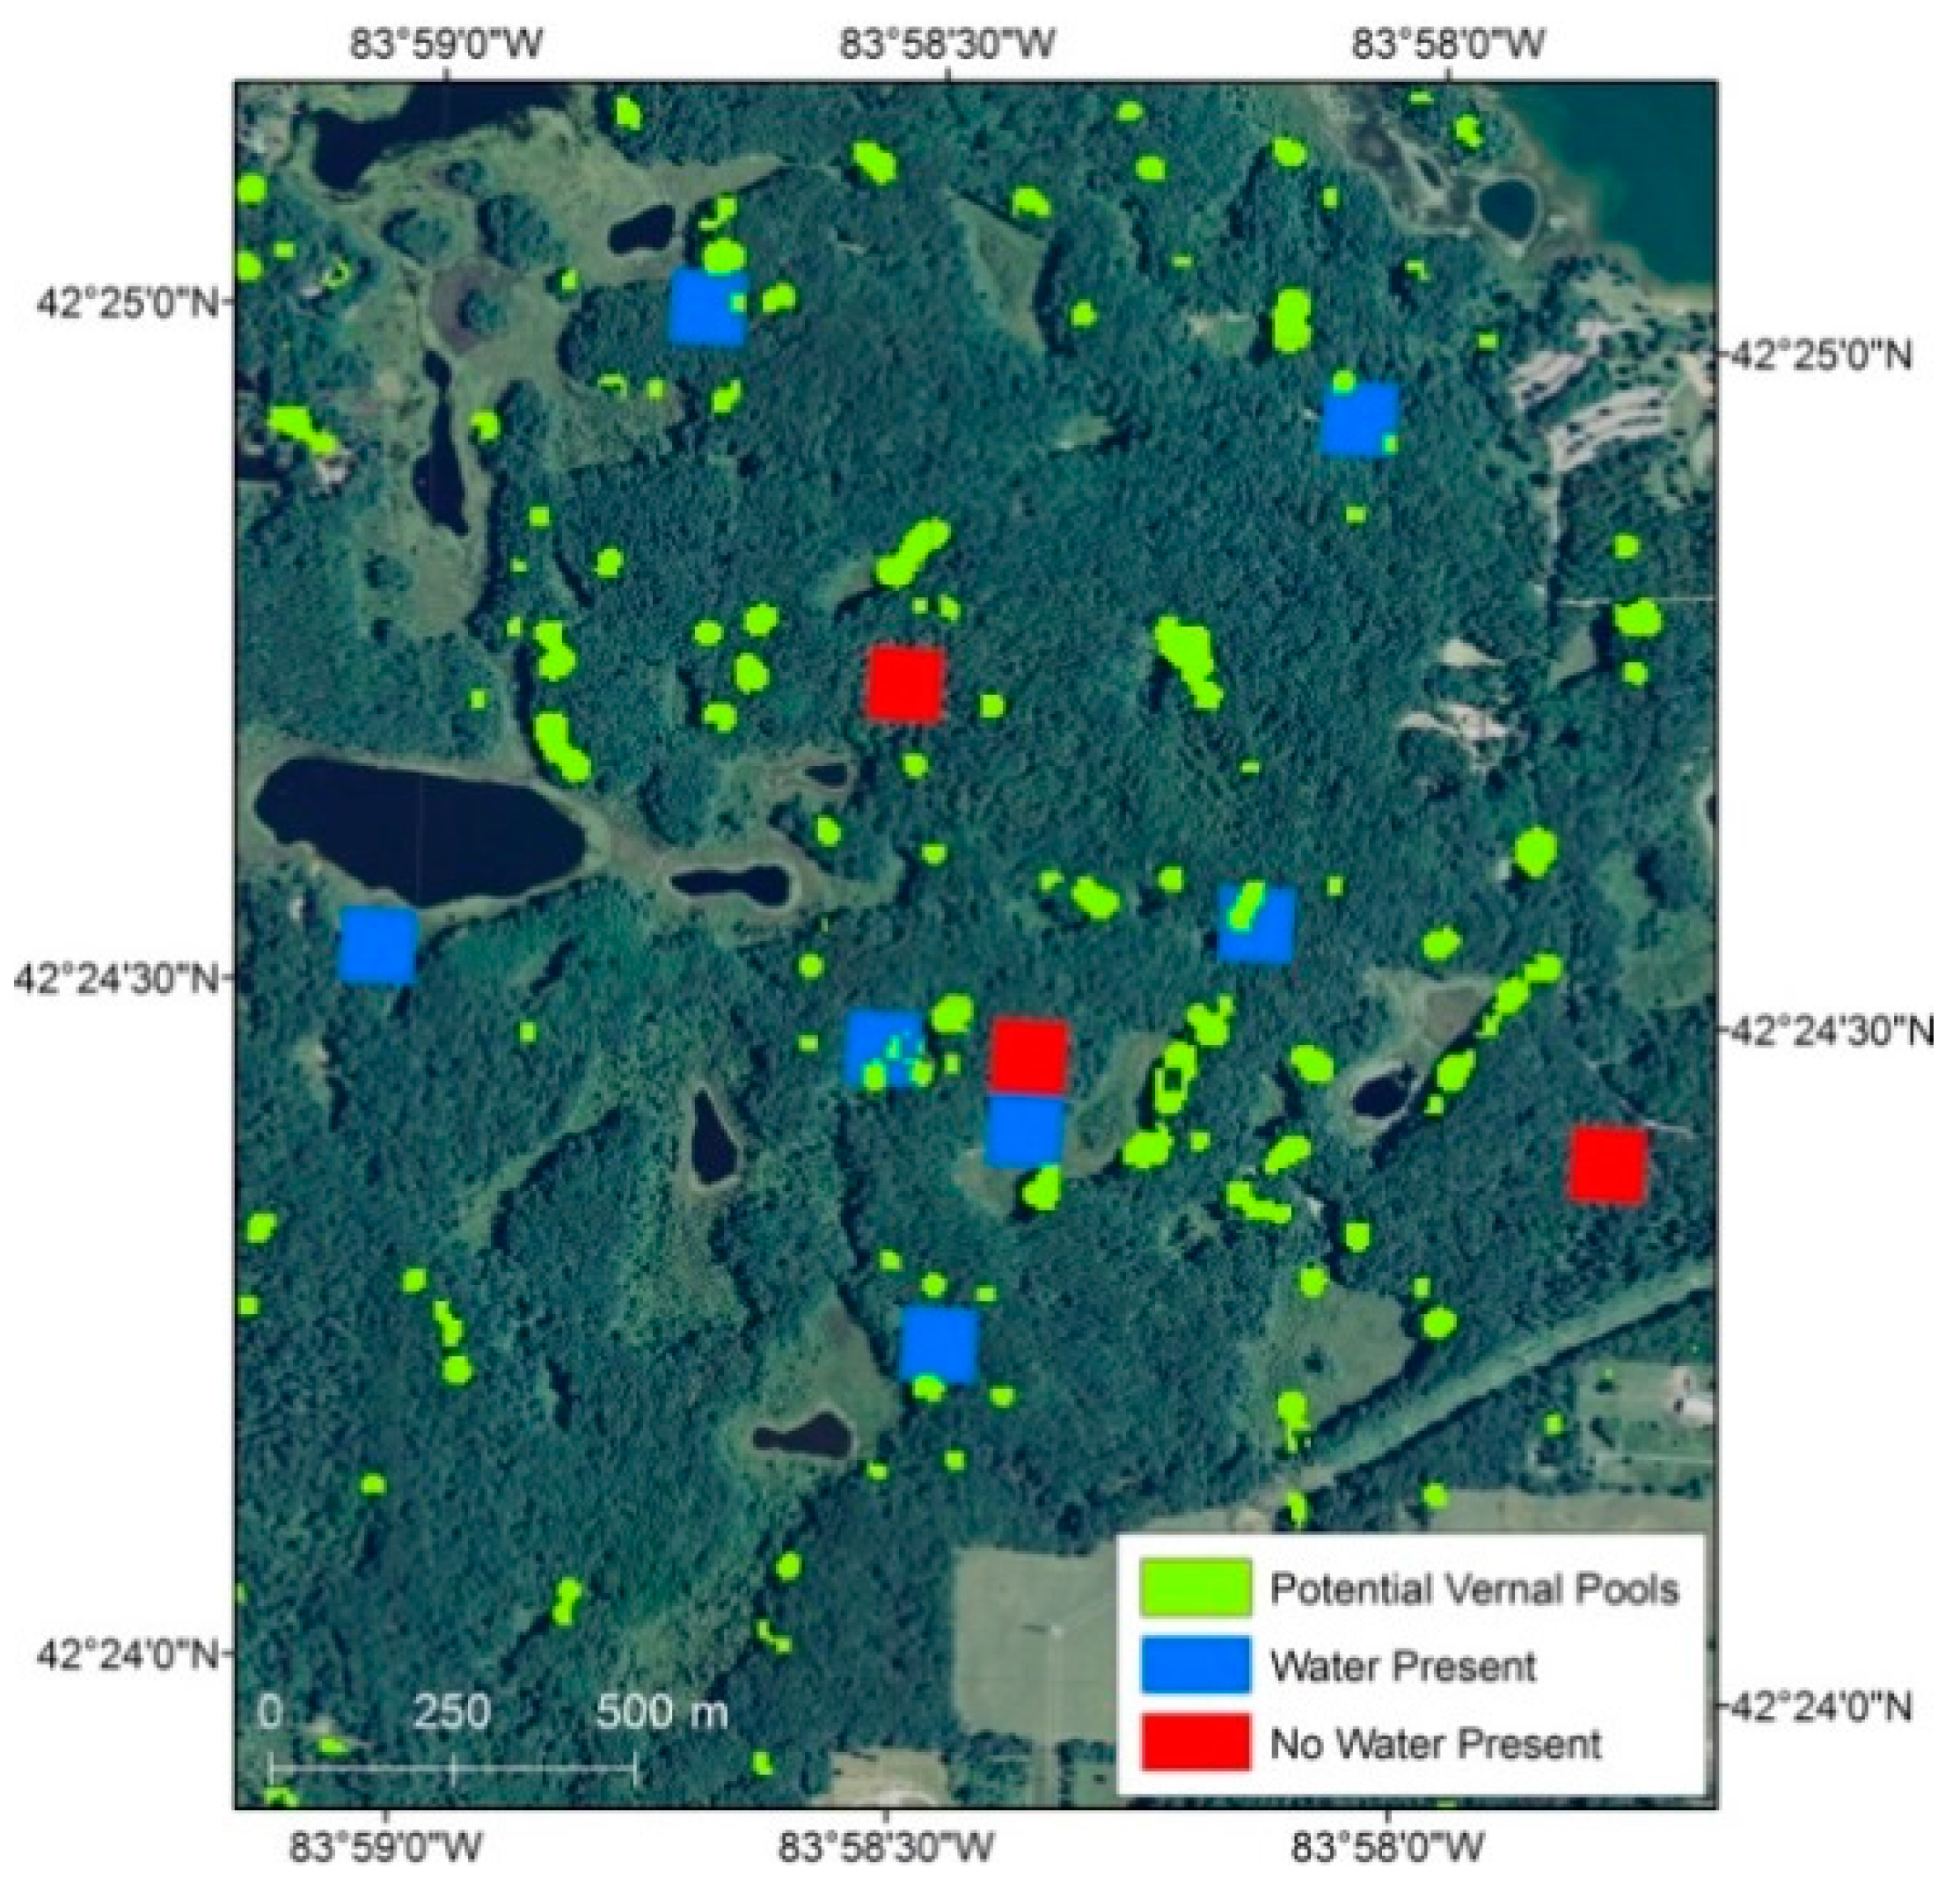
2.5.1. PALSAR Blind Potential Vernal Pool Mapping
2.5.2. Supervised Classification of Vernal Pools
3. Results
3.1. SAR Blind Seasonal Change Map Results
3.2. Supervised Classifications of SAR, LiDAR, and DEM Datasets
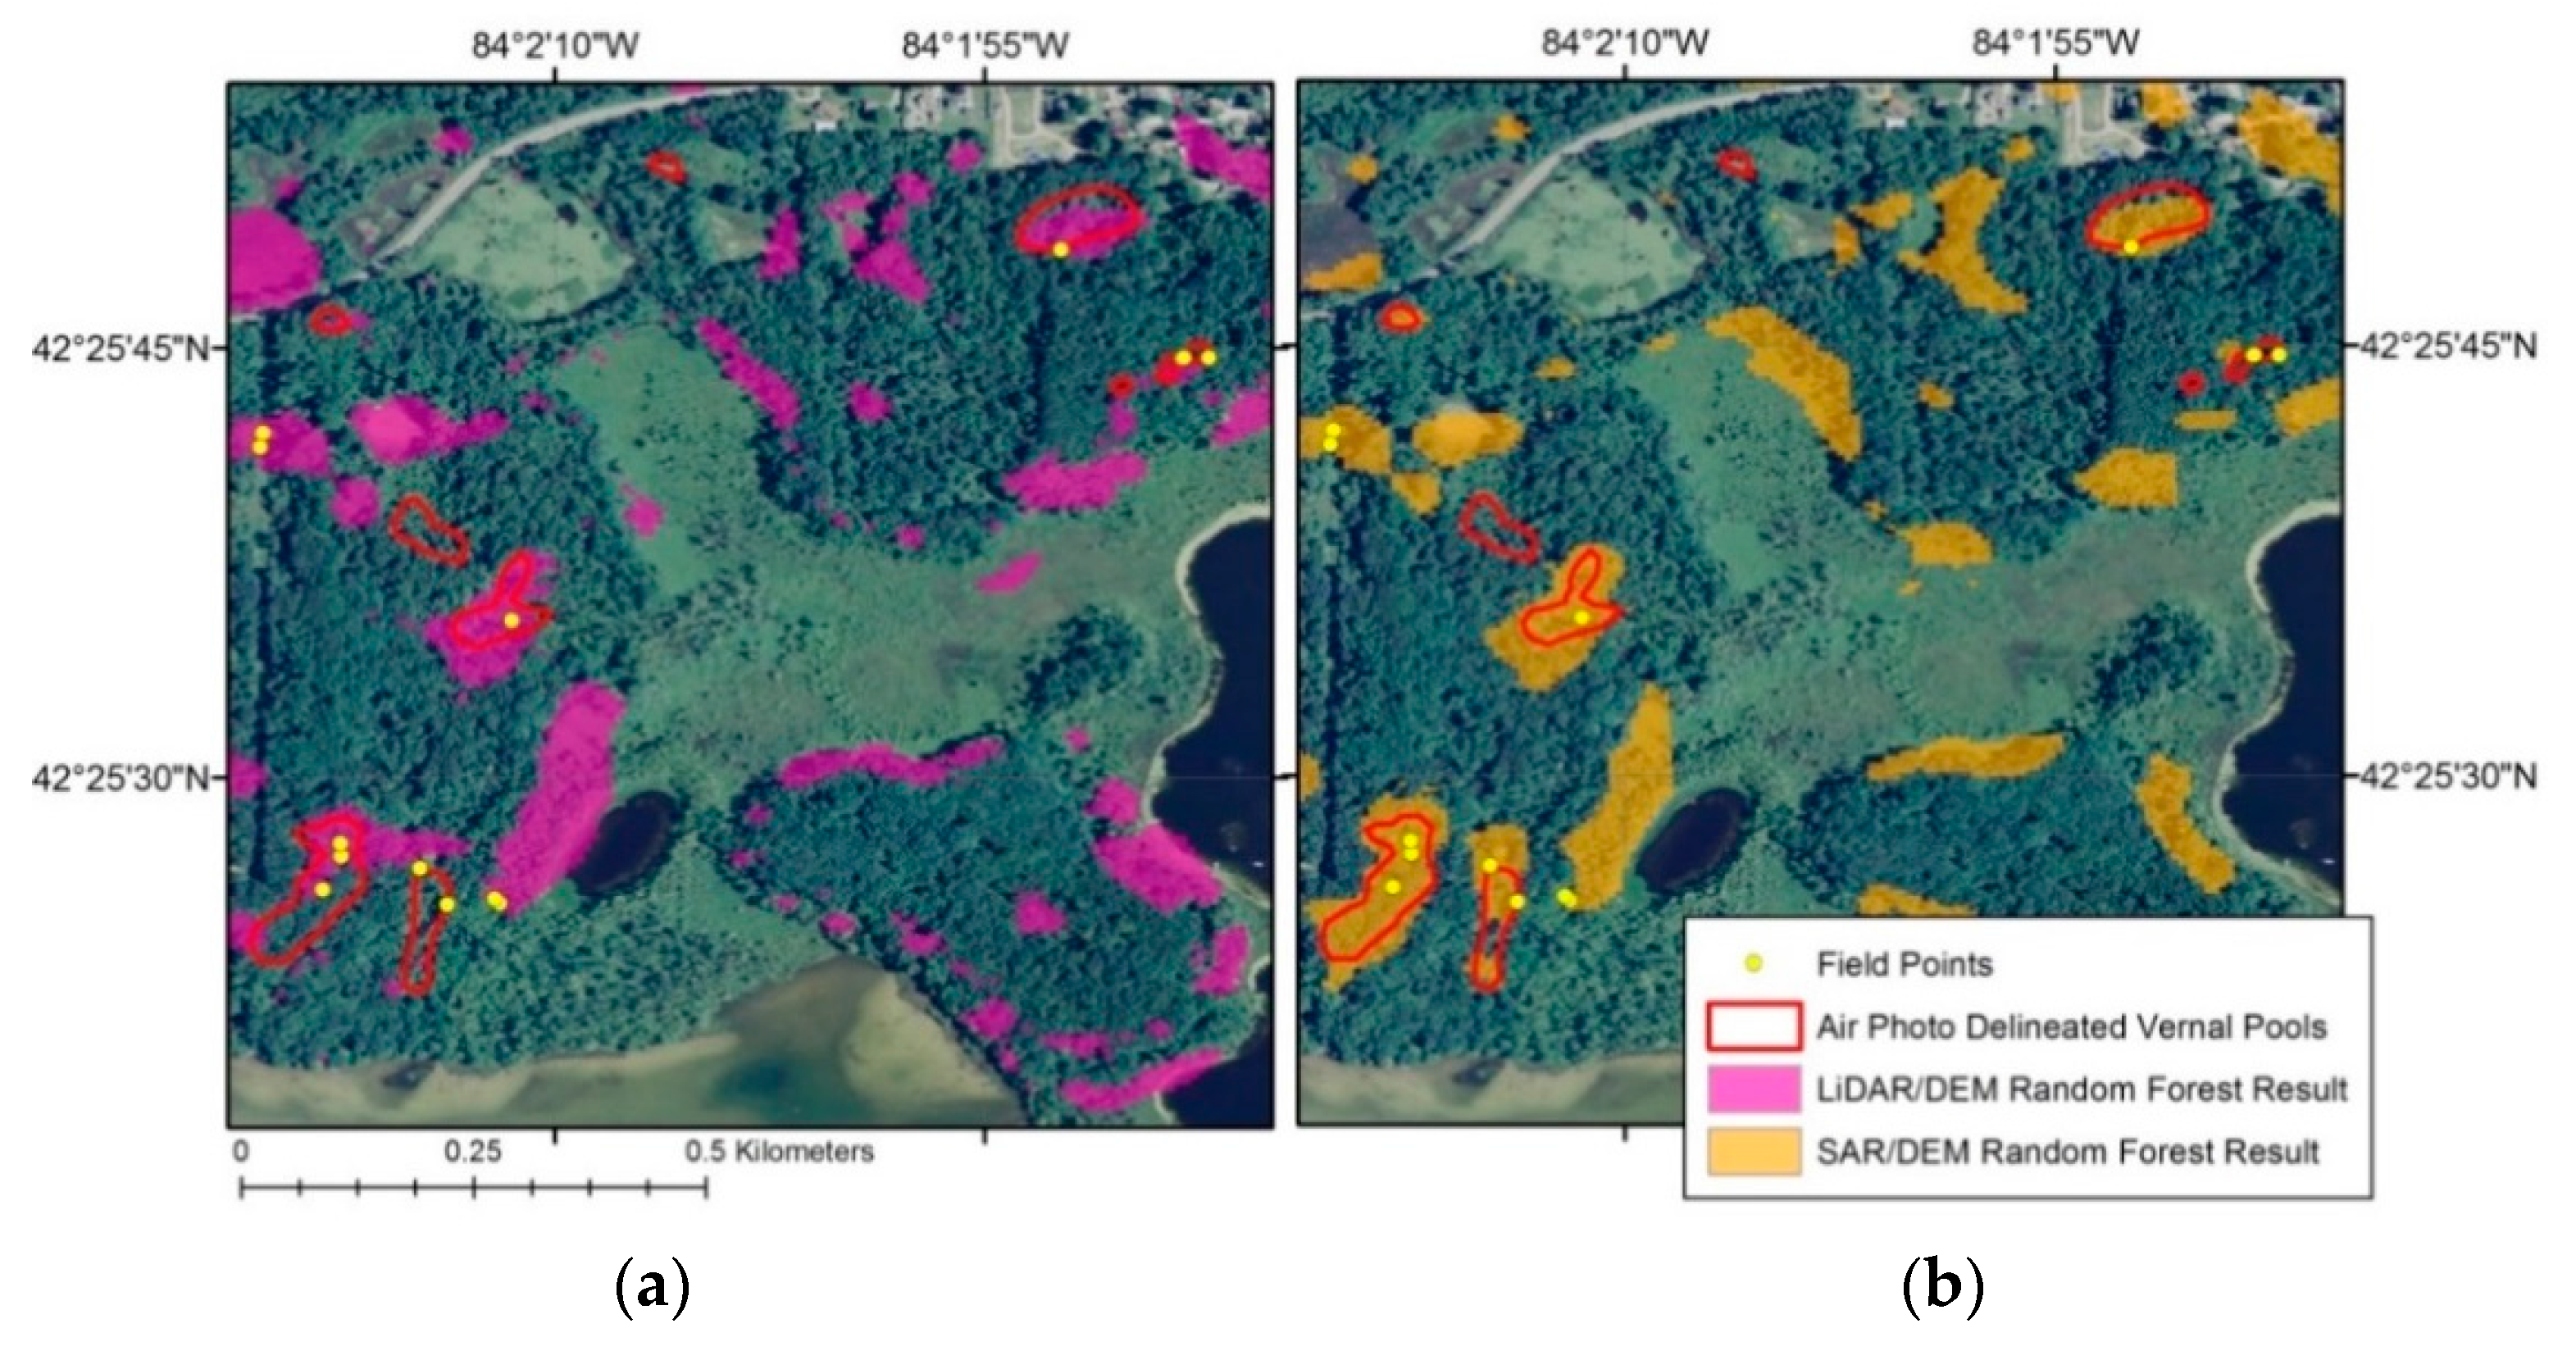
3.2.1. Comparison of Classification of Vernal Pools with PALSAR and 10 m DEM vs. LiDAR and 10 m DEM Data
3.2.2. Application of SAR & 10 m DEM Methodology to NLP Study Site
3.2.3. Application of SAR & 10 m DEM Methodology to WUP Study Area
3.2.4. C-Band Preliminary Evaluation
4. Discussion
5. Conclusions
Acknowledgments
Author Contributions
Conflicts of Interest
Abbreviations
| PVP | Potential Vernal Pool |
| CVP | Confirmed Vernal Pool |
| SAR | Synthetic Aperture Radar |
| SLP | Southeastern Lower Peninsula of Michigan |
| NLP | Northeastern Lower Peninsula of Michigan |
| WUP | Western Upper Peninsula of Michigan |
References
- Zedler, P.H. Vernal pools and the concept of “isolated wetlands”. Wetlands 2003, 23, 597–607. [Google Scholar] [CrossRef]
- Brooks, R.T.; Doyle, K.L. Shrew species richness and abundance in relation to vernal pond habitat in southern New England. Northeast. Nat. 2001, 8, 137–148. [Google Scholar] [CrossRef]
- Joyal, L.A.; McCollough, M.; Hunter, M.L. Landscape ecology approaches to wetland species conservation: A case study of two turtle species in southern Maine. Conserv. Biol. 2001, 15, 1755–1762. [Google Scholar] [CrossRef]
- Roe, J.H.; Kingsbury, B.A.; Herbert, N.R. Wetland and upland use patterns in semi-aquatic snakes: Implications for wetland conservation. Wetlands 2003, 23, 1003–1014. [Google Scholar] [CrossRef]
- Colburn, E.A. Vernal Pools: Natural History and Conservation; The McDonald and Woodward Publishing Company: Granville, OH, USA, 2004; p. 426. [Google Scholar]
- Brooks, R.T.; Ford, W.M. Bat activity in a forest landscape of central Massachusetts. Northeast. Nat. 2005, 12, 447–462. [Google Scholar] [CrossRef]
- Francl, K.E. Bat Activity in Woodland Vernal Pools; Service, U.F., Ed.; Ottawa National Forest and University of Notre Dame: Notre Dame, IN, USA, 2005. [Google Scholar]
- Paton, P.W. A review of vertebrate community composition in seasonal forest pools of the northeastern United States. Wetl. Ecol. Manag. 2005, 13, 235–246. [Google Scholar] [CrossRef]
- Hanowski, J.; Danz, N.; Lind, J. Response of breeding bird communities to forest harvest around seasonal ponds in northern forests, USA. For. Ecol. Manag. 2006, 229, 63–72. [Google Scholar] [CrossRef]
- Scheffers, B.R.; Harris, J.B.C.; Haskell, D.G. Avifauna associated with ephemeral ponds on the Cumberland Plateau, Tennessee. J. Field Ornithol. 2006, 77, 178–183. [Google Scholar] [CrossRef]
- Calhoun, A.J.; DeMaynadier, P.G. Science and Conservation of Vernal Pools in Northeastern North America: Ecology and Conservation of Seasonal Wetlands in Northeastern North America; CRC Press: Boca Raton, FL, USA, 2007. [Google Scholar]
- Battle, J.M.; Golladay, S.W. Hydroperiod influence on breakdown of leaf litter in cypress-gum wetlands. Am. Midl. Nat. 2001, 146, 128–145. [Google Scholar] [CrossRef]
- Leibowitz, S.G. Isolated wetlands and their functions: An ecological perspective. Wetlands 2003, 23, 517–531. [Google Scholar] [CrossRef]
- Gibbons, J.W.; Winne, C.T.; Scott, D.E.; Willson, J.D.; Glaudas, X.; Andrews, K.M.; Todd, B.D.; Fedewa, L.A.; Wilkinson, L.; Tsaliagos, R.N.; et al. Remarkable amphibian biomass and abundance in an isolated wetland: Implications for wetland conservation. Conserv. Biol. 2006, 20, 1457–1465. [Google Scholar] [CrossRef] [PubMed]
- Duffy, W.G.; Kahara, S.N. Wetland ecosystem services in California’s Central Valley and implications for the Wetland Reserve Program. Ecol. Appl. 2011, 21, S18–S30. [Google Scholar] [CrossRef]
- Stone, J.S. Vernal Pools in Massachusetts: Aerial Photographic Identification, Biological and Physiographic Characteristics, and State Certification Criteria. Master’s Thesis, University of Massachusetts, Amherst, MA, USA, 1992. [Google Scholar]
- Brooks, R.T.; Stone, J.; Lyons, P. An inventory of seasonal forest ponds on the Quabbin Reservoir watershed, Massachusetts. Northeast. Nat. 1998, 5, 219–230. [Google Scholar] [CrossRef]
- Burne, M.R.; Lathrop, R.G. Remote and field identification of vernal pools. In Science and Conservation of Vernal Pools in Northeastern North America; Calhoun, A.J.K., Demaynadier, P.G., Eds.; CRC Press: Boca Raton, FL, USA, 2007; pp. 55–68. [Google Scholar]
- Lathrop, R.G.; Montesano, P.; Tesauro, J.; Zarate, B. Statewide mapping and assessment of vernal pools: A New Jersey case study. J. Environ. Manag. 2005, 76, 230–238. [Google Scholar] [CrossRef] [PubMed]
- Burne, M.R. Massachusetts aerial photo survey of potential vernal pools. In Natural Heritage and Endangered Species Program; Massachusetts Division of Fisheries and Wildlife: Westborough, MA, USA, 2001; p. 80. [Google Scholar]
- Tiner, R.W. Use of high-altitude aerial photography for inventorying forested wetlands in the United States. For. Ecol. Manag. 1990, 33, 593–604. [Google Scholar] [CrossRef]
- Calhoun, A.J.; Walls, T.E.; Stockwell, S.S.; McCollough, M. Evaluating vernal pools as a basis for conservation strategies: A Maine case study. Wetlands 2003, 23, 70–81. [Google Scholar] [CrossRef]
- Lee, Y.; Badra, P.J.; Battaglia, M.; Bourgeau-Chavez, L.L.; Enander, H.D.; Hyde, D.A.; Klatt, B.J.; Laubach, Z.; Monfils, M.J.; Penskar, M.R.; et al. Developing an Approach for Identifying, Mapping, and Assessing Vernal Pools in Michigan; Michigan Natural Features Inventory: Lansing, MI, USA, 2014. [Google Scholar]
- Wu, Q.; Lane, C.; Liu, H. An effective method for detecting potential woodland vernal pools using high-resolution LiDAR data and aerial imagery. Remote Sens. 2014, 6, 11444–11467. [Google Scholar] [CrossRef]
- Faccio, S.D.; MacFaden, S.W.; Lambert, J.D.; O’Neil-Dunne, J.; McFarland, K.P. The North Atlantic Vernal Pool Data Cooperative; North Atlantic Landscape Conservation Cooperative: Hadley, MA, USA, 2015. [Google Scholar]
- Lang, M.W. Improved Detection of Forested Wetland Hydrology with LiDAR Intensity. Wetlands 2009, 29, 1166–1178. [Google Scholar] [CrossRef]
- Albert, D. Regional Landscape Ecosystems of Michigan, Minnesota and Wisconsin: A Working Map and Classification. Available online: http://www.treesearch.fs.fed.us/pubs/10242 (accessed on 3 June 2016).
- Cohen, J. Natural Community Abstract for Mesic Northern Forest; Michigan Natural Features Inventory: Lansing, MI, USA, 2000. [Google Scholar]
- Volunteer Training Manual: Michigan Vernal Pool Mapping and Monitoring Project. Available online: https://www.stewardshipnetwork.org/resources/volunteer-training-manual-michigan-vernal-pool-mapping-and-monitoring-project (accessed on 3 June 2016).
- Quick Terrain Modeler, Applied Imagery: Chevy Chase. Available online: http://appliedimagery.com/ (accessed on 6 June 2016).
- 3D Elevation Program (3DEP). Available online: http://nationalmap.gov/3DEP/ (accessed on 6 June 2016).
- Weiss, A. Topographic Position and Landforms Analysis; Poster Presentation, ESRI User Conference: San Diego, CA, USA, 2001; p. 200. [Google Scholar]
- Ulander, L.M. Radiometric slope correction of synthetic-aperture radar images. IEEE Trans. Geosci. Remote Sens. 1996, 34, 1115–1122. [Google Scholar] [CrossRef]
- ASF MapReady User Manual. Available online: https://www.google.com.hk/url?sa=t&rct=j&q=&esrc=s&source=web&cd=2&cad=rja&uact=8&ved=0ahUKEwio5fu5lIvNAhUGEpQKHVm_DiQQFgggMAE&url=https%3A%2F%2Fmedia.asf.alaska.edu%2Fuploads%2Fpdf%2Fmapready_manual_3.1.22.pdf&usg=AFQjCNEuMPwjNGWVCoZ25NPUy5Ln2sY0kQ (accessed on 3 June 2016).
- Shimada, M.; Rosenquvist, A.; Watanabe, M.; Tadono, T. The polarimetric and interferometric potential of ALOS PALSAR. In Proceedings of the 2nd International Workshop POLINSAR, Frascati, Italy, 17–21 January 2005.
- PALSAR CALVAL Summary (JAXA-PI193). Available online: http://www.eorc.jaxa.jp/ALOS/en/conf/Proc_PIsymp2007/contents/proceedings/SAR_Cal_Val/SCV13.pdf (accessed on 6 June 2016).
- Cote, S.; Muir, S.; Srivastava, S.; Hawkins, R. SAR image quality and calibration operations for the RADARSAT satellites at the Canadian Space Agency. In Proceedings of the 2009 Radar International Conference “Surveillance for a Safer World” (Radar 2009), Bordeaux, France, 12–16 October 2009; pp. 1–6.
- National Oceanic and Atmospheric Administration. 2010 Michigan Land Cover; National Oceanic and Atmospheric Administration: Charleston, SC, USA, 2010.
- Breiman, L. Random forests. Mach. Learn. 2001, 45, 5–32. [Google Scholar] [CrossRef]
- Bourgeau-Chavez, L.; Endres, S.; Battaglia, M.; Miller, M.E.; Banda, E.; Laubach, Z.; Higman, P.; Chow-Fraser, P.; Marcaccio, J. Development of a bi-national Great Lakes coastal wetland and land use map using three-season PALSAR and Landsat imagery. Remote Sens. 2015, 7, 8655–8682. [Google Scholar] [CrossRef]
- Whitcomb, J.; Moghaddam, M.; McDonald, K.; Kellndorfer, J.; Podest, E. Mapping vegetated wetlands of Alaska using L-band radar satellite imagery. Can. J. Remote Sens. 2009, 35, 54–72. [Google Scholar] [CrossRef]
- Corcoran, J.; Knight, J.; Brisco, B.; Kaya, S.; Cull, A.; Murnaghan, K. The integration of optical, topographic, and radar data for wetland mapping in northern Minnesota. Can. J. Remote Sens. 2012, 37, 564–582. [Google Scholar] [CrossRef]
- Congalton, R.; Green, K. Assessing the Accuracy of Remotely Sensed Data: Principles and Applications; Lewis Publishers: Boca Raton, FL, USA, 1999. [Google Scholar]
- Hess, L.L.; Melack, J.M.; Filoso, S.; Wang, Y. Delineation of inundated area and vegetation along the Amazon floodplain with the SIR-C synthetic aperture radar. IEEE Trans. Geosci. Remote Sens. 1995, 33, 896–904. [Google Scholar] [CrossRef]
- Townsend, P. Relationships between forest structure and the detection of flood inundation in forested wetlands using C-band SAR. Int. J. Remote Sens. 2002, 23, 443–460. [Google Scholar] [CrossRef]
- Bourgeau-Chavez, L.; Kasischke, E.S.; Brunzell, S.M.; Mudd, J.P.; Smith, K.B.; Frick, A.L. Analysis of space-borne SAR data for wetland mapping in Virginia riparian ecosystems. Int. J. Remote Sens. 2001, 22, 3665–3687. [Google Scholar] [CrossRef]
- Townsend, P.A. Mapping seasonal flooding in forested wetlands using multi-temporal Radarsat SAR. Photogramm. Eng. Remote Sens. 2001, 67, 857–864. [Google Scholar]
- JAXA, ALOS-PALSAR Imagery Download, PLATFORM. Available online: https://satpf.jp/spf/?lang=en (accessed on 9 June 2016).


| Data Set | Date of Acquisition | Sites | Resolution | Incidence Angle |
|---|---|---|---|---|
| PALSAR FBS L-HH | 2 April 2006 and 12 July 2006 | WUP | 10 m | 34.3° and 41.5° |
| 31 May 2006 and 14 August 2006 | NLP | |||
| 31 May 2006 and 2 August 2006 | SLP | |||
| Radarsat-2 FQ C-HH | 31 May 2014 and 4 September 2014 | WUP | 5–8 m | 19° (WUP) |
| 24 April 2014 and 29 July 2014 | SLP | 24° (SLP) | ||
| LiDAR | Spring 2009 | SLP | 1 m | Nadir |
| Random Stratified Field Sampling | Unsupervised PALSAR PVP Map—SLP | ||||||||
| PVP | NVP | Sum | Omission Error | Producer Accuracy | |||||
| PVP | 32 | 5 | 37 | 14% | 86% | ||||
| NVP | 33 | 30 | 63 | 53% | 47% | ||||
| Sum | 65 | 35 | 100 | ||||||
| Commission Error | False positives 51% | False negatives 14% | Overall Accuracy 62% | ||||||
| User Accuracy | True positives 49% | True negatives 86% | |||||||
| Random Stratified Field Sampling | Unsupervised PALSAR PVP Map—NLP | ||||||||
| PVP | NVP | Sum | Omission Error | Producer Accuracy | |||||
| PVP | 22 | 16 | 38 | 42% | 58% | ||||
| NVP | 72 | 58 | 130 | 55% | 45% | ||||
| Sum | 94 | 74 | 168 | ||||||
| Commission Error | False positives 77% | False negatives 22% | Overall Accuracy 48% | ||||||
| User Accuracy | True positives 23% | True negatives 78% | |||||||
| Supervised Class | Field Truthed Values | |||||
| Other | PVP | Sum | CE | UA | ||
| Other | 198 | 120 | 318 | 38% | 62% | |
| PVP | 12 | 75 | 87 | 14% | 86% | |
| Sum | 210 | 195 | 405 | |||
| OE | 6% | 62% | Total Accuracy = 67% | |||
| PA | 94% | 39% | ||||
| Supervised Class | Field Truthed Values | |||||
| Other | PVP | Sum | CE | UA | ||
| Other | 202 | 19 | 221 | 9% | 91% | |
| PVP | 11 | 182 | 193 | 6% | 94% | |
| Sum | 213 | 201 | 414 | |||
| OE | 5% | 10% | Total Accuracy = 93% | |||
| PA | 94% | 39% | ||||
| Supervised Class | Field Truthed Values | |||||
| Other | PVP | Sum | CE | UA | ||
| Other | 216 | 35 | 251 | 14% | 86% | |
| PVP | 3 | 172 | 175 | 2% | 98% | |
| Sum | 219 | 207 | 426 | |||
| OE | 1% | 17% | Total Accuracy = 91% | |||
| PA | 94% | 39% | ||||
© 2016 by the authors; licensee MDPI, Basel, Switzerland. This article is an open access article distributed under the terms and conditions of the Creative Commons Attribution (CC-BY) license (http://creativecommons.org/licenses/by/4.0/).
Share and Cite
Bourgeau-Chavez, L.L.; Lee, Y.M.; Battaglia, M.; Endres, S.L.; Laubach, Z.M.; Scarbrough, K. Identification of Woodland Vernal Pools with Seasonal Change PALSAR Data for Habitat Conservation. Remote Sens. 2016, 8, 490. https://doi.org/10.3390/rs8060490
Bourgeau-Chavez LL, Lee YM, Battaglia M, Endres SL, Laubach ZM, Scarbrough K. Identification of Woodland Vernal Pools with Seasonal Change PALSAR Data for Habitat Conservation. Remote Sensing. 2016; 8(6):490. https://doi.org/10.3390/rs8060490
Chicago/Turabian StyleBourgeau-Chavez, Laura L., Yu Man Lee, Michael Battaglia, Sarah L. Endres, Zachary M. Laubach, and Kirk Scarbrough. 2016. "Identification of Woodland Vernal Pools with Seasonal Change PALSAR Data for Habitat Conservation" Remote Sensing 8, no. 6: 490. https://doi.org/10.3390/rs8060490
APA StyleBourgeau-Chavez, L. L., Lee, Y. M., Battaglia, M., Endres, S. L., Laubach, Z. M., & Scarbrough, K. (2016). Identification of Woodland Vernal Pools with Seasonal Change PALSAR Data for Habitat Conservation. Remote Sensing, 8(6), 490. https://doi.org/10.3390/rs8060490