Article

Space Geodetic Observations and Modeling of 2016 Mw 5.9 Menyuan Earthquake: Implications on Seismogenic Tectonic Motion

1
Institute of Crustal Dynamics, China Earthquake Administration, Beijing 100085, China
2
Key Laboratory of Crustal Dynamics, China Earthquake Administration, Beijing 100085, China
*
Author to whom correspondence should be addressed.
Remote Sens. 2016, 8(6), 519; https://doi.org/10.3390/rs8060519
Submission received: 3 May 2016 / Revised: 1 June 2016 / Accepted: 14 June 2016 / Published: 22 June 2016
(This article belongs to the Special Issue Earth Observations for Geohazards)

Abstract

:
Determining the relationship between crustal movement and faulting in thrust belts is essential for understanding the growth of geological structures and addressing the proposed models of a potential earthquake hazard. A Mw 5.9 earthquake occurred on 21 January 2016 in Menyuan, NE Qinghai Tibetan plateau. We combined satellite interferometry from Sentinel-1A Terrain Observation with Progressive Scans (TOPS) images, historical earthquake records, aftershock relocations and geological data to determine fault seismogenic structural geometry and its relationship with the Lenglongling faults. The results indicate that the reverse slip of the 2016 earthquake is distributed on a southwest dipping shovel-shaped fault segment. The main shock rupture was initiated at the deeper part of the fault plane. The focal mechanism of the 2016 earthquake is quite different from that of a previous Ms 6.5 earthquake which occurred in 1986. Both earthquakes occurred at the two ends of a secondary fault. Joint analysis of the 1986 and 2016 earthquakes and aftershocks distribution of the 2016 event reveals an intense connection with the tectonic deformation of the Lenglongling faults. Both earthquakes resulted from the left-lateral strike-slip of the Lenglongling fault zone and showed distinct focal mechanism characteristics. Under the shearing influence, the normal component is formed at the releasing bend of the western end of the secondary fault for the left-order alignment of the fault zone, while the thrust component is formed at the restraining bend of the east end for the right-order alignment of the fault zone. Seismic activity of this region suggests that the left-lateral strike-slip of the Lenglongling fault zone plays a significant role in adjustment of the tectonic deformation in the NE Tibetan plateau.

Graphical Abstract

1. Introduction

A Mw 5.9 earthquake struck the Menyuan county, Qinghai (101.641°E, 37.67°N) on 21 January 2016. Moment tensor solution from teleseismic data suggests that the Menyuan earthquake occurred on a 43° southern dipping thrust fault at about 10 km depth with a strike of 134° [1,2]. The hypocenter was located at the intersection of Lenglongling fault and Tuolaishan fault. Since 1927, more than five earthquakes with Ms > 6 have occurred within a 100 km range from the epicenter of the event according to the U.S. Geological Survey (USGS). The largest one, with a magnitude Ms 8.0, occurred in May 1927 at Gulang, the closest earthquake with a magnitude Ms 6.5 occurred on 26 August 1986. Both the 1986 and 2016 events occurred near the secondary fault of the Lenglongling fault; the distance between the epicenters of the earthquakes is about 15 km (Figure 1a). The focal mechanism solution of 2016 event indicated that seismogenic fault is a thrust fault, with a strike slip component according to USGS [1]. Since the late Quaternary, the activities of the Lenglongling fault have been characterized by the left-lateral slip and a minor component of the dip slip at some segment. Thus, there is a series of large-scale sinistral slip fault geomorphology along the Lenglongling fault [3]. The activity behavior of the Lenglongling main fault and the focal mechanisms of two earthquakes (1986 and 2016) show great differences in mechanical properties [4], which indicates the complexity of the tectonic stress field and structural styles in this area (Figure 1b). The characteristics of the rupture process of the 2016 Menyuan earthquake offer an outstanding occasion to better constrain and resolve the fault geometry of the northeast margin of NE Tibetan plateau. In the paper, we will report the deformation patterns of the 2016 Menyuan Earthquake from the ascending and descending track Sentinel-1A data. Joint analysis with the 1986 Menyuan earthquake, and the background and mechanical properties of the seismogenic fault will be analyzed to reveal the tectonic relationship between the seismogenic fault and the main fault of Lenglongling zone. It will enhance our understanding of the implications on seismogenic tectonic motion of the NE Tibetan plateau.

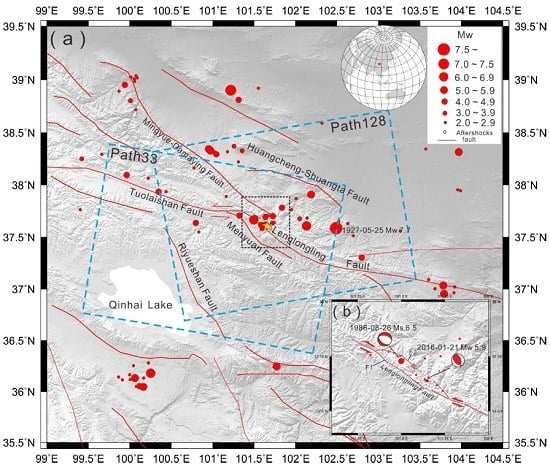
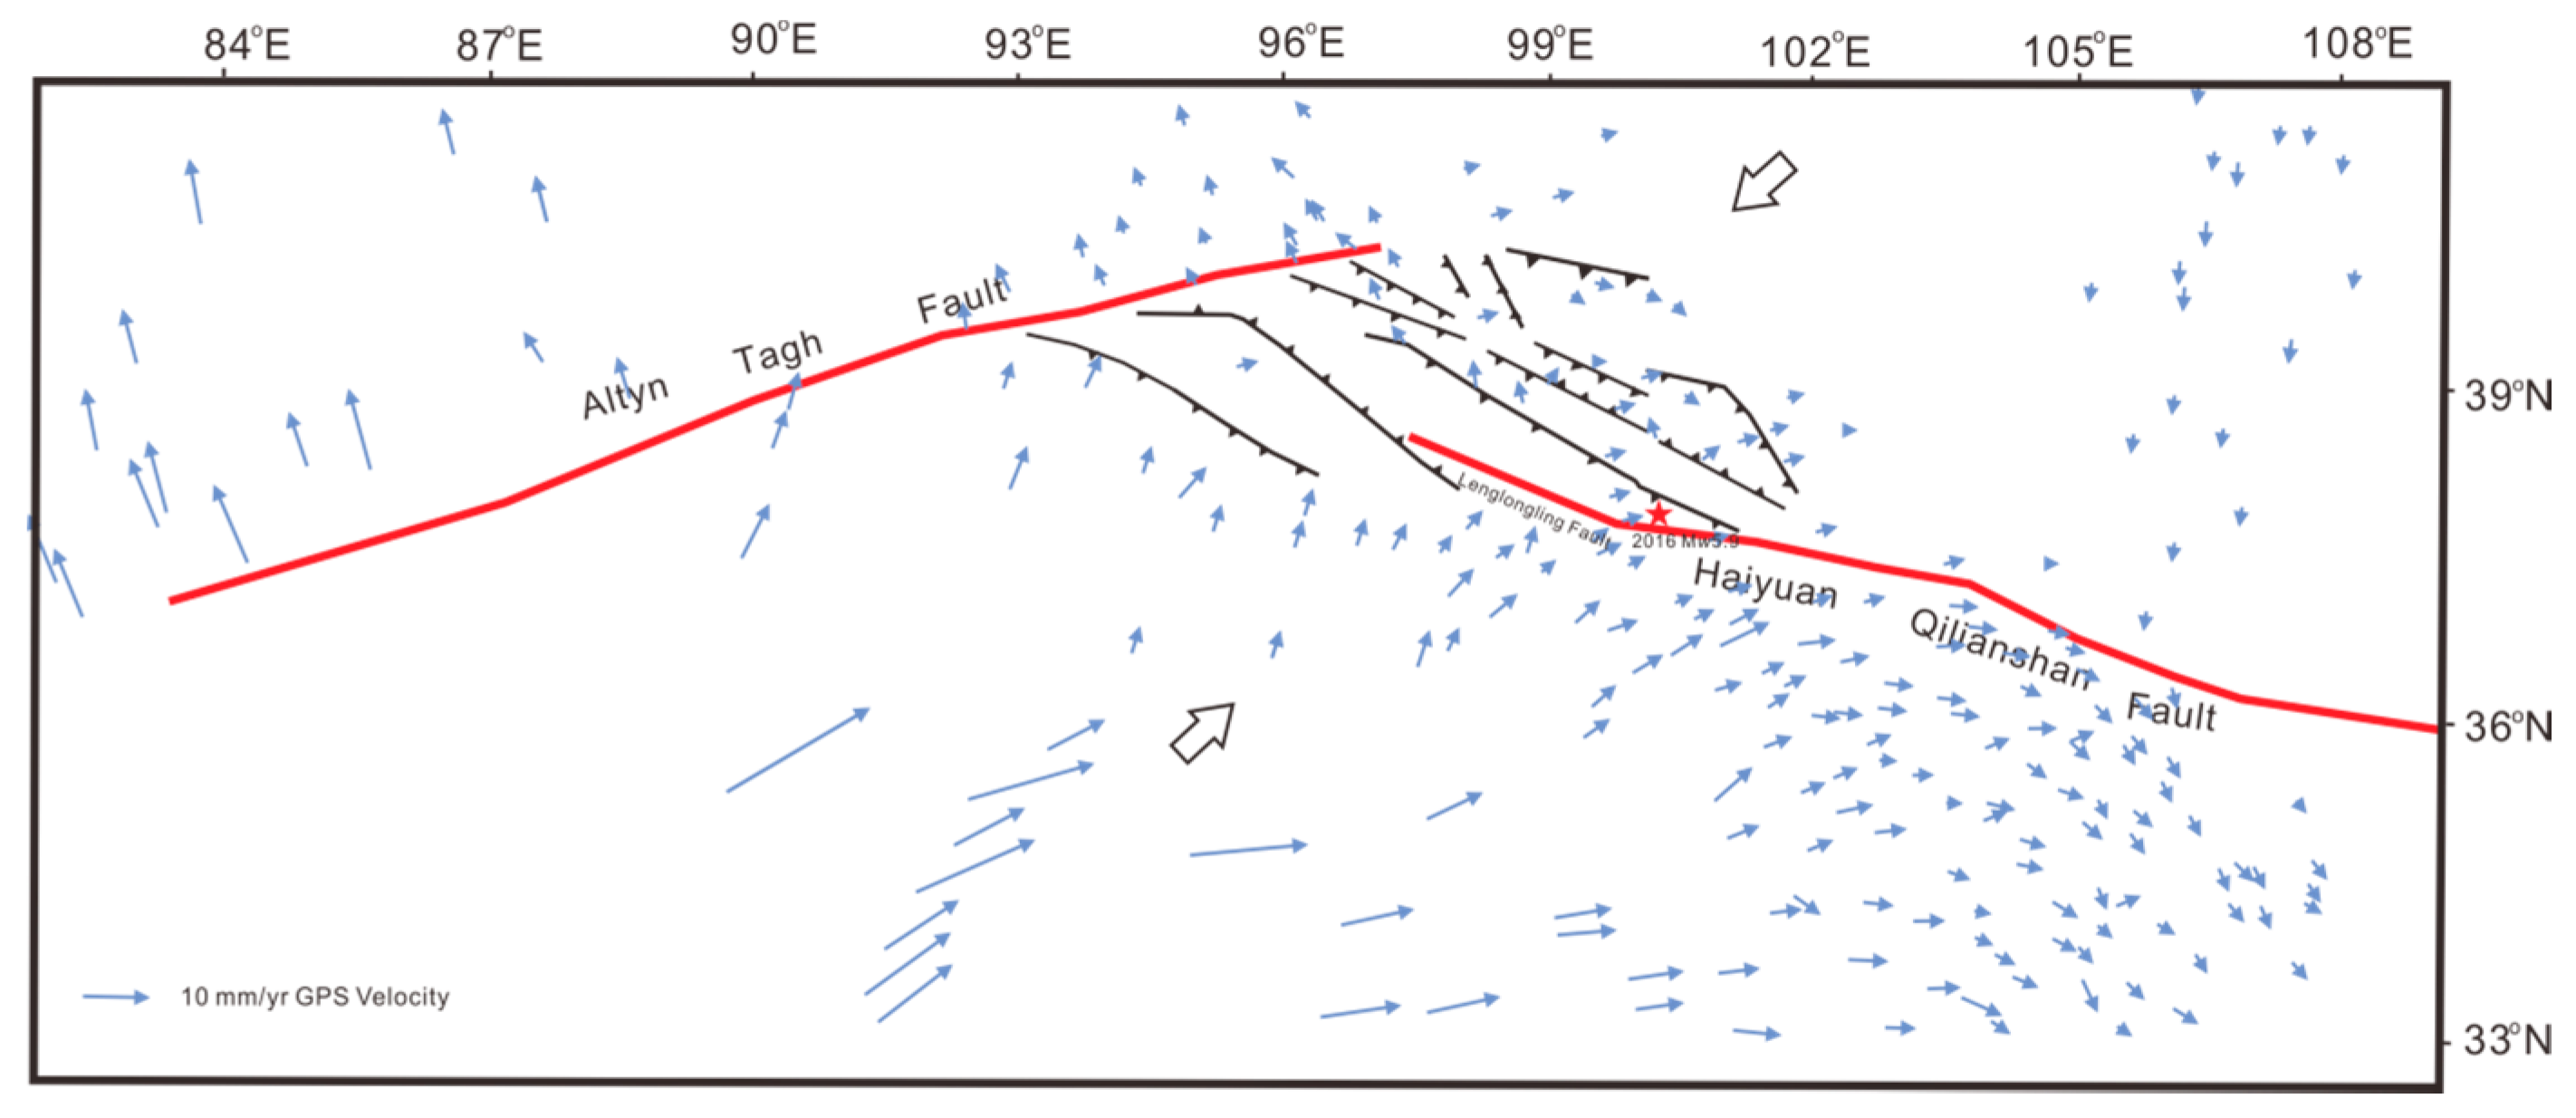
2. Tectonic Settings

The stress environment of seismic activity and tectonic deformation in the northeastern margin of the Tibetan Plateau is mainly derived from the northward push from the Indian plate. The continental collision of the India and Eurasia plates causes the plate convergence at a relative rate of 40–50 mm/year [5]. The northward thrusting of India beneath Eurasia led to the development of the Altyn-Tagh and Qilianshan orogens in the northern margin of the Tibetan Plateau and generated numerous earthquakes which consequently make this area one of the most seismically hazardous regions [6,7,8,9,10].
A large number of active faults are widely distributed, and control the activities of the strong earthquakes in this region. The earthquakes in the region have the characteristics of high frequency, high intensity, shallow hypocenter and wide distribution. It is one of the most active regions in China [11,12,13]. Geological research and GPS observation results show that the basic activities of the main boundary zone in the northeastern margin of the Qinghai Tibetan Plateau are left-lateral torsion and reverse thrust. Recently, the left-lateral activity has also been quite significant [11,14]. The GPS convergence rate shows that the northeastern margin of the Tibetan plateau is accumulating strain. From the compilation of historical records, it can certainly be shown that this region is capable of large magnitude events. The most recent of the 1986 Mw 6.0 Menyuan earthquake was in the western region [15].
The 2016 Menyuan earthquake occurred in the northeastern margin of the Tibetan plateau. This region is one of the most tectonically active areas. The Lenglongling left-lateral strike-slip fault is located in the front margin of the NE Tibetan plateau (Figure 1a), which plays an important role in adjustment and conversion of the tectonic deformation of this region [3]. This fault is also considered to be an important segment of the Qilian-Haiyuan fault [3,13,16]. Under regional structural stress, the crustal block is undergoing NE-oriented compression and shortening, clockwise rotation and extrusion along the SSE direction [12,17,18]. The overall strike of the Lenglongling fault is NE 110°~115°, and the length is approximately 120 km. The strike slip rate of the Lenglongling fault zone is within the range of 4–19 mm/a [3,13,16,17,18,19]. A seismic gap (Tianzhu seismic gap) has been observed on the Qilian-Haiyuan fault which is mainly composed of the Lenglongling fault, Jingqianghe fault, Maomaoshan fault and Laohushan fault [3]. Therefore, it is better to pay more attention to the tectonic deformation and seismic activity in this region.

3. InSAR Coseismic Measurements and Geodetic modeling

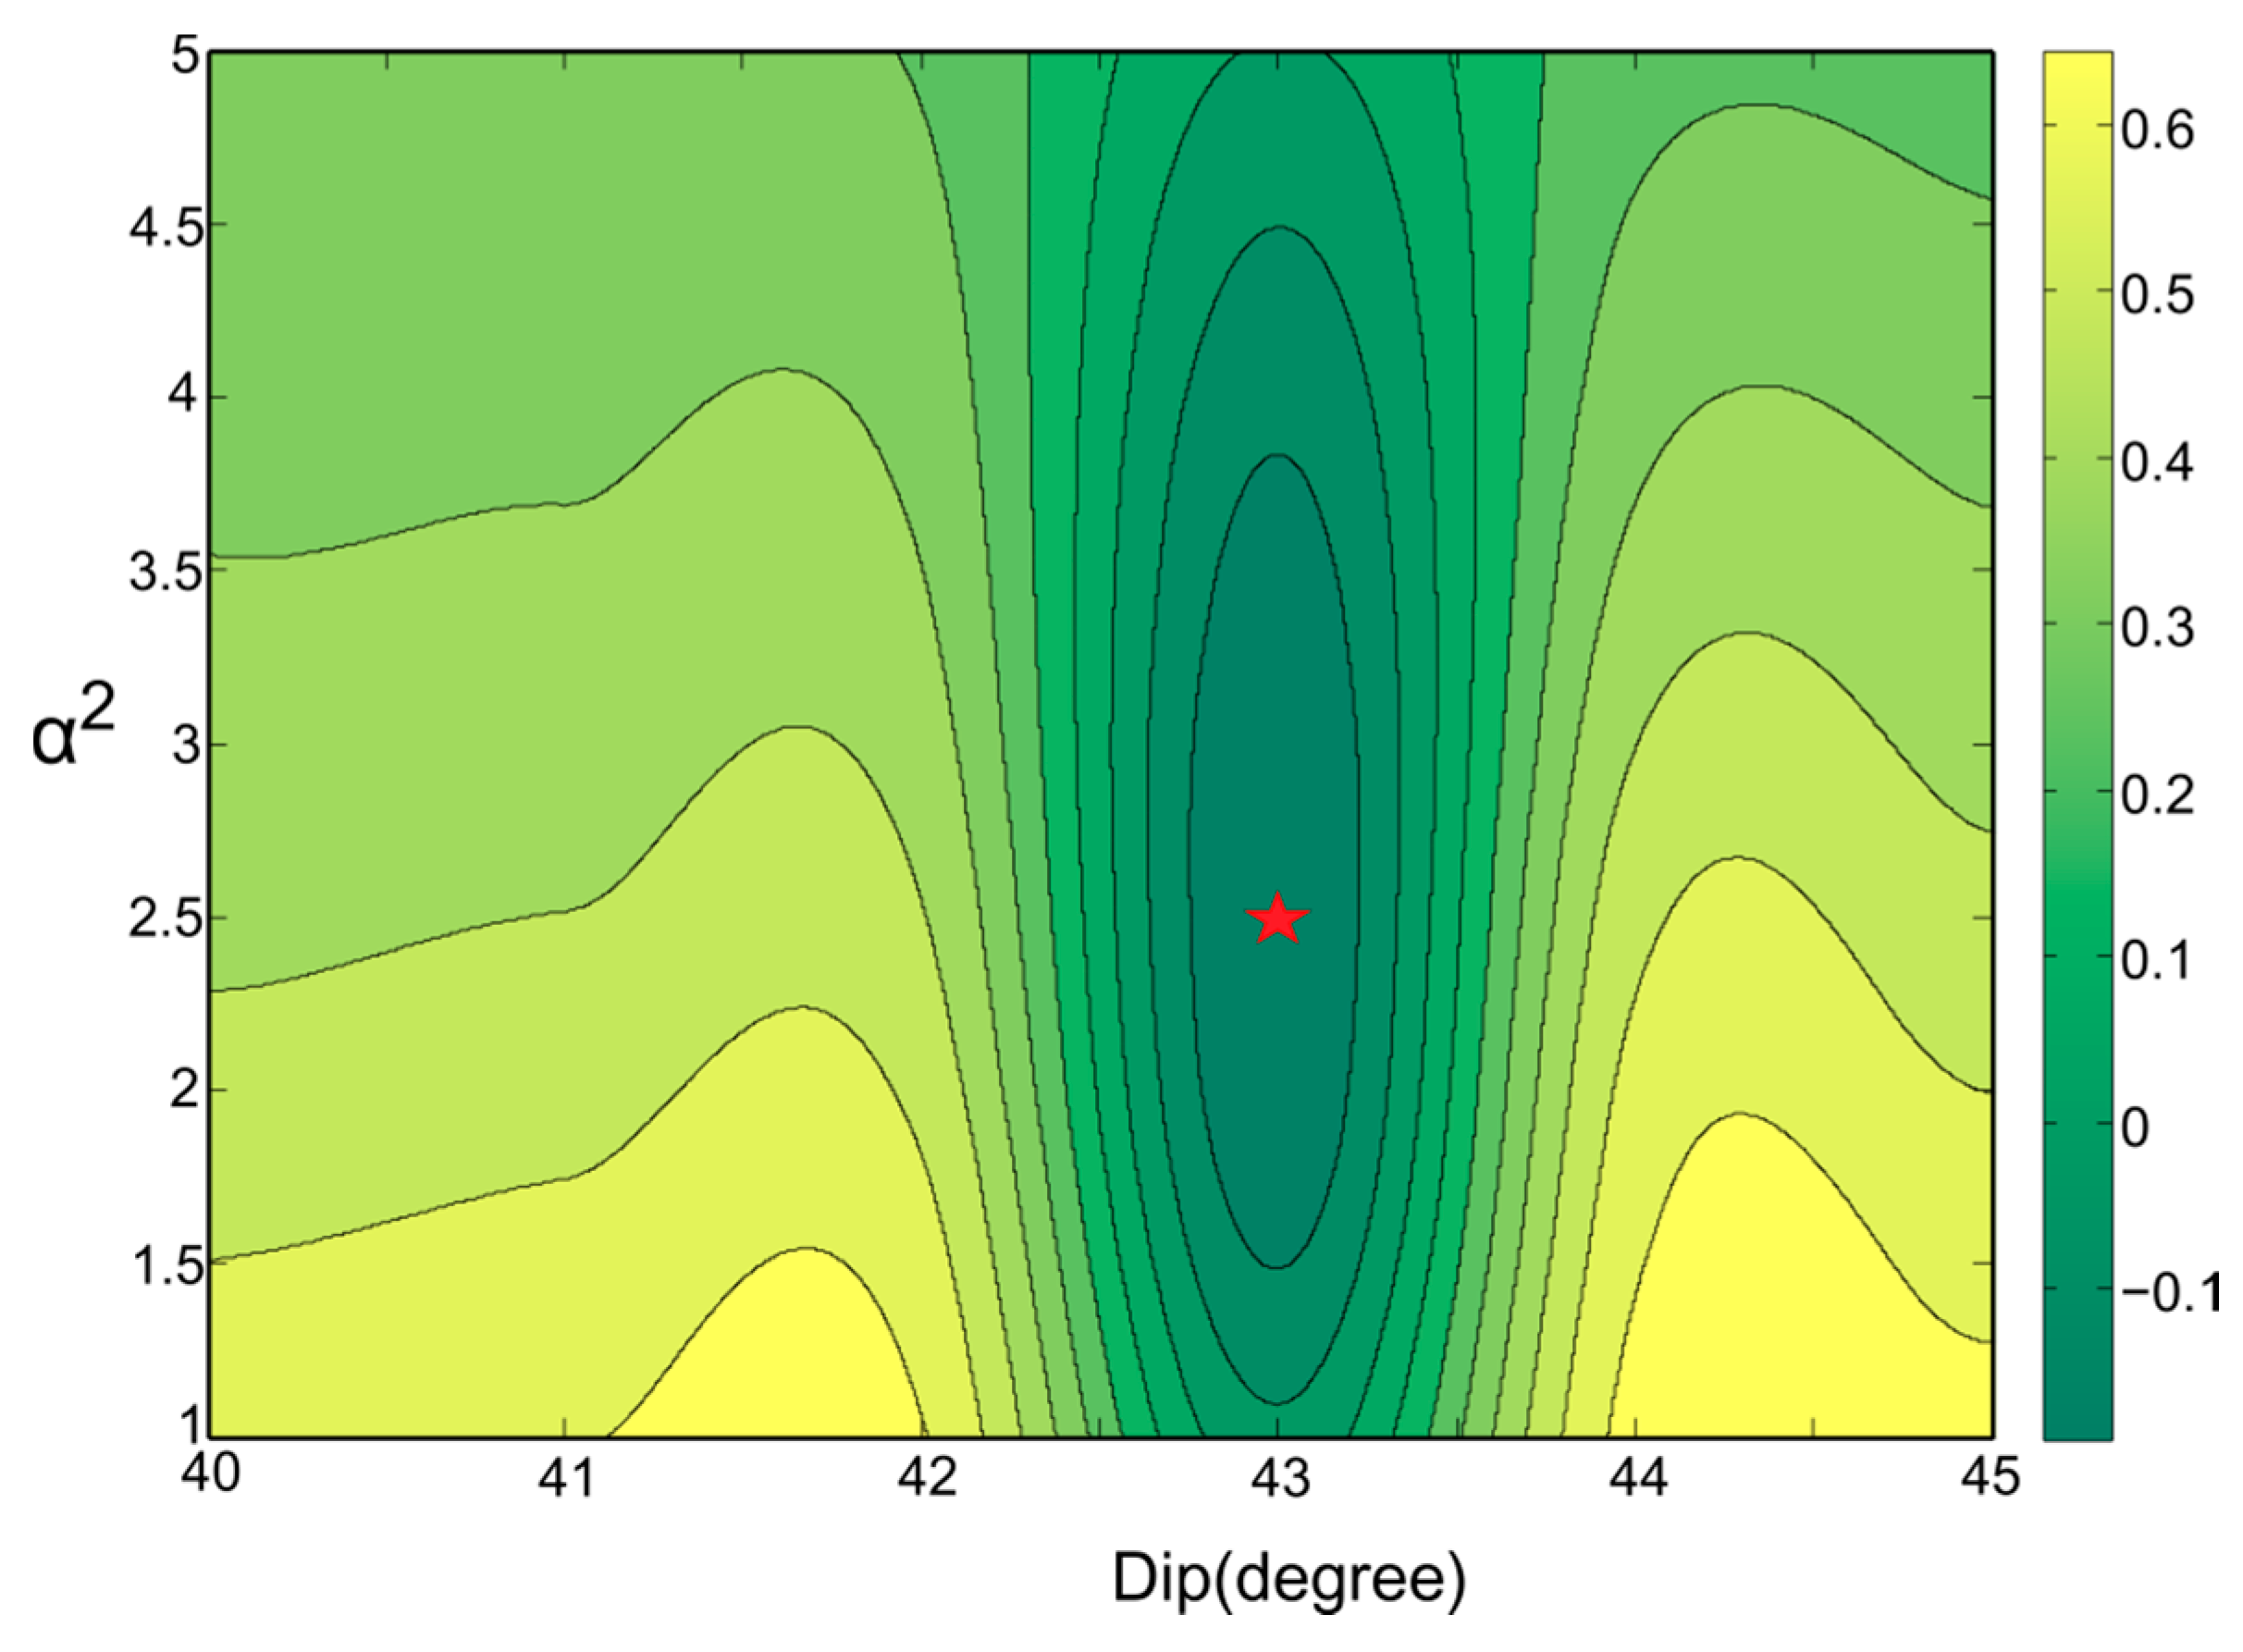
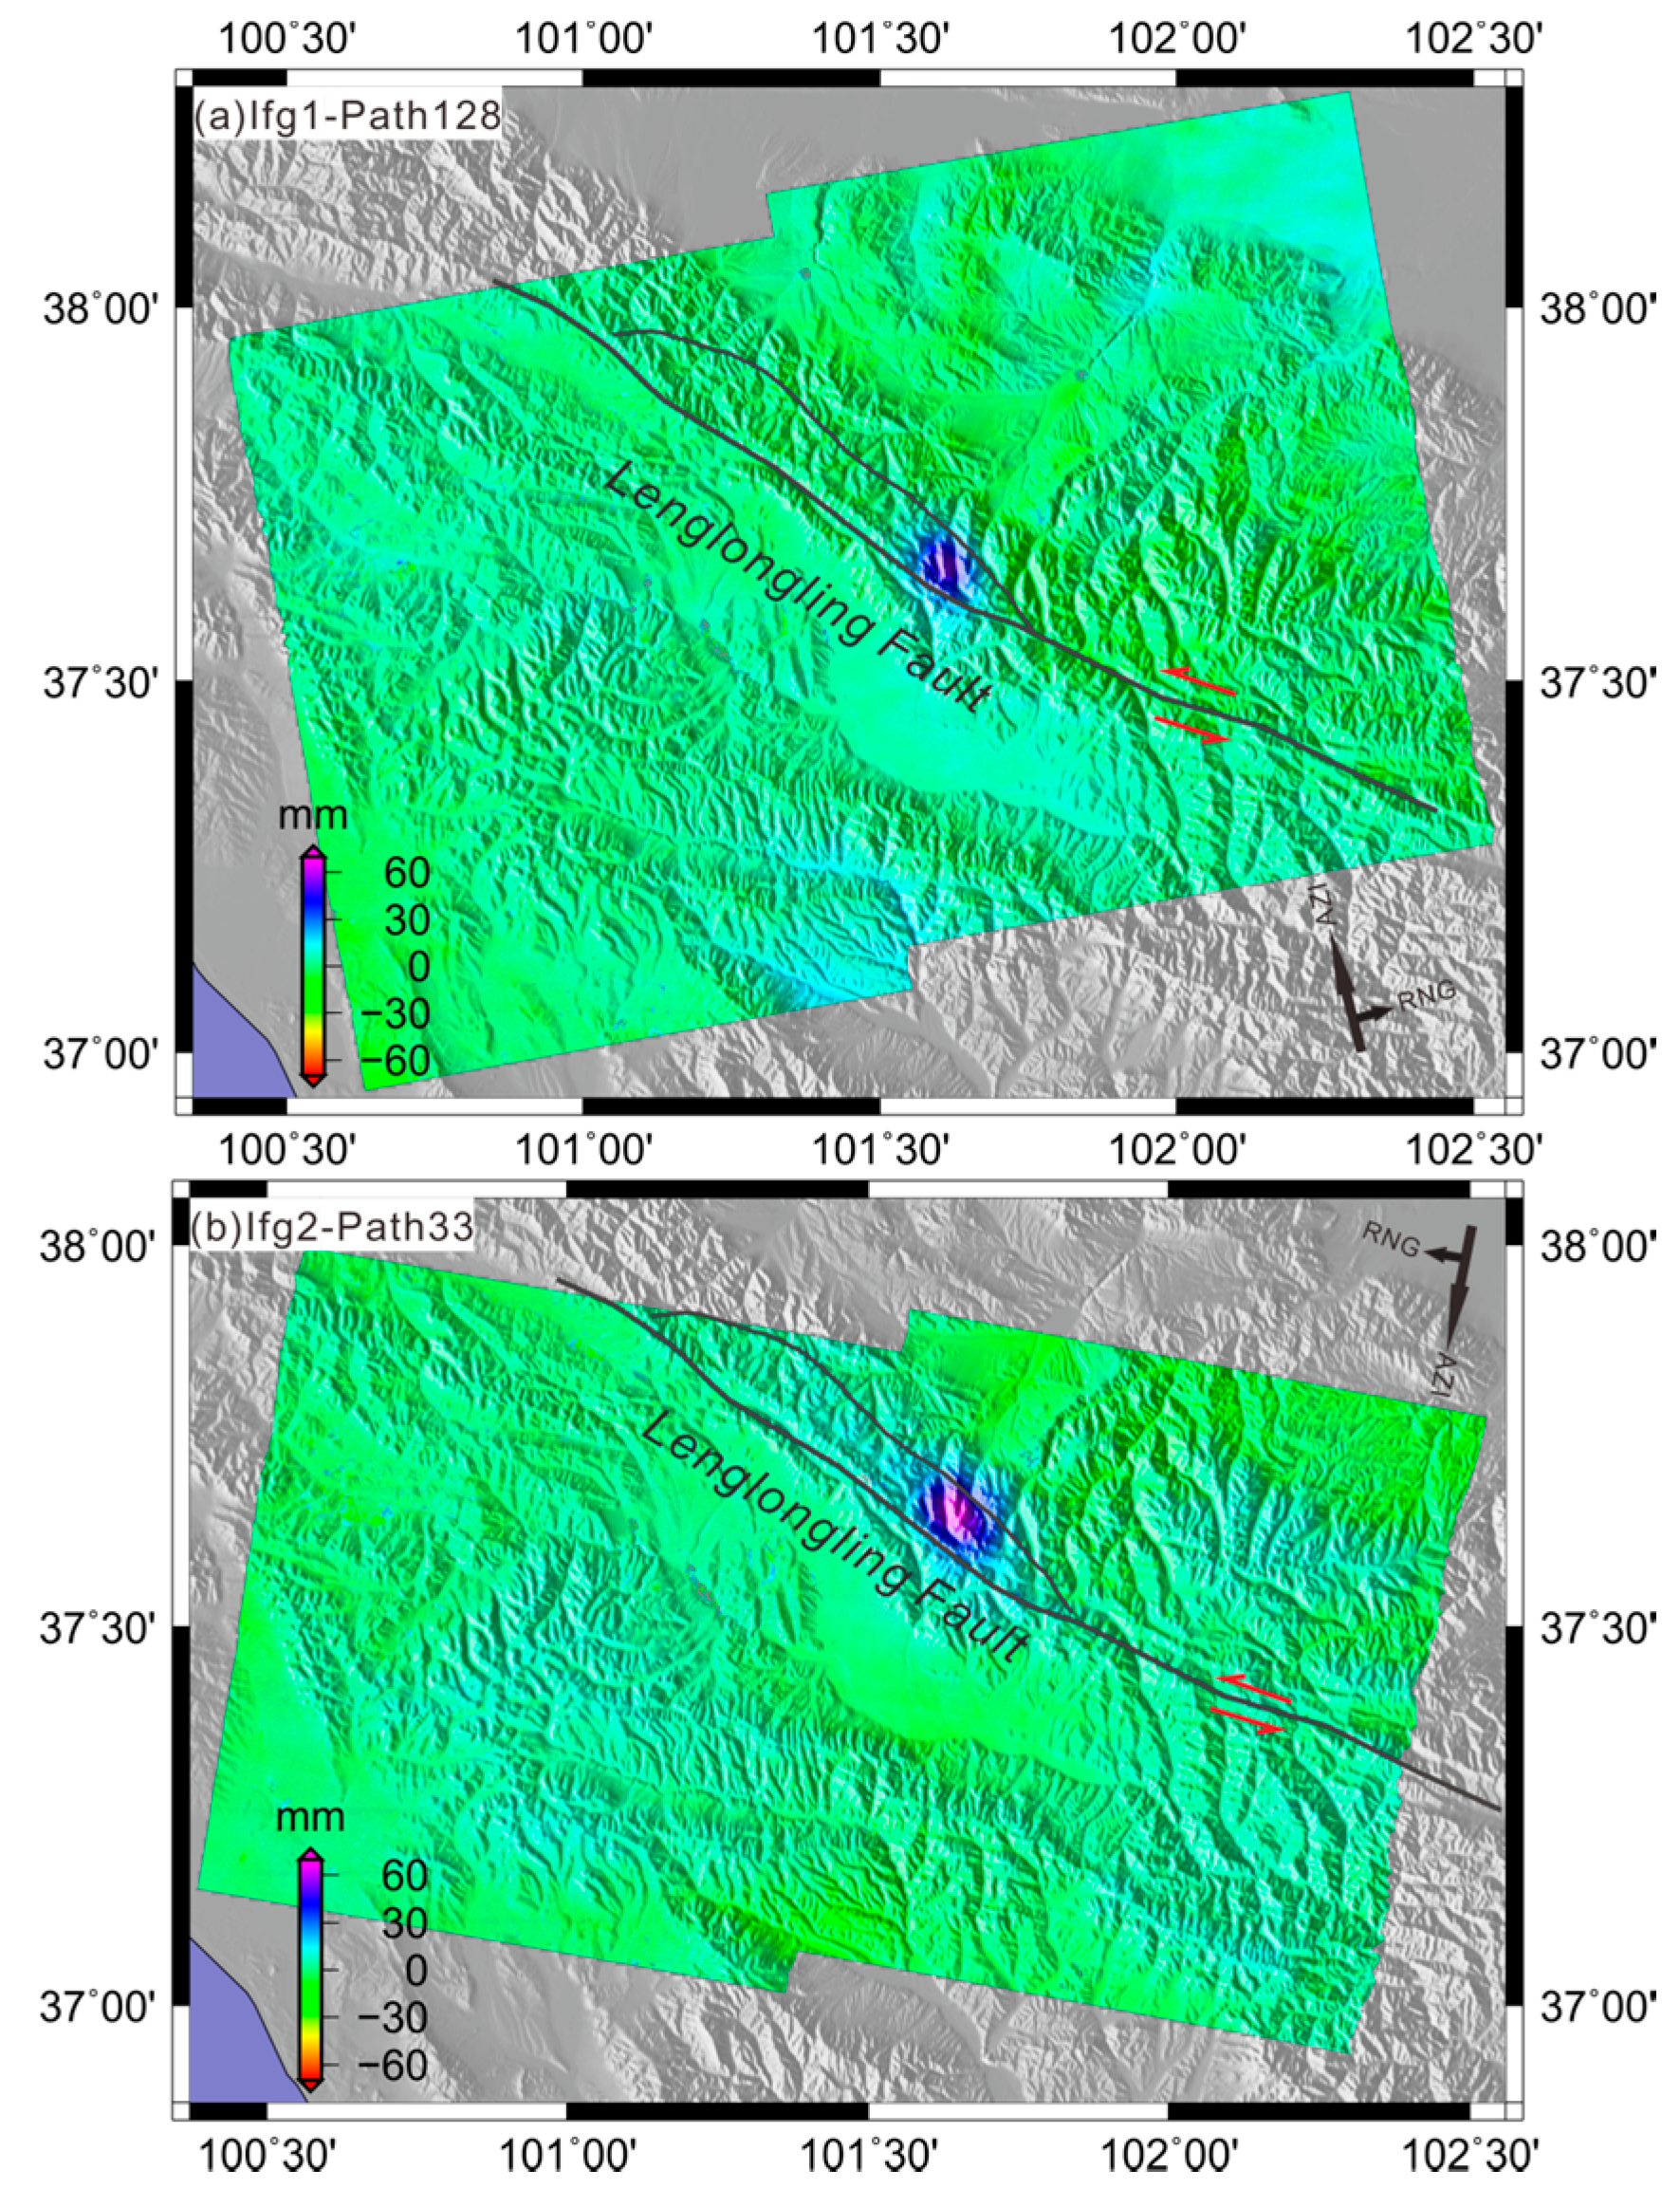
3.1. InSAR Coseismic Deformation

The coseismic deformation due to the 2016 Menyuan earthquake was mapped using both ascending and descending tracks of the Sentinel-1A TOPS (Terrain Observation with Progressive Scans) mode (paths 33 and 128). The ascending coseismic interferogram was generated from 13 January 2016 to 6 February 2016 (13 January 2016–6 February 2016), and the descending one was generated from 18 January 2016 to 11 February 2016 (18 January 2016–11 February 2016). The parameters of the interferometric pairs are shown in Table 1.
Due to a steep azimuth spectra ramp in each burst and a small overlap between consecutive bursts, conventional interferometry with TOPS SAR data is challenging [20]. GAMMA software supplies a new coregistration strategy to process TOPS SAR pairs, which uses a method that considers the effects of the scene topography and then uses a spectral diversity method that considers the interferometric phase of the burst overlap regions between any two adjacent bursts. The topographic phase is removed using a simulated phase from the 1-arc (~30 m) DEM from SRTM (Shuttle Radar Topography Mission). The phase filtering [21], phase unwrapping (e.g., using a minimum cost-flow approach [22]), phase to displacement conversion and coherence estimation are the same as those of the conventional stripmap interferometry. Finally, we obtain surface deformation maps (Figure 2a,b). The maps completely recorded the ground deformation field caused by the earthquake.
The deformation maps (Figure 2a,b) suggest an uplift of about 7 cm along the light of sight (LOS) direction of the satellite. The temporal and spatial baselines are relatively small (Table 1), and limited vegetation coverage exists in the epicenter region, thus the coherence is high. The patterns of the earthquake epicenter are smooth and distinct. Identifying the location of coseismic displacement from the interferograms is crucial to understanding the relationship between the ground motions detected by InSAR and the fault planes that caused the earthquakes [23,24]. Additionally, we compared the descending and ascending interferograms; the difference of deformation patterns can be observed in Figure 2. The deformation map of the descending track shows that the location is shifted relatively eastward and a little larger in magnitude. This is because the different SAR viewing geometric parameters could lead to different LOS deformation patterns.

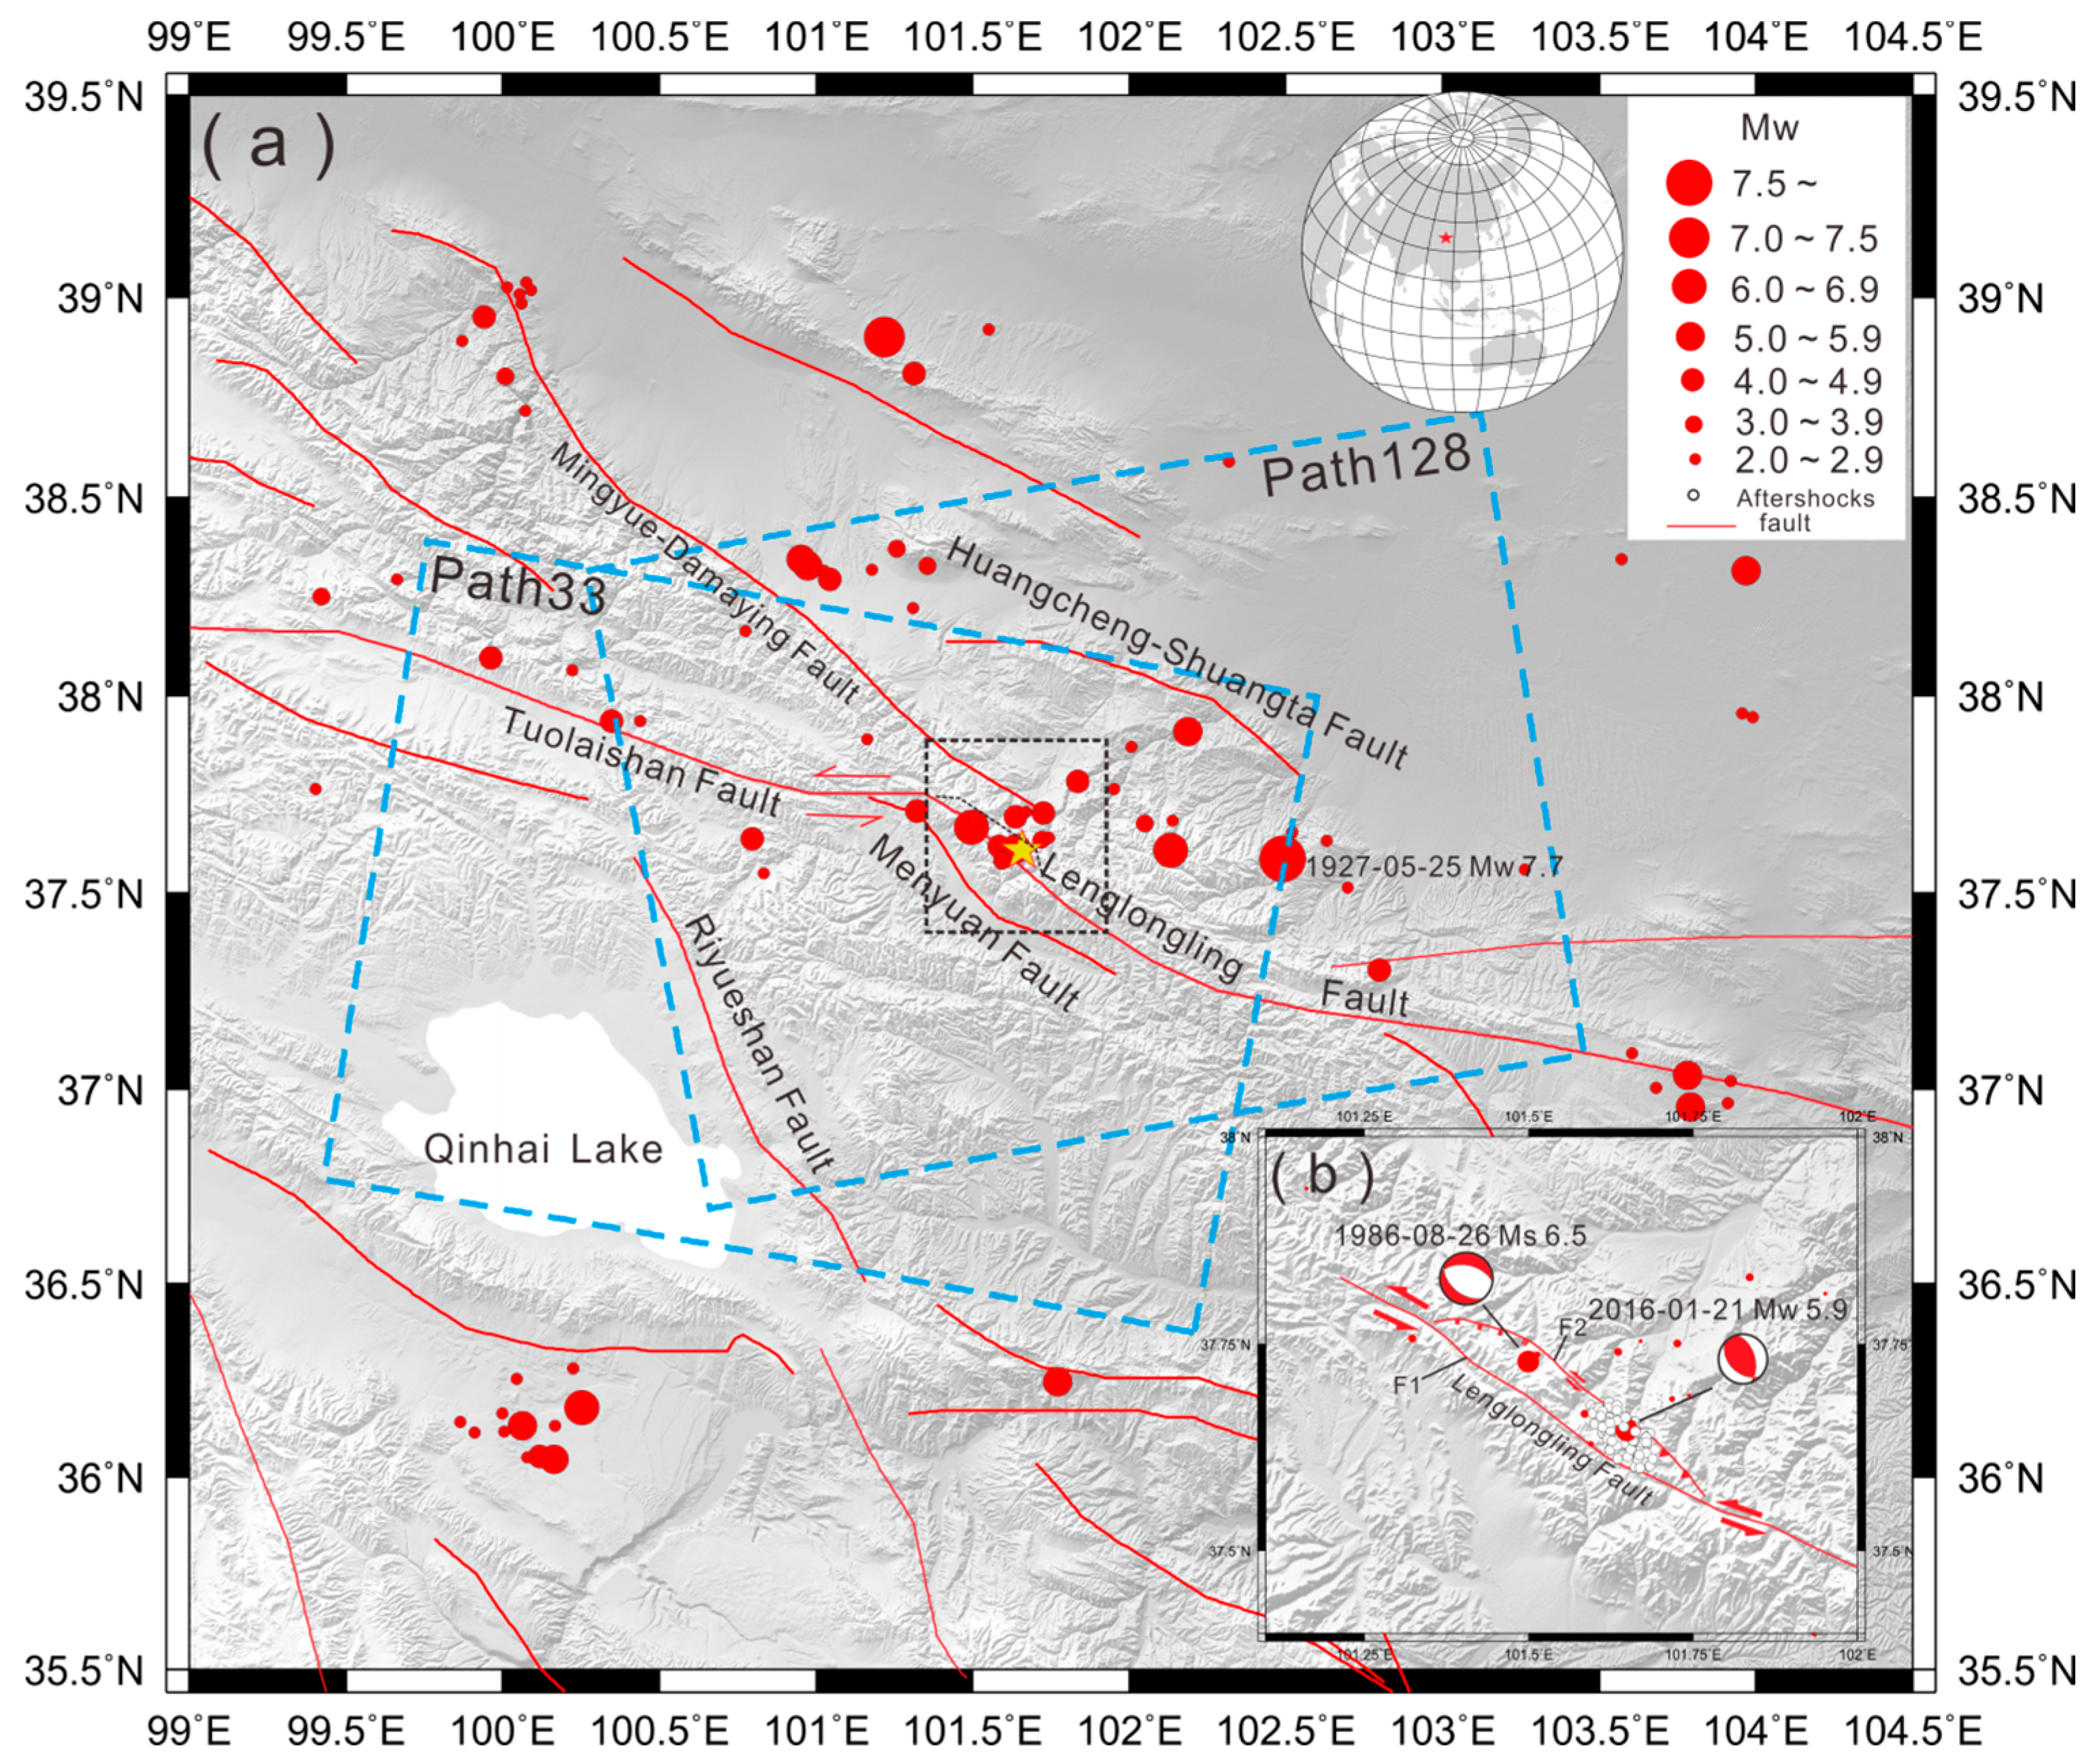
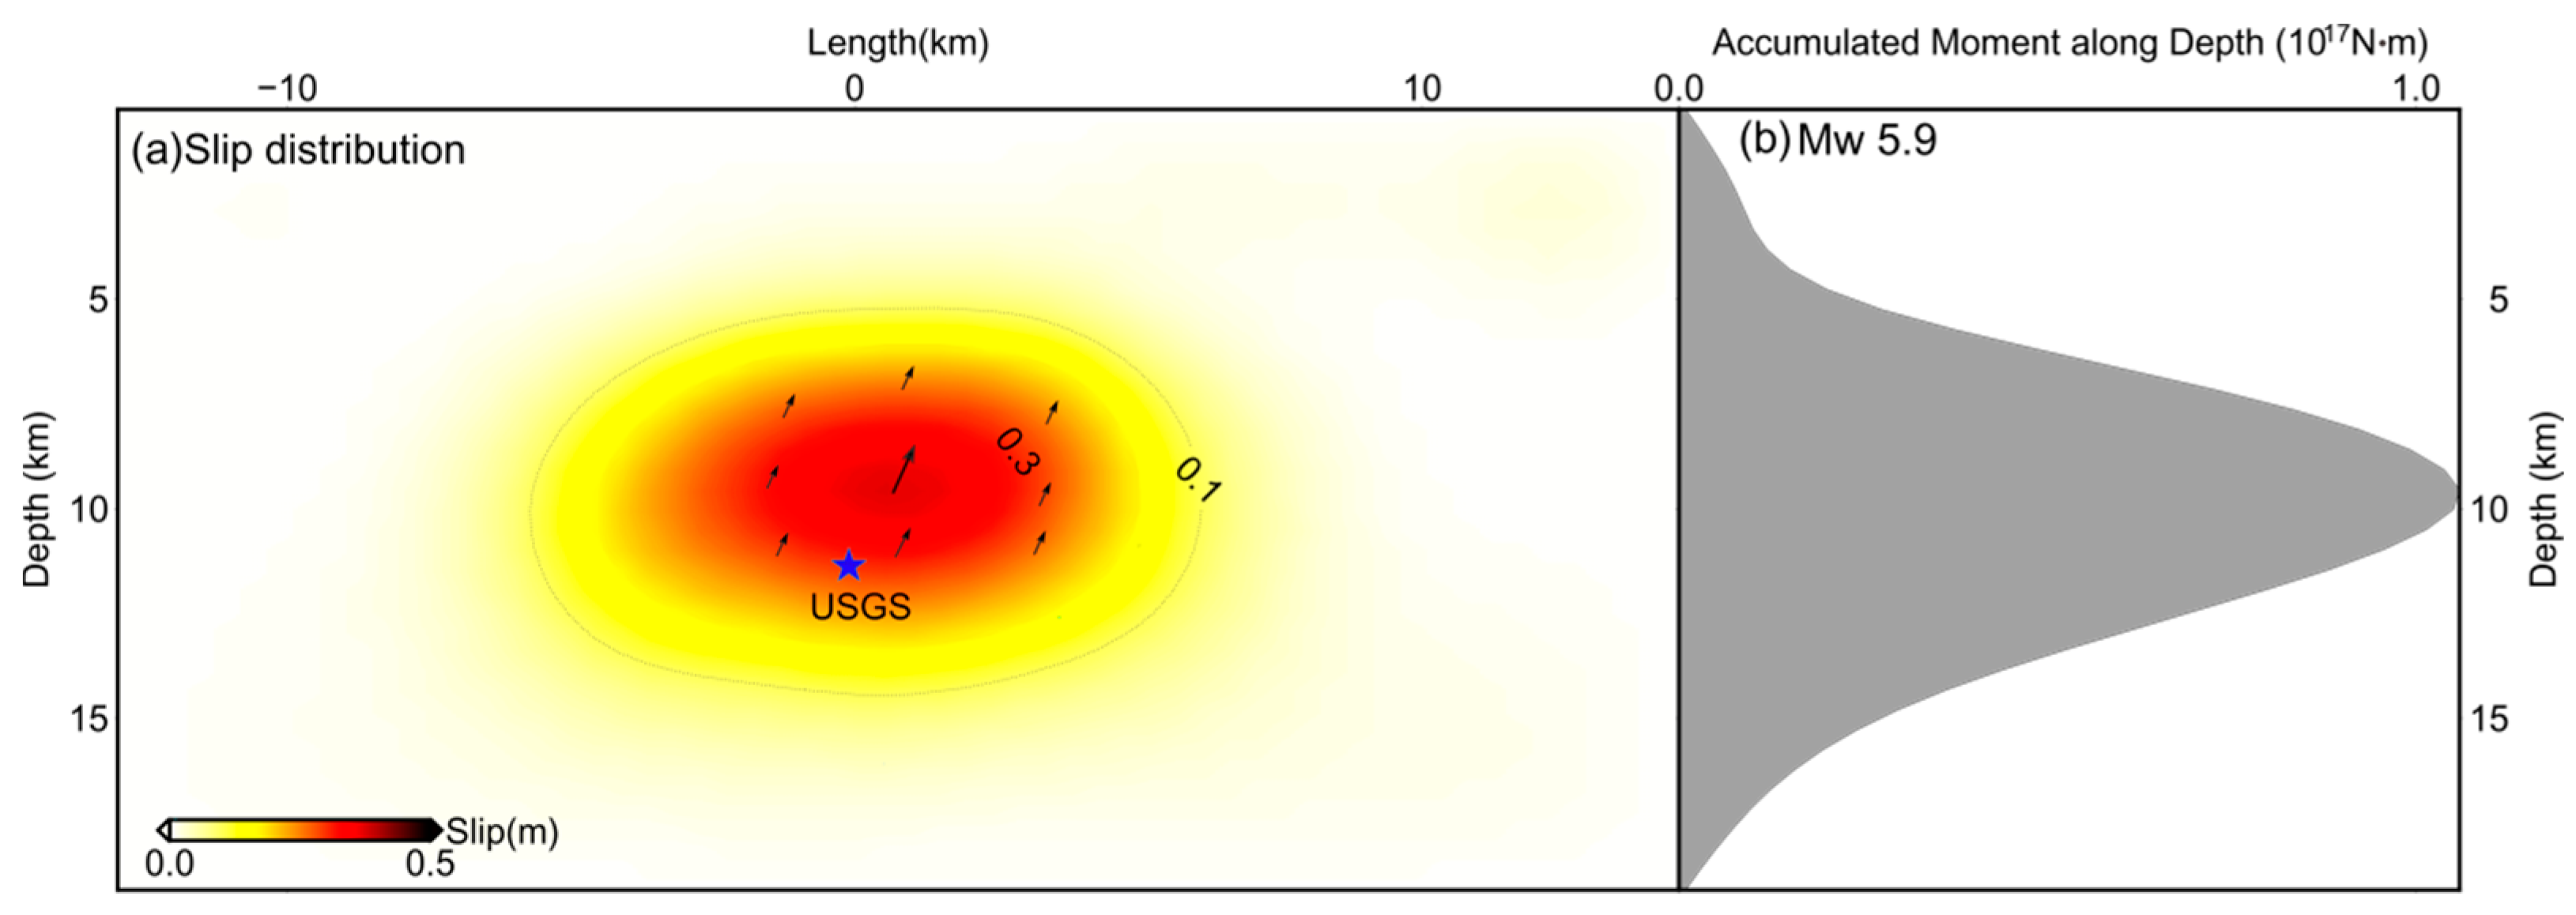
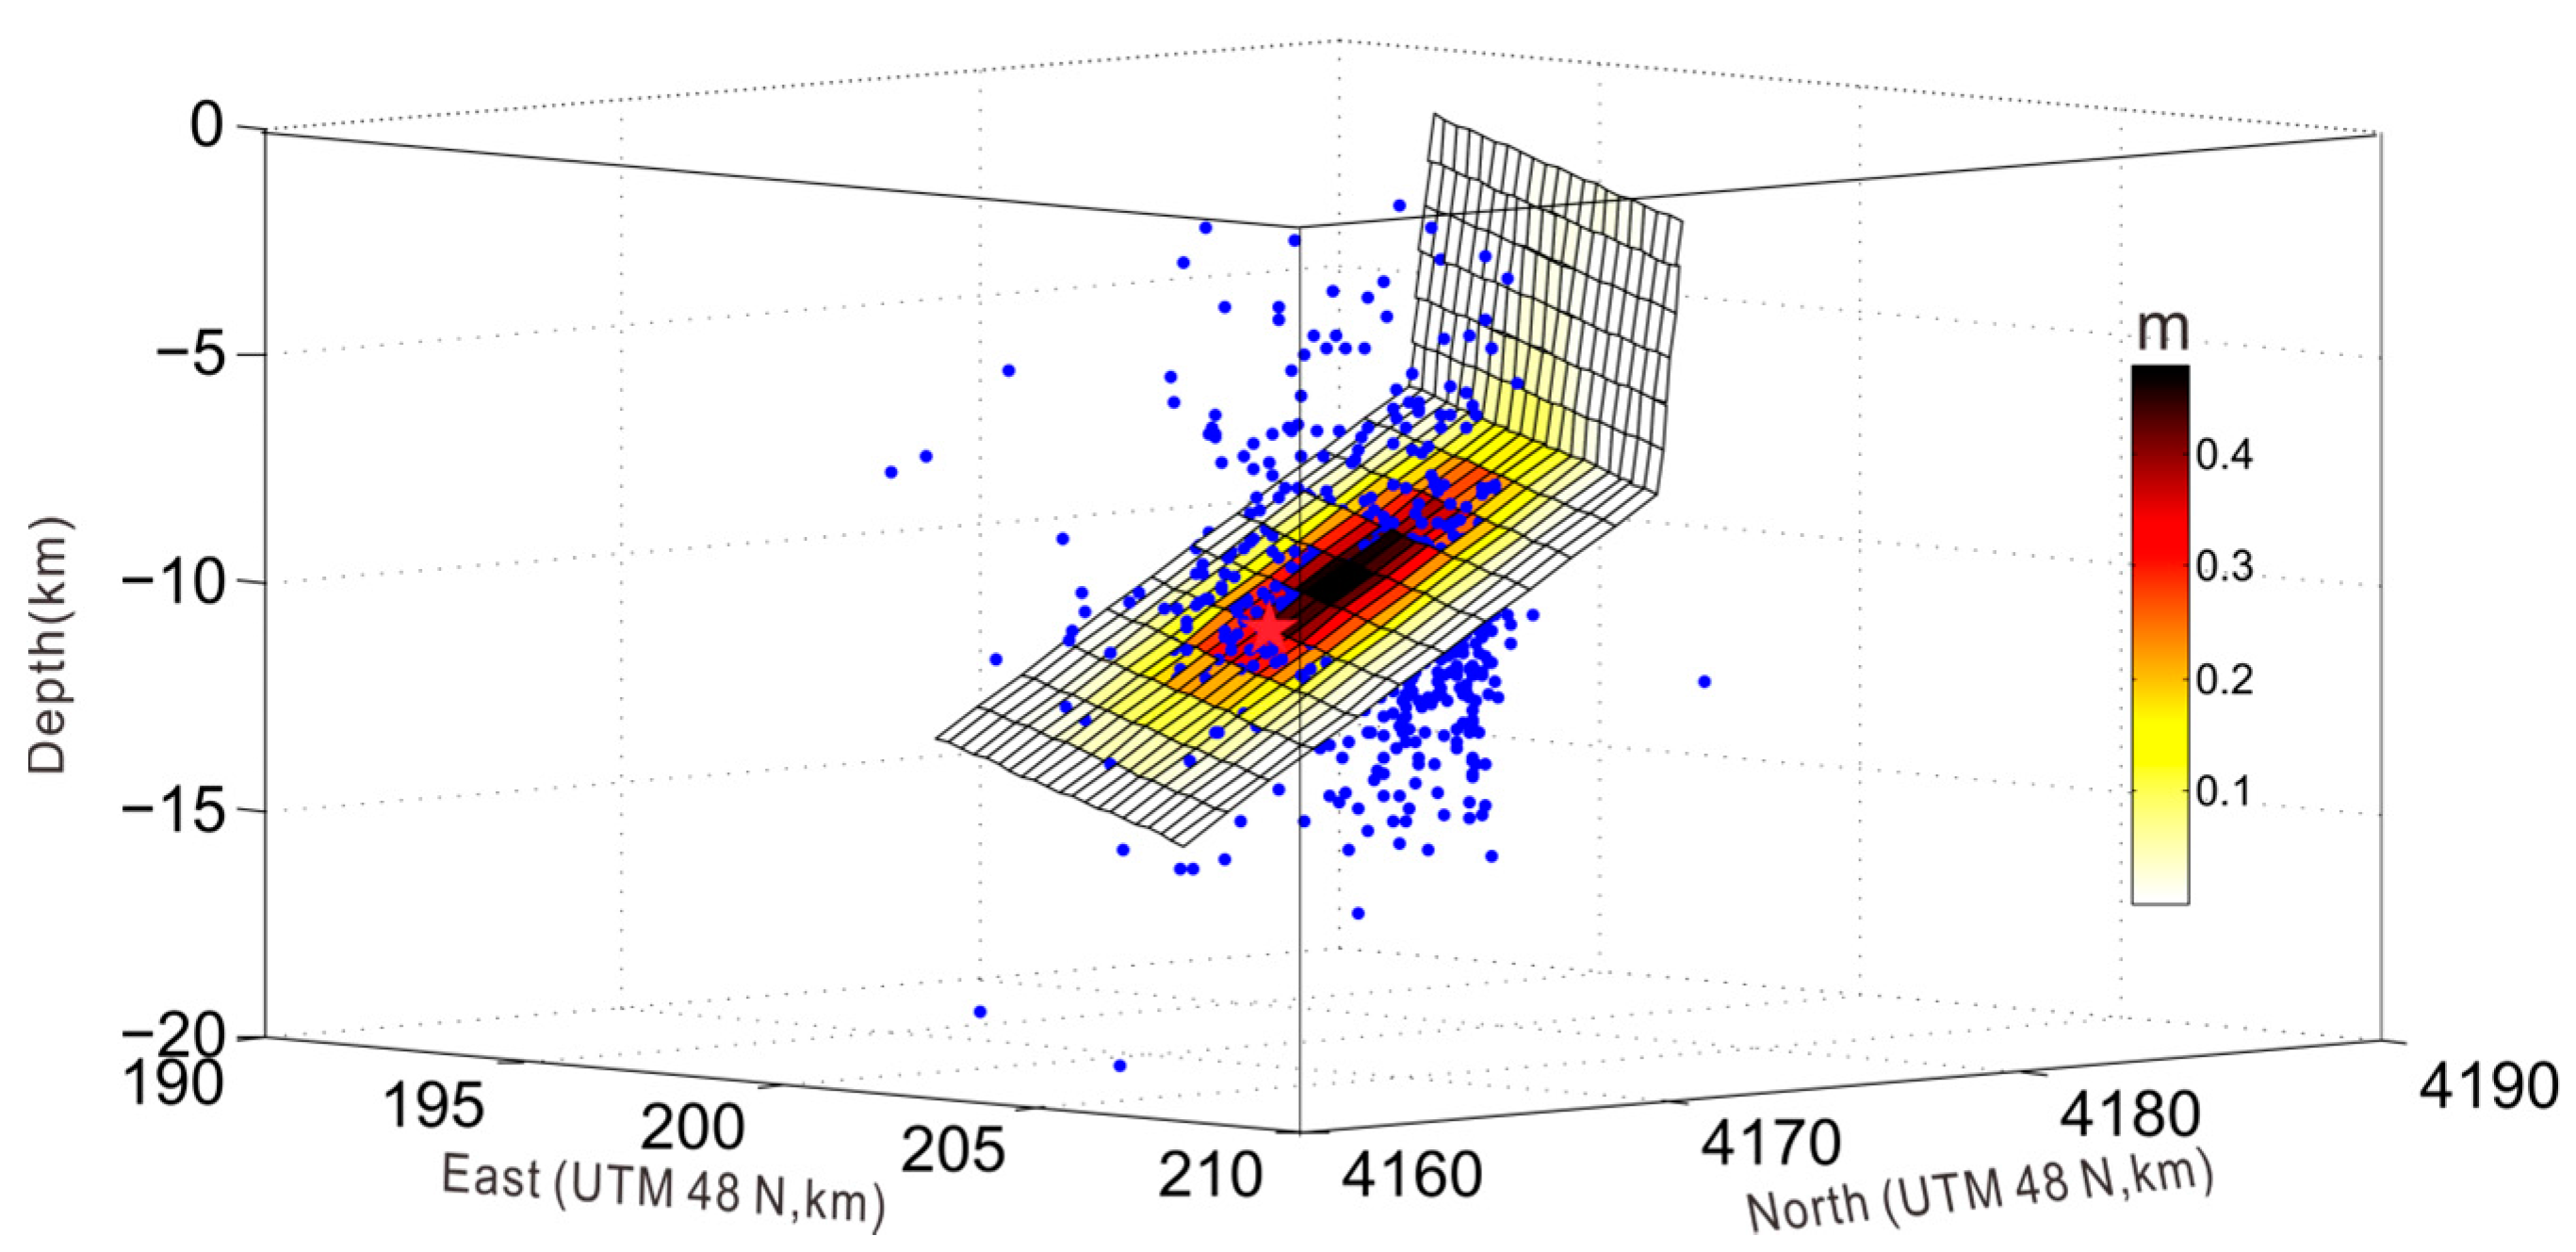
3.2. Geodetic Modeling for Earthquake Rupture

After detailed analysis of coherence, orbital ramp effects and atmospheric artifacts of the coseismc interfergrams, we use the coseismic deformation map of the Menyuan earthquake from Sentinel-1A satellite as the geodetic inversion constraints to determine the detailed slip distribution pattern on the causative fault. The main and secondary faults of Lenglongling are well constrained by fault distribution data, and the approximate location is guided by new and existing geologic mapping (Figure 2). From the fault geometric parameters, we can infer that the secondary fault of the Lenglongling was responsible for this earthquake. The secondary fault of the Lenglongling was derived from the geological mapping. From the whole geological structure background, a series of shovel like faults have been developed. Although the interferometric patterns in Figure 2 are very simple and can be inverted easily using the one-segment model, this event was triggered by a mid-dip angle fault (40°–45°) and the inferred junction between fault and surface is further north than the secondary fault. Thus, a two-segment fault model can be simpler and more effective at fitting the faults.
In order to constrain the possible geometric configurations, we model the surface geodetic displacements due to slip on the secondary fault of Lenglongling for varying fault dips and ramp location. We produced a two-segment shovel-shaped reverse fault model that can agree with InSAR observations of ground deformation. Note that the fault surface trace is fixed during the inversion based on the geological features. The two segments ruptured with different dip angles. The first fault segment extends toward the southwest with a dip of 85° down to 6.5 km. The second segment is relatively flat and deep with a dip of ~40°; it extends farther southwest, and it is responsible for this earthquake. The earthquake was mainly triggered by the deep parts, so we primarily inverted the deep segment; the shallow part is inferred from the supplementary information, such as the location of the fault and the aftershock distribution.
The source parameters and variable slip distribution were determined by using the geodetic inversion package PSOKINV [25], we conduct a global nonlinear inversion to determine the fault geometry of the 2016 Menyuan earthquake, which uses a random search method with Particle Swarm Optimization (PSO) based on an improved group cooperation algorithm [25,26]. First, we determined the fault location and principal focal mechanisms based on a uniform fault. From the structural features of the seismogenic faults, we approximate the geometry of the ruptured fault with two connected fault segments. The Okada elastic dislocation model [27] and PSO nonlinear optimization algorithm are employed to automatically compare and determine the optimum parameters of the simulation results, i.e., finding the minimum solution of the adaptation function in the whole parameter space. The best-fit uniform slip model suggests that the earthquake occurred at (101.65°, 37.64°) at a depth of 10.5 km. The fault had a strike of 134°, a dip of 40° and a slip angle of 65°. The magnitude could be up to Mw 5.9, which is consistent with the Global Centroid Moment Tensor Catalogue (GCMT) and USGS solutions, as shown in Table 2.
To determine the distribution of the coseismic slip, a linear inversion was used to estimate the slip distribution along a fixed fault plane which is determined from the uniform solutions. To prevent a physically impossible oscillatory slip, a Laplacian smoothing was employed to constrain the slip roughness [28]. The optimal dip angle and smoothing coefficient can be determined simultaneously by the log function [25,29]. We fixed a given dip angle and applied different smoothing coefficients, and then analyzed the variation trends. Figure 3 shows that a dip angle ranging from 40° to 45° and smoothing factor as in reference [16] allowed us to obtain the global minimum point. By applying the above methods, the dip angle and smoothing coefficients were determined as 43° and 2.5°, respectively. Figure 4 shows the simulated results derived from the optimal slip model. Figure 4a,d represents the InSAR observations. Figure 4b,e shows the simulation interferogram based on InSAR inversion. Figure 4c,f show the residuals relative to Figure 4b,e respectively. It is clear that the general patterns of the both Sentinel-1A observations can be sufficiently explained by the distributed slip model and there are no notable residual fringes left in the residuals (Figure 4c,f). The correlation coefficient between the observations and simulation is 95.4%.
Our optimal slip model suggests that the earthquake nucleation was initiated at the deeper ramp portion of the rupture plane (Figure 5 and Figure 6). The thrust propagation along the updip rift would have caused breaking of the shallow part of the fault, resulting in coseismic surface uplift [30]. Using the double-difference relocation algorithm, 647 aftershocks were relocated within 60 h of the main shock [31]. The aftershocks occurred along the maximum regional slip, and the aftershocks take on a shovel-shaped structure at a depth of 7–15 km (Figure 6). The relocation results of this event show that the mainshock and the aftershock sequence are mainly distributed in the southwest plane of the secondary fault.
Finally, the best-fit slip inversion model shown in Figure 5 and Figure 6 suggests that the major seismogenic fault is a thrust fault with a strike of ~134°, a dip of ~43° and an average rake angle of ~68°. The inferred optimal slip model suggests that the coseismic slip is concentrated at depths of 8–11 km. A maximum slip of ~0.45 m appears at a depth of 9.5 km. The cumulative seismic moment is up to 9.9 × 10¹⁷ N·m, equivalent to a magnitude of Mw 5.9. This reveals that the seismic distribution was under the control of the secondary fault of Lenglongling and of the extrusion force in the NE direction of the region.

4. Discussion

4.1. Lateral Variation of the Motion along the Lenglongling Fault

The Lenglongling fault zone is located at the frontal margin of the NE Tibetan Plateau. The overall stress field in this area is under the SW-NE extrusion. A great compressive nappe structure zone is formatted between the two predominant left-lateral strike-slip faults (Altyn Tagh fault and Haiyuan-Qilian fault) in the NE Tibetan Plateau (Figure 7). A series of active structural zones are thrust-nappe movements from southwest to northeast, which are mainly characterized by compressional thrust faults according to the results of GPS velocity field [15]. With the transition in space from the west to the Lenglongling fault zone, the movement of the blocks causes the clockwise rotation of the stress direction [12].
The movement mode of the Qilian-Haiyuan fault zone gradually changes to left-lateral strike slip from the west to the east. Many obduction faults in the north margin of the Lenglongling fault zone are in the southwest dipping direction and overthrusted successively from the south to the north [32]. These faults were turned into the shovel-shaped by the strong nappe structure under the continental driving [12]. Therefore, the 2016 earthquake was dip-thrusting with a limited strike slip component, which is consistent with the inversion results determined in Section 3.

4.2. Regional Active Tectonic Features Inferred from Two Earthquakes

Although the overall motion features of the Lenglongling fault is left-lateral strike-slip, due to the complexity of fault structure styles, different segments of the fault show different movement characteristics. The most direct representation is the obvious difference between the focal mechanism solution of the two earthquakes in 1986 and 2016 (Figure 1b). According to the previous research, focal mechanism solutions imply that the 1986 earthquake originated on a normal fault which was dominated by the dip slip component [4]. Its fault tensile activity is in a SEE direction. Regional crust extension induced this seismic activity and the tensile rupture zone of surface in the meizoseismal area also confirmed this conclusion [4]. The two earthquake epicenters are located in the secondary faults of western part of the Lenglongling fault zone, 5 km north of the main fault. The two ends of the secondary fault converge to the main faults which compose the left-order alignment in the west and right-order alignment in the east of the left-lateral strike-slip fault, respectively [33,34,35]. Therefore, the structural style and stress environment are complicated at the curved part of the two ends of the secondary fault, which may mean that the local faulting activity has a diversified performance.
The fault activity characteristics at the curved parts of the strike-slip fault can be changed due to the shear extension or compression (Figure 8). The curved part of the left-order alignment along the left-lateral strike-slip fault is shown as a shear extension and could produce a normal fault and pull-apart basin. In contrast, the right-order alignment along the left-lateral strike-slip fault is shown as a shear compression and could produce folding structure and reverse fault. The epicenter of the 1986 Menyuan earthquake is located in the NW section of the secondary faults, where the segment is in a shear tensile environment due to the left-lateral strike slip. Therefore, the focal mechanism of the earthquake shows a normal fault with a tiny shear effect. In contrast, the epicenter of the 2016 Menyuan earthquake is located in the SE section of the secondary fault and this segment is in a shear compression environment. In consequence, this event shows a very strong compression effect and caused significant uplift signals near the earthquake zone in the InSAR coseismic deformation map.

5. Conclusions

The surface displacements caused by the 2016 Mw 5.9 Menyuan earthquake have been derived from both the ascending and descending Sentinel-1A TOPS data. Two Sentinel-1A IW interferometric pairs show that the significant ground displacements have a maximum uplift of 7 cm in the satellite light-of-sight (LOS). A two-step inversion strategy was used to determine the fault geometry and slip distribution. The results show a two-segment shovel-shaped reverse fault model that can explain InSAR observations very well. The secondary fault of the Lenglongling fault zone should be responsible for this event. The best-fit slip model suggests that the coseismic slip is concentrated on the deeper segment of thrust fault with a strike of 134°, a dip of 43° and an average rake angle of 68°. The maximum slip of ~0.45 m occurred at a depth of ~9.5 km. The cumulative seismic moment is approximately up to 9.9 × 10¹⁷ N·m, which is equivalent to a magnitude of Mw 5.9. A joint analysis combined with the1986 Menyuan Earthquake near Lenglongling faults suggests that the western section of the secondary fault is in a shear tensile environment due to the left-lateral strike-slip of the Lenglongling fault zone, while the eastern section of the secondary fault is in a shear compression environment. The two earthquake sequences exactly reflected the left-lateral strike-slip characteristics of the Lenglongling faults zone. This showed us how to accommodate the regional tectonic deformation of the Qilian-Haiyuan tectonic zone and the stress variation characteristics of the NE Tibetan plateau.

Acknowledgments

This work was supported by Research grant from Institute of Crustal Dynamics, China Earthquake Administration under Grant (Grant numbers ZDJ2015-16 and ZDJ2015-15), National Natural Science Foundation of China under Grant (Grant number 41374050) and Major Projects of High Resolution Earth Observation of China (31-Y30B09-9001-13/15-02). We thank Wanpeng Feng for his constructive comments. The Sentinel-1A data we used were provided by the ESA. The relocation results of the aftershocks are supplied by Fan Lihua from Institute of Geophysics, China Earthquake Administration. We thank five anonymous reviewers for their detailed and thoughtful comments.

Author Contributions

Yongsheng Li Led the research work, designing the experiments and writing the first draft; Wenliang Jiang contributed to experiment implementation and geosciences result interpretation. Jingfa Zhang and Yi Luo contributed to paper writing and revision.

Conflicts of Interest

The authors declare no conflict of interest.

References

  1. U.S. Geological Survey (USGS). Available online: http://earthquake.usgs.gov/earthquakes/search/ (accessed on 16 June 2016).
  2. Global Centroid Moment Tensor Catalogue (GCMT). Available online: http://www.globalcmt.org/CMTsearch.html (accessed on 16 June 2016).
  3. Gaudemer, Y.; Tapponnier, P.; Meyer, B.; Peltzer, G.; Shunmin, G.; Zhitai, C.; Huagung, D.; Cifuentes, I. Partitioning of crustal slip between linked, active faults in the eastern Qilian Shan, and evidence for a major seismic gap, the ‘Tianzhu gap’, on the western Haiyuan Fault, Gansu (China). Geophys. J. Int. 1995, 120, 599–645. [Google Scholar] [CrossRef]
  4. Xu, J.; Yao, L.; Wang, J. Earthquake source mechanisms of Menyuan Earthquake (Ms = 6.4, on 26 August 1986) and its strong aftershocks. Northwest. Seismol. J. 1986, 8, 84–86. [Google Scholar]
  5. Liu, J.; Ji, C.; Zhang, J.Y.; Zhang, P.Z.; Zeng, L.S.; Li, Z.F.; Wang, W. Tectonic setting and general features of coseismic rupture of the 25 April 2015 Mw 7.8 Gorkha, Nepal earthquake. Chin. Sci. Bull. 2015, 60, 2640–2655. (In Chinese) [Google Scholar] [CrossRef]
  6. England, P.; Houseman, G. Finite strain calculations of continental deformation: 2. Comparison with the India-Asia collision zone. J. Geophys. Res. 1986, 91, 3664–3676. [Google Scholar] [CrossRef]
  7. England, P.; McKenzie, D. A thin viscous sheet model for continental deformation. Geophys. J. Int. 1982, 70, 295–321. [Google Scholar] [CrossRef]
  8. Dewey, J.F.; Shackleton, R.M.; Chang, C.; Yiyin, S. The tectonic evolution of the Tibetan Plateau. Philos. Trans. R. Soc. Lond. Ser. A Math. Phys. Sci. 1988, 327, 379–413. [Google Scholar] [CrossRef]
  9. Tapponnier, P.; Shu, Z.; Roger, F.; Meyer, B.; Arnaud, N.; Wittlinger, G.; Jingsui, Y. Oblique stepwise rise and growth of the Tibet Plateau. Science 2011, 294, 1671–1677. [Google Scholar] [CrossRef] [PubMed]
  10. Staisch, L.M.; Niemi, N.A.; Clark, M.K.; Chang, H. Eocene to late Oligocene history of crustal shortening within the Hoh Xil Basin and implications for the uplift history of the northern Tibetan Plateau. Tectonics 2016, 35. [Google Scholar] [CrossRef]
  11. Wang, S.; Zhang, X.; Zhang, S.; Zhang, X.; Xue, F. Characteristics of recent tectonic deformation and seismic activity in the northeastern margin of Tibetan Plateau. Acta Geosci. Sin. 2005, 26, 209–216. [Google Scholar]
  12. Yuan, D.Y.; Zhang, P.Z.; Liu, B. Geometrical imagery and tectonic transformation of the late Quaternay active tectonics in northeast margin of Qinghai-Xizang plateau. Acta Geol. Sin. 2004, 78, 270–278. (In Chinese) [Google Scholar]
  13. Zheng, W.; Zhang, P.; He, W. Transformation of displacement between strike-slip and crustal shortening in the northern margin of the Tibetan plateau: Evidence from decadal GPS measurements and late Quaternary slip rates on faults. Tectonophysics 2013, 584, 267–280. [Google Scholar] [CrossRef]
  14. Liang, S.; Gan, W.; Shen, C.; Xiao, G.; Liu, J.; Chen, W.; Ding, X.; Zhou, D. Three-dimensional velocity field of present-day crustal motion of the Tibetan Plateau derived from GPS measurements. J. Geophys. Res. Solid Earth 2013, 118, 5722–5732. [Google Scholar] [CrossRef]
  15. Gan, W.; Zhang, P.; Shen, Z.-K.; Niu, Z.; Wang, M.; Wan, Y.; Zhou, D.; Cheng, J. Present-day crustal motion within the Tibetan Plateau inferred from GPS measurements. J. Geophys. Res. 2007, 112, B08416. [Google Scholar] [CrossRef]
  16. Lasserre, C.; Gaudemer, Y.; Tapponnier, P.; Mériaux, A.-S.; van der Woerd, J.; Daoyang, Y.; Ryerson, F.J.; Finkel, R.C.; Caffee, M.W. Fast late Pleistocene slip rate on the Leng Long Ling segment of the Haiyuan fault, Qinghai, China. J. Geophys. Res. 2002, 107, 2276. [Google Scholar] [CrossRef]
  17. He, W.; Liu, B.; Yuan, D.; Yang, M. Research on the slip rate of the Lenglongling fault zone. Northwest. Seismol. J. 2000, 22, 90–97. (In Chinese) [Google Scholar]
  18. He, W.; Yuan, D.; Ge, W.; Luo, H. Determination of the slip rate of the Lenglongling fault in the middle and eastern segments of the Qilian mountain active fault zone. Earthquake 2010, 30, 131–137. (In Chinese) [Google Scholar]
  19. Li, Q.; Jiang, Z.; Wu, Y. Present-day tectonic deformation characteristics of Haiyuan-Liupanshan Fault Zone. J. Geodesy Geodyn. 2013, 33, 18–22. [Google Scholar]
  20. Wegmüller, U.; Werner, C.; Strozzi, T.; Wiesmann, A.; Frey, O.; Santoro, M. Sentinel- 1 a support in the GAMMA software. In Proceedings of the Fringe 2015 Conference, ESA ESRIN, Frascati, Italy, 23–27 March 2015.
  21. Goldstein, R.M.; Werner, C.L. Radar interferogram filtering for geophysical applications. Geophys. Res. Lett. 1995, 25, 4035–4038. [Google Scholar] [CrossRef]
  22. Chen, C.W. Statistical-Cost Network-Flow Approaches to Two-Dimensional Phase Unwrapping for Radar Interferometry. Ph.D. Thesis, Stanford University, Stanford, CA, USA, 2001. [Google Scholar]
  23. Copley, A.; Karasozen, E.; Oveisi, B.; Elliott, J.R.; Samsonov, S.; Nissen, E. Seismogenic faulting of the sedimentary sequence and laterally variable material properties in the Zagros Mountains (Iran) revealed by the August 2014 Murmuri (E. Dehloran) earthquake sequence. Geophys. J. Int. 2015, 203, 1436–1459. [Google Scholar] [CrossRef]
  24. Solaro, G.; De Novellis, V.; Castaldo, R.; De Luca, C.; Lanari, R.; Manunta, M.; Casu, F. Coseismic fault model of Mw 8.3 2015 Illapel Earthquake (Chile) retrieved from multi-orbit Sentinel1-A DInSAR measurements. Remote Sens. 2016, 8, 323. [Google Scholar] [CrossRef]
  25. Feng, W.; Li, Z.; Hoey, T.; Zhang, Y.; Wang, R.; Samsonov, S.; Li, Y.; Xu, Z. Patterns and mechanisms of coseismic and postseismic slips of the 2011 M W 7.1 Van (Turkey) earthquake revealed by multi-platform synthetic aperture radar interferometry. Tectonophysics 2014, 632, 188–198. [Google Scholar] [CrossRef]
  26. Feng, W.; Lindsey, E.; Barbot, S.; Samsonov, S.; Dai, K.; Li, P.; Li, Z.; Almeida, R.; Chen, J.; Xu, X. Source characteristics of the 2015 M W 7.8 Gorkha (Nepal) earthquake and its M W 7.2 aftershock from space geodesy. Tectonophysics 2016. [Google Scholar] [CrossRef]
  27. Okada, Y. Surface deformation due to shear and tensile faults in a half-space. Bull. Seismol. Soc. Amer. 1985, 75, 1135–1154. [Google Scholar]
  28. Harris, R.A.; Segall, P. Detection of a locked zone at depth on the Parkfield, California, segment of the San Andreas fault. J. Geophys. Res. 1987, 92, 7945–7962. [Google Scholar] [CrossRef]
  29. Bürgmann, R.; Ayhan, M.E.; Fielding, E.J.; Wright, T.J.; McClusky, S.; Aktug, B.; Demir, C.; Lenk, O.; Türkezer, A. Deformation during the 12 November 1999 Düzce, Turkey, earthquake, from GPS and InSAR data. Bull. Seismol. Soc. Am. 2002, 92, 161–171. [Google Scholar] [CrossRef]
  30. Sreejith, K.M.; Sunil, P.S.; Agrawal, R.; Saji, A.P.; Ramesh, D.S.; Rajawat, A.S. Coseismic and early postseismic deformation due to the 25 April 2015, Mw 7.8 Gorkha, Nepal, earthquake from InSAR and GPS measurements. Geophys. Res. Lett. 2016, 43. [Google Scholar] [CrossRef]
  31. Fang, L.; Wu, J.; Wang, W. Relocation of mainshock and aftershock sequences of Ms7.0 Sichuan Lushan earthquake. Chin. Sci. Bull. 2013, 58, 1901–1909. [Google Scholar] [CrossRef]
  32. Zhao, W.; Mechie, J.; Feng, M.; Si, D.; Xue, G.; Su, H.; Song, Y.; Yang, H.; Liu, Z. Cenozoic orogenesis of the Qilian Mountain and the lithosphere mantle tectonic framework beneath it. Geol. China 2014, 41, 1411–1423. (In Chinese) [Google Scholar]
  33. Taylor, M.; Yin, A. Active structures of the Himalayan-Tibetan orogen and their relationships to earthquake distribution, contemporary strain field, and Cenozoic volcanism. Geosphere 2009, 5, 199–214. [Google Scholar] [CrossRef]
  34. Wang, J.; Qin, B.; Dang, Q. A study on the fracture process of the Menyuan M6.4 earthquake occurred on 26 August 1986. North China Earthq. Sci. 1992, 10, 25–33. [Google Scholar]
  35. Li, Y.; Liu, X. Activity analysis of faults around Qilianshan before the 2016 Menyuan Ms6.4 earthquake. J. Geodesy Geodyn. 2016, 36, 288–293. [Google Scholar]
Figure 1. (a) Tectonic background of the 21 January 2016 Menyuan Earthquake superimposed on topographic relief. The star is location of the 2016 Menyuan event. The red lines denote the active faults. The blue frames are the coverage of the Sentinel-1A data. The red dots show the historic events since 1927; (b) The partially enlarged view of the black dotted frames in (a). F1: The main fault of Lenglongling; F2: The secondary fault of Lenglongling; the circles express the aftershocks location. Both ends of the secondary fault of Lenglongling are bent to converge to the main fault.
Remotesensing 08 00519 g001
Figure 2. The light of sight (LOS) deformation maps of the 2016 Menyuan earthquake. Each map is labeled and has a background of shaded topography. The black lines indicates the main and the secondary fault of Lenglongling. (a) Ascending LOS deformation map with pairs 13 January 2016–6 February 2016; (b) Descending LOS deformation map with pairs 18 January2016–11 February 2016. The main and the secondary faults of Lenglongling are labeled consistently with Figure 1b.
Remotesensing 08 00519 g002
Figure 3. Contour map of log function with variations in dips and smoothing coefficients (α2). The red star indicates the global minimum point.
Remotesensing 08 00519 g003
Figure 4. Original, modeled and residual interferograms for InSAR-derived slip models. (ac) are from SENTINEL-1A Path 128 while (df) are from SENTINEL-1A Path 33.
Remotesensing 08 00519 g004
Figure 5. Slip distribution of the Menyuan earthquake. (a) Coseismic slip model of the 2016 Menyuan earthquake derived using two paths of Sentinel-1A IW deformation maps; (b) The seismic moment distribution along the depth in the slip model.
Remotesensing 08 00519 g005
Figure 6. Three-dimensional illustration of Slip distribution of the Menyuan earthquake. The blue points represent the relocation of aftershocks, the red star denotes the epicenter.
Remotesensing 08 00519 g006
Figure 7. Tectonic transformation mode in the Lenglongling fault.
Remotesensing 08 00519 g007
Figure 8. Three-dimensional block diagram of the geometry proposed for the Lenglongling fault. Red rectangles indicate the compression regions of the secondary fault of Lenglongling, while the blue ones indicate the tensile regions.
Remotesensing 08 00519 g008
Table 1. Sentinel-1A pairs used in this study.
No.Acquisition TimePathModeOrbitBIncidence
Ifg120160113–20160206128ScanSARAsc1530°–46°
Ifg220160118–2016021133ScanSARDes6.530°–46°
Table 2. Optimal fault geometric parameters determined with Sentinel-1A coseismic deformation.
SourceLocationEpicenter Depth (km)Focal MechanismsFault Dimensions (km)Magnitude
Lon (°)Lat (°)Strike (°)Dip (°)Rake (°)LengthWidth
GCMT101.7637.6513.91344368--5.9
USGS101.64137.679.0 ± 1.61344368--5.9
This study101.6537.6410.5134406520105.9 a
101.6537.6410.5134436824205.9 b
a Fault parameters derived from uniform slip model; b Fault parameters derived from distributed slip model.

