

-
A NIST-Traceable Lab-to-Sky Spectral and Radiometric Calibration for NASA’s High-Altitude Airborne Hyperspectral Pushbroom Imager for Cloud and Aerosol Research and Development (PICARD) -
Long-Term Automated Mapping of Woody-Vegetation Dynamics in Hydrologically Altered Floodplains: An Open Data Cube Workflow Using Digital Earth Australia -
Long-Term Wildfire Emissions and Smoke-Plume Dynamics in Greece
Journal Description
Remote Sensing
Remote Sensing
is an international, peer-reviewed, open access journal about the science and application of remote sensing technology, published semimonthly online by MDPI. The Remote Sensing Society of Japan (RSSJ) and Japan Society of Photogrammetry and Remote Sensing (JSPRS) are affiliated with Remote Sensing and their members receive discounts on the article processing charge.
- Open Access— free for readers, with article processing charges (APC) paid by authors or their institutions.
- High Visibility: indexed within Scopus, SCIE (Web of Science), Ei Compendex, PubAg, GeoRef, Astrophysics Data System, Inspec, dblp, and other databases.
- Journal Rank: JCR - Q1 (Geosciences, Multidisciplinary) / CiteScore - Q1 (General Earth and Planetary Sciences)
- Rapid Publication: manuscripts are peer-reviewed and a first decision is provided to authors approximately 22 days after submission; acceptance to publication is undertaken in 2.9 days (median values for papers published in this journal in the first half of 2026).
- Recognition of Reviewers: reviewers who provide timely, thorough peer-review reports receive vouchers entitling them to a discount on the APC of their next publication in any MDPI journal, in appreciation of the work done.
- Companion journal: Geomatics.
- Journal Cluster of Geospatial and Earth Sciences: Remote Sensing, Atmosphere, Geosciences, Climate, Quaternary, Earth, Geographies, Geomatics, Meteorology and Fossil Studies.
Impact Factor:
4.3 (2025);
5-Year Impact Factor:
5.0 (2025)
Latest Articles
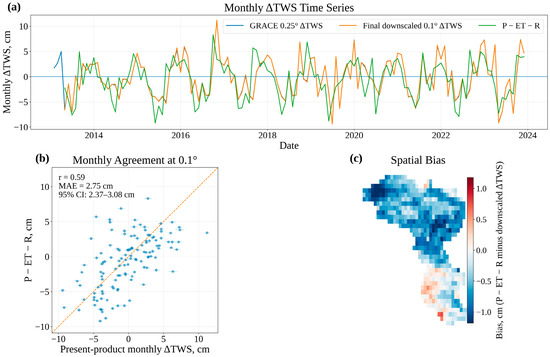
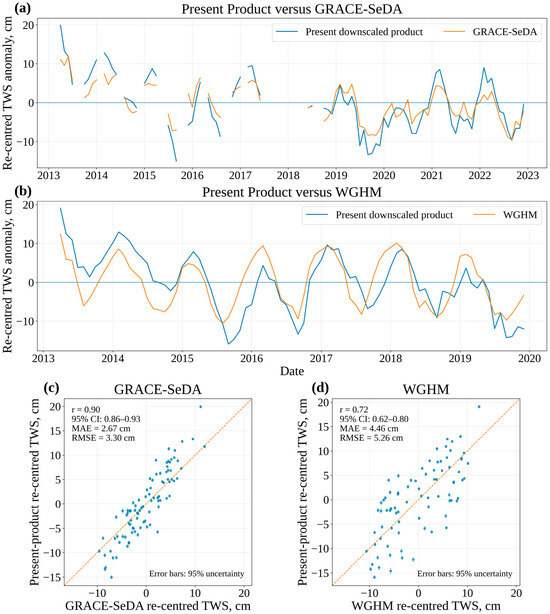
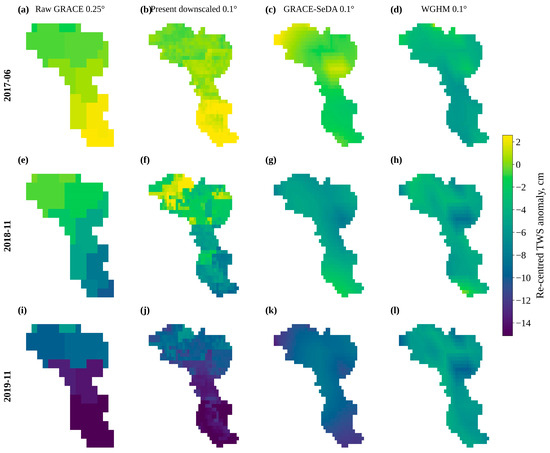
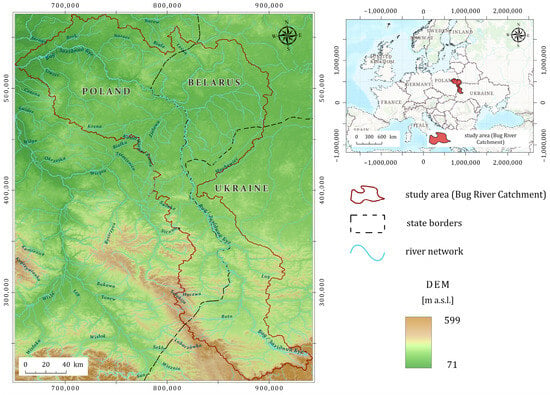
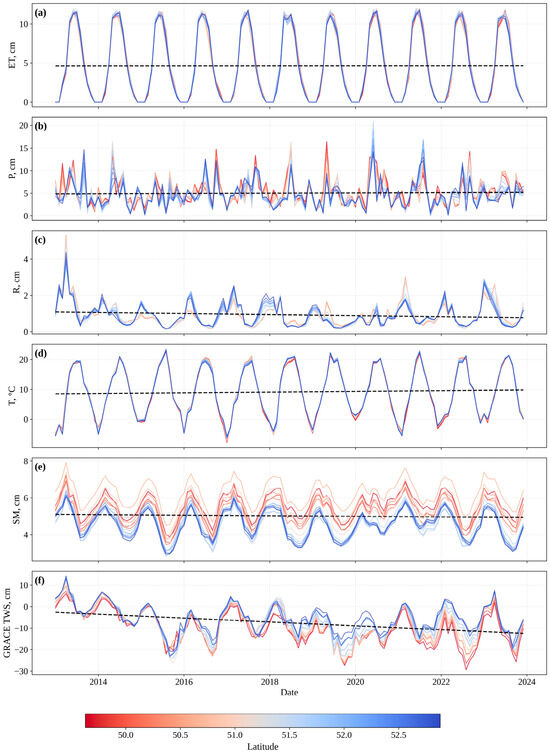
Bias-Aware Machine Learning Spatial Downscaling of GRACE Signals: Application to the Bug River Basin
Remote Sens. 2026, 18(17), 2909; https://doi.org/10.3390/rs18172909 (registering DOI) - 30 Aug 2026
Abstract
GRACE and GRACE-FO satellite gravimetry provide unique observations of terrestrial water storage (TWS), but their coarse effective resolution and intermittent temporal gaps limit water-resource applications at subregional and basin scales. This study presents a framework to temporally reconstruct and spatially downscale GRACE TWS
[...] Read more.
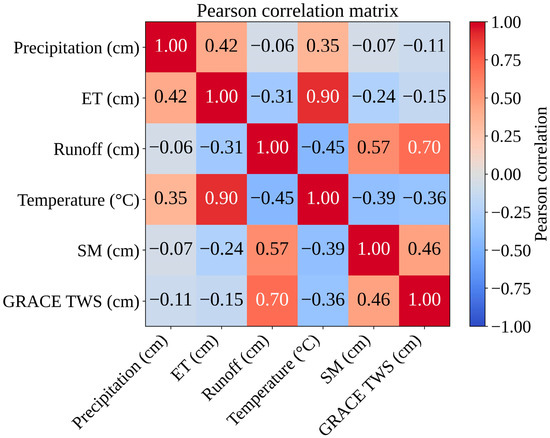
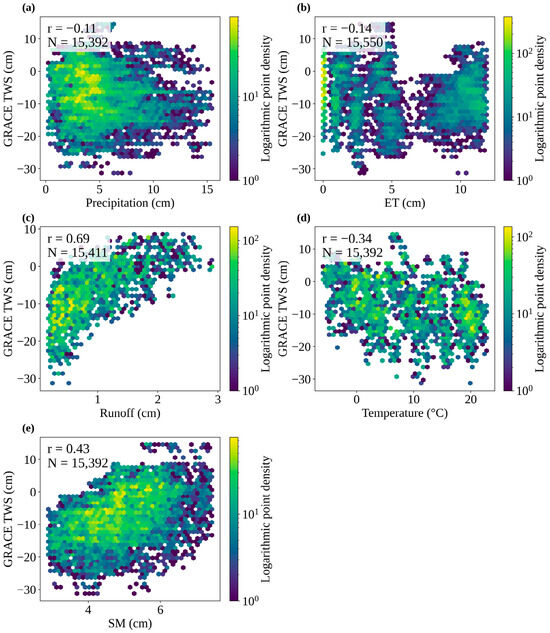
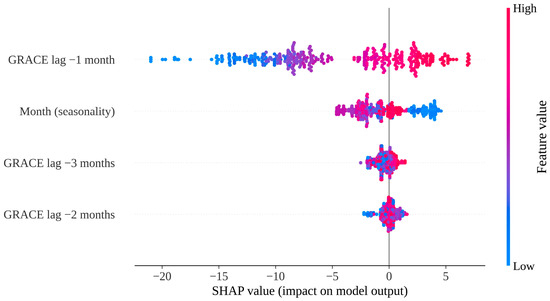
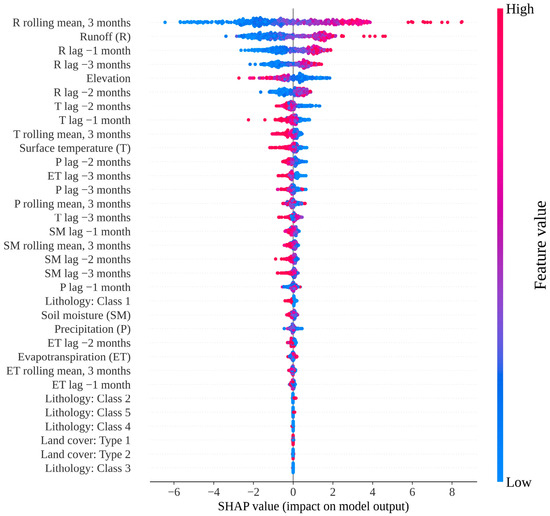
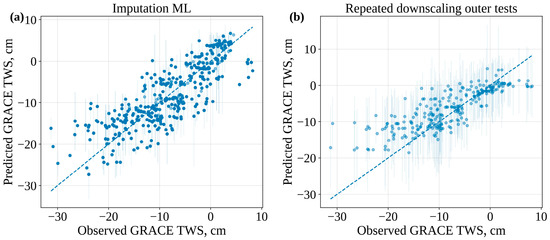
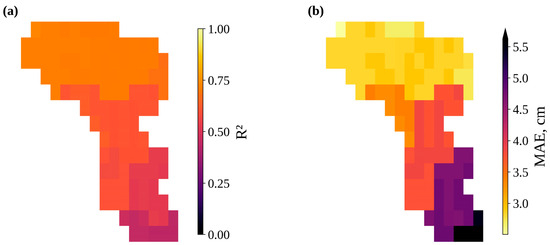
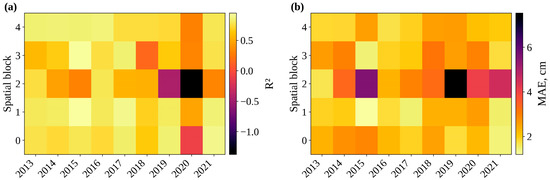
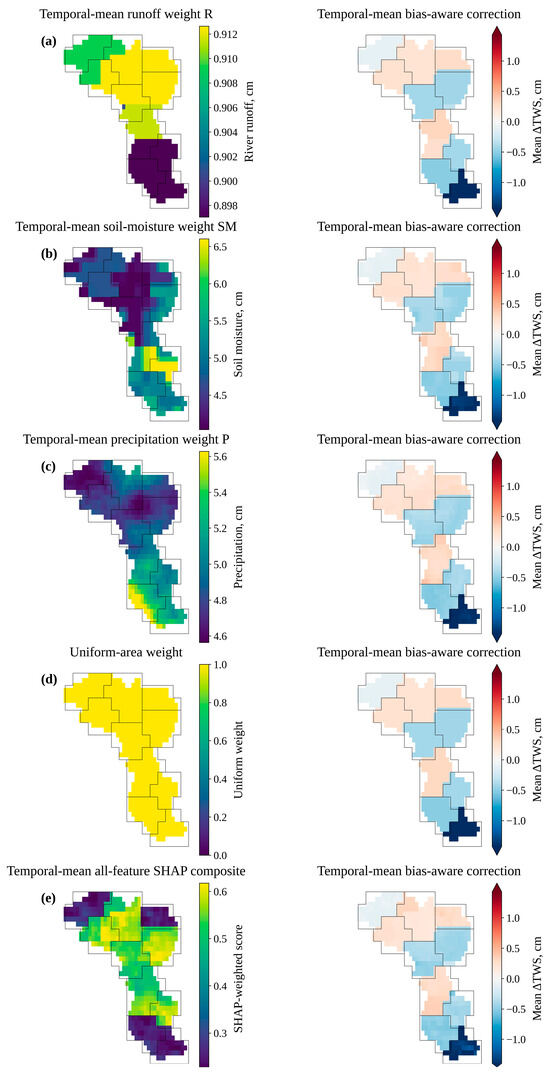
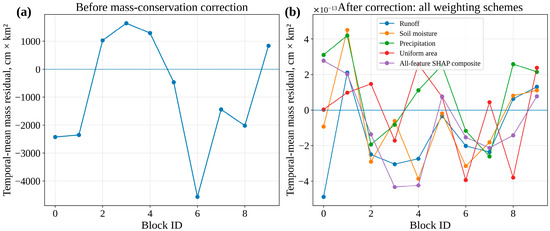
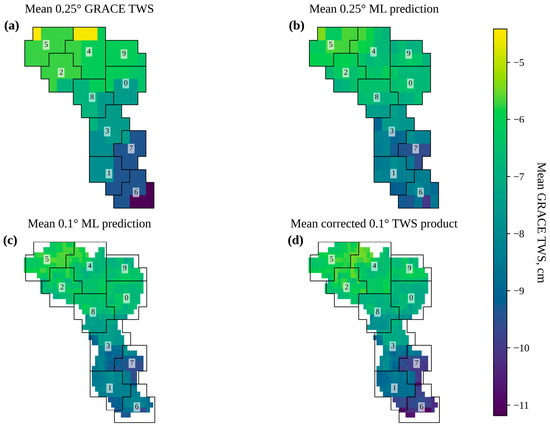
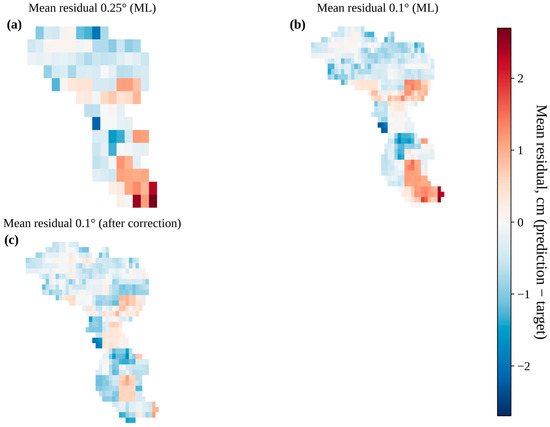
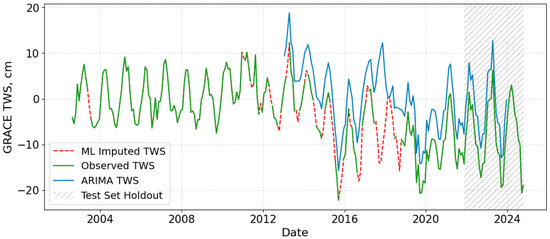
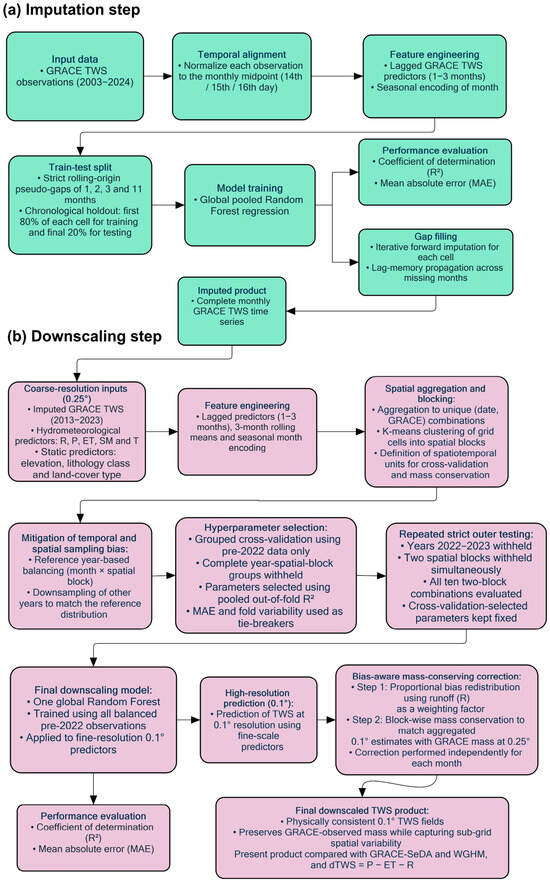
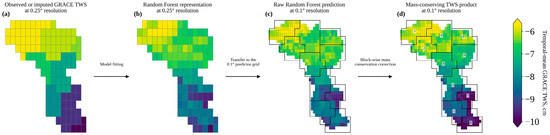
GRACE and GRACE-FO satellite gravimetry provide unique observations of terrestrial water storage (TWS), but their coarse effective resolution and intermittent temporal gaps limit water-resource applications at subregional and basin scales. This study presents a framework to temporally reconstruct and spatially downscale GRACE TWS anomalies for the transboundary Bug River Basin (Poland–Ukraine–Belarus), a region where in situ monitoring is limited and further disrupted by the 2022 war in Ukraine. First, missing monthly GRACE TWS anomalies (2002–2024) are imputed using a Random Forest model driven only by lagged GRACE values (1–3 months) and seasonal timing, thereby avoiding potential information leakage. Second, the continuous GRACE signal is downscaled to 0.1° using an independent set of hydroclimatic predictors with lagged and rolling features, together with elevation, land type and lithology. Model performance is evaluated under strict spatiotemporal holdouts and cross-validation. The key methodological advance is a bias-aware, block-wise mass-conserving correction that reconciles downscaled fields with the original GRACE water mass at coarse resolution. After downscaling to 0.1°, systematic residual biases between aggregated high-resolution estimates and GRACE observations are quantified monthly and redistributed within spatial blocks using river-runoff-based weights. This procedure enforces exact mass closure while preserving physically meaningful sub-grid variability.
Full article
(This article belongs to the Special Issue Spatiotemporal Variability in Hydrologic Systems from GRACE, Remote Sensing, and Climate Data)
►
Show Figures
Open AccessArticle
Terrain Effects on Time-Frequency Characteristics of Negative Return Stroke Electric Fields: A Path-Incremental Method
by
Yiting Chen, Shanqiang Gu, Wenchao Fan, Yingpu Xie, Jinxin Cao, Chun Zhao, Tao Li and Li Cai
Remote Sens. 2026, 18(17), 2908; https://doi.org/10.3390/rs18172908 (registering DOI) - 30 Aug 2026
Abstract
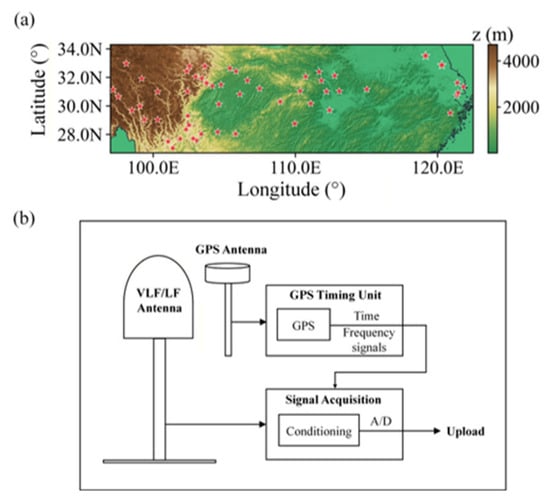
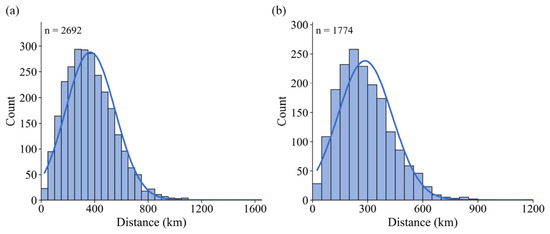
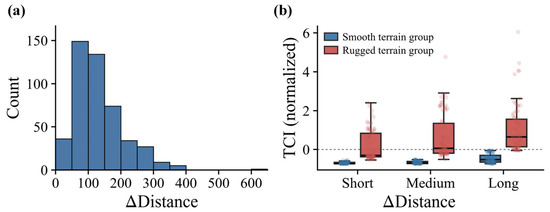
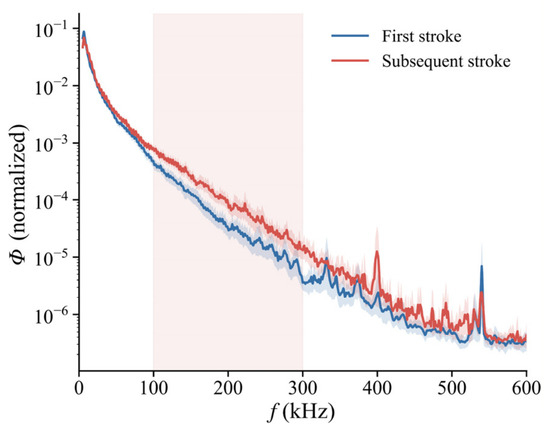
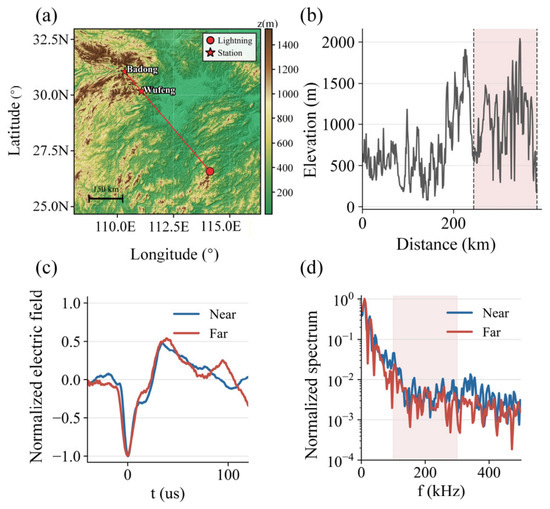
Waveforms recorded by lightning location networks mix source variability with propagation effects, making terrain-associated distortion difficult to isolate. We developed a path-incremental method in which the additional segment between two stations observing the same stroke carries the propagation signal. From 4466 records of
[...] Read more.
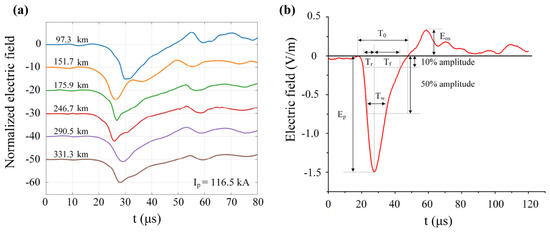
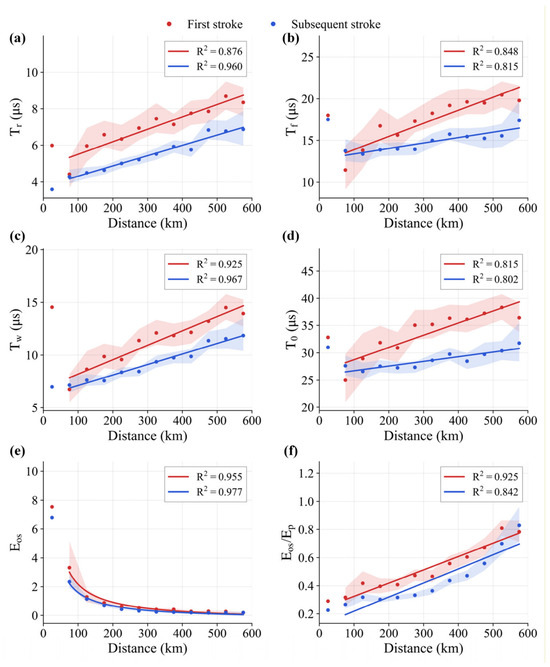
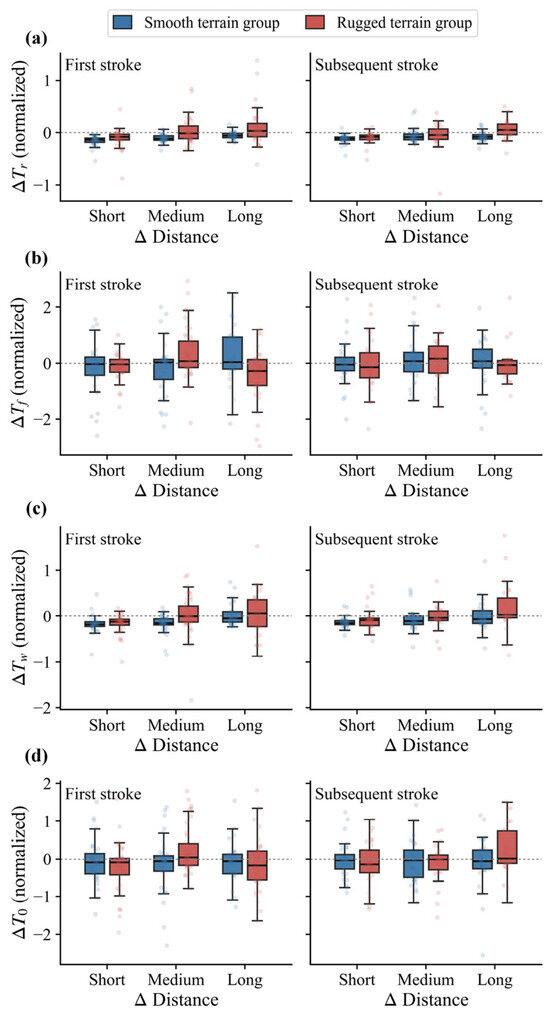
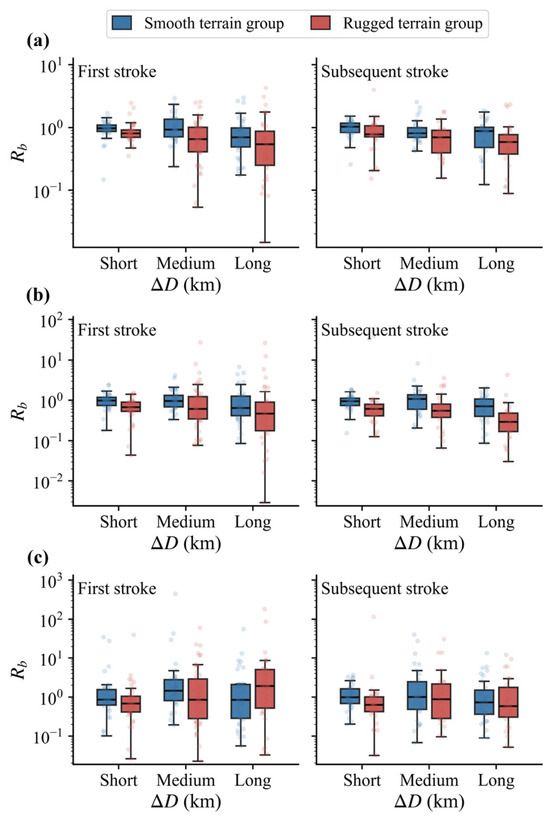
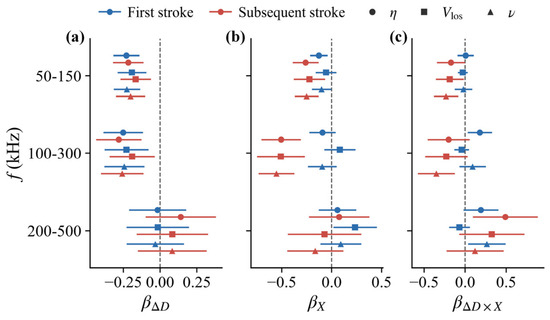
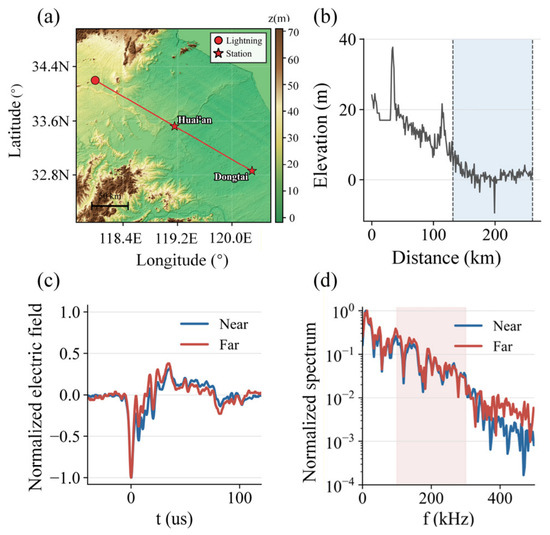
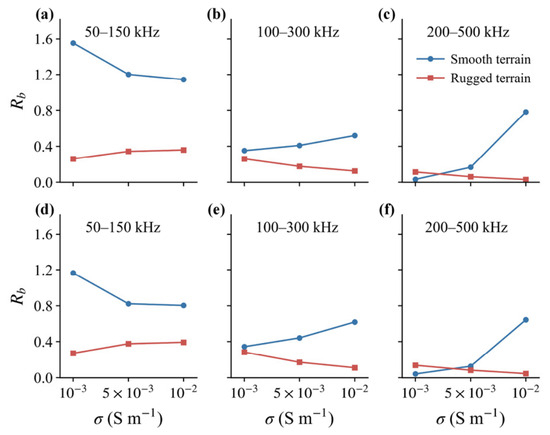
Waveforms recorded by lightning location networks mix source variability with propagation effects, making terrain-associated distortion difficult to isolate. We developed a path-incremental method in which the additional segment between two stations observing the same stroke carries the propagation signal. From 4466 records of 554 negative cloud-to-ground return strokes, 469 near-collinear pairs were stratified by additional path length and split at the within-stratum median of a digital-elevation-model terrain complexity index. Higher-complexity (rugged) paths showed the clearest near–far increases in rise time and half-peak width, whereas fall time and zero-crossing time showed no stable ordering, indicating that terrain acts mainly on the pulse front and main peak. In the frequency domain, these paths retained lower normalized band-energy fractions at 50–150 and 100–300 kHz, most systematically at 100–300 kHz for subsequent strokes, whereas the 200–500 kHz response was unstable. Separate mixed-effects models linked path elongation, occlusion, and diffraction geometry individually to a 39.7–42.5% lower 100–300 kHz ratio for subsequent strokes. Twelve representative-path axisymmetric finite-difference time-domain simulations under matched source currents reproduced the same ordering in these two bands across three ground conductivities. Rise time, half-peak width, and the normalized 100–300 kHz ratio are the most consistent terrain-associated indicators, supporting terrain-aware waveform interpretation.
Full article
(This article belongs to the Section Atmospheric Remote Sensing)
►▼
Show Figures

Figure 1
Open AccessArticle
Physics-Informed Residual Learning for Vertical Profile Reconstruction of Atmospheric Optical Turbulence from Tethered UAV Observations over the Ngari Plateau
by
Xiaoyu Hu, Yilun Cheng, Fengfu Tan, Wenlu Guan, Zhigang Huang, Gangyu Wang and Zaihong Hou
Remote Sens. 2026, 18(17), 2907; https://doi.org/10.3390/rs18172907 (registering DOI) - 29 Aug 2026
Abstract
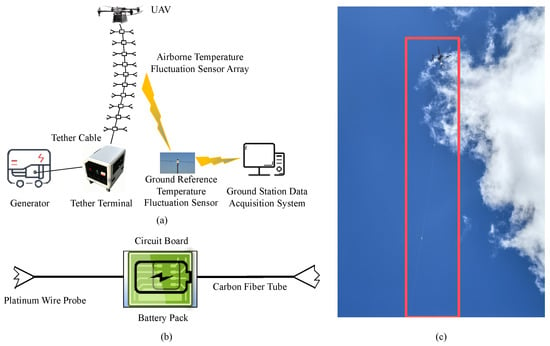
High-resolution measurements of near-surface optical turbulence over the Tibetan Plateau are essential for optical propagation studies, astronomical site characterization, and adaptive optics applications. In this study, a multi-level tethered UAV system was deployed in Ngari Prefecture, China, to obtain synchronous in situ observations
[...] Read more.
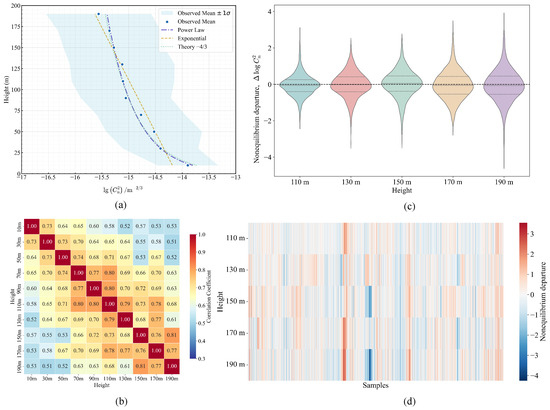
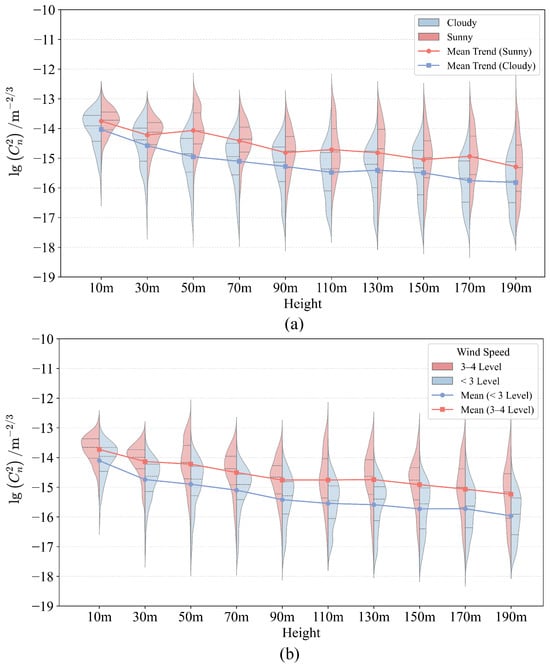
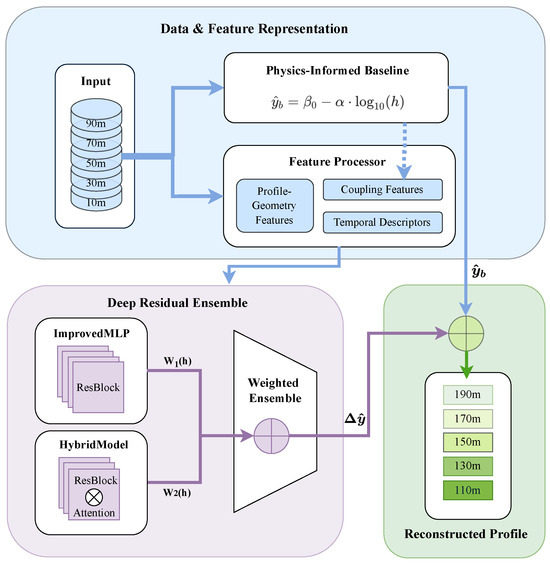
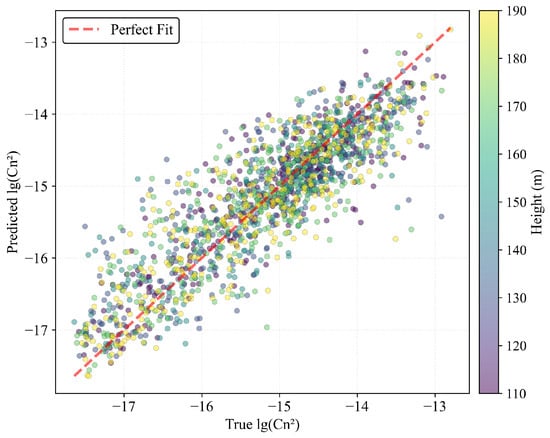
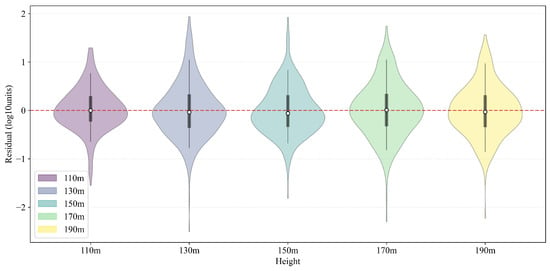
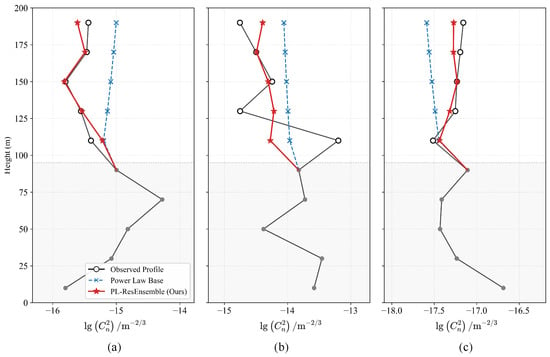
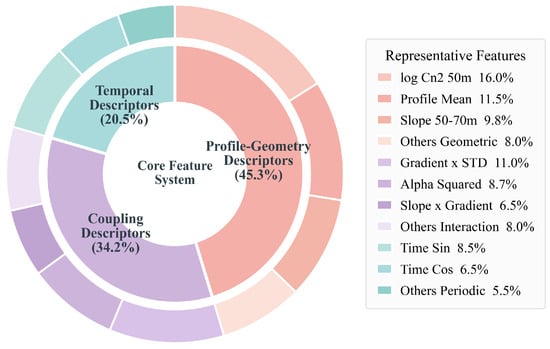
High-resolution measurements of near-surface optical turbulence over the Tibetan Plateau are essential for optical propagation studies, astronomical site characterization, and adaptive optics applications. In this study, a multi-level tethered UAV system was deployed in Ngari Prefecture, China, to obtain synchronous in situ observations of atmospheric optical turbulence from 10 to 190 m above ground. Using measurements at 10–90 m as inputs, we developed a physics-informed reconstruction framework to estimate profiles at 110–190 m, thereby approximately doubling the vertical range covered relative to the directly used observations. The framework decomposes the turbulence structure into an equilibrium component describing the large-scale vertical profile and a residual component representing departures from equilibrium. The equilibrium structure is modeled using a dynamically fitted power-law relationship, while a residual-learning module captures short-term variability associated with evolving thermal and dynamical processes. On the independent test period from the same field campaign, the reconstructed profiles achieve an average RMSE below 0.6 in and an average above 0.75, outperforming empirical extrapolation and representative data-driven baselines. The proposed framework provides reliable estimates of upper-layer optical turbulence under daytime and transition-period conditions over the Ngari Plateau.
Full article
(This article belongs to the Special Issue Multi-Source Remote Sensing for Environmental Component Monitoring and Target Detection)
►▼
Show Figures

Figure 1
Open AccessArticle
Long-Term Dynamics of Land Degradation Risk in Arid Northwest China Revealed by an Integrated Risk Index
by
Fan Cui, Jianli Ding, Jinjie Wang, Zipeng Zhang, Yue Liu, Chuan Cui and Huijuan Fang
Remote Sens. 2026, 18(17), 2906; https://doi.org/10.3390/rs18172906 (registering DOI) - 29 Aug 2026
Abstract
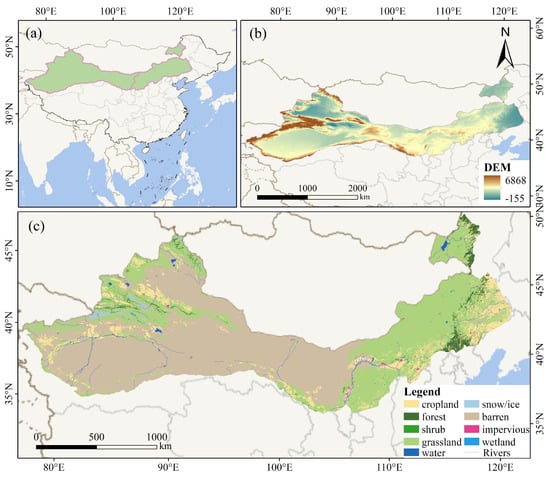
Dryland degradation increasingly compromises ecosystem stability, food production, and regional development. Clarifying its long-term evolutionary patterns and regional variations is therefore essential for formulating targeted management strategies. Leveraging GEE, we assembled multiple remote-sensing products together with land-cover information to establish a 1-km-resolution assessment
[...] Read more.
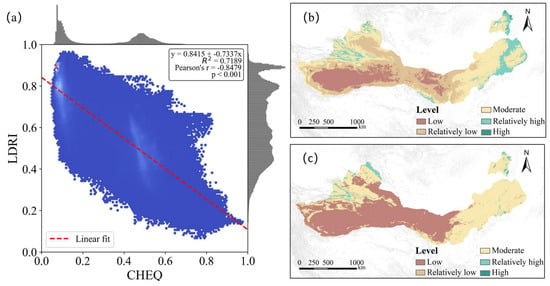
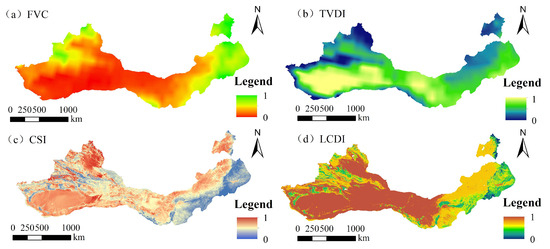
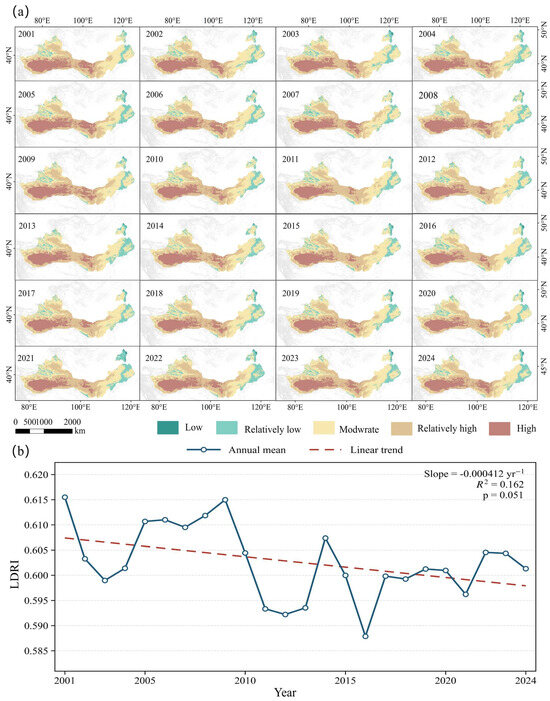
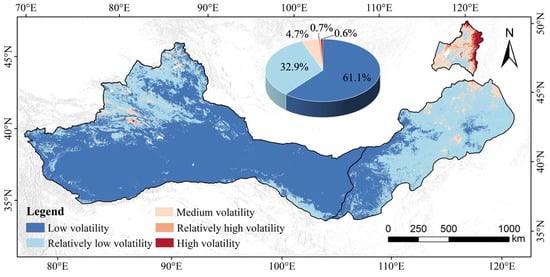
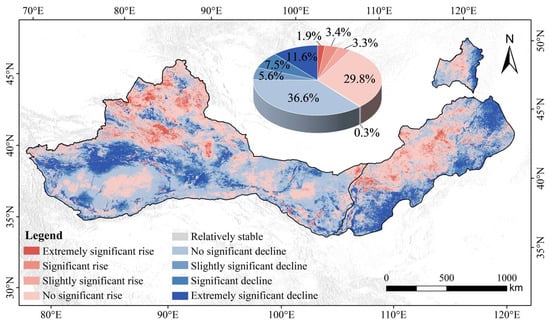
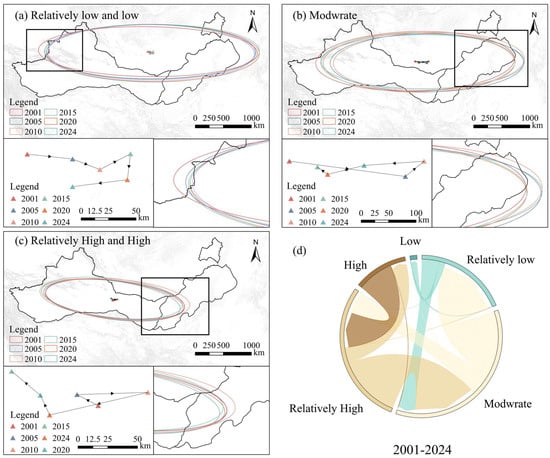
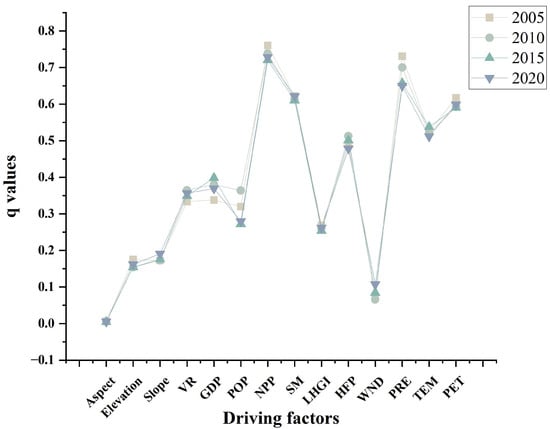
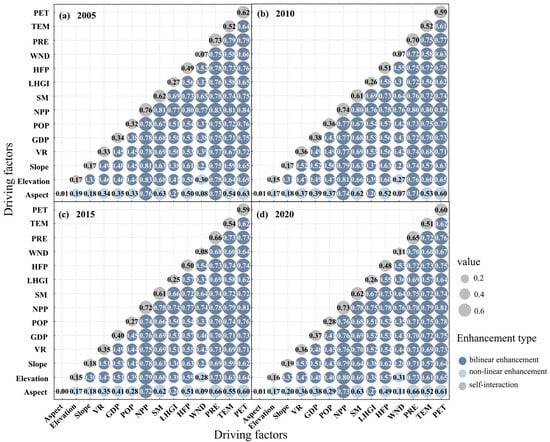
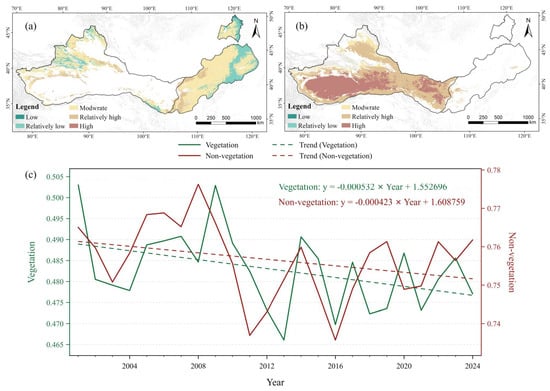
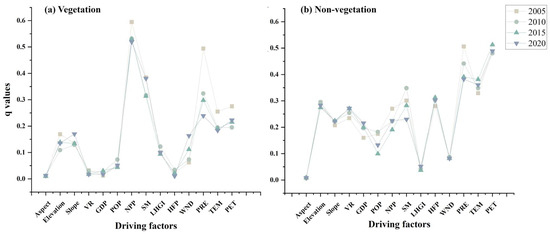
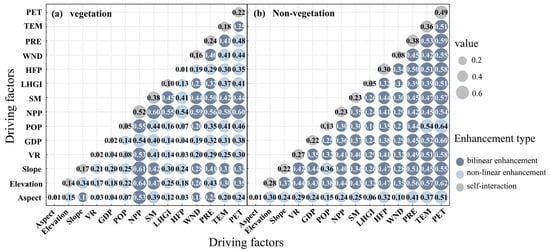
Dryland degradation increasingly compromises ecosystem stability, food production, and regional development. Clarifying its long-term evolutionary patterns and regional variations is therefore essential for formulating targeted management strategies. Leveraging GEE, we assembled multiple remote-sensing products together with land-cover information to establish a 1-km-resolution assessment framework describing vegetation conditions, drought pressure, potential soil salinity, and the ecological status associated with different land-cover types. An entropy-based weighting scheme was subsequently employed to derive the land degradation risk index (LDRI). This index enabled an assessment of changes in land degradation risk across arid Northwest China over the period 2001–2024, while also allowing the relative contributions of the principal driving factors to be evaluated. The analysis indicated that degradation risk generally weakened throughout the region, and shifts among risk categories occurred predominantly through stepwise movement between neighboring levels. Areas shifting toward lower-risk classes accounted for 75.36% of the total area experiencing risk-class changes. Nevertheless, High risk areas continued to be concentrated in the central-western desert belt, while the overall spatial pattern showed limited variation. Driver analysis indicated that vegetation productivity and hydrothermal conditions had relatively high explanatory power, while interactions among factors generally exhibited enhanced effects. Further stratified analysis showed that land degradation risk in vegetation zoning was mainly controlled by moisture conditions and vegetation productivity, whereas hydrothermal conditions exerted a stronger influence in non-vegetation zoning. The proposed LDRI provides a distinct analytical framework for the long-term monitoring and spatially differentiated management of land degradation risk across arid Northwest China, with broader implications for the scientific assessment and management of dryland degradation.
Full article
(This article belongs to the Topic Advances in Multi-Scale Geographic Environmental Monitoring: Ecosystem Differences and Multi-Scale Comparisons)
►▼
Show Figures

Figure 1

Open AccessArticle
Preprocessing Mismatch and Input Normalisation in Transferring a Multispectral Foundation Model to Marine Surface Segmentation
by
Christos G. E. Anagnostopoulos, Konstantinos Vlachos, Anastasia Moumtzidou, Ilias Gialampoukidis, Stefanos Vrochidis, Ariane Müting, Ana Sofia Oliveira, Dimitris Bliziotis and Katerina Kikaki
Remote Sens. 2026, 18(17), 2905; https://doi.org/10.3390/rs18172905 (registering DOI) - 29 Aug 2026
Abstract
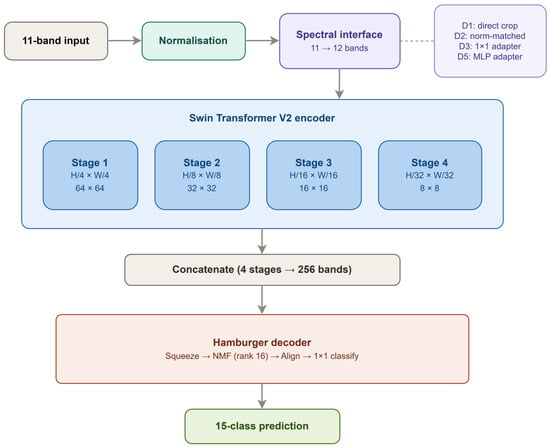
Foundation models for Earth observation are commonly transferred to downstream tasks without explicit attention to the preprocessing mismatch between pretraining and target distributions. This study isolates preprocessing mismatch as a controlled experimental factor in transferring the Hydro multispectral foundation model, a Swin Transformer
[...] Read more.
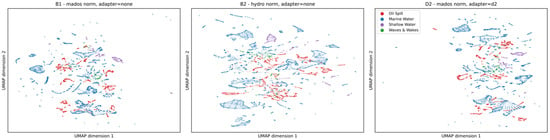
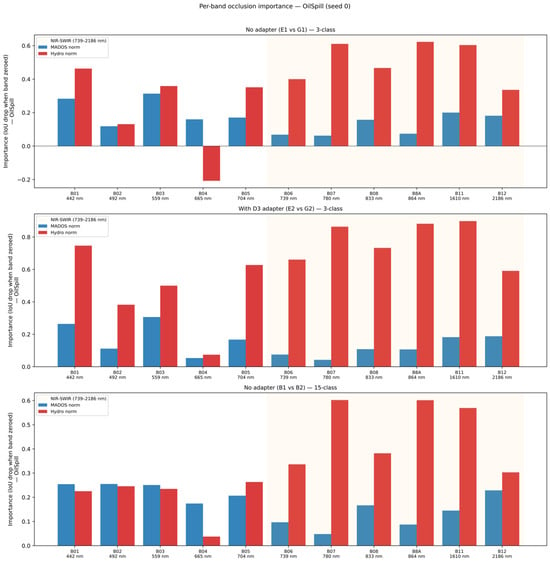
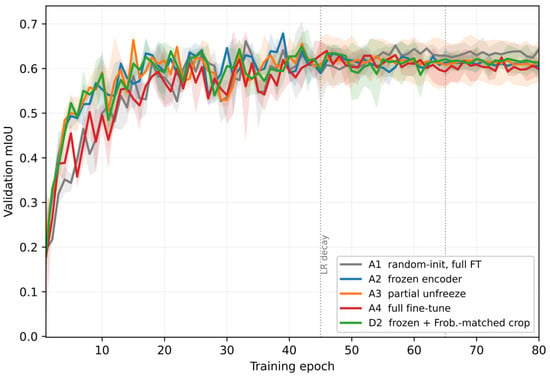
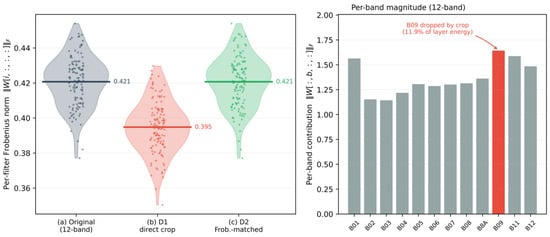
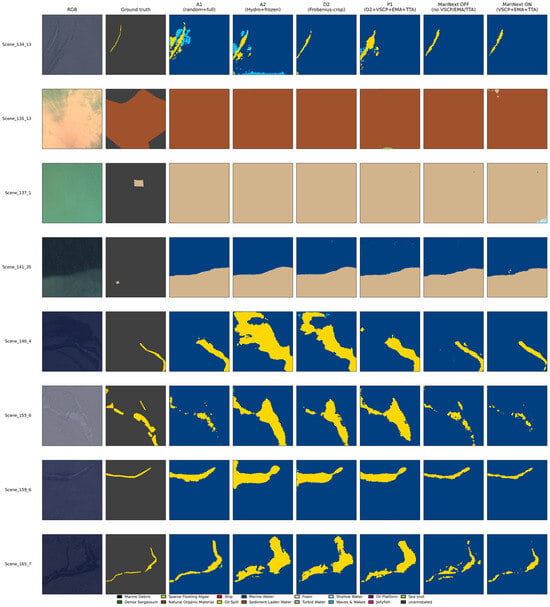
Foundation models for Earth observation are commonly transferred to downstream tasks without explicit attention to the preprocessing mismatch between pretraining and target distributions. This study isolates preprocessing mismatch as a controlled experimental factor in transferring the Hydro multispectral foundation model, a Swin Transformer V2 Base encoder pretrained with SimMIM on Sentinel-2 Level-2A water-body imagery, to the Marine Debris and Oil Spill (MADOS) marine pollution benchmark dataset, processed through ACOLITE Rayleigh reflectance and providing 11 of the 12 spectral bands used during pretraining. The two datasets are therefore produced by different atmospheric correction algorithms under different reflectance conventions, and the resulting per-band statistical discrepancy is quantified as the starting point of the analysis. Three preprocessing dimensions are then systematically varied while all other settings are held constant: input normalisation, spectral band adaptation for the missing B09, and encoder transfer mode. From this, four findings emerge. Normalisation mismatch between training and inference is the single largest source of performance degradation, reducing the mean Intersection over Union (mIoU) by 0.458, more than seven times the largest radiometric perturbation tested. A zero-parameter Frobenius-matched column crop of the patch embedding adapts the 12-band pretrained encoder to the 11-band target, at least as effectively as any learnt linear or nonlinear adapter, at a lower cross-seed variance. Under limited target supervision (1433 training patches against an 87.9 million-parameter encoder), freezing the encoder outperforms both fine-tuning in full and random initialisation training from scratch. The gains of partial unfreezing are attributable to augmented training (very simple copy–paste (VSCP) augmentation, exponential moving average (EMA), and test-time augmentation (TTA)) rather than to encoder adaptation. With matched preprocessing, the frozen encoder reaches 0.600 mIoU and matches the published MariNeXt baseline within seed variability. Mechanistic analysis via band-occlusion attribution and feature-space separability shows that input normalisation determines which spectral bands the encoder relies upon, with the magnitude of the shift correlated to the per-band gap between the source and target distributions. Operationally, preprocessing alignment, rather than architectural modification, carries most of the practical effort in transferring a multispectral foundation model to marine surface segmentation. These results are established for a single encoder–benchmark pair under limited target supervision. The mechanism they identify is more portable than the magnitude reported. A frozen encoder’s representations remain bound to the normalisation statistics of its pretraining dataset, so any transfer that departs from these statistics at inference is predicted to degrade sharply in proportion to the per-band distance between the two distributions.
Full article
(This article belongs to the Section Environmental Remote Sensing)
►▼
Show Figures

Figure 1
Open AccessArticle
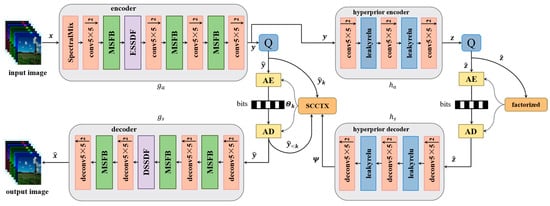
A Spectral–Spatial Decoupling and Fusion Network with Multi-Scale Perception for Multispectral Image Compression
by
Beibei Song, Yuyang Du and Wenfang Sun
Remote Sens. 2026, 18(17), 2904; https://doi.org/10.3390/rs18172904 (registering DOI) - 29 Aug 2026
Abstract
Multispectral images contain rich spatial details and spectral information, but their large data volume places heavy demands on transmission bandwidth and storage resources. Existing multispectral image compression methods still face challenges in jointly modeling spatial and inter-spectral redundancies. In particular, similar feature-processing strategies
[...] Read more.
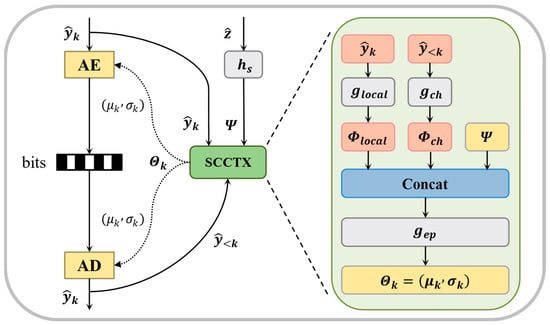
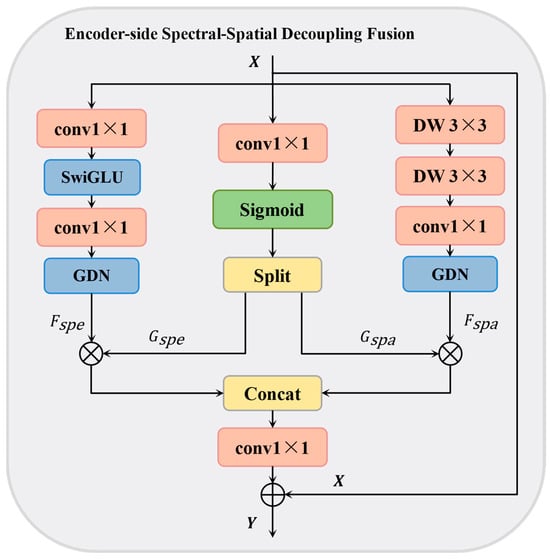
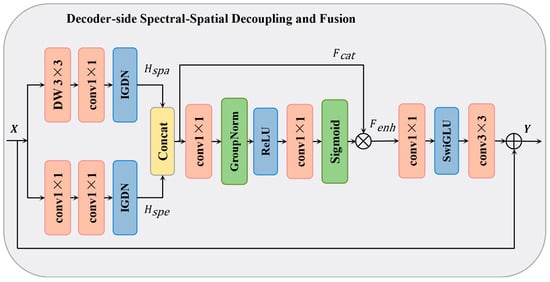
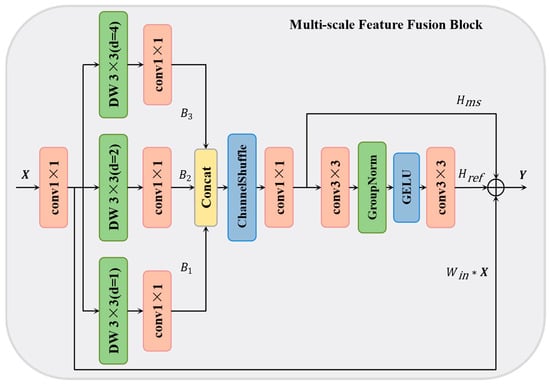
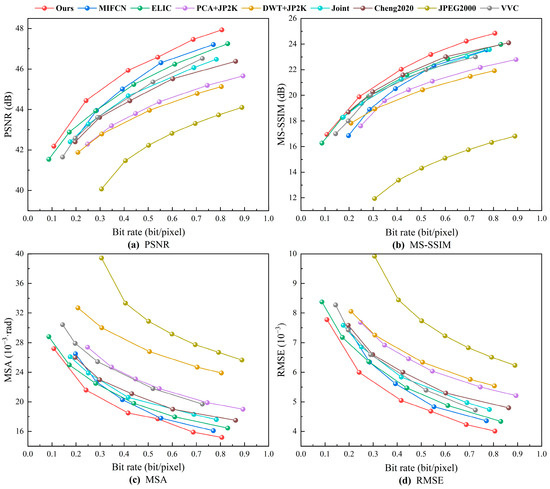
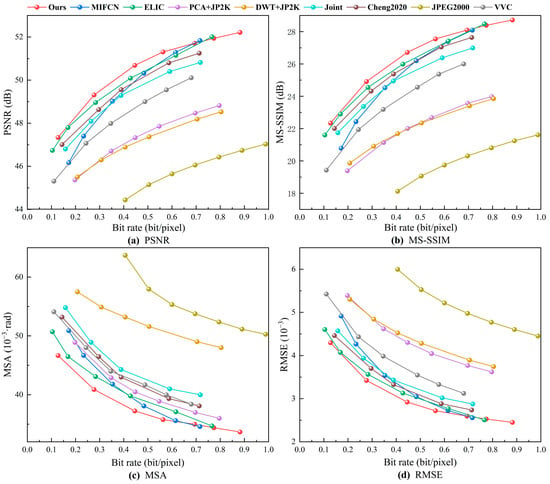
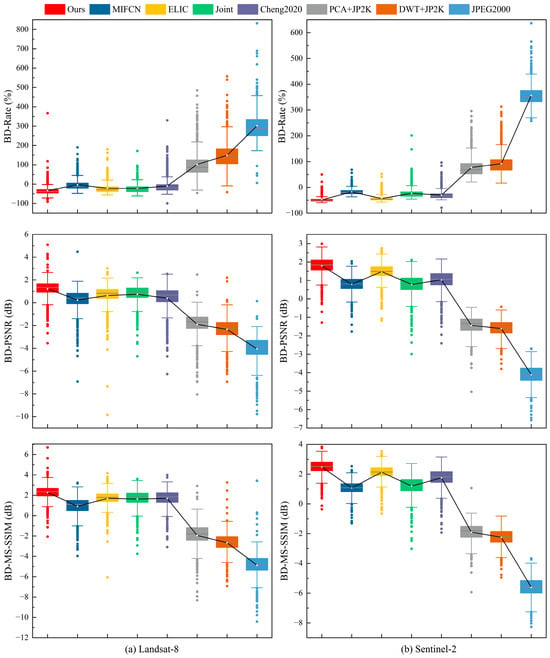
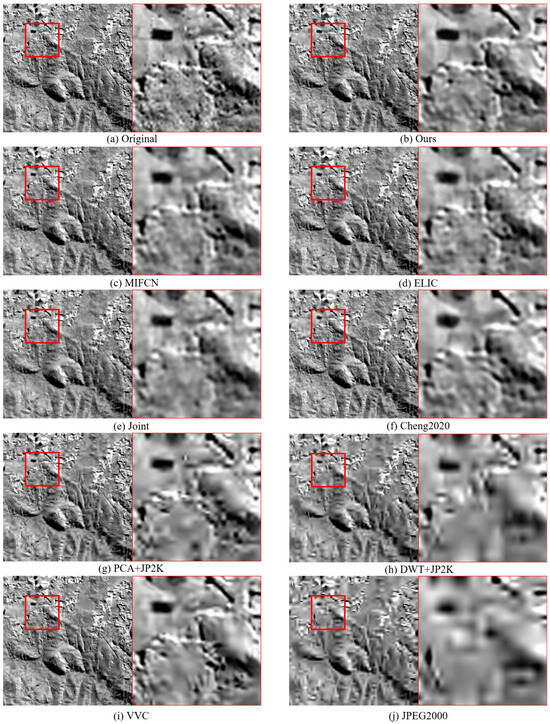
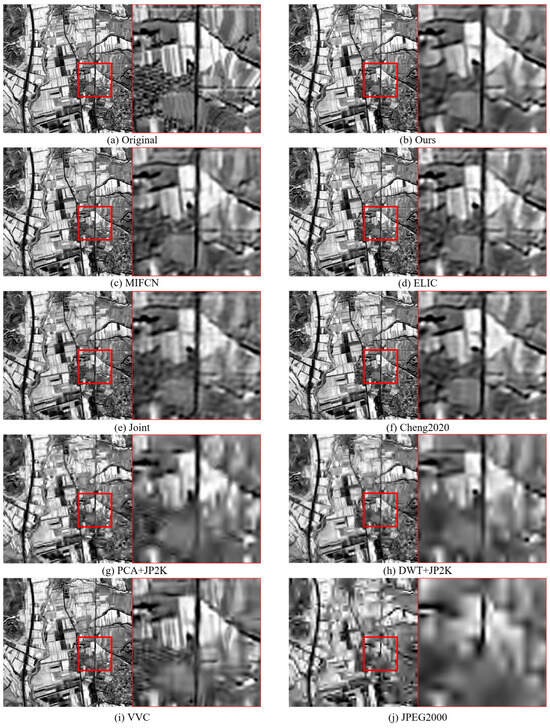
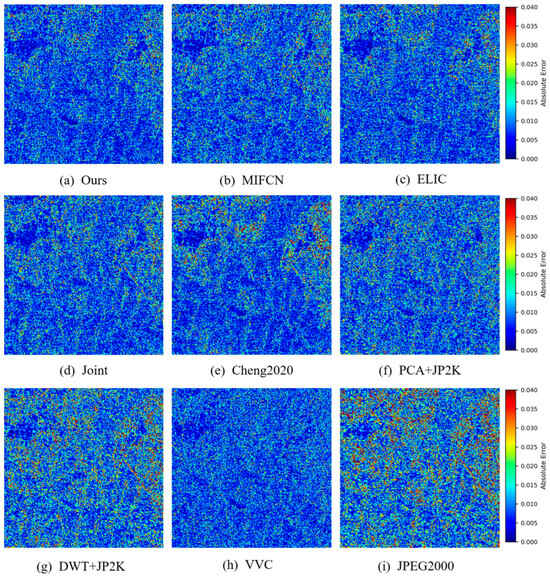
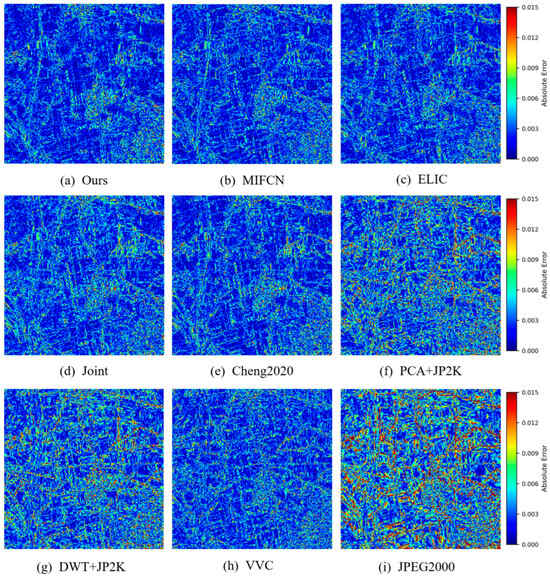
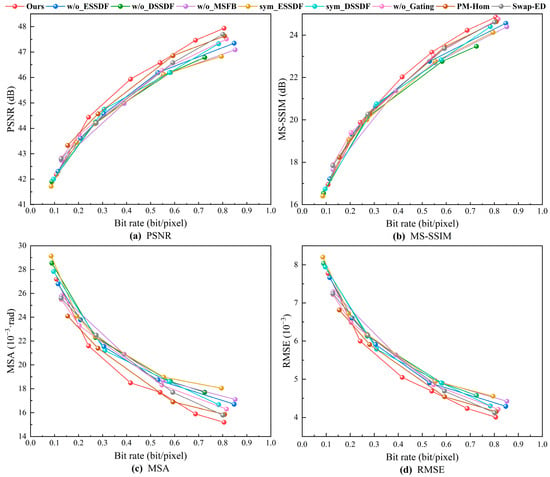
Multispectral images contain rich spatial details and spectral information, but their large data volume places heavy demands on transmission bandwidth and storage resources. Existing multispectral image compression methods still face challenges in jointly modeling spatial and inter-spectral redundancies. In particular, similar feature-processing strategies adopted in some encoder–decoder designs, limited spectral–spatial interaction, and inadequate multi-scale modeling limit further improvements in compression efficiency. To address these issues, this paper proposes a spectral–spatial decoupling and fusion network with multi-scale perception (SSDFN) for multispectral image compression. SSDFN is built on an end-to-end learned compression framework and introduces differentiated spectral- and spatial-oriented processing pathways with tailored fusion mechanisms for the encoder and decoder. The encoder focuses on redundancy suppression and compact latent representation learning, whereas the decoder emphasizes feature interaction, information compensation, and high-fidelity reconstruction. In addition, a Multi-Scale Feature Fusion Block is developed to model complex spatial structures in multispectral remote sensing scenes. Hyperprior and context entropy models are further incorporated to improve entropy estimation. Experiments on the Landsat-8 and Sentinel-2 datasets show that SSDFN achieves competitive rate–distortion performance and provides consistent improvements in spatial reconstruction quality, perceptual quality, and spectral fidelity.
Full article
(This article belongs to the Section Remote Sensing Image Processing)
►▼
Show Figures

Figure 1
Open AccessArticle
Comparing Modelled and Remotely Sensed Soil Moisture Products Using In Situ Observations in Liguria, Italy: Evaluation via SWI Filtering and Rescaling Techniques
by
Luca Repetto, Francesco Silvestro, Fabio Gardella, Giorgio Boni and Fabio Delogu
Remote Sens. 2026, 18(17), 2903; https://doi.org/10.3390/rs18172903 (registering DOI) - 28 Aug 2026
Abstract
Soil Moisture (SM) represents the temporary storage of water within the shallow layers of the Earth’s upper surface and plays a key role in a wide range of applications, including hydrological processes, numerical weather prediction models and landslide prediction. This study evaluates the
[...] Read more.
Soil Moisture (SM) represents the temporary storage of water within the shallow layers of the Earth’s upper surface and plays a key role in a wide range of applications, including hydrological processes, numerical weather prediction models and landslide prediction. This study evaluates the comparability of multiple satellite- and model-based SM products against in situ volumetric water content (VWC) measurements collected by a regional monitoring network in Liguria, Italy. The analyzed dataset comprises satellite-based products from the SMAP mission and the ASCAT sensors, as well as modelled Soil Moisture outputs from the HTESSEL land surface model and the Root Zone Soil Moisture (RZ SM) estimates from the continuous, distributed and physically based hydrological model Continuum. Aiming to reduce the systematic differences between the SM products and the ground network measurements, Soil Water Index (SWI) filtering and various rescaling techniques are applied and evaluated. Finally, the agreement between the rescaled SM products and the in situ measurements was assessed using standard performance scores aggregated into a single multi-objective function. Within the specific context of the study area, results suggest that rescaled model-based soil moisture products generally outperform satellite-derived surface soil moisture in reproducing in situ observations. Furthermore, among the tested rescaling techniques, Cumulative Distribution Function (CDF) matching and linear regression provide the best performance in mitigating systematic biases. Additionally, the optimization of the characteristic time length (τ) for satellite-derived SWI significantly enhances the agreement with in situ root-zone dynamics.
Full article
(This article belongs to the Special Issue Satellite Soil Moisture Estimation, Assessment, and Applications (Second Edition))
Open AccessArticle
Multiband Spectropolarimetric Signature Analysis for Material, Object, Land Cover Class, and Collection Geometry Separability
by
Sarah J. Becker, Heather S. Sussman, Johanna R. Arredondo, Jorge A. Ochoa Gonzalez, John S. Furey, Giulianna M. De La Torre, Kyle L. Klaus, Donald A. Davis and Hayden S. Hubert
Remote Sens. 2026, 18(17), 2902; https://doi.org/10.3390/rs18172902 (registering DOI) - 28 Aug 2026
Abstract
►▼
Show Figures
Polarimetric reflectance can be described using the Stokes parameters with S0 representing the total intensity of the light beam reflected from a material, S1 representing the intensity difference between the horizontally {0°, 180°} and vertically {90°, 270°} linearly polarized components, S
[...] Read more.
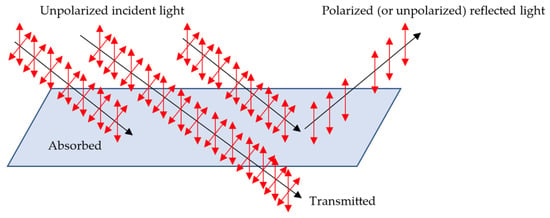
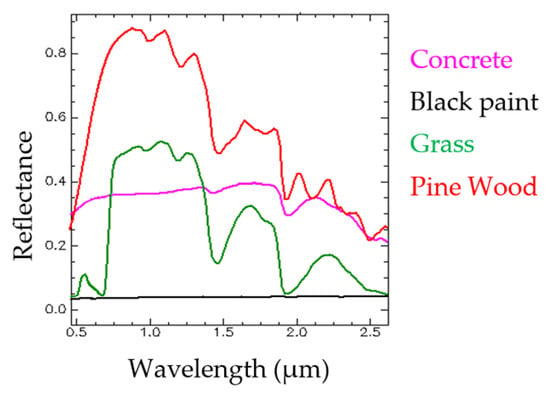
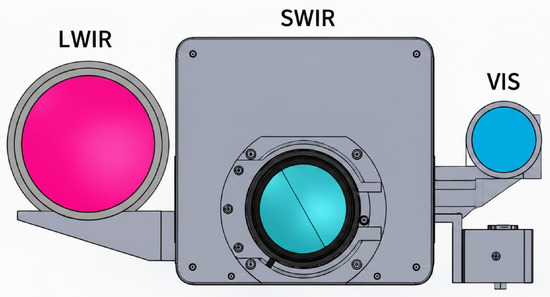
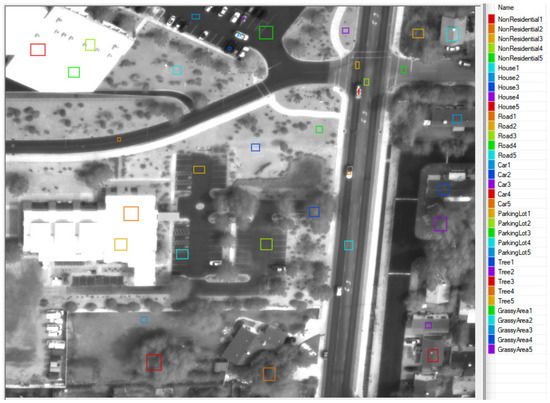
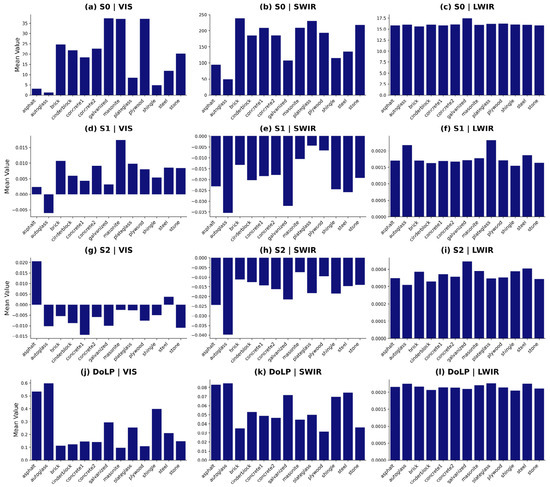
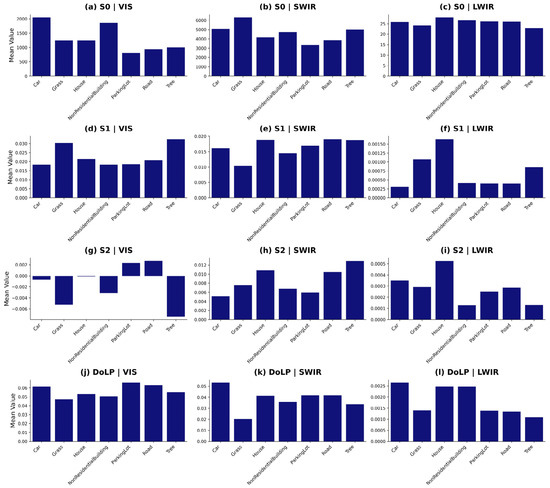
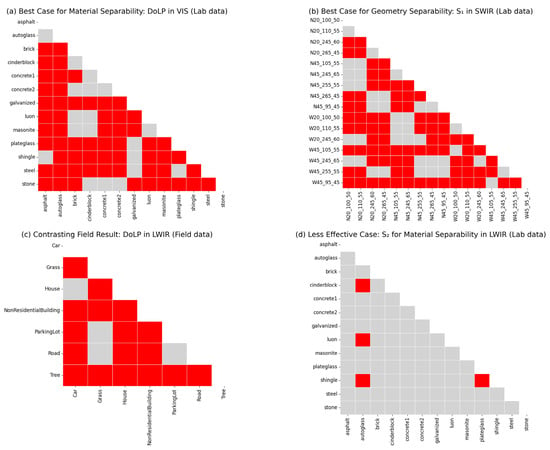
Polarimetric reflectance can be described using the Stokes parameters with S0 representing the total intensity of the light beam reflected from a material, S1 representing the intensity difference between the horizontally {0°, 180°} and vertically {90°, 270°} linearly polarized components, S2 representing the intensity difference between the +45° and −45° (or 135°) linearly polarized components, and the Degree of Linear Polarization (DoLP) representing the fraction of light that is linearly polarized. Spectral analyses often fail to distinguish between materials that may be spectrally similar, while polarimetric analyses may be able to enhance the distinction. Prior research has demonstrated the utility of polarization for target detection; however, existing studies rarely compare controlled laboratory polarimetric signatures directly with real-world aerial-field measurements. Furthermore, there is a gap in systematically evaluating how both material physical properties, such as metallic versus dielectric structures, and collection geometries affect polarimetric signatures across multiple wavebands. The objective of this research is to test an approach to measure material, object, and land cover separability in visible (VIS), shortwave infrared (SWIR), and longwave infrared (LWIR) polarimetric laboratory and aerial imagery through complementary laboratory and aerial-field experiments, which may aid in differentiating between spectrally similar man-made materials, objects, and land covers. In this study, sensors measure unpolarized and polarized reflectance responses from man-made materials, objects, and land covers in VIS, SWIR, and LWIR bands in laboratory and aerial field imagery at varying collection geometries. The relationship between laboratory samples and aerial-field-collected imagery of man-made materials, objects, and land covers for S0, S1, S2, and DoLP responses was explored. Results show statistically significant separability by material and collection geometry across Stokes parameters and wavelengths. Post hoc pairwise comparisons showed which materials, objects, and land covers were separable and which collection geometries were separable from each other; however, separability differed between the laboratory and field measurements. Ultimately, this research provides a foundational understanding that can assist with spectropolarimetric data collection planning by demonstrating that overall collection geometry is a critical factor for optimizing material, object, and land cover separability. Future work should focus on isolating the effects of individual collection geometry parameters, such as camera angle, flight direction, and time of day, to develop more targeted collection strategies.
Full article

Figure 1
Open AccessArticle
Continuous Satellite Monitoring of Reservoir Capacity Loss Using Deep Learning and Stochastic Mapping: The Poechos Reservoir and Regional Transferability in Northern Peru
by
Juan Carlos Breña Aliaga, Luc Bourrel, Joel Cruz Machacuay, Jorge Luis Breña Ore, Oscar Felipe, Pedro Rau and Waldo Lavado-Casimiro
Remote Sens. 2026, 18(17), 2901; https://doi.org/10.3390/rs18172901 (registering DOI) - 28 Aug 2026
Abstract
Sedimentation is eroding the water security of reservoirs in hydrologically active basins: the Poechos reservoir (Peru) has lost 62% of its original 887.7 hm3 capacity in 48 years, yet its Elevation–Area–Volume (EAV) curve is refreshed only by bathymetric surveys at decade-plus intervals,
[...] Read more.
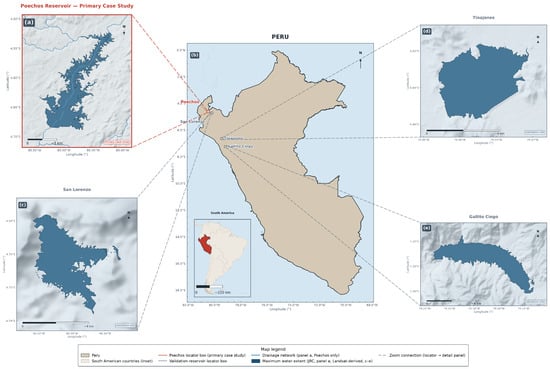
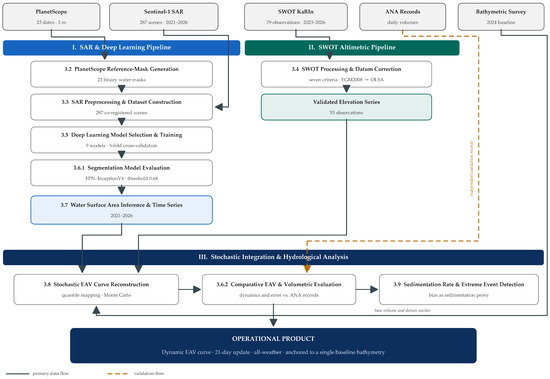
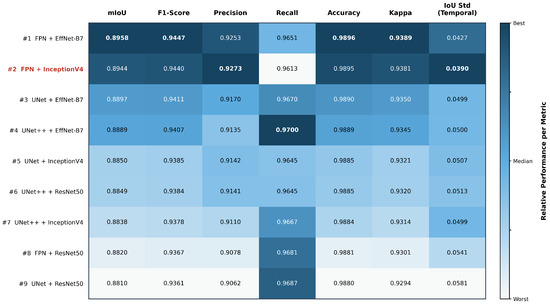
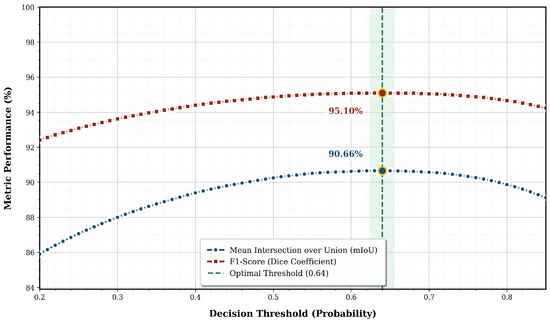
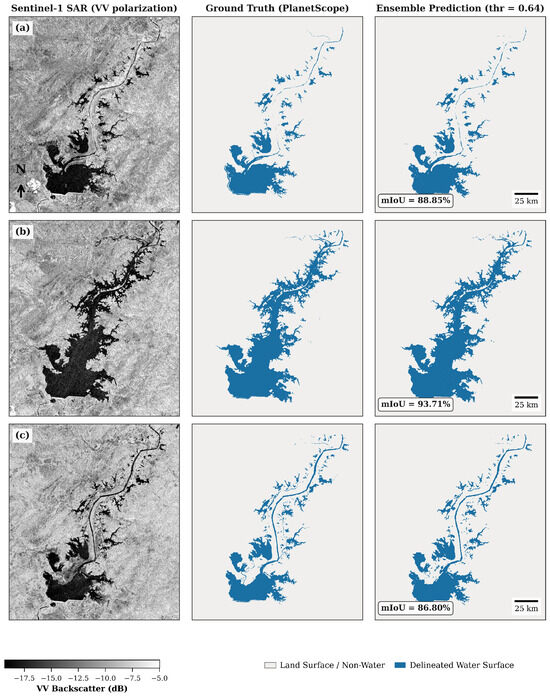
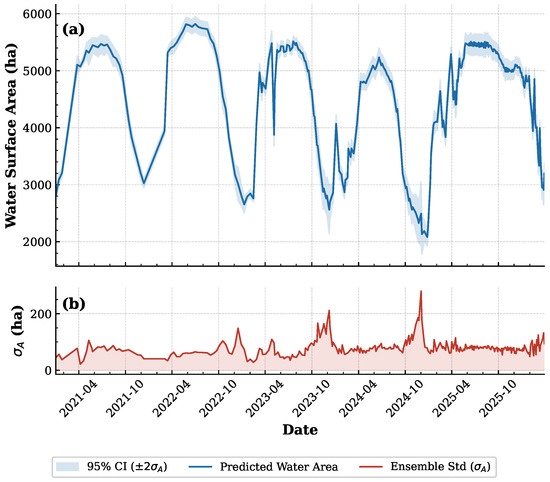
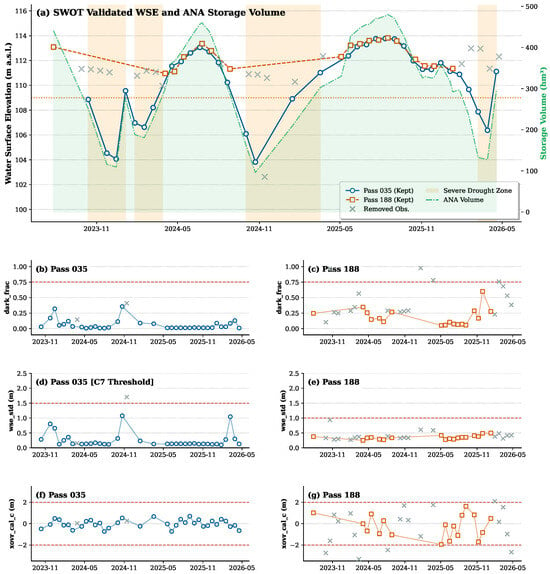
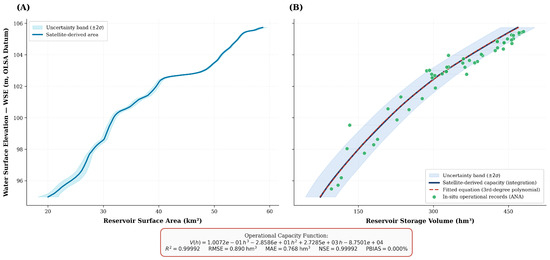
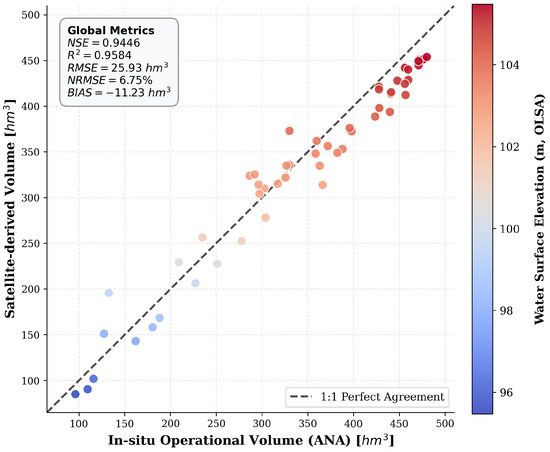
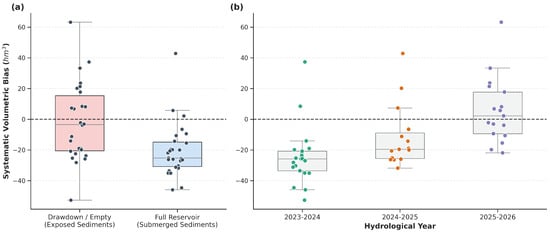
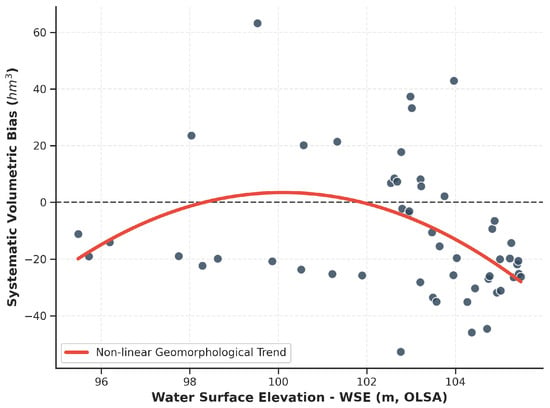
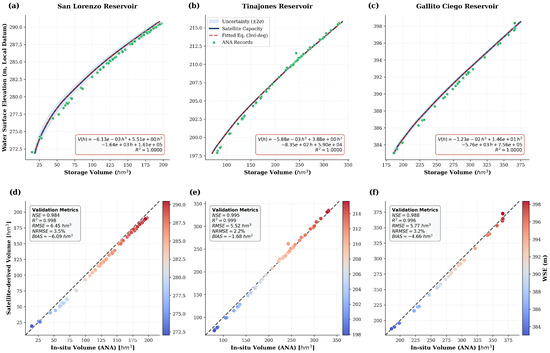
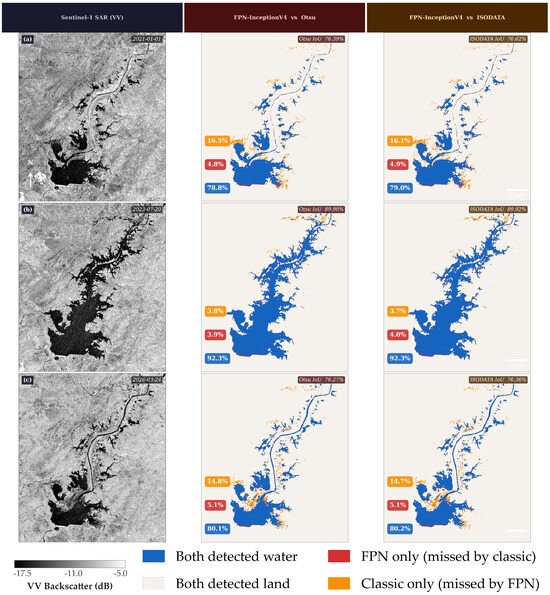
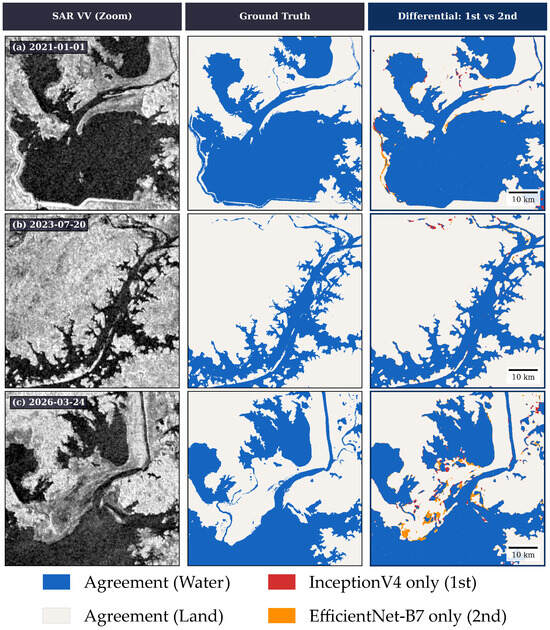
Sedimentation is eroding the water security of reservoirs in hydrologically active basins: the Poechos reservoir (Peru) has lost 62% of its original 887.7 hm3 capacity in 48 years, yet its Elevation–Area–Volume (EAV) curve is refreshed only by bathymetric surveys at decade-plus intervals, compromising flood regulation and the water supply for over 100,000 ha of farmland. To close this gap, we propose an integrated, low-cost, fully reproducible framework that reconstructs the EAV curve from freely available satellite data: Sentinel-1 SAR (287 acquisitions, 2021–2026), PlanetScope imagery as ground truth (23 dates), and Surface Water and Ocean Topography (SWOT) altimetry (53 validated passes, 2023–2026). Water surfaces were delineated with a deep learning segmentation model (Feature Pyramid Network with an InceptionV4 encoder), selected among nine architecture–encoder combinations and calibrated to a 0.64 decision threshold, achieving a 90.66% Intersection over Union (IoU) and a 95.10% F1 score; a stochastic quantile mapping algorithm then asynchronously coupled the area and elevation series. The resulting EAV curve matched daily operational records from Peru’s National Water Authority (ANA) with high precision (NSE = 0.94, R2 = 0.96, and RMSE = 25.93 hm3); the residual bias (BIAS = −11.23 hm3) reflects active sedimentation unaccounted for in the official curve. This bias peaked at an accumulated deficit of 24.5 hm3 during the 2023–2024 hydrological year (3.5 hm3/year), of which up to 19.6 hm3 is attributed to the 2023 Yaku cyclone as a phenomenologically scaled upper-bound estimate (9.8–19.6 hm3 across 40–80% attribution fractions), since SWOT was not yet operational during the event. Updating every 21 days under any weather and requiring no new field campaigns beyond the baseline bathymetric anchor, the trained ensemble was further transferred zero-shot to three additional reservoirs (San Lorenzo, Tinajones, and Gallito Ciego), demonstrating a scalable path from infrequent static assessments to near-continuous, dynamic monitoring of water storage.
Full article
(This article belongs to the Topic Dams, Levees, Hydraulic Structures, and Hydropower)
►▼
Show Figures

Figure 1
Open AccessArticle
FBR-DETR: An Efficient End-to-End Network for Real-Time Small-Object Detection in UAV Imagery
by
Shuai Liang, Ran Wang, Xiao Wang, Aixue Wang, Jialong Sun and Hui Liu
Remote Sens. 2026, 18(17), 2900; https://doi.org/10.3390/rs18172900 - 27 Aug 2026
Abstract
Identifying and localizing small objects in UAV imagery is a highly challenging task. Existing detection models are prone to missed detections, false detections, and inaccurate localization, while improvements in detection accuracy and real-time performance are often accompanied by an increase in the number
[...] Read more.
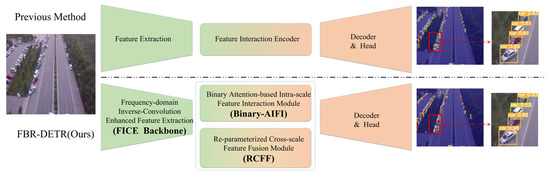
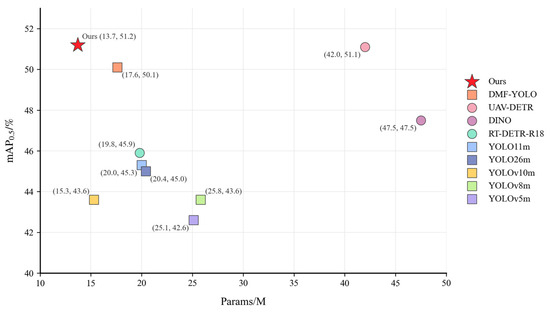
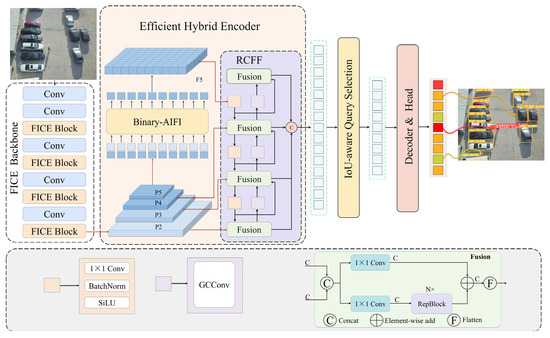
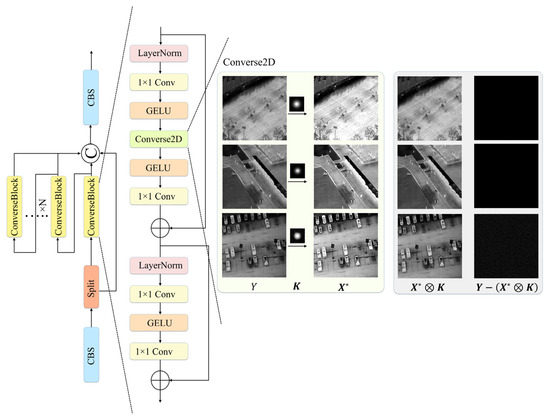
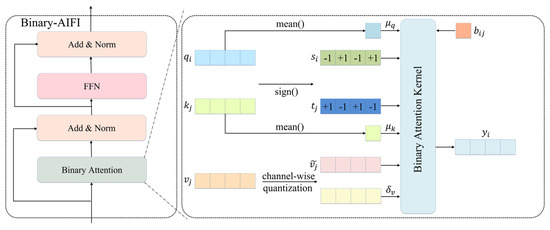
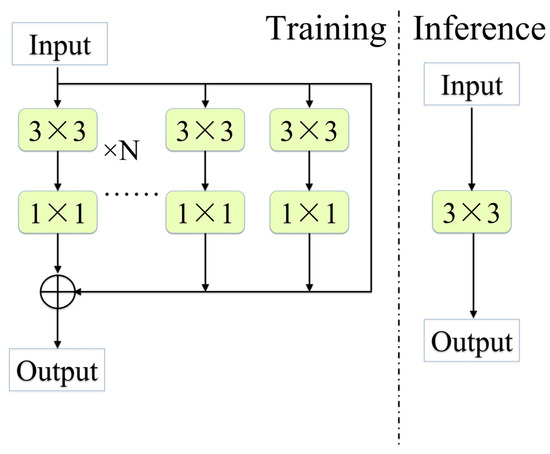
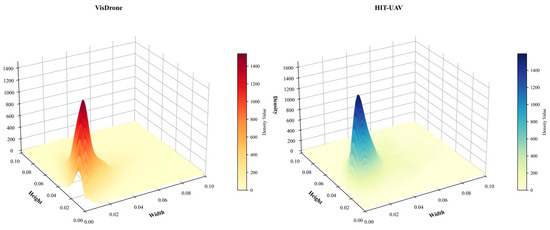
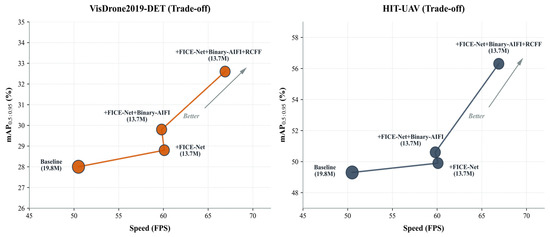
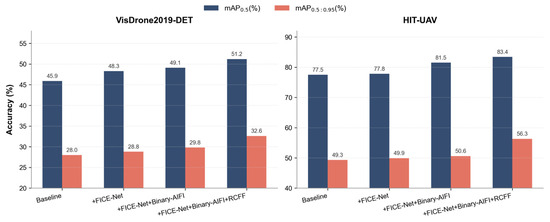
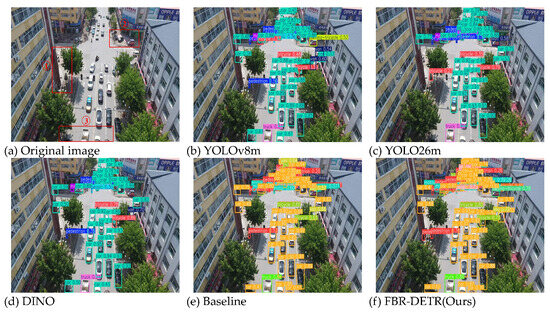
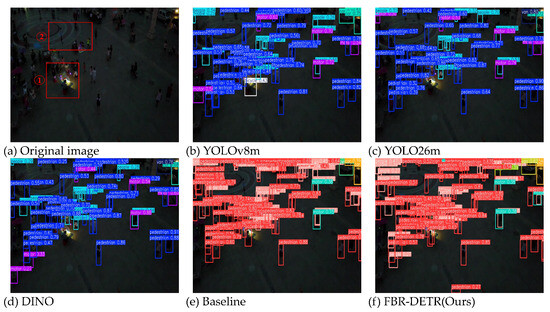
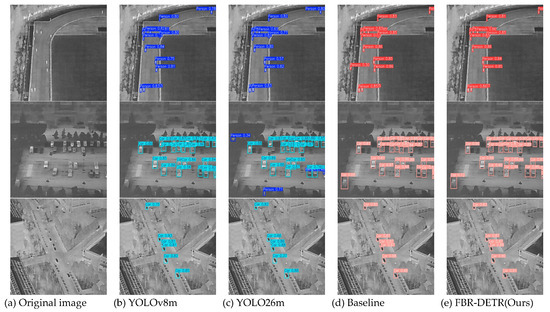
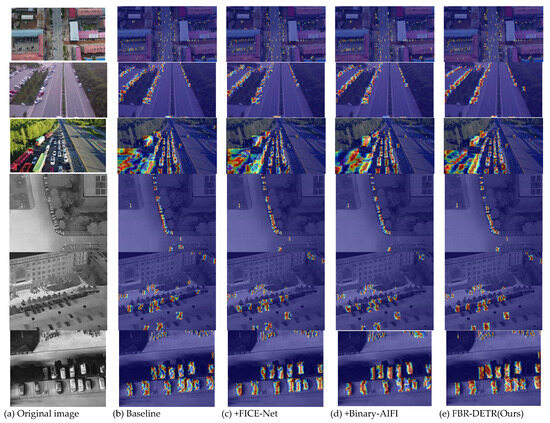
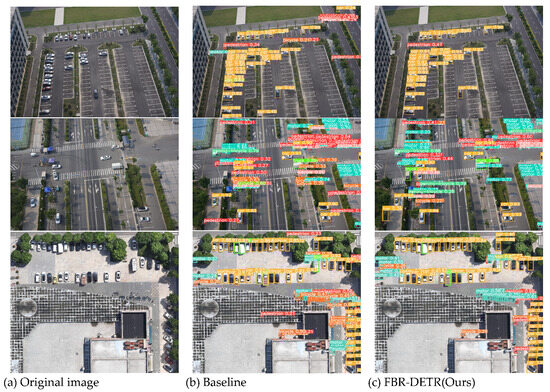
Identifying and localizing small objects in UAV imagery is a highly challenging task. Existing detection models are prone to missed detections, false detections, and inaccurate localization, while improvements in detection accuracy and real-time performance are often accompanied by an increase in the number of model parameters. To address these issues, this paper proposes an efficient end-to-end network for real-time small-object detection in UAV imagery, termed FBR-DETR. Through coordinated design across three stages, namely feature extraction, efficient encoding, and cross-scale fusion, the proposed network achieves higher detection accuracy and real-time performance for small objects with fewer parameters. FBR-DETR incorporates three core innovations. First, to address the tendency of small objects to be overwhelmed by background textures in deep features, we design a frequency-domain inverse-convolution-enhanced feature extraction network (FICE-Net), which introduces frequency-domain inverse convolution into the backbone feature extraction process to enhance the joint perception of global spectral structures and fine-grained spatial features at the source. Second, to reduce the inference overhead introduced by full-precision attention computation in AIFI, we construct a binary attention-based intra-scale feature interaction module (Binary-AIFI), which binarizes the query and key matrices while preserving global contextual representation with controlled additional computational cost. Third, to alleviate the dilution of small-object information during cross-scale fusion, we propose a re-parameterized cross-scale feature fusion module (RCFF), which enhances feature representation during training through a multi-branch re-parameterized structure and is equivalently merged into a single convolution during inference, thereby balancing fusion capability and real-time inference efficiency. On the VisDrone2019-DET and HIT-UAV datasets, the proposed method achieves mAP0.5 values of 51.2% and 83.4%, respectively. Compared with the baseline model, our method improves mAP0.5 by 5.3% and 5.9%, reduces the number of parameters by 30.8%, and improves the average precision for small objects (APs) by 2.4% and 4.9%, respectively.
Full article
(This article belongs to the Special Issue Learning-Based Remote Sensing and Earth Observation Intelligence: Representation, Fusion, Interpretation, and Generation)
►▼
Show Figures

Figure 1

Open AccessArticle
SWH Retrieval from SWOT KaRIn Data by Combining Backscattering and Interference Characteristics
by
Zhiyang Jiang, Tong Hu, Lin Ren, Yongjun Jia, Xiao Dong, Yinquan Zhang, Yi Zhang, Limin Cui, Yiqi Wang and Han Han
Remote Sens. 2026, 18(17), 2899; https://doi.org/10.3390/rs18172899 - 27 Aug 2026
Abstract
This study focuses on the Significant Wave Height (SWH) retrieval from the Ka-band radar interferometer (KaRIn) on the Surface Water and Ocean Topography (SWOT) satellite by combining backscattering and interference characteristics. To this end, the backscattering-related and interference-related parameters were jointly used as
[...] Read more.
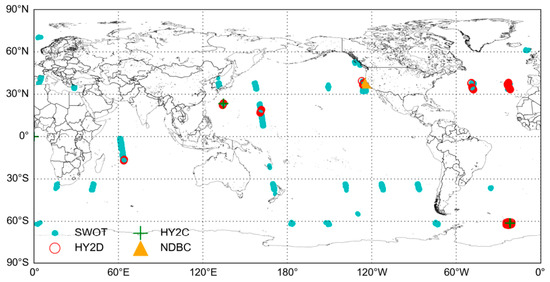
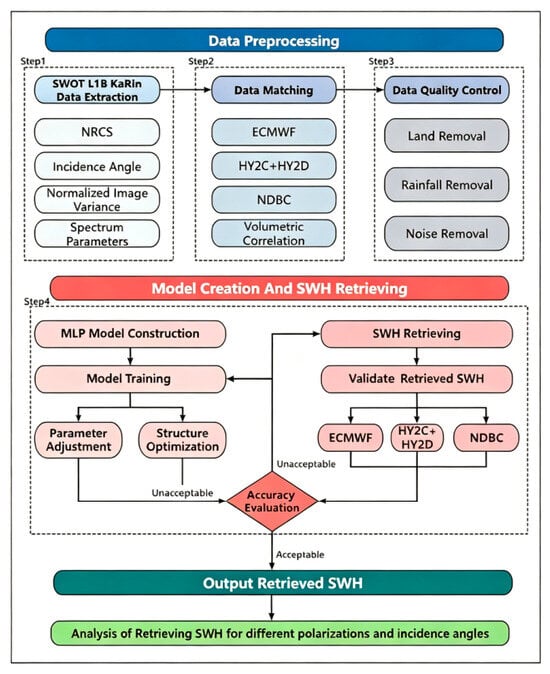
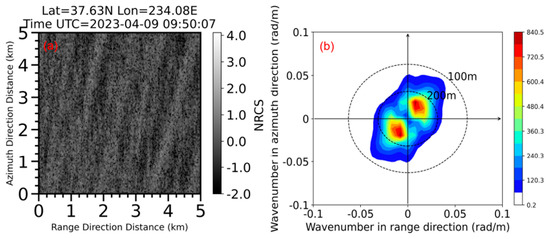
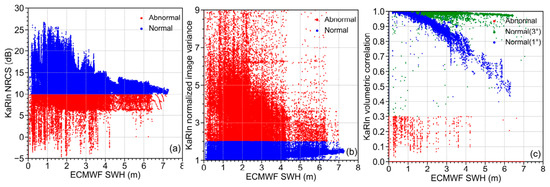
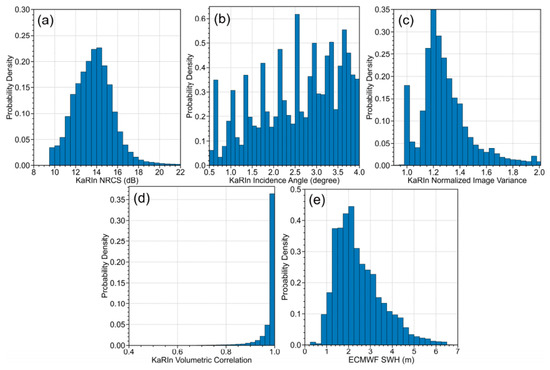
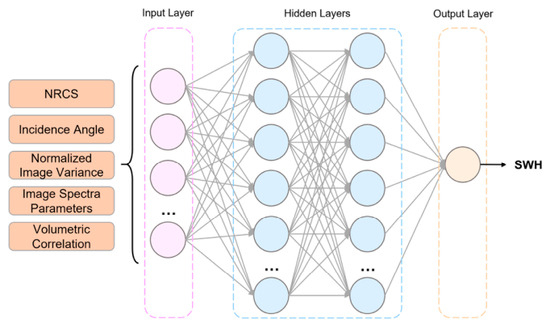
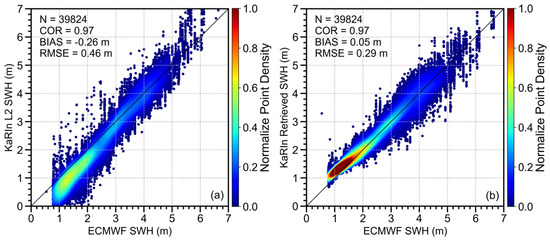
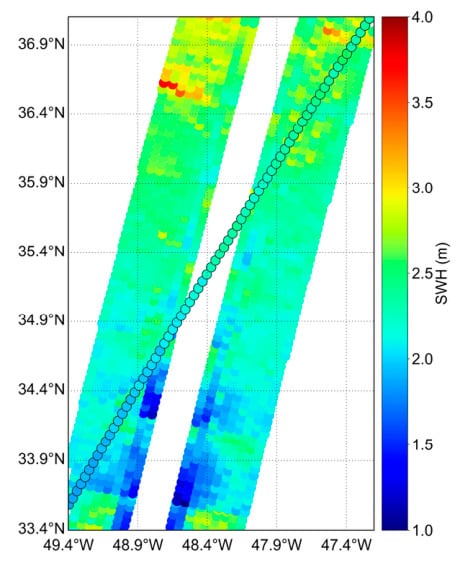
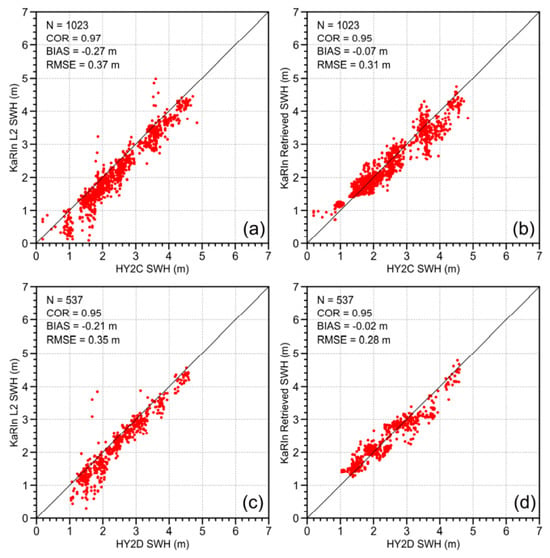
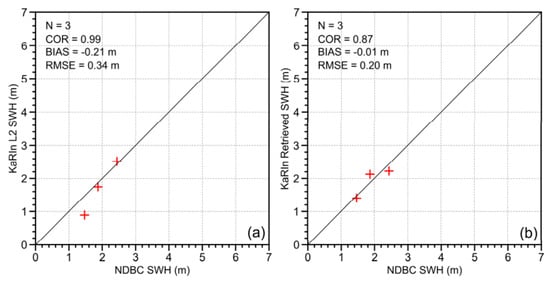
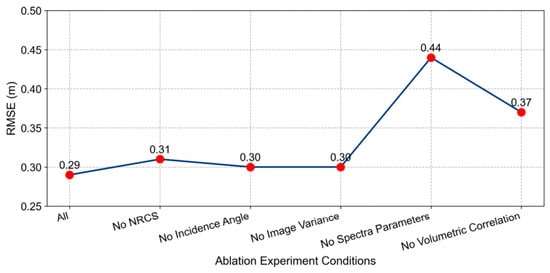
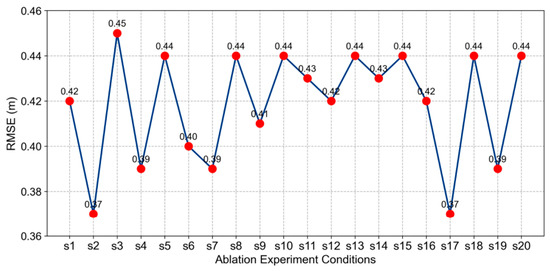
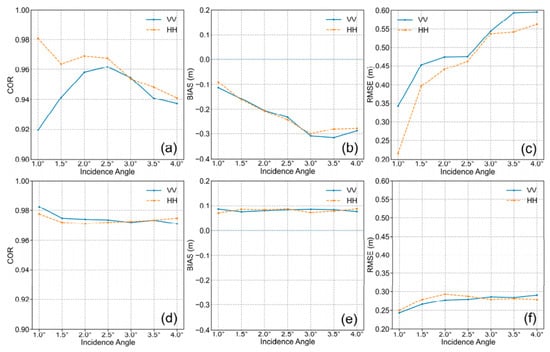
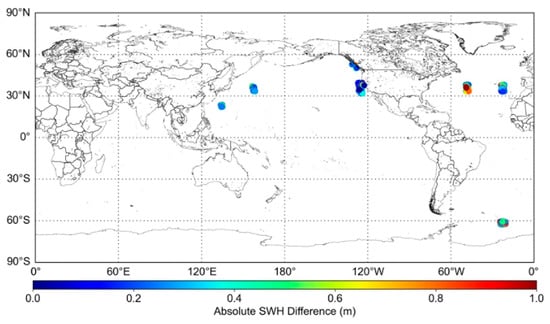
This study focuses on the Significant Wave Height (SWH) retrieval from the Ka-band radar interferometer (KaRIn) on the Surface Water and Ocean Topography (SWOT) satellite by combining backscattering and interference characteristics. To this end, the backscattering-related and interference-related parameters were jointly used as inputs to develop a machine learning model. Here, the backscattering-related data include normalized radar cross-section (NRCS), incidence angle, and the image spectra parameters extracted from KaRIn Level 1B (L1B) data, while the interference-related data correspond to the Level 2 (L2) volumetric correlation, which characterizes the influence of ocean wave scattering on interferometric coherence. The machine learning model is built upon a Multi-Layer Perceptron (MLP), which serves as a nonlinear fitting tool. SWH retrievals from the proposed method and the existing L2 SWH product as a reference were validated by the collocated European Center for Medium-Range Weather Forecasts (ECMWF) reanalysis data, Haiyang2C (HY2C) and Haiyang2D (HY2D) altimeter data, and National Data Buoy Center (NDBC) buoy data. Validations show that both KaRIn SWH have a good agreement with collocations in terms of correlation coefficient (COR), BIAS and root mean square error (RMSE). Moreover, the retrieval accuracy from the proposed method (with an RMSE of about 0.29 m) is better than that of the L2 product (with an RMSE of about 0.46 m) when validated against the collocated ECMWF datasets. Ablation analysis further confirms that image spectra parameters and volumetric correlation are the dominant factors driving the retrieval accuracy improvement, with notable contribution differences among the sub-parameters of spectral features. This performance gain arises from the complementary physical mechanisms of backscattering and interferometric observables, which describe sea state information from independent dimensions. These accurate SWH retrievals can help correct sea state biases for collocated KaRIn sea surface height products and complement wave products from other satellite sensors.
Full article
(This article belongs to the Special Issue Satellite Remote Sensing of Ocean Waves and Marine Dynamics)
►▼
Show Figures

Figure 1
Open AccessArticle
Decoupled Aquatic Greening and Water-Area Dynamics in Northeast Siberian Arctic Thermokarst Lakes from 2000 to 2025
by
Aobo Liu, Han Sun and Yating Chen
Remote Sens. 2026, 18(17), 2898; https://doi.org/10.3390/rs18172898 - 27 Aug 2026
Abstract
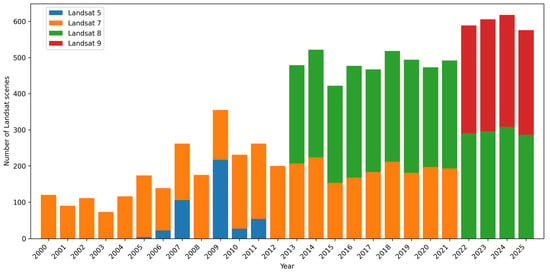
Thermokarst lakes are sensitive components of Arctic permafrost landscapes and important methane sources, yet aquatic vegetation change is rarely examined together with lake water dynamics. We used Landsat observations to quantify water area, aquatic vegetation occurrence frequency, and maximum vegetation extent for 32,439
[...] Read more.
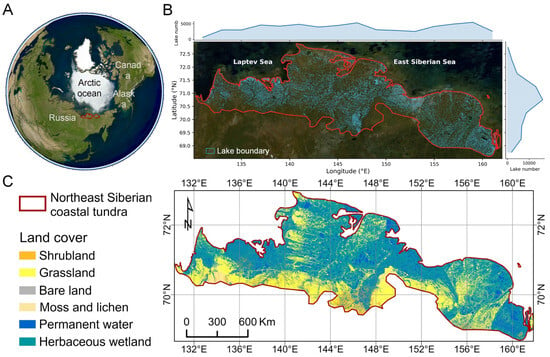
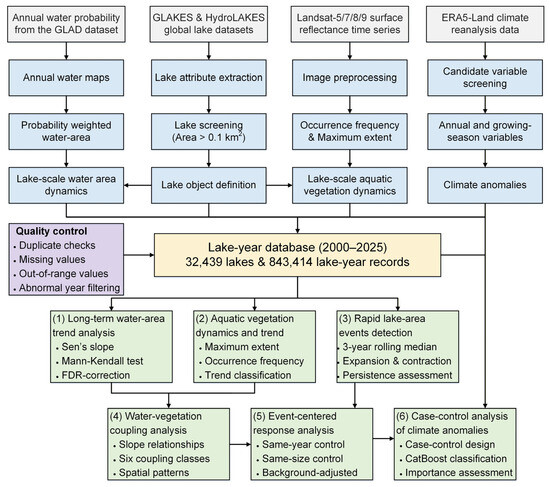
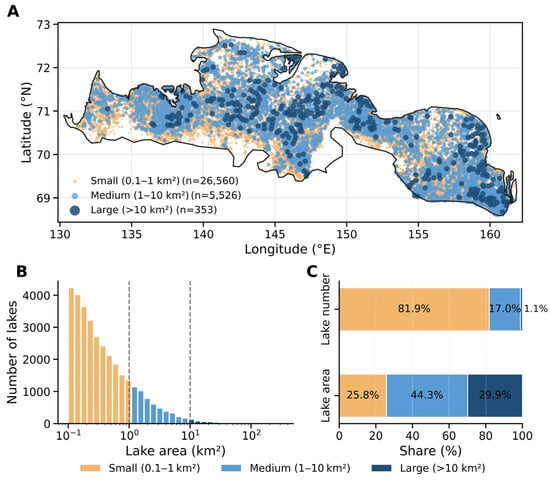
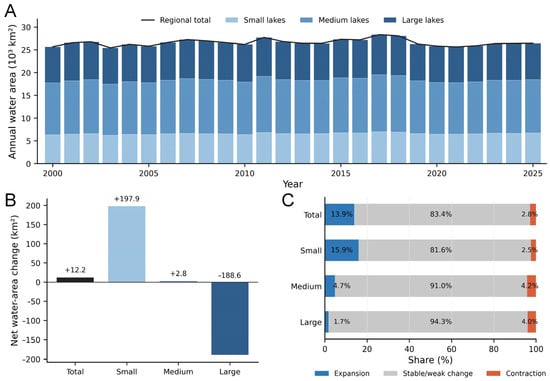
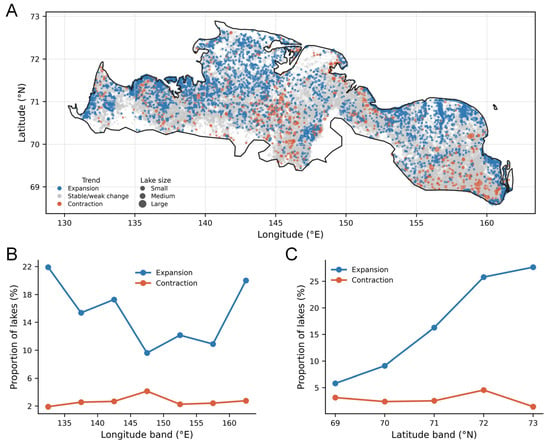
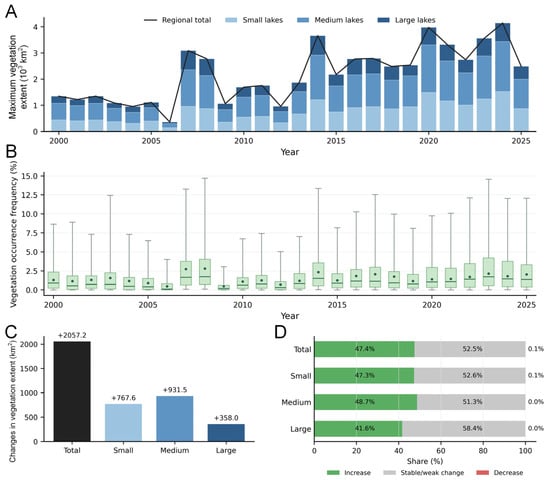
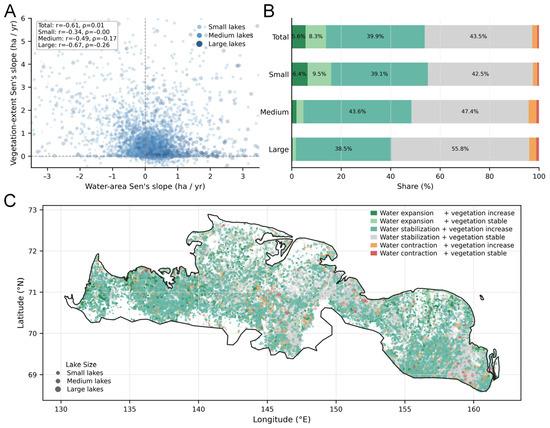
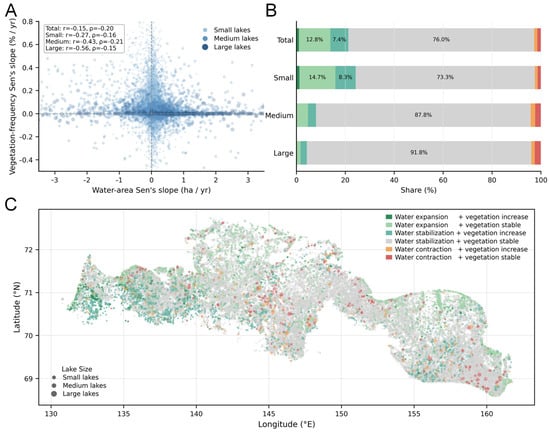
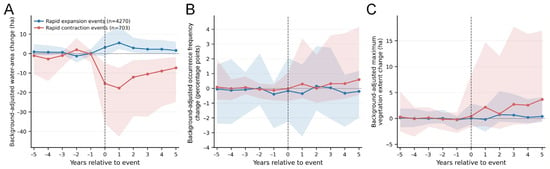
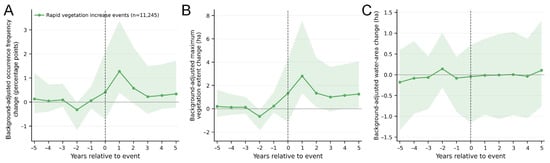
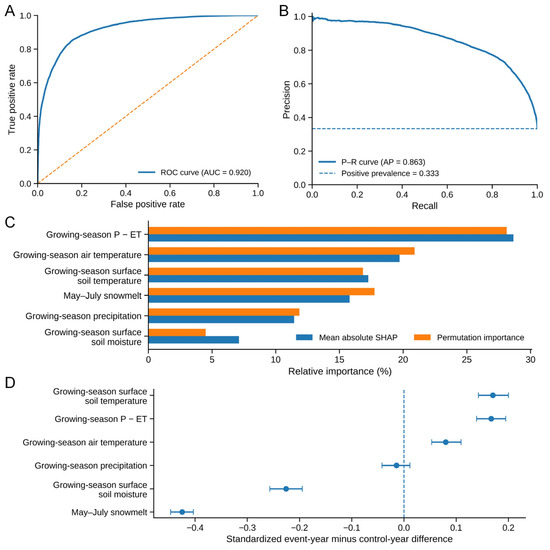
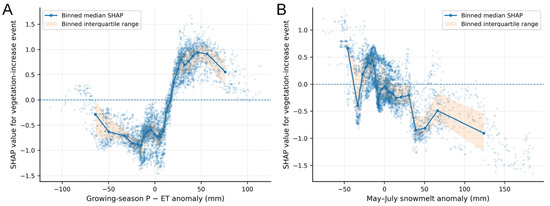
Thermokarst lakes are sensitive components of Arctic permafrost landscapes and important methane sources, yet aquatic vegetation change is rarely examined together with lake water dynamics. We used Landsat observations to quantify water area, aquatic vegetation occurrence frequency, and maximum vegetation extent for 32,439 lakes in Northeast Siberia from 2000 to 2025. Long-term trends, rapid events, event-centered trajectories, and water–vegetation coupling were analyzed at regional and individual-lake scales, while a same-lake case–control design examined climate anomalies associated with rapid vegetation increases. Regional lake water area showed a net increase of only 0.05% between the 2000–2004 and 2021–2025 mean periods because gains in small lakes were offset by losses in large lakes. Over the same two periods, maximum aquatic vegetation extent increased by 172.5%, and 47.4% of lakes showed a significant increase. Stable water area combined with increasing vegetation extent in 39.9% of all lakes, indicating substantial long-term decoupling. Rapid lake contraction was followed by gradual vegetation increases, whereas rapid vegetation increases generally occurred without systematic lake-area change. Event years were more often associated with a positive growing-season water balance and reduced May–July snowmelt, although these relationships varied among years. Aquatic greening therefore represents substantial ecological reorganization within Arctic lake basins that is only partly captured by conventional surface water monitoring.
Full article
(This article belongs to the Special Issue Remote Sensing of Water Dynamics in Permafrost Regions)
►▼
Show Figures

Figure 1
Open AccessArticle
Automating Tree Crown Delineation in UAV Orthomosaics Without Annotation: An Annotation-Free Framework Coupling DeepForest, Segment Anything, and Unsupervised Clustering
by
Ge Shi, Haoran Tang, Wei Wang, Chuang Chen and Jiantao Shi
Remote Sens. 2026, 18(17), 2897; https://doi.org/10.3390/rs18172897 - 27 Aug 2026
Abstract
Individual-tree-level information on crown distribution and morphology underpins forest inventory, biomass estimation, and carbon accounting. High-resolution Unmanned Aerial Vehicle (UAV) imagery resolves single-tree detail, but automated crown extraction remains difficult: fully supervised segmentation depends on costly pixel-level annotation that generalizes poorly, while the
[...] Read more.
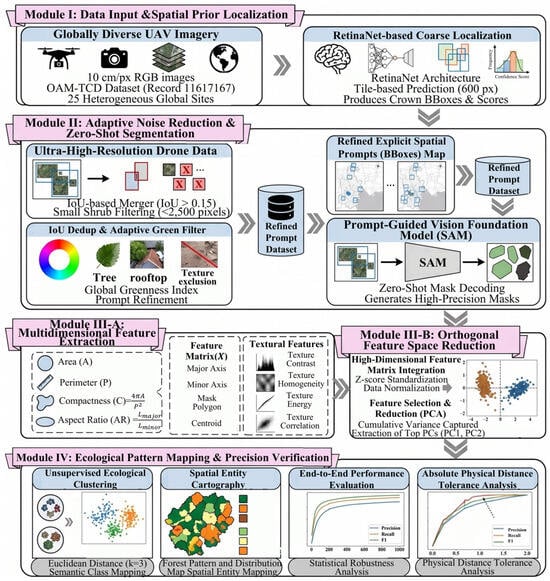
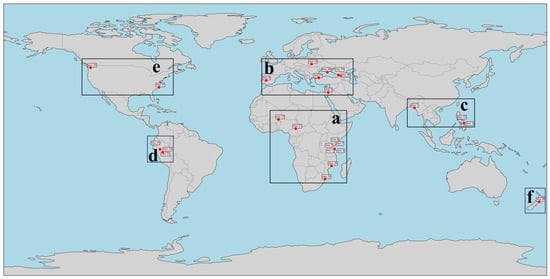
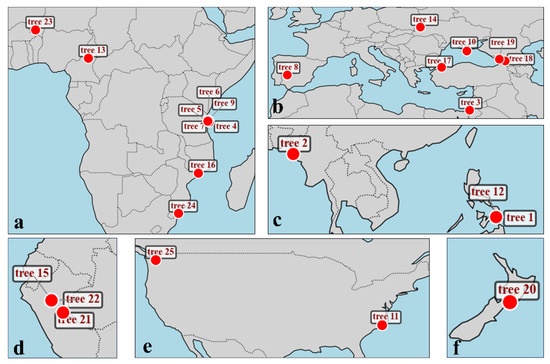
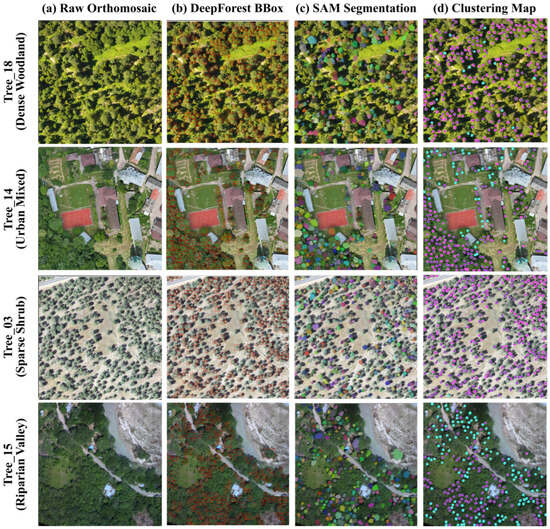
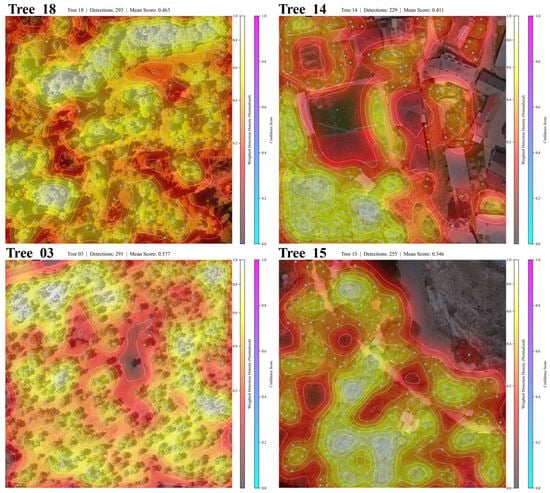
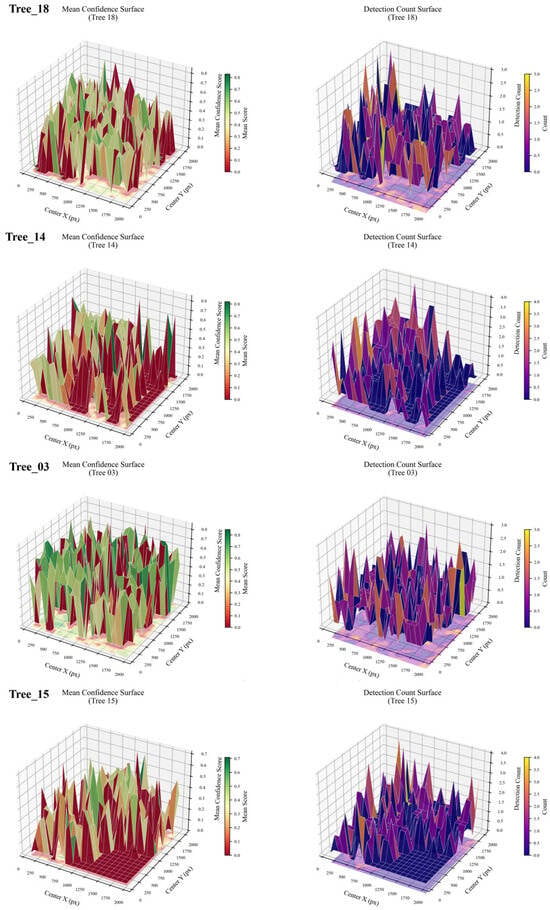
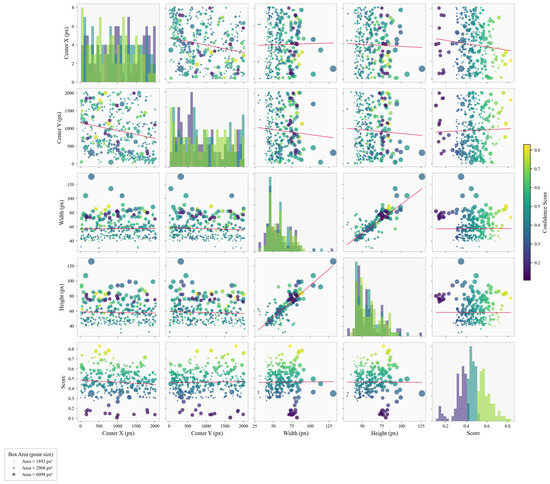
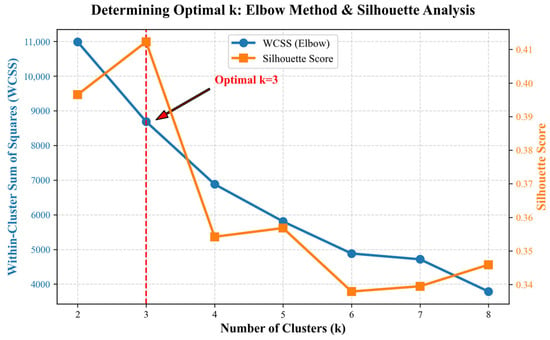
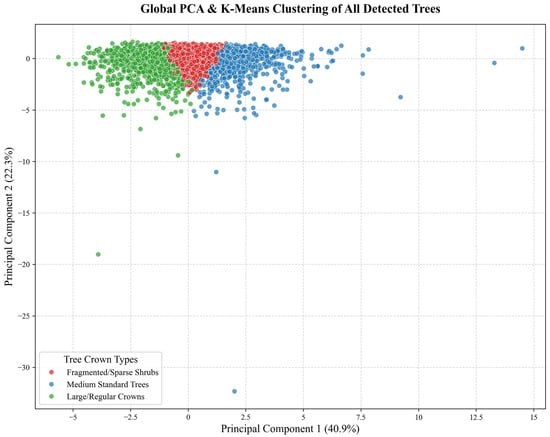
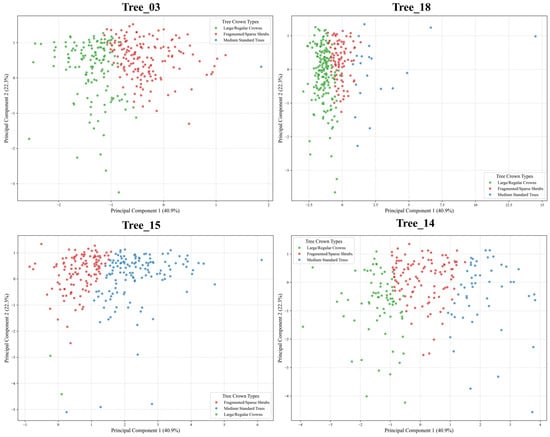
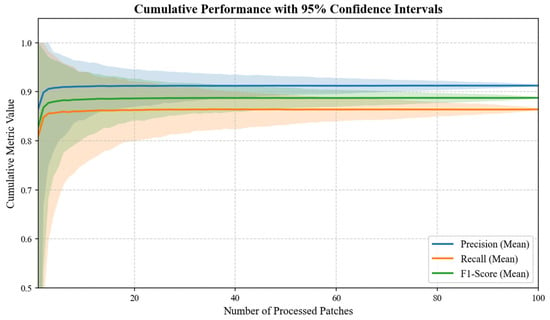
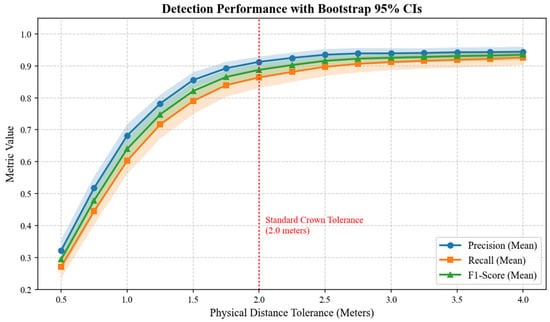
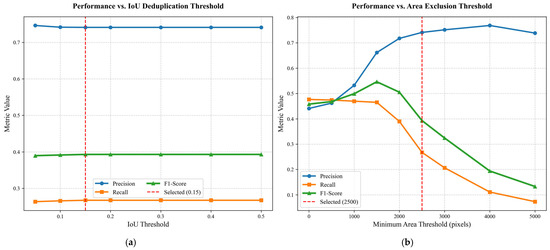
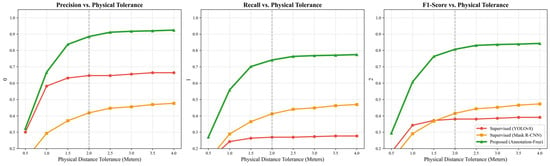
Individual-tree-level information on crown distribution and morphology underpins forest inventory, biomass estimation, and carbon accounting. High-resolution Unmanned Aerial Vehicle (UAV) imagery resolves single-tree detail, but automated crown extraction remains difficult: fully supervised segmentation depends on costly pixel-level annotation that generalizes poorly, while the Segment Anything Model (SAM), though training-free, cannot locate trees on its own and existing SAM-based methods restore this ability only by adding task-specific training. We present an end-to-end, annotation-free toolkit for tree crown extraction and ecological analysis. A RetinaNet-based DeepForest detector produces coarse boxes; an adaptive module then removes duplicate boxes and non-vegetation false positives using an intersection-over-union rule and a global greenness index, converting noisy boxes into clean prompts; these prompts drive SAM to decode irregular crown masks without task-specific training; and geometric and texture features are extracted and grouped by principal component analysis and K-means clustering to map ecological patterns. We evaluated the toolkit on multi-biome imagery from the public OAM-TCD dataset. Because pixel-exact metrics are unstable at 10 cm resolution, where wind sway, shadow shift, and small labeling offsets are strongly amplified, we assessed accuracy under an absolute physical-distance tolerance. At a 2.0 m tolerance, consistent with the effective radius of a mature crown, the toolkit reached a precision of 91.25%, a recall of 86.40%, and an F1-score of 88.76%; bootstrap and Monte Carlo resampling confirmed these values are stable. Without manual annotation, it characterized more than 4700 individual crowns and recovered distinct vegetation patterns across geographic settings, offering a highly adaptable, low-cost baseline tool that demonstrates robust performance across the diverse multi-biome scenes within the OAM-TCD dataset.
Full article
(This article belongs to the Special Issue Remote Sensing Intelligent Interpretation in the Era of Large Models and Intelligent Agents: New Challenges, Methods and Opportunities)
►▼
Show Figures

Figure 1
Open AccessArticle
DC4Former: Orientation-Stable UAV Disaster Image Segmentation via Diagonal-Complemented C4 Consistency
by
Wenhao Wu and Jiang Tao
Remote Sens. 2026, 18(17), 2896; https://doi.org/10.3390/rs18172896 - 27 Aug 2026
Abstract
UAV disaster imagery is often acquired under varying flight headings and camera yaw orientations, which can change the in-plane orientation of the observed scene. We propose DC4Former, an orientation-stable segmentation framework built on LRFormer. The architecture-only variant, C4Former, targets four grid-preserving rotations (
[...] Read more.
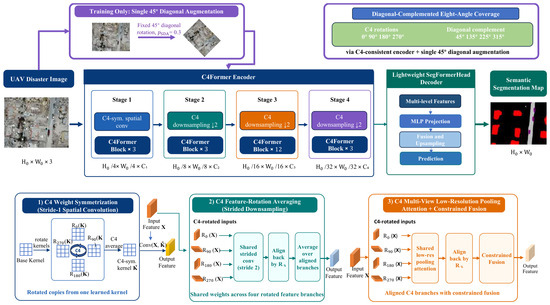
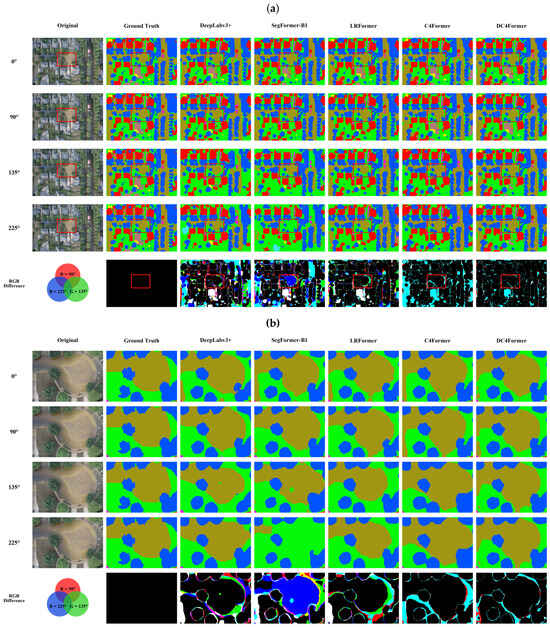
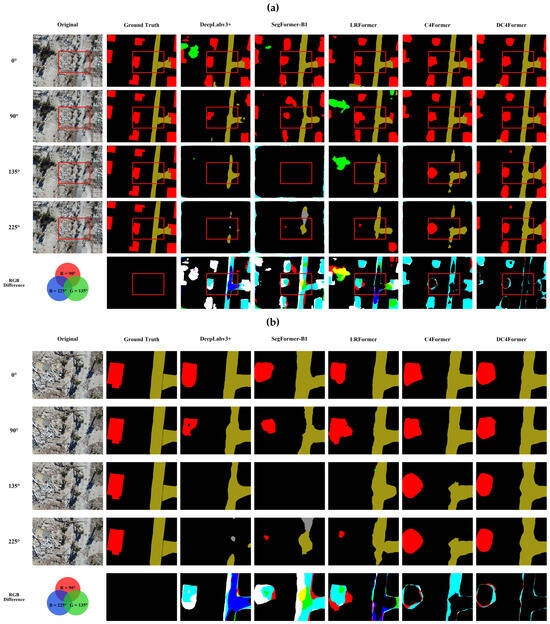
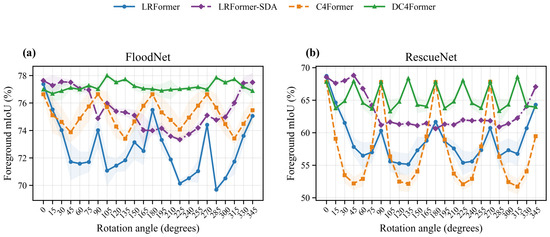
UAV disaster imagery is often acquired under varying flight headings and camera yaw orientations, which can change the in-plane orientation of the observed scene. We propose DC4Former, an orientation-stable segmentation framework built on LRFormer. The architecture-only variant, C4Former, targets four grid-preserving rotations ( , , , and ) by redesigning three rotation-sensitive operations: stride-1 spatial convolution, strided downsampling, and low-resolution pooling attention. It uses -symmetrized kernels, feature-rotation-averaged downsampling, and aligned four-view pooling attention with constrained branch fusion. DC4Former further adds a single rotation augmentation during training to improve empirical robustness at diagonal angles while retaining as the grid-preserving architectural basis. FloodNet and RescueNet experiments use an eight-angle protocol and a 24-angle stress test. Compared with LRFormer, DC4Former increases the three-seed worst-angle foreground mIoU from 70.14% to 76.83% on FloodNet and from 54.90% to 67.66% on RescueNet, while reducing the RescueNet eight-angle standard deviation from 4.17 to 0.33. Relative to LRFormer-RandRot, which adds no inference-time overhead, the observed deployment trade-off is dataset- and protocol-dependent. On FloodNet, LRFormer-RandRot has slightly higher All-8, Worst-8, Mean-24, and Worst-24 values. On RescueNet, it has higher Mean-24 and Worst-24 and a lower Std.-24, whereas DC4Former has higher All-8 and Worst-8 and a lower Std.-8 under the eight-angle protocol at increased inference latency. Taken together, these results show that operator-aware consistency combined with diagonal training exposure provides an architecture-level route to improved reliability across the eight principal orientations relative to the unmodified LRFormer backbone.
Full article
(This article belongs to the Section AI Remote Sensing)
►▼
Show Figures

Figure 1

Open AccessArticle
Benchmarking Open-Access Building Footprints: A Multi-Dimensional Assessment with High-Fidelity References
by
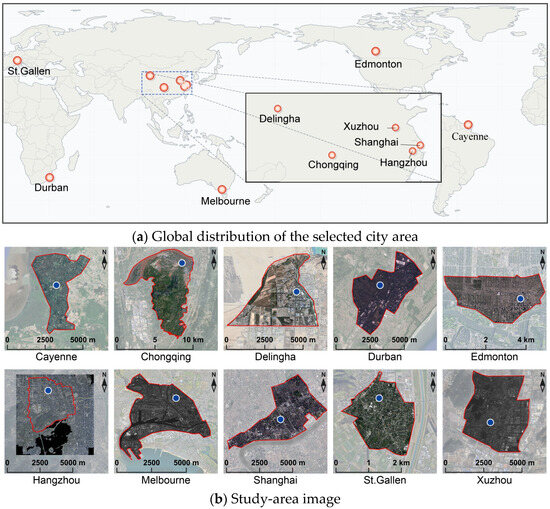
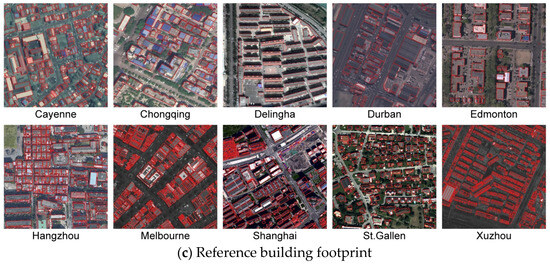
Taiqing Zhou, Yifan Liao, Wenxiang Gan, Zhijie Chen, Chuchu Li, Geyi Zhao, Qi Chen, Qian Xue and Pengjie Tao
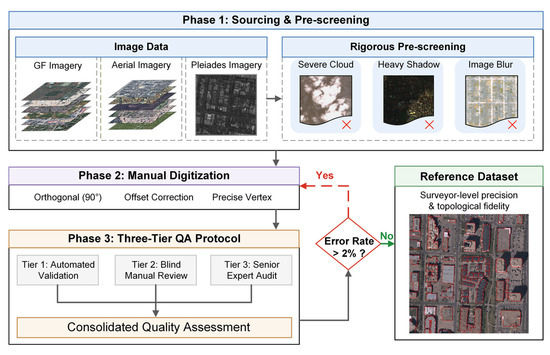
Remote Sens. 2026, 18(17), 2895; https://doi.org/10.3390/rs18172895 - 27 Aug 2026
Abstract
►▼
Show Figures
The rapid proliferation of open-access vector building footprint datasets has created substantial opportunities for large-scale urban analysis, yet their reliability remains difficult to assess effectively and consistently. This challenge arises primarily from the scarcity of large-scale, high-fidelity reference benchmarks across diverse urban environments.
[...] Read more.
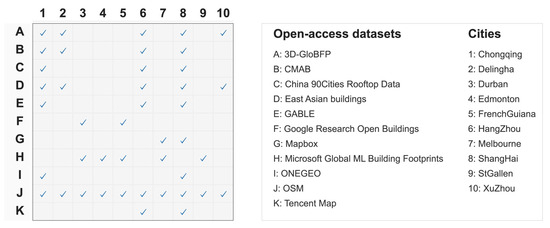
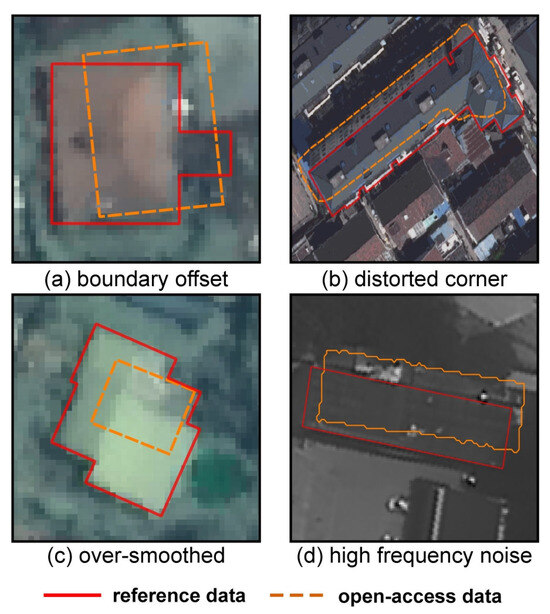
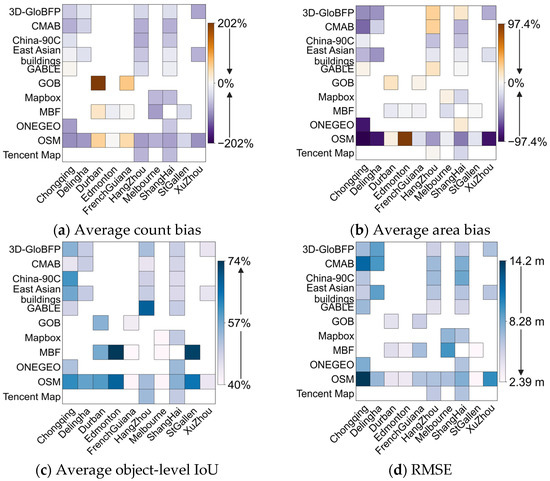
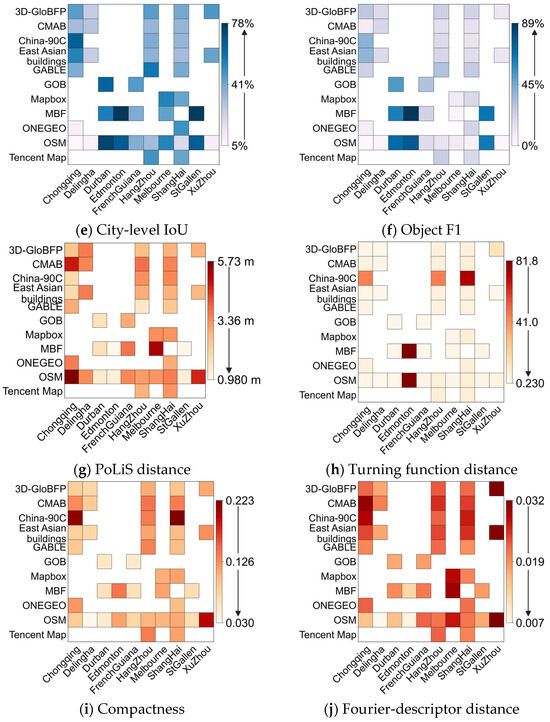
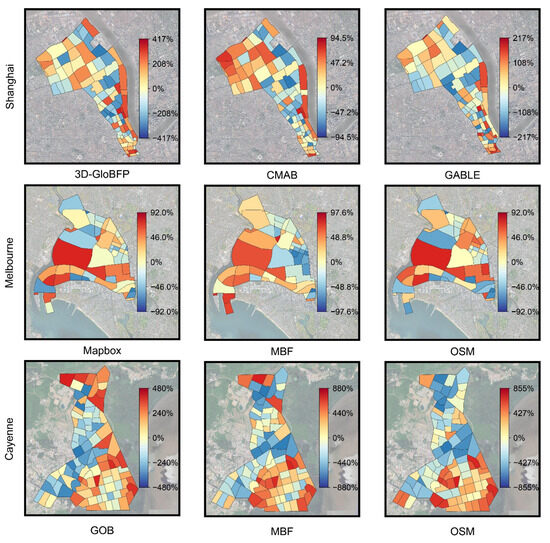
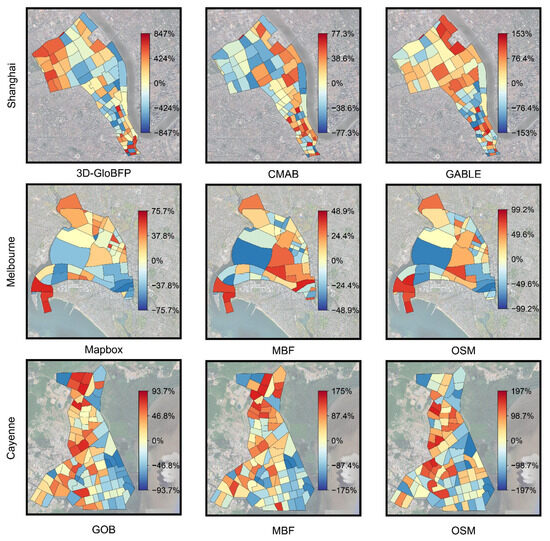
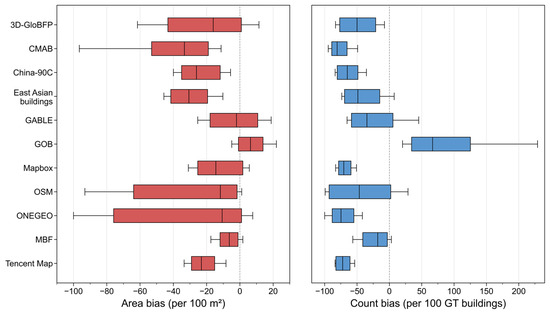
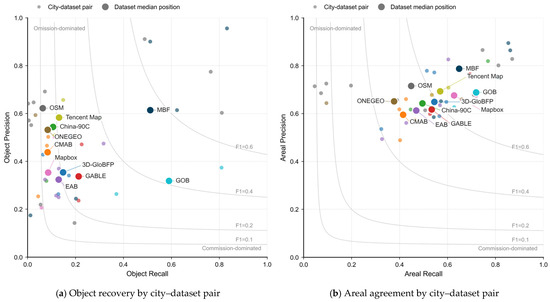
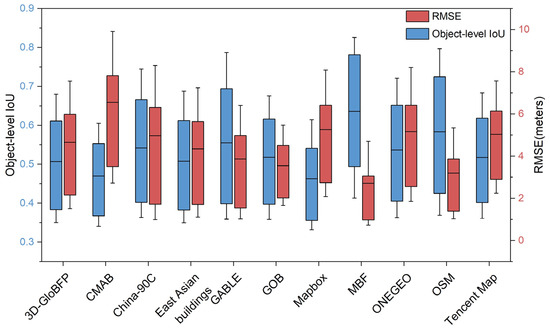
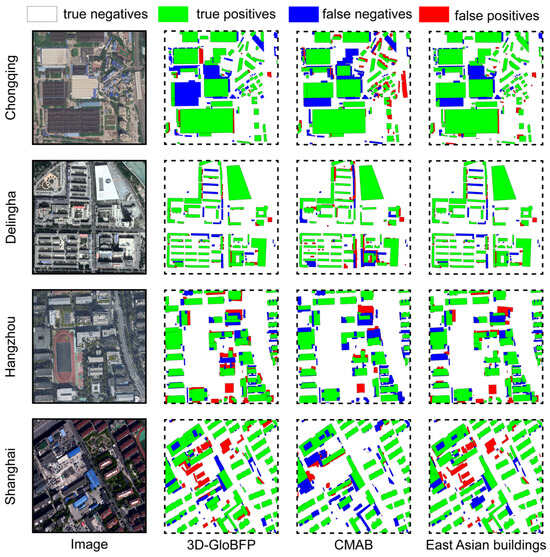
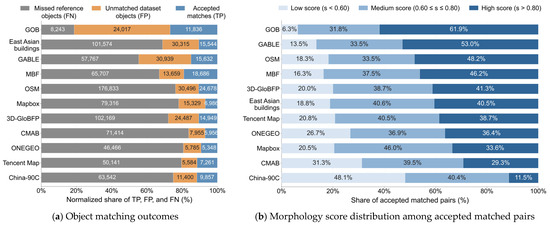
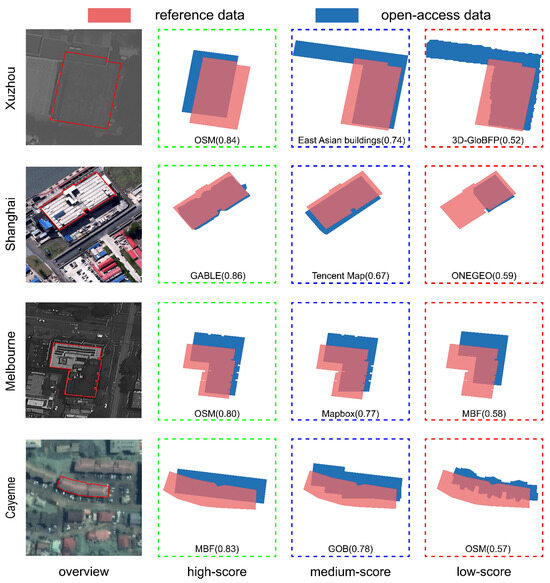
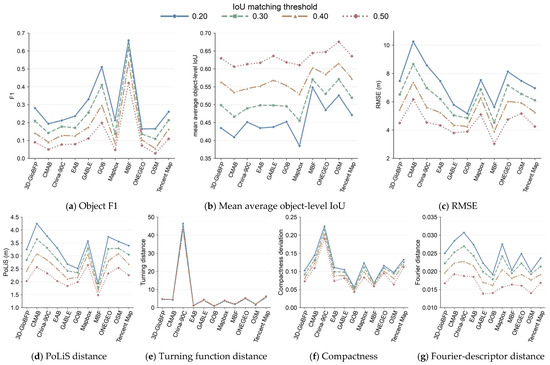
The rapid proliferation of open-access vector building footprint datasets has created substantial opportunities for large-scale urban analysis, yet their reliability remains difficult to assess effectively and consistently. This challenge arises primarily from the scarcity of large-scale, high-fidelity reference benchmarks across diverse urban environments. To address these limitations, we construct a benchmark-grade reference dataset comprising over 200,000 manually annotated building footprints across 10 purposively selected cities across diverse global regions through an exhaustive curation campaign and strict manual-automated quality validation. Using this dataset, we develop a three-tier evaluation framework that assesses statistical consistency, object recovery and spatial accuracy, and morphology fidelity among matched building pairs. Evaluating 11 mainstream datasets reveals pervasive underestimation in both building area (average bias: −14.9%) and count (−34.0%). Average city-level intersection-over-union values range from 29.1% to 58.3%, indicating low-to-moderate spatial overlap. For matched building pairs, the datasets demonstrate relatively high geometric fidelity, with morphological similarity scores of 0.495 to 0.803. Pronounced regional performance variations indicate that no single dataset is universally optimal. Specifically, Microsoft Global ML Building Footprints offers the most balanced multi-city performance, Google Research Open Buildings is recommended for boundary shape fidelity, and regional datasets remain competitive for local analyses.
Full article

Figure 1
Open AccessArticle
Adaptive Fusion of Multiple Land-Cover Products for Improved Spatial Representation of Key Land Classes in Central Asia
by
Long Fu, Yubo Zhang, Baoqi Liu, Shuwen Zhang and Hongbing Chen
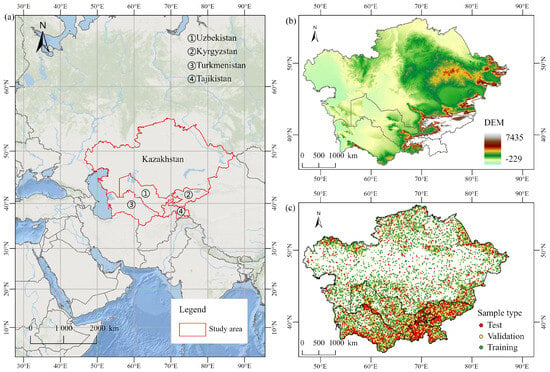
Remote Sens. 2026, 18(17), 2894; https://doi.org/10.3390/rs18172894 - 26 Aug 2026
Abstract
►▼
Show Figures
Reliable cropland, forestland, and grassland maps support resource assessment and ecological management in arid and semi-arid Central Asia. Existing land-cover products often delineate these classes differently, vary in reliability across classes and locations, and may share the same errors even when they agree.
[...] Read more.
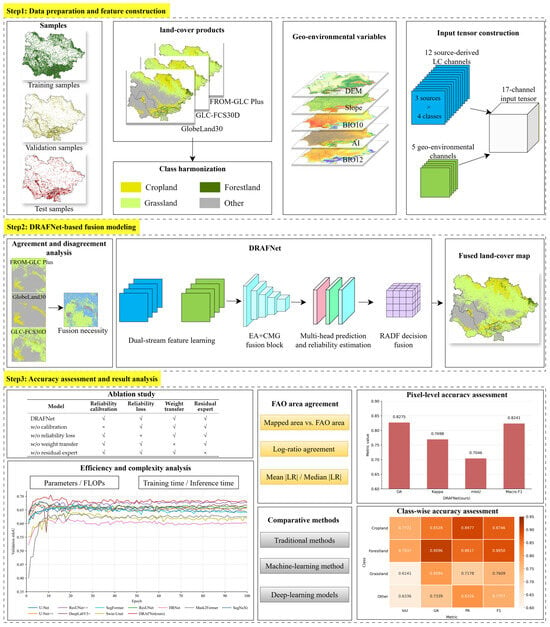
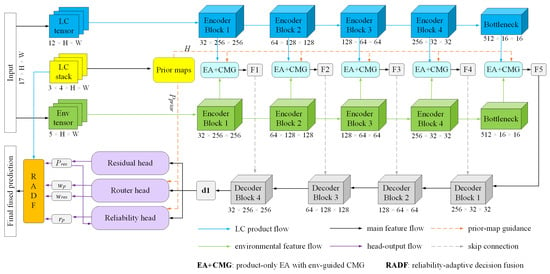
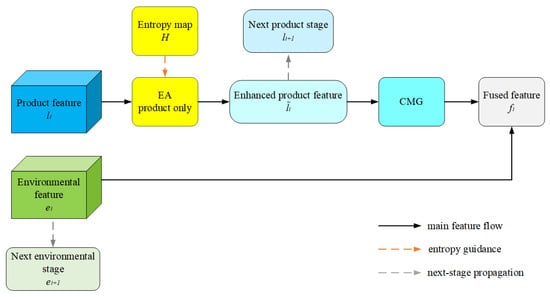
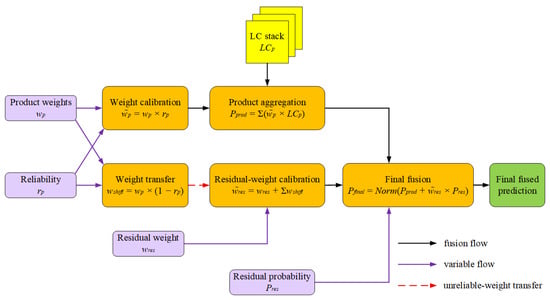
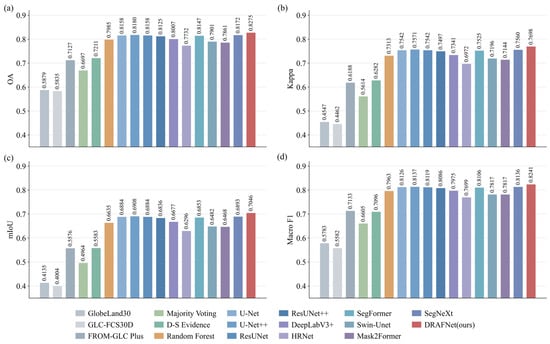
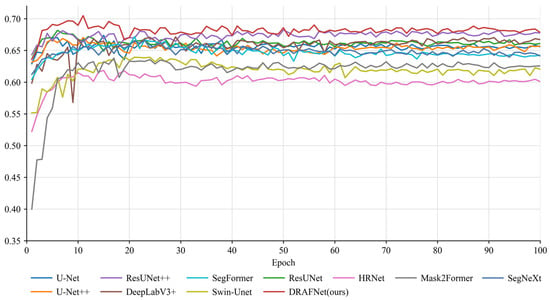
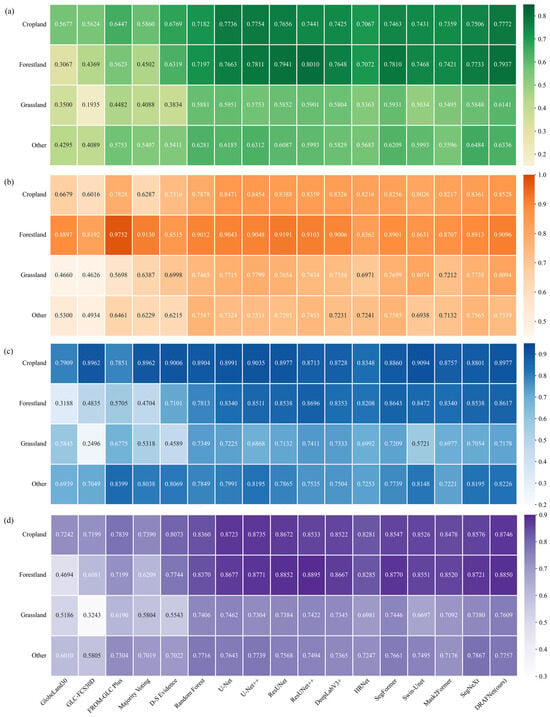
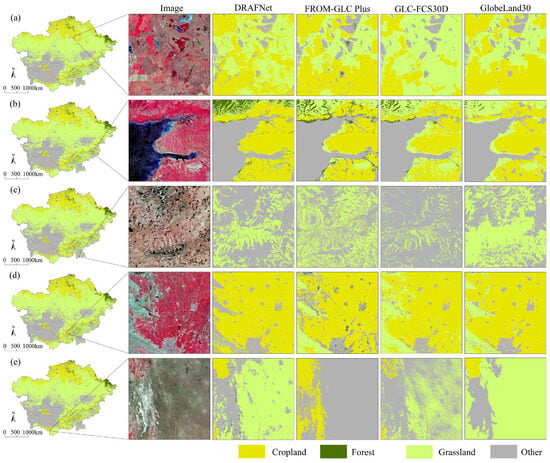
Reliable cropland, forestland, and grassland maps support resource assessment and ecological management in arid and semi-arid Central Asia. Existing land-cover products often delineate these classes differently, vary in reliability across classes and locations, and may share the same errors even when they agree. This study formulates multi-product fusion as a pixel- and class-specific reliability decision problem. To address this problem, we propose a reliability-adaptive fusion framework, the Discrepancy-Aware Reliability-Adaptive Fusion Network (DRAFNet), using 2020 maps from three global 30 m land-cover products—FROM-GLC Plus, GLC-FCS30D, and GlobeLand30—and variables representing aridity, temperature, precipitation, elevation, and slope. Unlike fixed-weight fusion methods and segmentation models that use the source products only as input channels, DRAFNet retains the categorical source decisions and adjusts each contribution according to its estimated reliability for the assigned class and location. Weight removed from an unreliable source is transferred to a residual expert, which provides an alternative prediction when the source products are unreliable or share the same error. Voting entropy and geo-environmental variables provide contextual information for this decision. On independent test samples from the five Central Asian countries, DRAFNet achieved an overall accuracy (OA) of 0.8275, a Kappa coefficient of 0.7698, a mean intersection over union (mIoU) of 0.7046, and a macro-averaged F1 score (Macro F1) of 0.8241. These values were 0.95–1.38 percentage points higher than those of U-Net++, the strongest benchmark. Local comparisons indicated more coherent spatial patterns and clearer boundaries in areas of pronounced disagreement. The mean and median absolute log-ratio deviations from area statistics reported by the Food and Agriculture Organization of the United Nations (FAO) were 0.618 and 0.450, respectively, both lower than those of the source products. These results support land-resource assessment and ecological management in Central Asia.
Full article

Figure 1
Open AccessArticle
Phenology-Aware Compound Heat and Drought Events and Potential Exposure for Summer Maize in the Huang–Huai–Hai Plain, China
by
Xinrui Pei, Hongrui Zhao, Chenhui Zhang, Jianjun Wu, Jianhua Yang and Wenhui Zhao
Remote Sens. 2026, 18(17), 2893; https://doi.org/10.3390/rs18172893 - 26 Aug 2026
Abstract
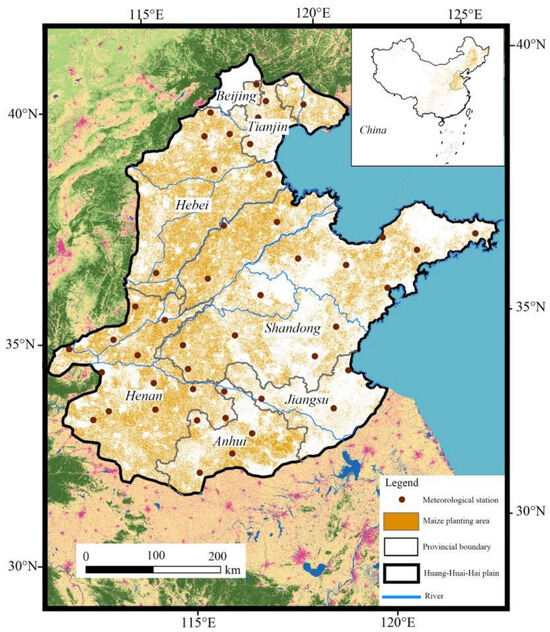
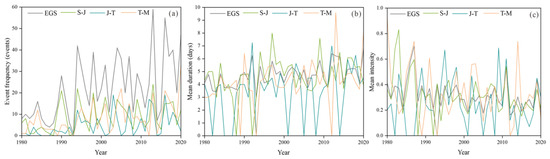
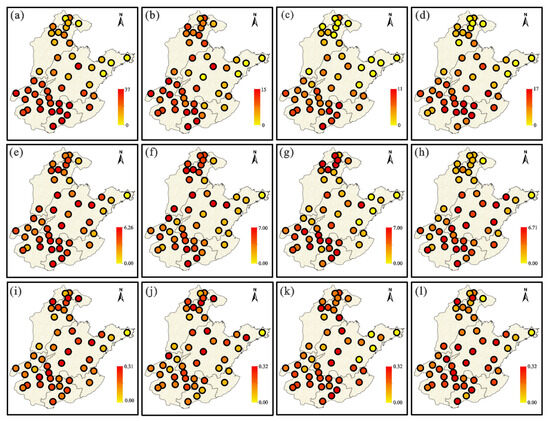
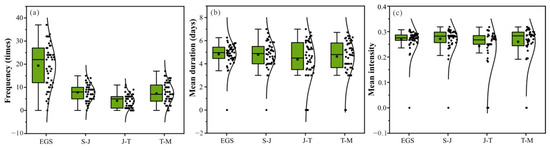
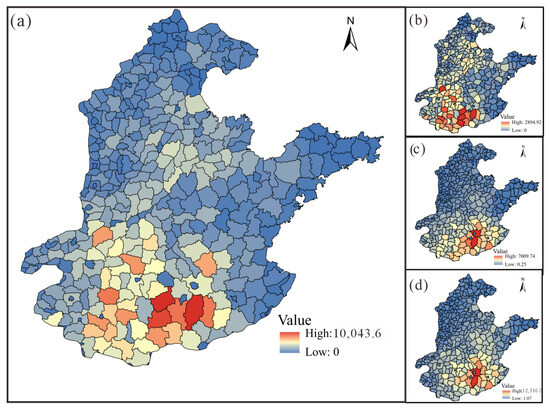
Compound heat and drought events (CHDEs) increasingly threaten crop production, yet conventional assessments rarely account for phenological changes in crop heat sensitivity and water demand. Here, we developed a phenology-aware daily framework for summer maize in the Huang–Huai–Hai (HHH) Plain, China, integrating stage-specific
[...] Read more.
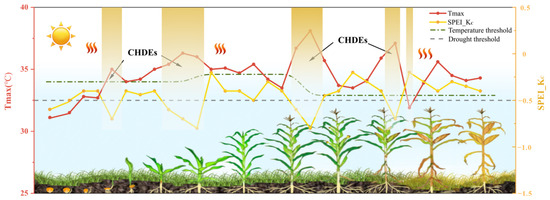
Compound heat and drought events (CHDEs) increasingly threaten crop production, yet conventional assessments rarely account for phenological changes in crop heat sensitivity and water demand. Here, we developed a phenology-aware daily framework for summer maize in the Huang–Huai–Hai (HHH) Plain, China, integrating stage-specific heat thresholds with a crop-coefficient-adjusted standardized precipitation evapotranspiration index (SPEI_KC) and a fixed cultivation distribution. Using daily meteorological observations from 1980 to 2020, CHDEs were characterized across the sowing-to-jointing, jointing-to-tasseling, and tasseling-to-maturity stages. Across the growing season, CHDE frequency and mean duration increased significantly, whereas mean intensity declined. Stage-specific responses differed markedly: frequency increased across all stages, while the tasseling-to-maturity stage showed the fastest increase in frequency and a significant lengthening of duration. Potential exposure also became progressively concentrated over crop development and was highest during tasseling-to-maturity in major maize-producing areas. By incorporating phenological variation into both heat and drought characterization, this framework resolves within-season differences in compound stress that are obscured by uniform-threshold approaches and provides a crop-relevant basis for stage-targeted monitoring and adaptation.
Full article
(This article belongs to the Special Issue Remote Sensing for Precision Farming and Crop Phenology (Second Edition))
►▼
Show Figures

Figure 1

Open AccessArticle
SAR-Oriented and Physics-Guided Ocean Wave Spectrum Retrieval
by
Yunxiao Li, Qi Wen, Xiu Zhu, Yuxin Liu, Lei Huang, Weifu Sun and Hao Zhang
Remote Sens. 2026, 18(17), 2892; https://doi.org/10.3390/rs18172892 - 26 Aug 2026
Abstract
Accurate retrieval of ocean wave spectra from Synthetic Aperture Radar (SAR) images is important for understanding wave energy distribution and supporting large-scale ocean-wave monitoring. However, existing SAR-based wave retrieval methods often focus on scalar wave parameters and pay limited attention to the physical
[...] Read more.
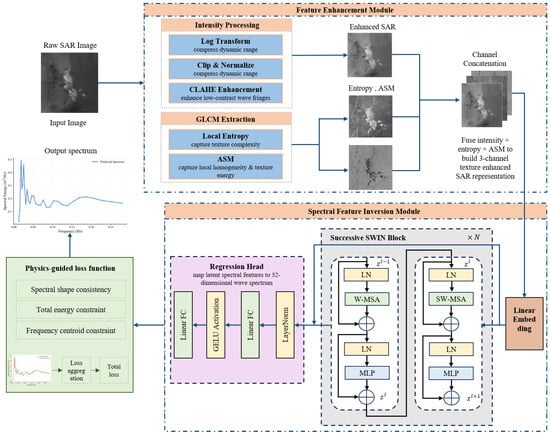
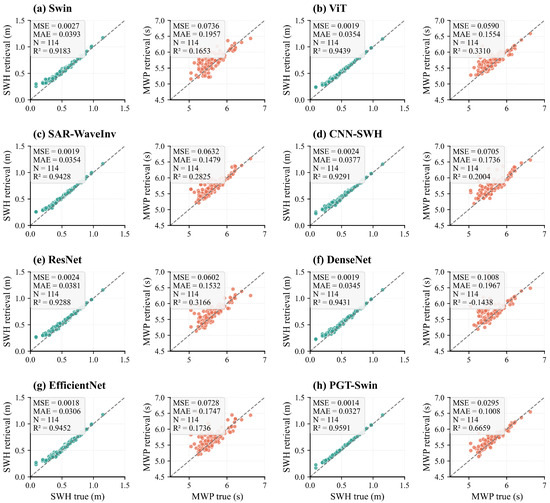
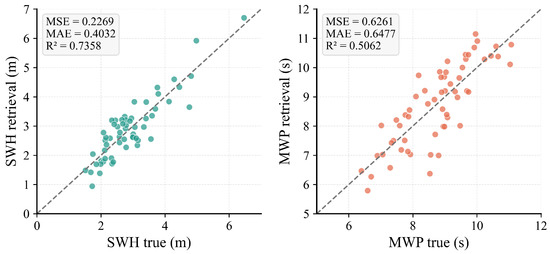
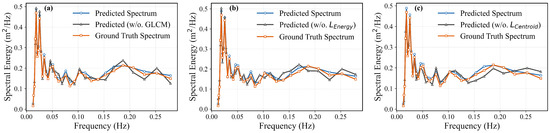
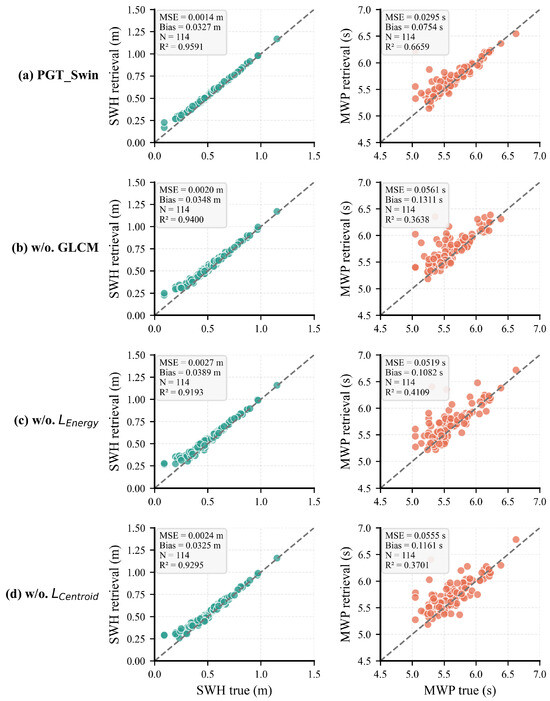
Accurate retrieval of ocean wave spectra from Synthetic Aperture Radar (SAR) images is important for understanding wave energy distribution and supporting large-scale ocean-wave monitoring. However, existing SAR-based wave retrieval methods often focus on scalar wave parameters and pay limited attention to the physical consistency of spectral energy reconstruction. In this study, we propose a physics-guided texture-enhanced Swin Transformer, named PGT-Swin, for retrieving one-dimensional wave frequency spectra from SAR images. The proposed method first constructs multi-channel SAR representations by combining intensity-enhanced images with Gray-Level Co-Occurrence Matrix (GLCM)-based texture features. A Swin Transformer backbone is then used to capture both local wave textures and global periodic structures. In addition, physics-guided spectral constraints are introduced to preserve total spectral energy and frequency-distribution consistency. Experiments were conducted using collocated Sentinel-1 SAR images and one-dimensional frequency spectra derived from CFOSAT SWIM products. The results show that PGT-Swin can effectively reconstruct wave spectra and derive reliable integral wave parameters. For SWH retrieval, the model achieves an MSE of 0.0014 and an R2 of 0.9591. For MWP retrieval, it achieves an MSE of 0.0295 and an R2 of 0.6659. These results demonstrate the effectiveness of PGT-Swin for SAR-based one-dimensional wave frequency-spectrum retrieval within the evaluated SWIM-referenced setting.
Full article
(This article belongs to the Special Issue Application of Multi-Sensor Remote Sensing to Investigate Water Energy Balance Process)
►▼
Show Figures

Figure 1
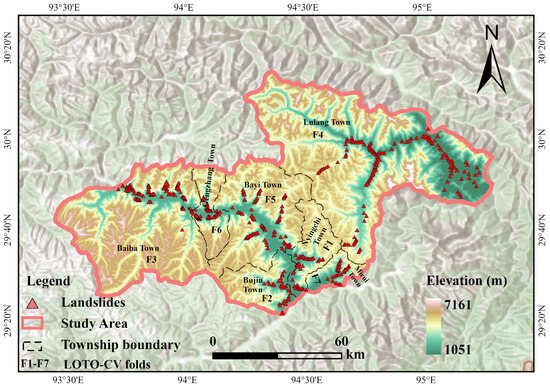
Open AccessArticle
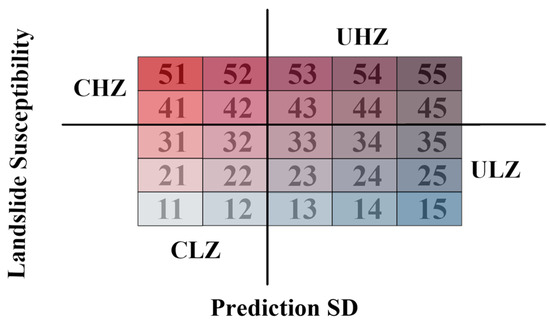
Predictive Performance and Resampling-Based Prediction Uncertainty of a Stacking Ensemble for Landslide Susceptibility Assessment in Bayi District, China
by
Jiayao Li, Yongji Wang, Lili Wu, Jingjing Li, Hongmei Du and Jiaying Miao
Remote Sens. 2026, 18(17), 2891; https://doi.org/10.3390/rs18172891 - 26 Aug 2026
Abstract
Landslide susceptibility mapping (LSM) based on ensemble learning is commonly evaluated using deterministic metrics, whereas prediction reliability and resampling-based prediction uncertainty remain insufficiently explored. This study assessed whether a heterogeneous Stacking ensemble model was associated with higher predictive performance and greater spatial stability
[...] Read more.
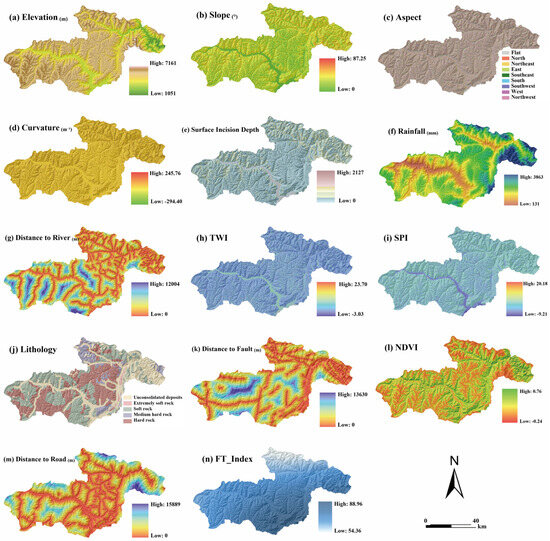
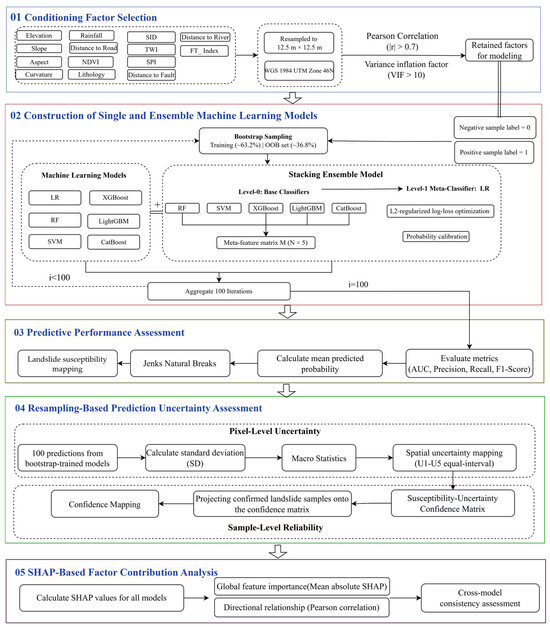
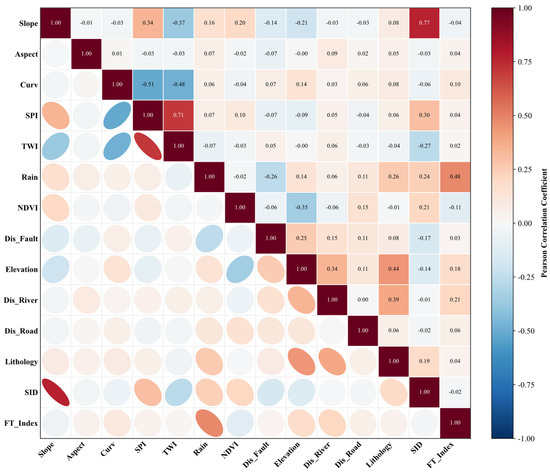
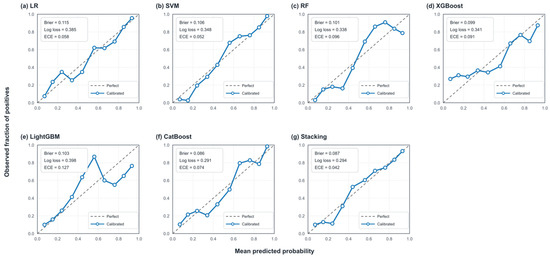
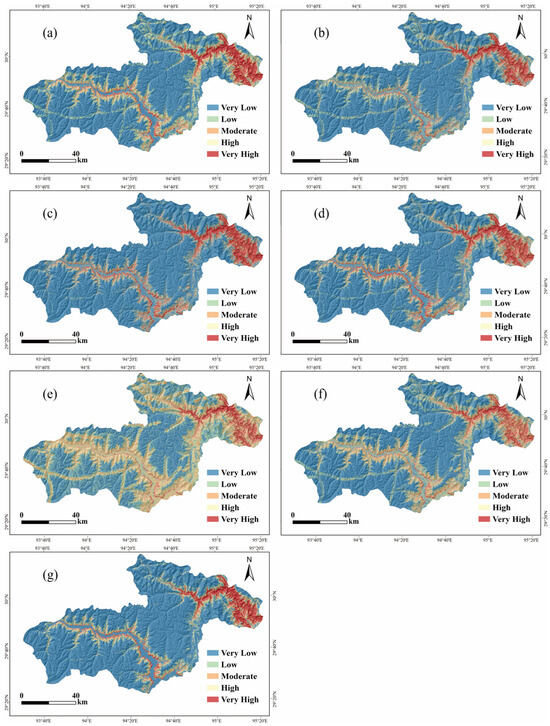
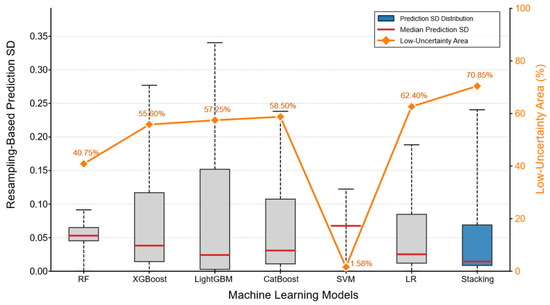
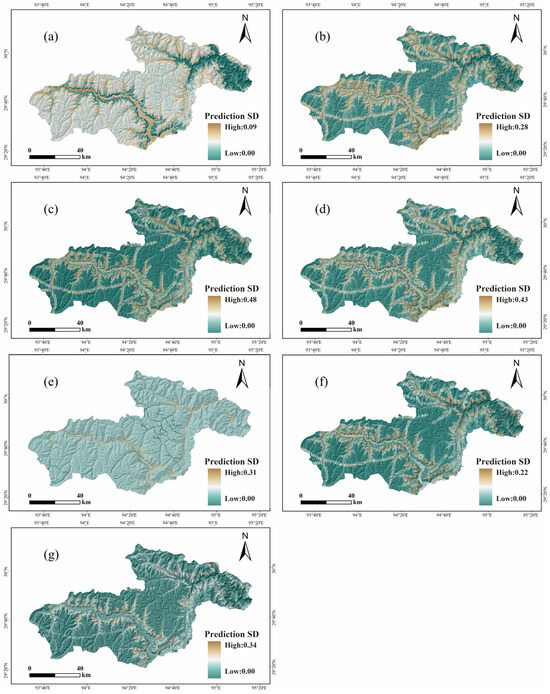
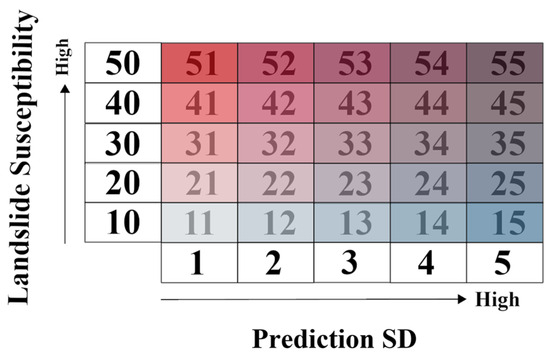
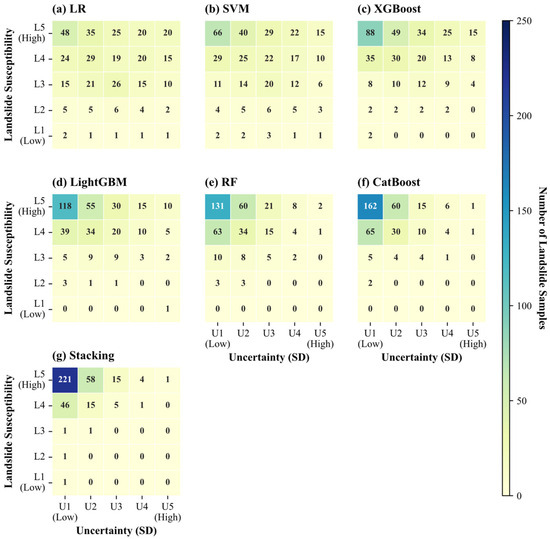
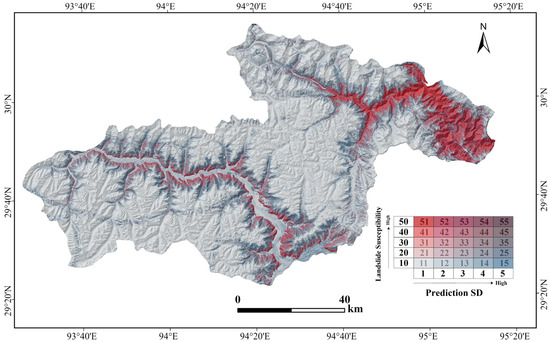
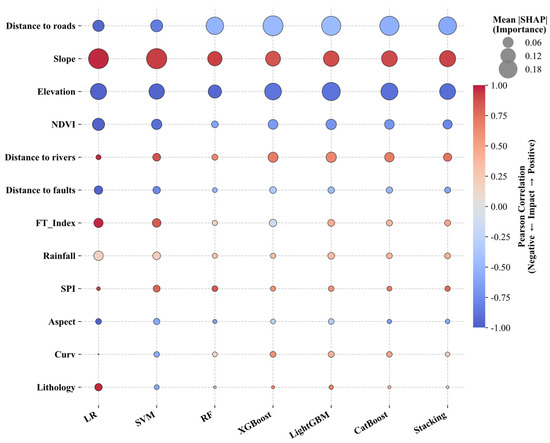
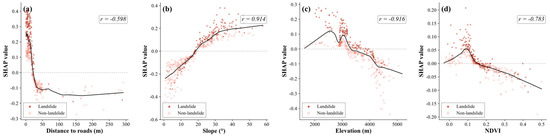
Landslide susceptibility mapping (LSM) based on ensemble learning is commonly evaluated using deterministic metrics, whereas prediction reliability and resampling-based prediction uncertainty remain insufficiently explored. This study assessed whether a heterogeneous Stacking ensemble model was associated with higher predictive performance and greater spatial stability of susceptibility predictions in Bayi District, Tibet. Six machine-learning models and a two-layer Stacking model were trained using 12 conditioning factors and evaluated through 100 bootstrap iterations with out-of-bag (OOB) validation and leave-one-township-out cross-validation (LOTO-CV). The Stacking model yielded the highest observed predictive performance (OOB AUC = 0.978; LOTO-CV AUC = 0.9216) and was associated with lower uncertainty, with 70.85% of the study area classified as low-uncertainty (SD < 0.05). Among the 370 confirmed landslides, approximately 60% were located in areas characterized by high susceptibility and low uncertainty. SHAP analysis consistently identified distance to roads, slope, and elevation as dominant conditioning factors across models. The results suggest that predictive accuracy and stability should be jointly considered in ensemble-based LSM, because higher predictive performance was not always associated with lower prediction uncertainty.
Full article
(This article belongs to the Special Issue Remote Sensing for Landslide Investigations: Mapping, Monitoring and Forecasting)
►▼
Show Figures

Figure 1
Open AccessArticle
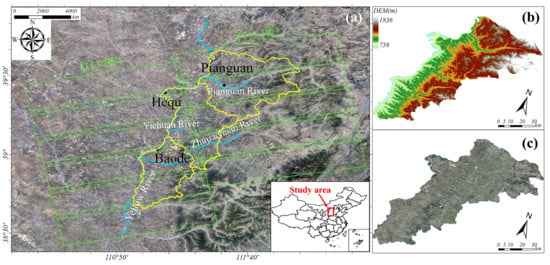
Automatic Identification and Assessment of Potential Geohazards in a Wide Area Based on Multisource Remote Sensing and Deep Learning
by
Siao Lv, Yuedong Wang and Yuebin Wang
Remote Sens. 2026, 18(17), 2890; https://doi.org/10.3390/rs18172890 - 26 Aug 2026
Abstract
Wide-area monitoring and accurate assessment of potential geohazards (PGHs) based on remote sensing will provide a crucial foundation for geohazard prevention and mitigation. Current remote sensing methods for PGH identification and evaluation require extensive manual effort and lack intelligence throughout the process. To
[...] Read more.
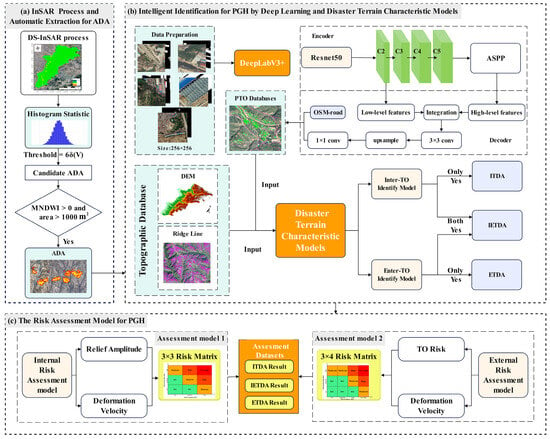
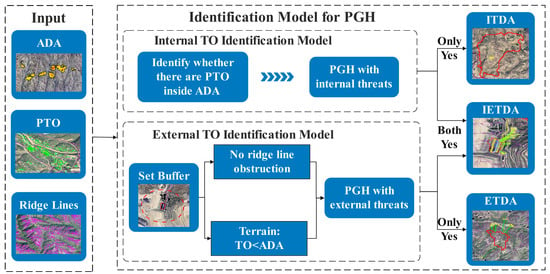
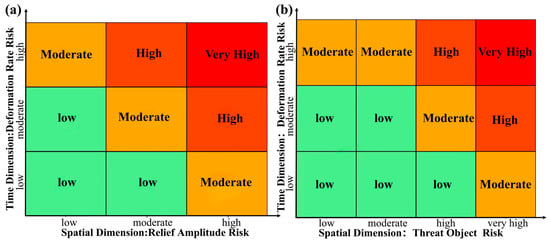
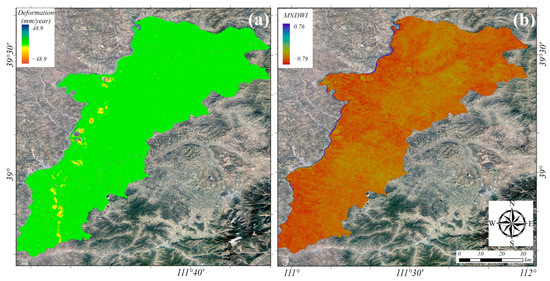
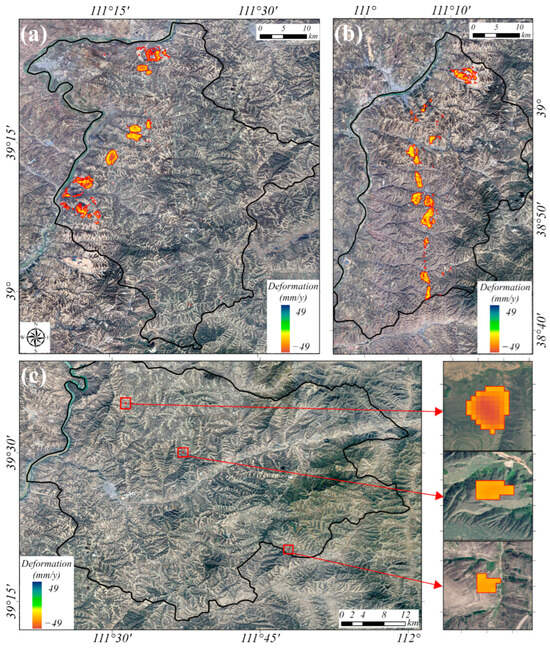
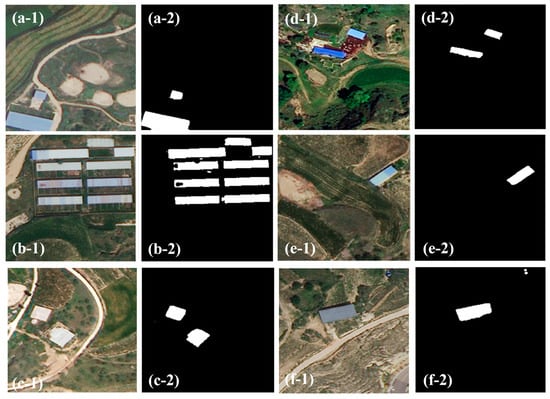
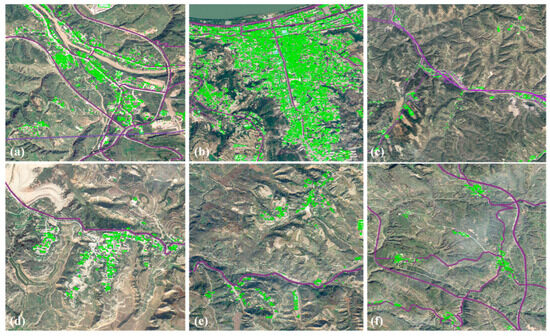
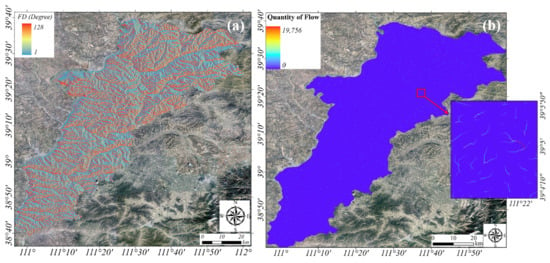
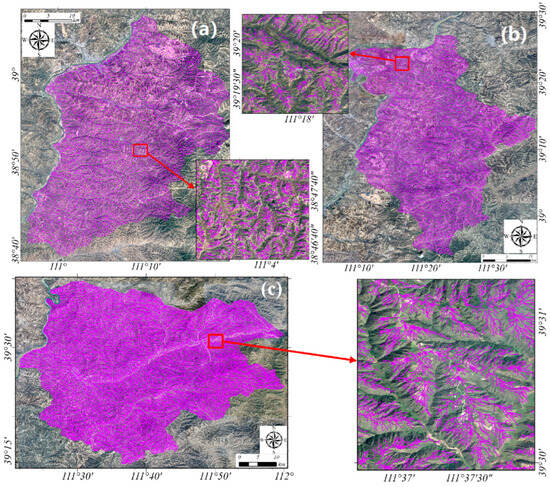
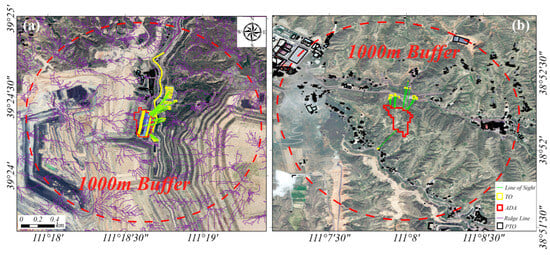
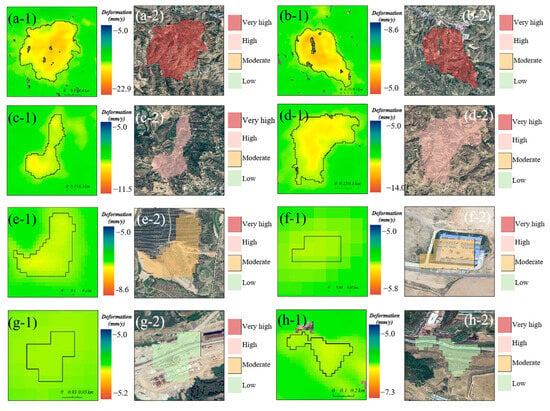
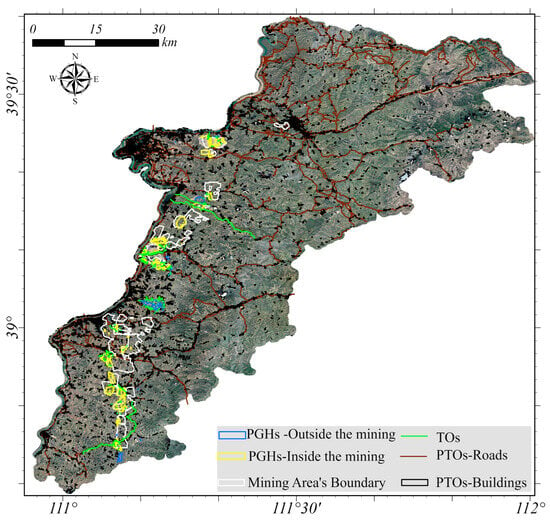
Wide-area monitoring and accurate assessment of potential geohazards (PGHs) based on remote sensing will provide a crucial foundation for geohazard prevention and mitigation. Current remote sensing methods for PGH identification and evaluation require extensive manual effort and lack intelligence throughout the process. To effectively integrate multisource remote sensing data, we propose an automated method for identifying and assessing PGHs across a wide area. This approach integrates InSAR deformation, high-resolution optical remote sensing, terrain, and vector data of ground features to enable automated delineation of unstable zones, automatic identification of potentially threatened objects (PTOs), automatic screening of PGHs, and risk assessment. The proposed method is tested in the Hequ–Baode–Pianguan (HBP) region of Shanxi province. Using the DS-InSAR technique, we process 94 Sentinel-1 SAR images covering the HBP region from 2020 to 2024 to estimate surface stability. We automatically detect the boundaries of 161 active deformation areas (ADAs) in HBP. A deep learning model based on DeepLabV3+ processes optical remote sensing images of the study area at 0.5 m resolution to automatically identify all PTOs. By integrating terrain data and spatial relationships among PTOs and ADAs, we develop an algorithmic model to identify 90 PGHs and classify them into external-threat, internal-threat, and internal-external-threat geohazard zones. Finally, a risk matrix is created for an automatic geohazard risk assessment, producing results for all PGHs in the study area. This developed method will support wide-area screening and prioritization of potential geohazards on the Loess Plateau and improve PGH investigation capabilities.
Full article
(This article belongs to the Special Issue Advances in Surface Deformation Monitoring Using SAR Interferometry (Second Edition))
►▼
Show Figures

Figure 1
Journal Menu
► ▼ Journal Menu-
- Remote Sensing Home
- Aims & Scope
- Editorial Board
- Reviewer Board
- Topical Advisory Panel
- Early Career Editorial Board
- Photography Exhibition
- Instructions for Authors
- Special Issues
- Topics
- Sections & Collections
- Article Processing Charge
- Indexing & Archiving
- Editor’s Choice Articles
- Most Cited & Viewed
- Journal Statistics
- Journal History
- Journal Awards
- Society Collaborations
- Conferences
- Editorial Office
Journal Browser
► ▼ Journal BrowserHighly Accessed Articles
Latest Books
E-Mail Alert
News
26 August 2026
Topics Webinar | GeoAI-Earth Intelligence from Space: A Physics-Aware AI Framework for Satellite Remote Sensing, 31 August 2026
25 August 2026
Summary of the 3rd International Conference on AI Sensors and Transducers (AIS 2026) Held on 2–7 August 2026
Topics
Topic in
Applied Sciences, Drones, Geomatics, Heritage, IJGI, Remote Sensing, Sensors
3D Documentation of Natural and Cultural Heritage
Topic Editors: Lorenzo Teppati Losè, Elisabetta Colucci, Arnadi MurtiyosoDeadline: 31 August 2026
Topic in
Applied Sciences, Geomatics, IJGI, Remote Sensing, Smart Cities
The Geography of Digital Twin: Concepts, Architectures, Modeling, AI and Applications
Topic Editors: Chaowei Yang, Daniel Q. Duffy, Xiao Huang, Lingbo LiuDeadline: 20 September 2026
Topic in
AI, Applied Sciences, Designs, Electronics, Mathematics, Remote Sensing, Sensors
The Future of Artificial Intelligence: Trends, Challenges, and Developments
Topic Editors: Yinbin Miao, Jun Feng, Wenqian DongDeadline: 30 September 2026
Topic in
Applied Sciences, Remote Sensing, Technologies, Buildings, Sustainability
Recent Advances in Sustainability Practice of Civil and Environmental Engineering in Regions with Challenging Geological and Climatic Conditions
Topic Editors: Xin Huang, Qinghua Lei, Tao Zhao, Liangfu XieDeadline: 25 October 2026
Conferences
Special Issues
Special Issue in
Remote Sensing
Advances in Remote Sensing of the Inland and Coastal Water Zones (3rd Edition)
Guest Editors: Jacek Lubczonek, Paweł Terefenko, Katarzyna Bradtke, Marta Wlodarczyk-SielickaDeadline: 30 August 2026
Special Issue in
Remote Sensing
Microwave Remote Sensing for Object Detection (2nd Edition)
Guest Editor: Guangcai SunDeadline: 30 August 2026
Special Issue in
Remote Sensing
Advanced Remote Sensing Technology for Precision Forestry and Carbon Sink Assessment
Guest Editors: Jincheng Liu, Jia Wang, Tao Liu, Weiheng Xu, Zhichao WangDeadline: 30 August 2026
Special Issue in
Remote Sensing
Monitoring of Volcanoes and Earthquakes with SAR and Satellite
Guest Editors: Alfredo Falconieri, Valeria SatrianoDeadline: 30 August 2026
Topical Collections
Topical Collection in
Remote Sensing
Sentinel-2: Science and Applications
Collection Editors: Clement Atzberger, Jadu Dash, Olivier Hagolle, Jochem Verrelst, Quinten Vanhellemont, Jordi Inglada, Tuomas Häme
Topical Collection in
Remote Sensing
Feature Papers for Section Environmental Remote Sensing
Collection Editor: Magaly Koch
Topical Collection in
Remote Sensing
Feature Paper Special Issue on Forest Remote Sensing
Collection Editors: Zengyuan Li, Erxue Chen, Lin Cao
Topical Collection in
Remote Sensing
The VIIRS Collection: Calibration, Validation, and Application
Collection Editors: Xi Shao, Xiaoxiong Xiong, Changyong Cao