


Climate 2026, 14(6), 116; https://doi.org/10.3390/cli14060116 (registering DOI) - 30 May 2026
Abstract
Building on the regional model evaluation presented in Part I, this study investigates the processes controlling air pollutant formation and transport over West Asia, with a focus on the United Arab Emirates (UAE). Two representative months, January 2022 and June 2021, are selected
[...] Read more.
Building on the regional model evaluation presented in Part I, this study investigates the processes controlling air pollutant formation and transport over West Asia, with a focus on the United Arab Emirates (UAE). Two representative months, January 2022 and June 2021, are selected for detailed analysis using Chemical Process Analysis (CPA) and Integrated Process Rate (IPR) diagnostics. The results indicate predominantly VOC-limited ozone (O3) formation across urban and coastal regions, with seasonal and spatial transitions toward NOx-limited regimes, particularly in rural and downwind areas. IPR diagnostics show that local chemistry and vertical transport are the dominant contributors to O3 variability, whereas fine particulate matter with a diameter of 2.5 µm or less (PM2.5) variability is primarily driven by vertical transport and emissions. Horizontal transport and land–sea circulation play an important role in shaping the spatial distribution of both pollutants, especially along coastal zones. Comparisons among urban, coastal, and rural sites further highlight the influence of topography, land use, and meteorological conditions on pollutant dynamics. These process-based insights provide a scientific basis for refining emission control strategies, improving regional air quality management, and supporting evidence-based policies to mitigate air pollution impacts on human health and the environment in West Asia.
Full article
(This article belongs to the Special Issue Multi-Physics and Chemistry of Urban Climate Modelling)
►
Show Figures
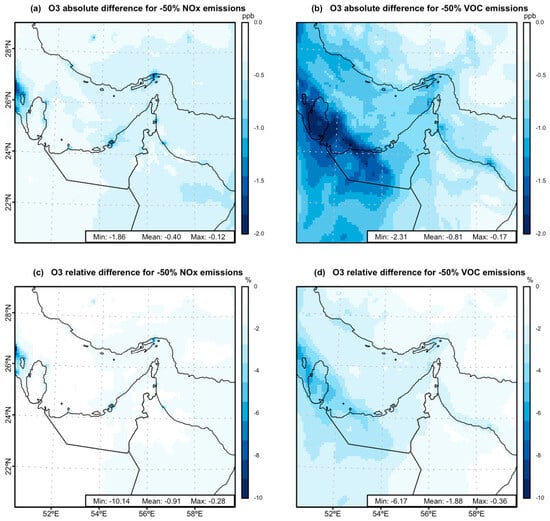
Figure 1


