


Highlights
What are the main findings?
- DRAFNet improves both overall accuracy and spatial coherence by treating multi-product land-cover fusion as a pixel- and class-specific reliability decision problem, outperforming the individual source products and benchmark methods.
- The fused maps provide clearer delineation of cropland, forestland, and grassland in areas of pronounced product disagreement. In a supplementary country-level comparison, DRAFNet also showed lower mean and median absolute log-ratio deviations from FAO area statistics than the source products.
What are the implications of the main findings?
- Explicitly modeling product disagreement and spatially varying reliability provides an effective strategy for retaining reliable consensus while correcting unreliable or jointly incorrect source-product decisions in heterogeneous arid and semi-arid landscapes.
- More coherent key-class maps can strengthen transboundary land-resource assessment and ecological management across the five Central Asian countries.
Abstract
Reliable cropland, forestland, and grassland maps support resource assessment and ecological management in arid and semi-arid Central Asia. Existing land-cover products often delineate these classes differently, vary in reliability across classes and locations, and may share the same errors even when they agree. This study formulates multi-product fusion as a pixel- and class-specific reliability decision problem. To address this problem, we propose a reliability-adaptive fusion framework, the Discrepancy-Aware Reliability-Adaptive Fusion Network (DRAFNet), using 2020 maps from three global 30 m land-cover products—FROM-GLC Plus, GLC-FCS30D, and GlobeLand30—and variables representing aridity, temperature, precipitation, elevation, and slope. Unlike fixed-weight fusion methods and segmentation models that use the source products only as input channels, DRAFNet retains the categorical source decisions and adjusts each contribution according to its estimated reliability for the assigned class and location. Weight removed from an unreliable source is transferred to a residual expert, which provides an alternative prediction when the source products are unreliable or share the same error. Voting entropy and geo-environmental variables provide contextual information for this decision. On independent test samples from the five Central Asian countries, DRAFNet achieved an overall accuracy (OA) of 0.8275, a Kappa coefficient of 0.7698, a mean intersection over union (mIoU) of 0.7046, and a macro-averaged F1 score (Macro F1) of 0.8241. These values were 0.95–1.38 percentage points higher than those of U-Net++, the strongest benchmark. Local comparisons indicated more coherent spatial patterns and clearer boundaries in areas of pronounced disagreement. The mean and median absolute log-ratio deviations from area statistics reported by the Food and Agriculture Organization of the United Nations (FAO) were 0.618 and 0.450, respectively, both lower than those of the source products. These results support land-resource assessment and ecological management in Central Asia.
1. Introduction
Central Asia lies in the interior of the Eurasian continent and is one of the world’s representative arid and semi-arid regions. Limited water availability and ecological vulnerability make the balance between land use and ecological conservation particularly delicate across the region [1,2,3]. Although cropland, forestland, and grassland differ in areal extent and spatial configuration, they underpin oasis agriculture, mountain ecological barriers, and pastoral production, respectively, and are therefore central to understanding patterns of resource use and ecological security in Central Asia [4,5,6]. Accurate characterization of their spatial extent and distribution patterns is essential for cropland-resource accounting, forest-cover monitoring, and grassland-resource assessment, and provides a fundamental basis for land-resource assessment and ecological management in the region [7,8,9]. These regional concerns are further reflected in recent studies showing pronounced vegetation sensitivity to soil-moisture stress across Central Asia and substantial shrub-encroachment-related changes in alpine grassland ecosystem services [10,11].
Existing land-cover products provide important sources of spatial information on land classes, but their delineations of the same class are not fully consistent [12,13]. Differences in input data, classification schemes, sample provenance, and mapping strategies result in discrepancies among products in their representation of the extent and boundaries of cropland, forestland, and grassland across Central Asia [14,15]. These discrepancies not only reduce the accuracy of spatial representations of key land classes but also propagate into resource-quantity estimates, interpretations of land-cover patterns, and assessments of ecological functions, thereby undermining the reliability of regional land-resource assessments.
To address the unstable identification of key land classes by individual products in complex landscapes, recent studies have sought to exploit the discrepancies and complementary information among multiple products [16,17]. Individual products have distinct strengths in class identification, spatial detail, and regional applicability [18]. Jointly considering the consistency of their class assignments and their local reliability can reduce the influence of product-specific biases and produce more plausible spatial extents and boundaries for key land classes [19].
Nevertheless, existing approaches remain limited in their ability to handle discrepancies among source products. Traditional voting-, rule-, and region-based weighting methods are straightforward to implement, readily interpretable, and relatively insensitive to the availability of training samples. However, they generally assume that the contributions of source products remain relatively fixed and therefore cannot adequately capture product-specific performance variations across land classes and locations [20,21,22]. Some machine learning methods can incorporate auxiliary variables and model nonlinear relationships, but they are less effective at representing pixel-level variations in inter-product discrepancies and preserving spatial continuity [23,24]. Although general-purpose deep learning methods can extract complex features, most have been developed for individual remote-sensing image classification or conventional semantic segmentation. Decision-level fusion of multiple land-cover products remains comparatively underexplored [25,26,27]. Related research using historical land-cover products as prior supervision has also shown that product-derived labels can contain scale-response and model-cognitive noise, indicating that prior map information should not be regarded as uniformly reliable [28]. Thus, a remaining challenge is to determine when a categorical source decision should be retained and when it should be corrected, including cases in which all source products agree on the same incorrect class.
Accordingly, this study addresses the inconsistent delineation of cropland, forestland, and grassland by existing land-cover products across the heterogeneous arid and semi-arid landscapes of the five Central Asian countries. These inconsistencies limit the construction of spatially coherent information required for cropland-resource accounting, forest-cover monitoring, and grassland-resource assessment across the region. We formulate multi-source land-cover product fusion as a spatially varying reliability decision problem: source products may differ in reliability across land classes and locations, and their consensus may still be incorrect. To address this problem, we develop a Discrepancy-Aware Reliability-Adaptive Fusion Network (DRAFNet). DRAFNet integrates three 30 m land-cover products—FROM-GLC Plus, GLC-FCS30D, and GlobeLand30—with geo-environmental variables representing aridity, temperature, precipitation, elevation, and slope. It explicitly models inter-product disagreement, estimates source-product reliability, and provides residual correction for predictions with low estimated reliability.
The main contribution of DRAFNet is a reliability-adaptive decision framework for fusing categorical land-cover products. Instead of assigning a fixed weight to an entire product or learning a direct prediction from stacked product maps, DRAFNet evaluates the class decision made by each source product at each pixel and determines how much that decision should contribute to the final result. Specifically, (1) multi-source class priors and voting entropy describe product agreement and disagreement, while dual-stream feature fusion relates these patterns to regional moisture, thermal, and topographic conditions; (2) the Reliability head is supervised according to whether the class assigned by each source product matches the reference label, allowing the estimated reliability to vary by source product, location, and assigned class; and (3) RADF uses these reliability estimates to retain reliable source decisions and transfers the attenuated portion of an unreliable source product’s routing weight to the residual expert. This transfer preserves the total routing weight and provides an alternative class prediction when the source products are unreliable or share the same error. The framework is evaluated across the five Central Asian countries using independent test samples, ablation experiments, local spatial comparisons, country-level accuracy, a supplementary comparison with FAO area statistics, and an assessment of computational efficiency.
2. Materials and Methods
2.1. Study Area and Data Sources
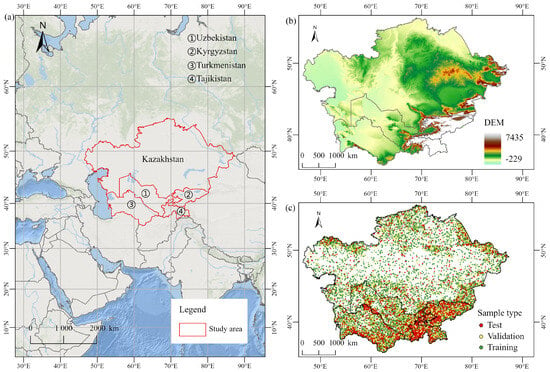
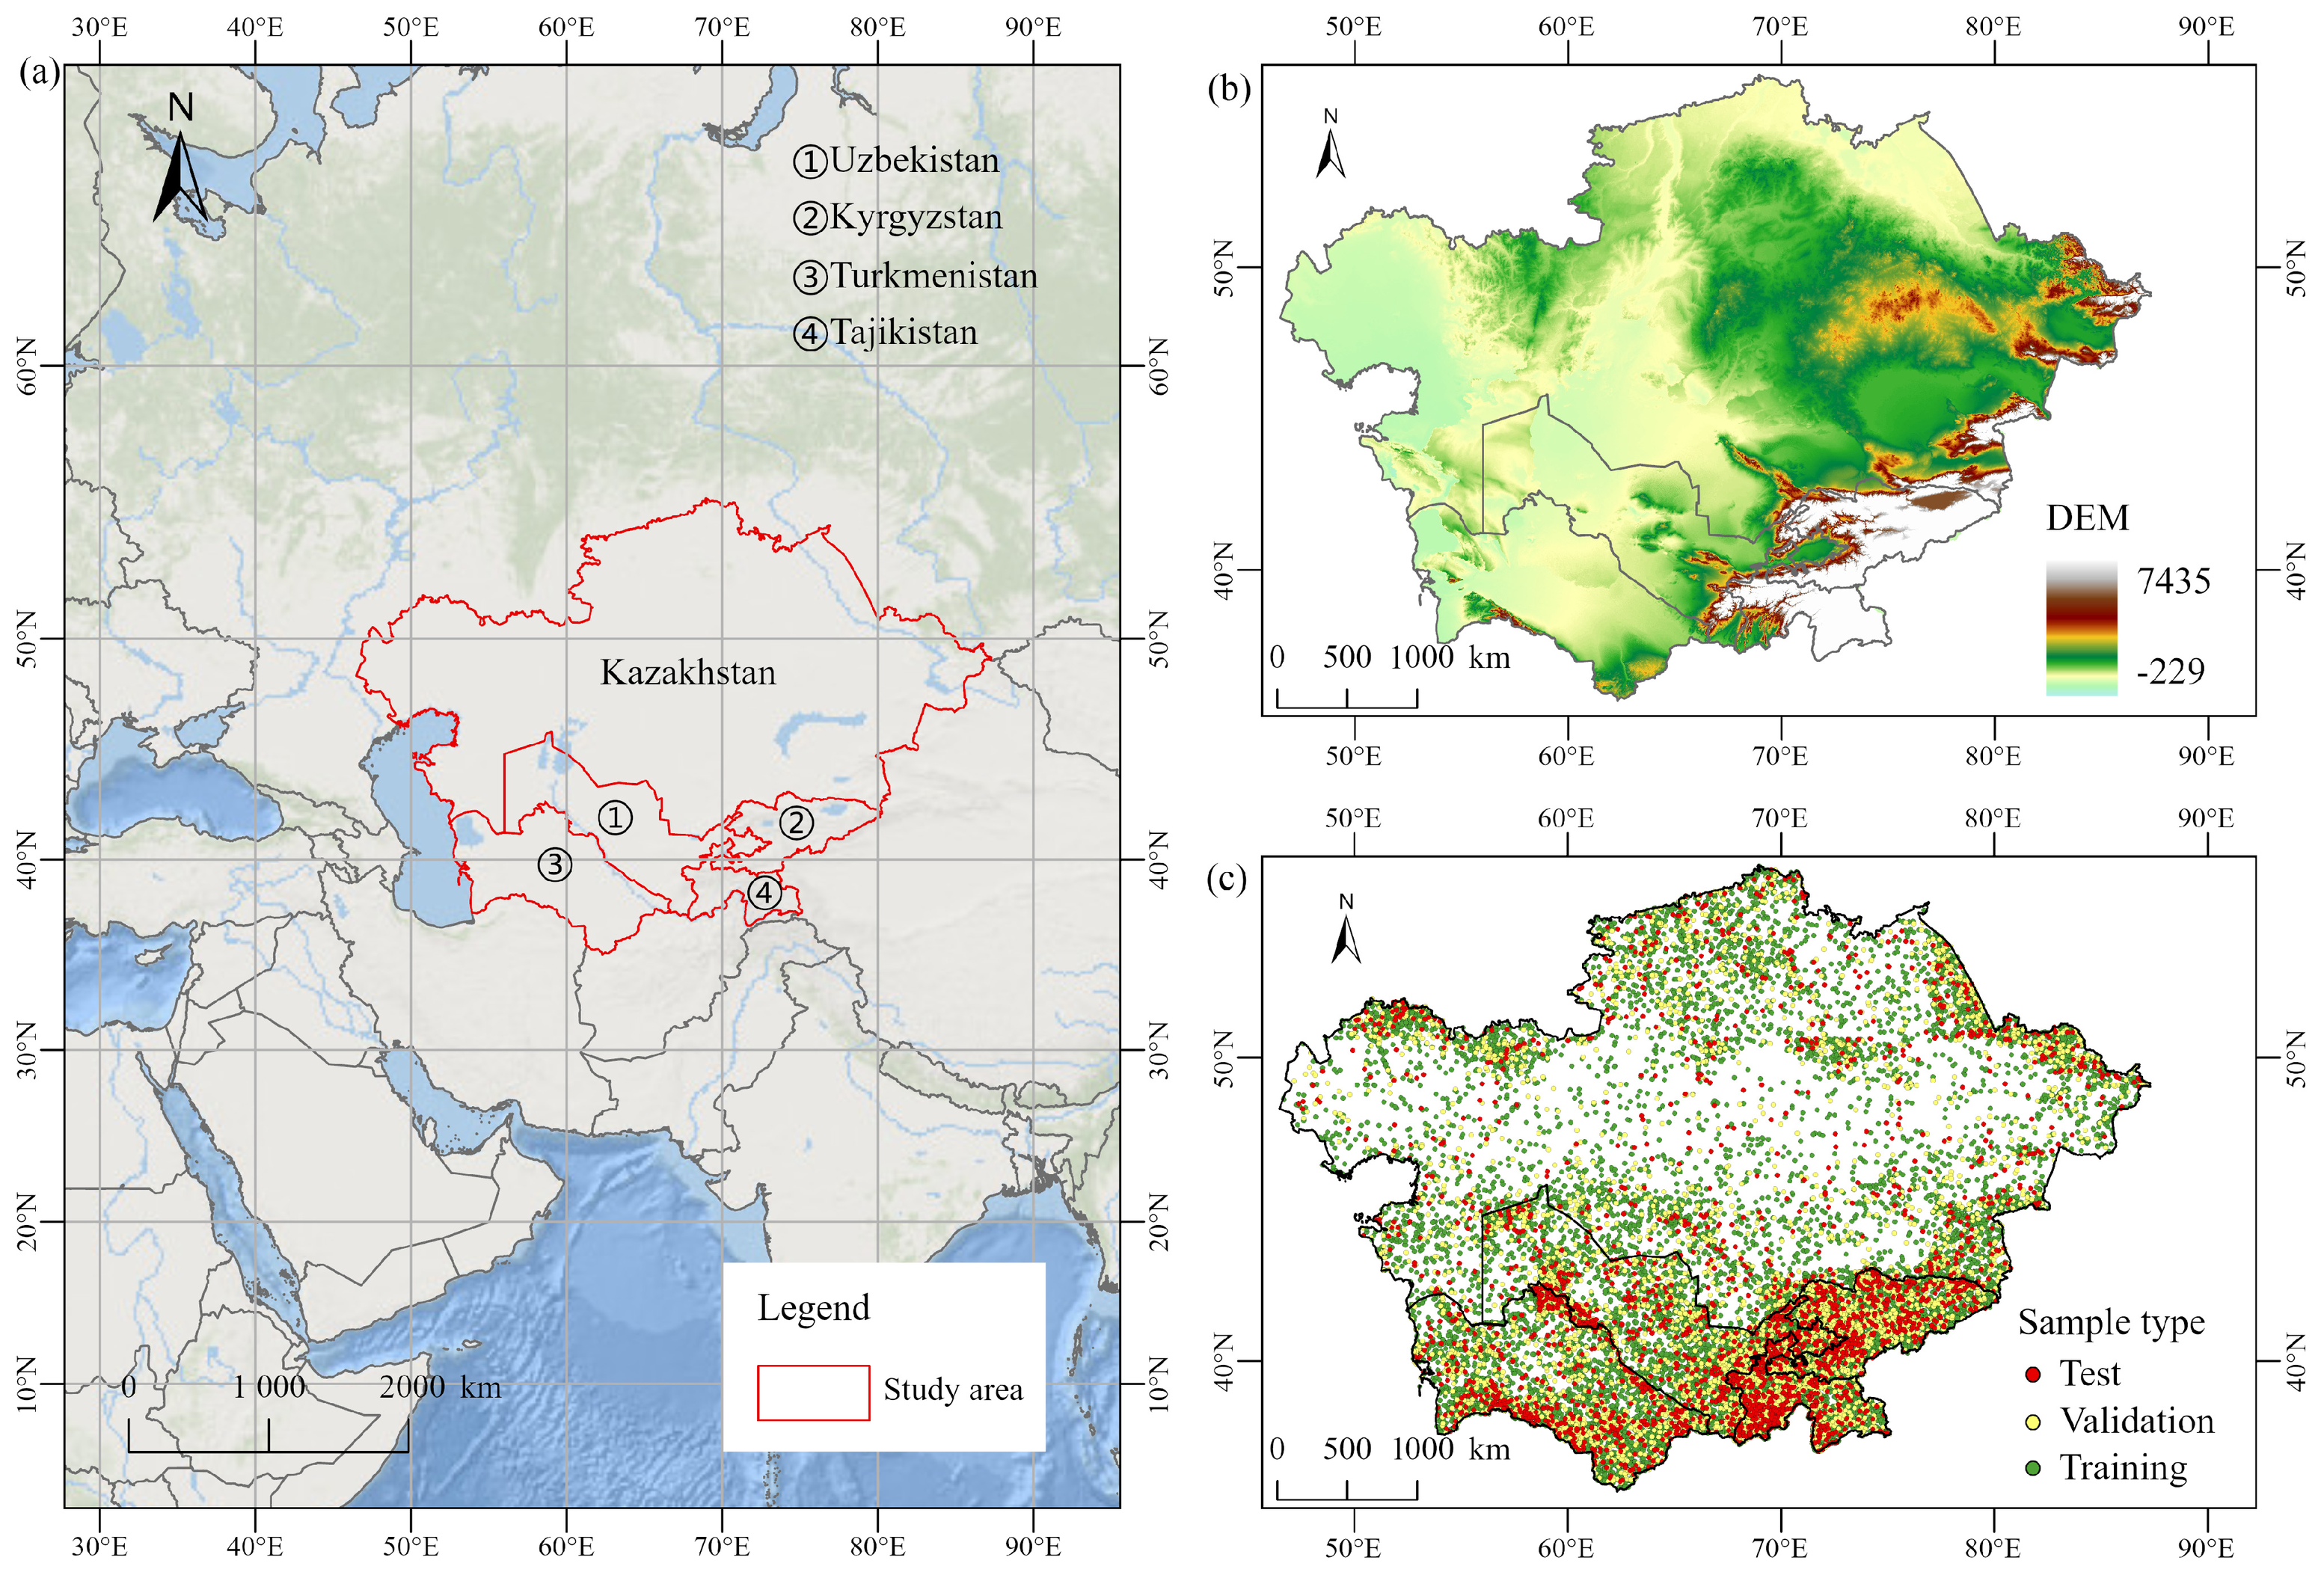
The study area comprises Kazakhstan, Kyrgyzstan, Tajikistan, Turkmenistan, and Uzbekistan (Figure 1). Central Asia is dominated by arid and semi-arid landscapes, with deserts, semi-deserts, and steppes forming the prevailing land-cover matrix. Cropland occurs mainly in oases, river valleys, and irrigated plains, whereas forestland is concentrated in mountainous and adjacent areas [29,30,31]. Relief is generally low across the western and central parts of the region but rises markedly toward the southeastern mountain systems [32]. These pronounced moisture, thermal, and topographic gradients create heterogeneous settings for mapping oasis cropland, mountain forestland, and extensive grassland and for assessing consistency among land-cover products.
Figure 1.
Overview of the study area and sample distribution: (a) location of the study area; (b) elevation distribution; and (c) spatial distribution of the filtered reference samples used for training, validation, and testing.
Three global 30 m land-cover products were used as source products: FROM-GLC Plus [33], GLC-FCS30D [34], and GlobeLand30 [35]. Their respective 2020 land-cover maps were selected for fusion and comparison. The year 2020 was selected because it was the latest common reference year available for the three 30 m land-cover products when the dataset was constructed, allowing the source products to be harmonized within the same analysis period. The geo-environmental variables comprised the aridity index from the Global Aridity Index and Potential Evapotranspiration Database [36], mean temperature of the warmest quarter and annual precipitation from WorldClim [37], and the digital elevation model (DEM) from NASADEM [38]. Slope was derived from the DEM. Together, these variables represent the regional moisture, thermal, and topographic conditions relevant to the distributions of the three key land classes. Further details are provided in Table 1.
Table 1.
Data sources and basic information.
Reference samples were obtained by visually interpreting high-resolution Google Earth imagery. The initial sample set comprised 5000 points for each of forestland, grassland, and cropland; 4000 for bare land; 2500 for shrubland; and 500 each for built-up areas and wetlands. To reduce spatial autocorrelation, points separated by less than 1000 m were removed, and the remaining samples were divided into training, validation, and test sets at a ratio of 7:2:1. After the 1000 m spatial-autocorrelation filter and class harmonization, 24,000 samples were retained for the four-class classification task, with 6000 samples for each harmonized class. The training, validation, and test sets contained 16,800, 4800, and 2400 samples, respectively, corresponding to 4200, 1200, and 600 samples per class.
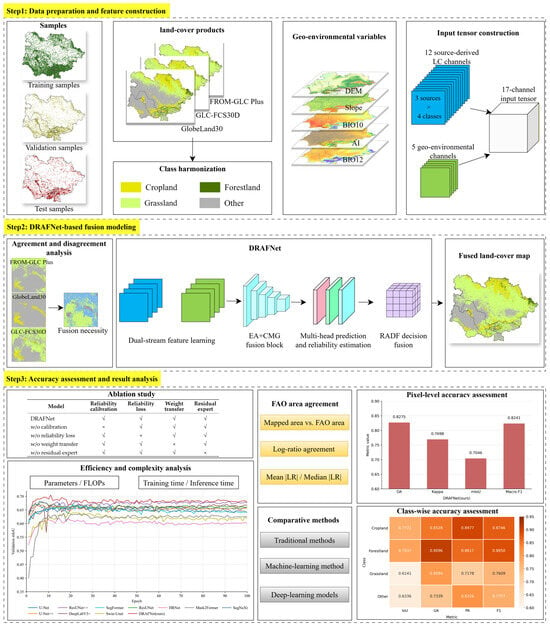
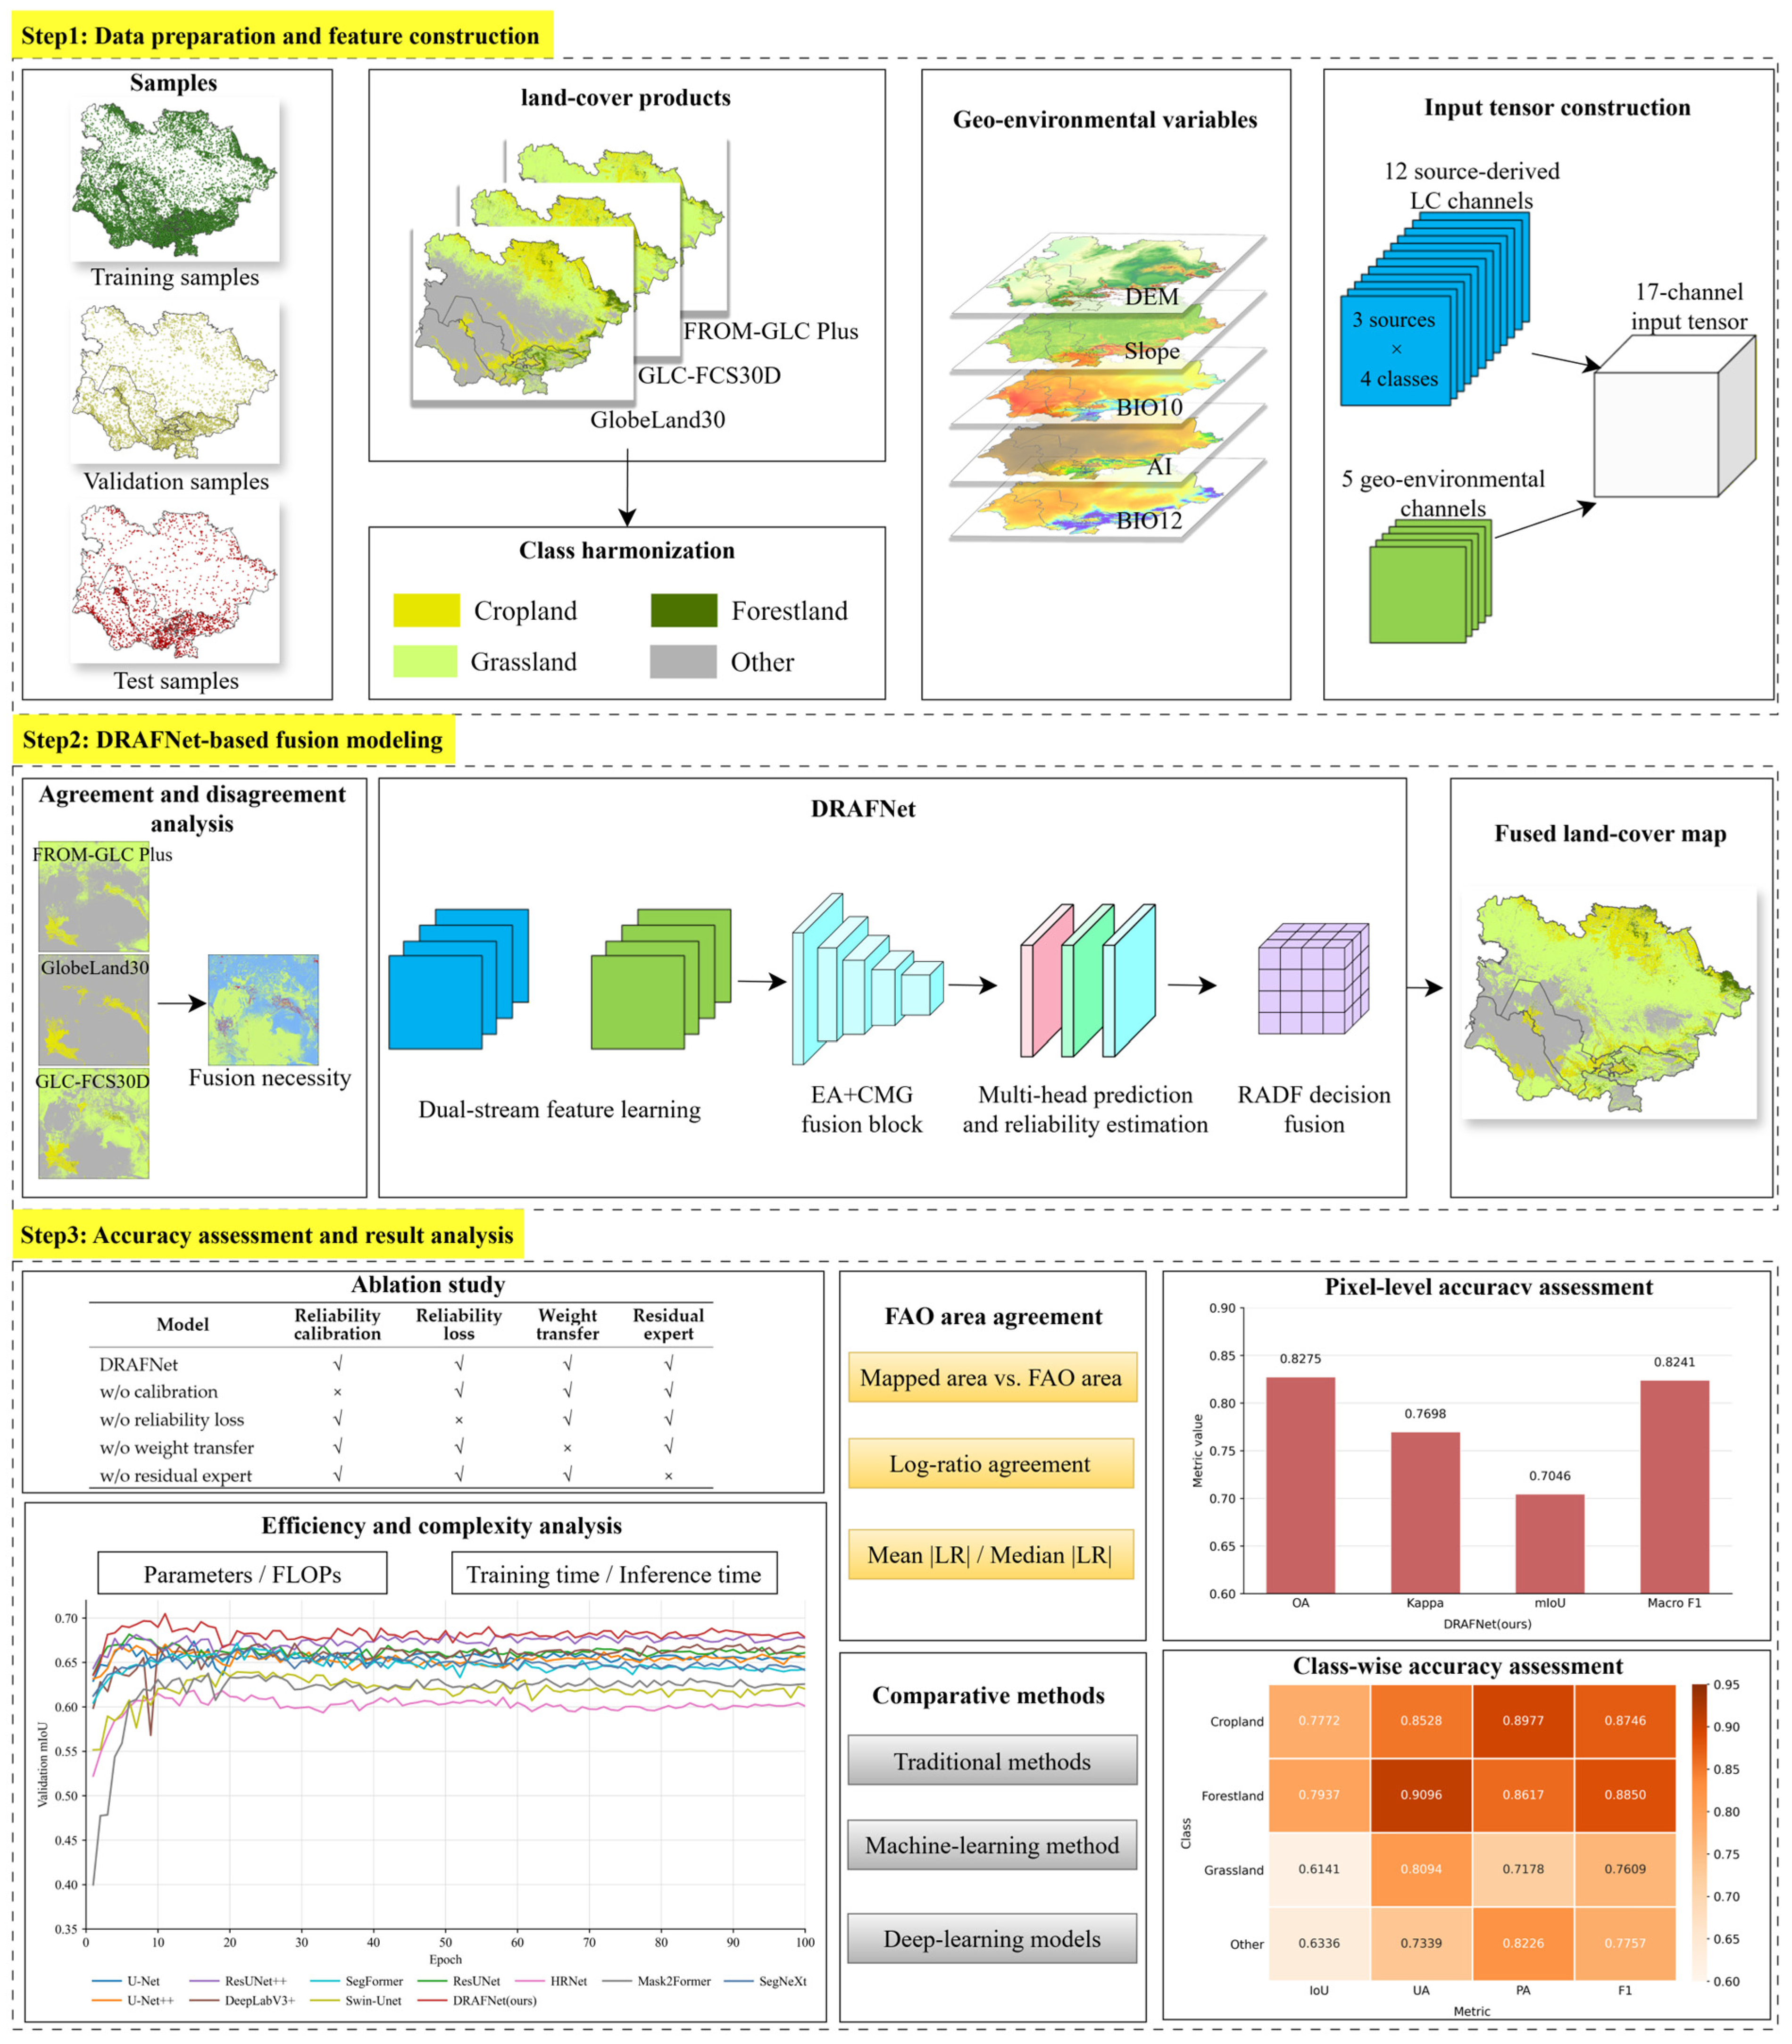
To help readers understand the dataset structure and study design, Figure 2 summarizes the source land-cover products, geo-environmental variables, reference samples, preprocessing steps, DRAFNet-based fusion, and evaluation. The workflow comprised data preprocessing and input construction, DRAFNet-based fusion, evaluation of pixel- and class-level accuracy, ablation performance, country-level accuracy and area agreement, and computational efficiency.
Figure 2.
Workflow and dataset overview of the proposed method, including the source land-cover products, geo-environmental variables, reference samples, preprocessing, DRAFNet-based fusion, and evaluation.
2.2. Data Preprocessing and Input Construction
2.2.1. Spatial and Class Harmonization
Because DRAFNet performs pixel-level decision fusion, all land-cover products, geo-environmental variables, and reference samples were aligned to a common raster grid with the same spatial extent, resolution, and dimensions. Invalid or anomalous values in the geo-environmental variables were removed or replaced, and the variables were normalized before model training.
Differences among the original product legends were reconciled by harmonizing all classes into cropland, forestland, grassland, and other. The target classes in GlobeLand30 and FROM-GLC Plus were mapped directly to their corresponding harmonized classes. For GLC-FCS30D, rainfed, irrigated, and related cropland subclasses were grouped as cropland; broadleaved, needle-leaved, and mixed forest subclasses as forestland; and the original grassland class as grassland. All remaining classes, including shrubland, sparse vegetation, wetlands, water bodies, bare land, impervious surfaces, and snow and ice, were grouped as other. Classes absent from the study area were excluded from the statistical analysis.
2.2.2. Input Encoding and Patch Construction
Each harmonized land-cover product was converted into a four-class one-hot representation, producing 12 land-cover channels across the three products. Five additional channels—the aridity index, mean temperature of the warmest quarter, annual precipitation, DEM, and slope—provided the geo-environmental information, resulting in a 17-channel input feature set that combined categorical source-product decisions with continuous environmental context.
The product encodings were organized in two forms for different model operations. They were concatenated into a 12 × H × W land-cover product tensor (LC tensor) for product-stream feature learning and reshaped, without adding information, into a 3 × 4 × H × W land-cover product class stack (LC stack) for constructing the multi-source class prior and aggregating the calibrated source-product predictions. The five geo-environmental variables formed a 5 × H × W environmental tensor (Env tensor) for environmental-stream feature learning, where H and W denote the raster dimensions.
Patch-based learning with sparse point supervision was adopted. A 256 × 256-pixel patch centered on each labeled sample provided the surrounding source-product and geo-environmental context. Only manually labeled pixels contributed to the training loss, while all other pixels within each patch were assigned an ignore value. This strategy was used because the reference data were point samples rather than dense pixel-level labels. Treating all pixels in a patch as labeled would introduce many uncertain labels and could propagate interpretation errors to unlabeled areas. Therefore, the patch was used to provide spatial context from the source products and geo-environmental variables, whereas supervision was applied only at the manually interpreted pixel. In this setting, the surrounding pixels help the model learn the local product-disagreement pattern and environmental context of the labeled pixel, while the ignore mask prevents unlabeled pixels from contributing to the loss. This design is therefore a point-supervised contextual learning strategy rather than a fully supervised dense segmentation setting.
2.3. Discrepancy-Aware Reliability-Adaptive Fusion Network
2.3.1. Overall Architecture and Disagreement Representation
Multi-product land-cover fusion differs from conventional image segmentation because each source product provides a categorical decision rather than a directly comparable confidence score. Moreover, inter-product disagreement indicates where the source decisions are uncertain but does not identify which product or class should be trusted, while agreement may still reflect errors shared by the source products. DRAFNet addresses these difficulties by explicitly representing source-product agreement and disagreement, combining the product decisions with geo-environmental context, and estimating source-product reliability before adaptive decision fusion and residual correction.
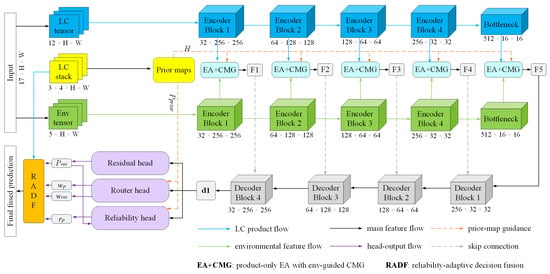
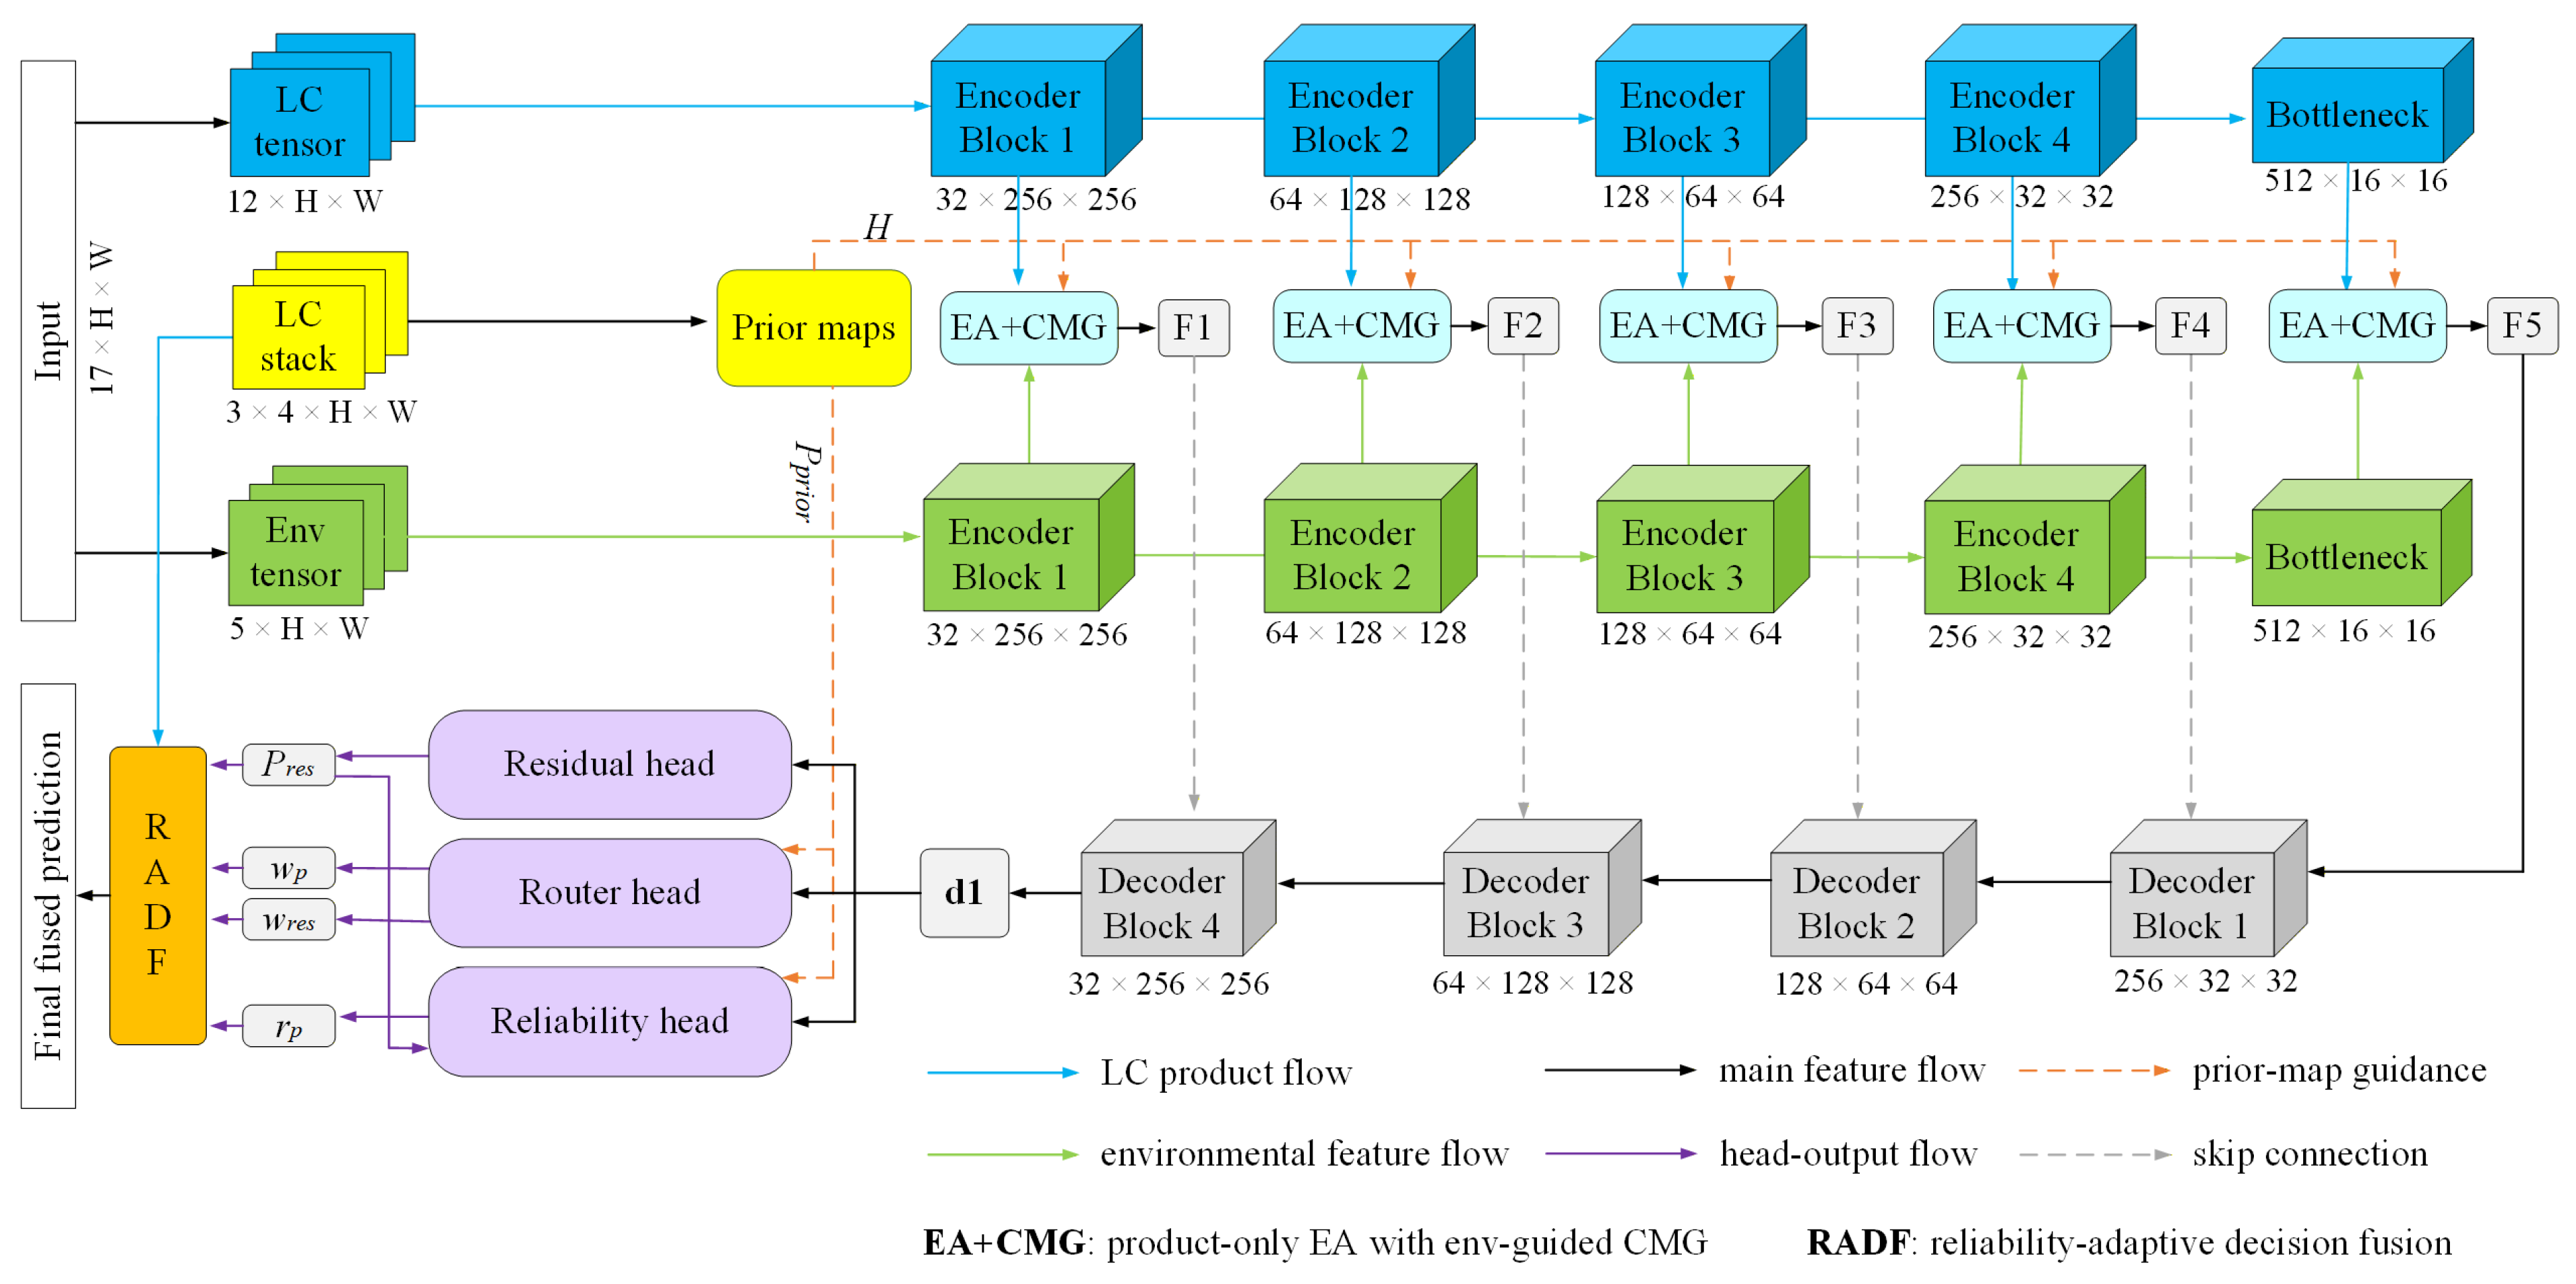
As shown in Figure 3, the land-cover product tensor (LC tensor) and geo-environmental tensor (Env tensor) are processed by the product- and environmental-stream encoders, respectively, while the land-cover product class stack (LC stack) is used to derive the multi-source class prior and voting entropy. At each encoding stage, voting entropy guides the Entropy Attention (EA) module to strengthen product-stream responses in areas of pronounced disagreement. The entropy-enhanced product features are then integrated with the environmental-stream features through the EA+CMG module and passed to the decoder through multiscale skip connections.
Figure 3.
Overall architecture of DRAFNet.
DRAFNet can be summarized in terms of its inputs, outputs, prediction heads, and decision-fusion process. It takes a 17-channel input tensor and the categorical land-cover product stack as inputs. The 17-channel tensor consists of 12 one-hot encoded land-cover channels from the three source products and five geo-environmental variables. The network outputs a four-class land-cover prediction for each pixel. The decoded features are used to estimate an alternative residual prediction, initial routing weights, and source-product reliability through the Residual, Router, and Reliability heads. RADF then combines these outputs with the source-product decisions by retaining reliable decisions and transferring attenuated unreliable contributions to the residual expert.
The high-resolution decoded features are processed by three prediction heads. The residual-expert head (Residual head) produces an alternative class-probability distribution, while the routing-weight head (Router head) assigns initial weights to the three source products and the residual expert. The reliability-estimation head (Reliability head) combines the decoded features, class prior, voting entropy, and residual-expert probabilities to estimate the class-specific reliability of each source product. The Router head consists of a 3 × 3 convolution–batch normalization–rectified linear unit (Conv–BN–ReLU) block followed by a 1 × 1 convolution and softmax activation. The Reliability head uses the same basic structure with dropout and sigmoid activation and output reliability estimates for all combinations of the three source products and four classes. The resulting weights and reliability estimates are subsequently processed by the Reliability-Adaptive Decision Fusion (RADF) module.
Because the source products provide hard class labels rather than probabilistic predictions, their votes are first converted into a common class-prior representation. Let denote the class assigned to pixel i by source product s, with S = 3 source products and C = 4 harmonized classes. The multi-source prior probability for class c is defined as
where I(⋅) equals 1 when = c and 0 otherwise. Thus, (c) expresses the proportion of source products assigning pixel i to class c, providing a common representation of their class-level consensus for subsequent routing and reliability estimation.
The class prior records how the source products distribute their votes but does not provide a single measure of disagreement intensity. DRAFNet therefore calculates normalized voting entropy as
where Hi is the voting entropy at pixel i, and ε is a small positive constant used for numerical stability. A low Hi indicates strong agreement among the source products, whereas a high value identifies pixels with pronounced class disagreement. The class prior and voting entropy therefore describe complementary aspects of the source decisions: the former represents their class-specific consensus, while the latter quantifies the strength of their disagreement.
2.3.2. Entropy-Guided Dual-Stream Feature Fusion
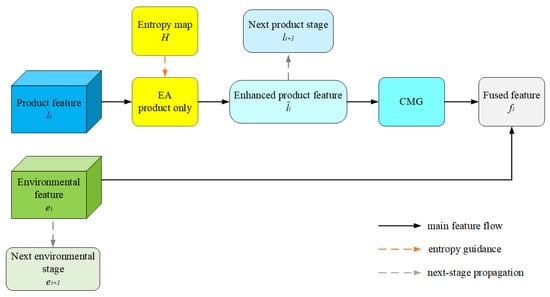
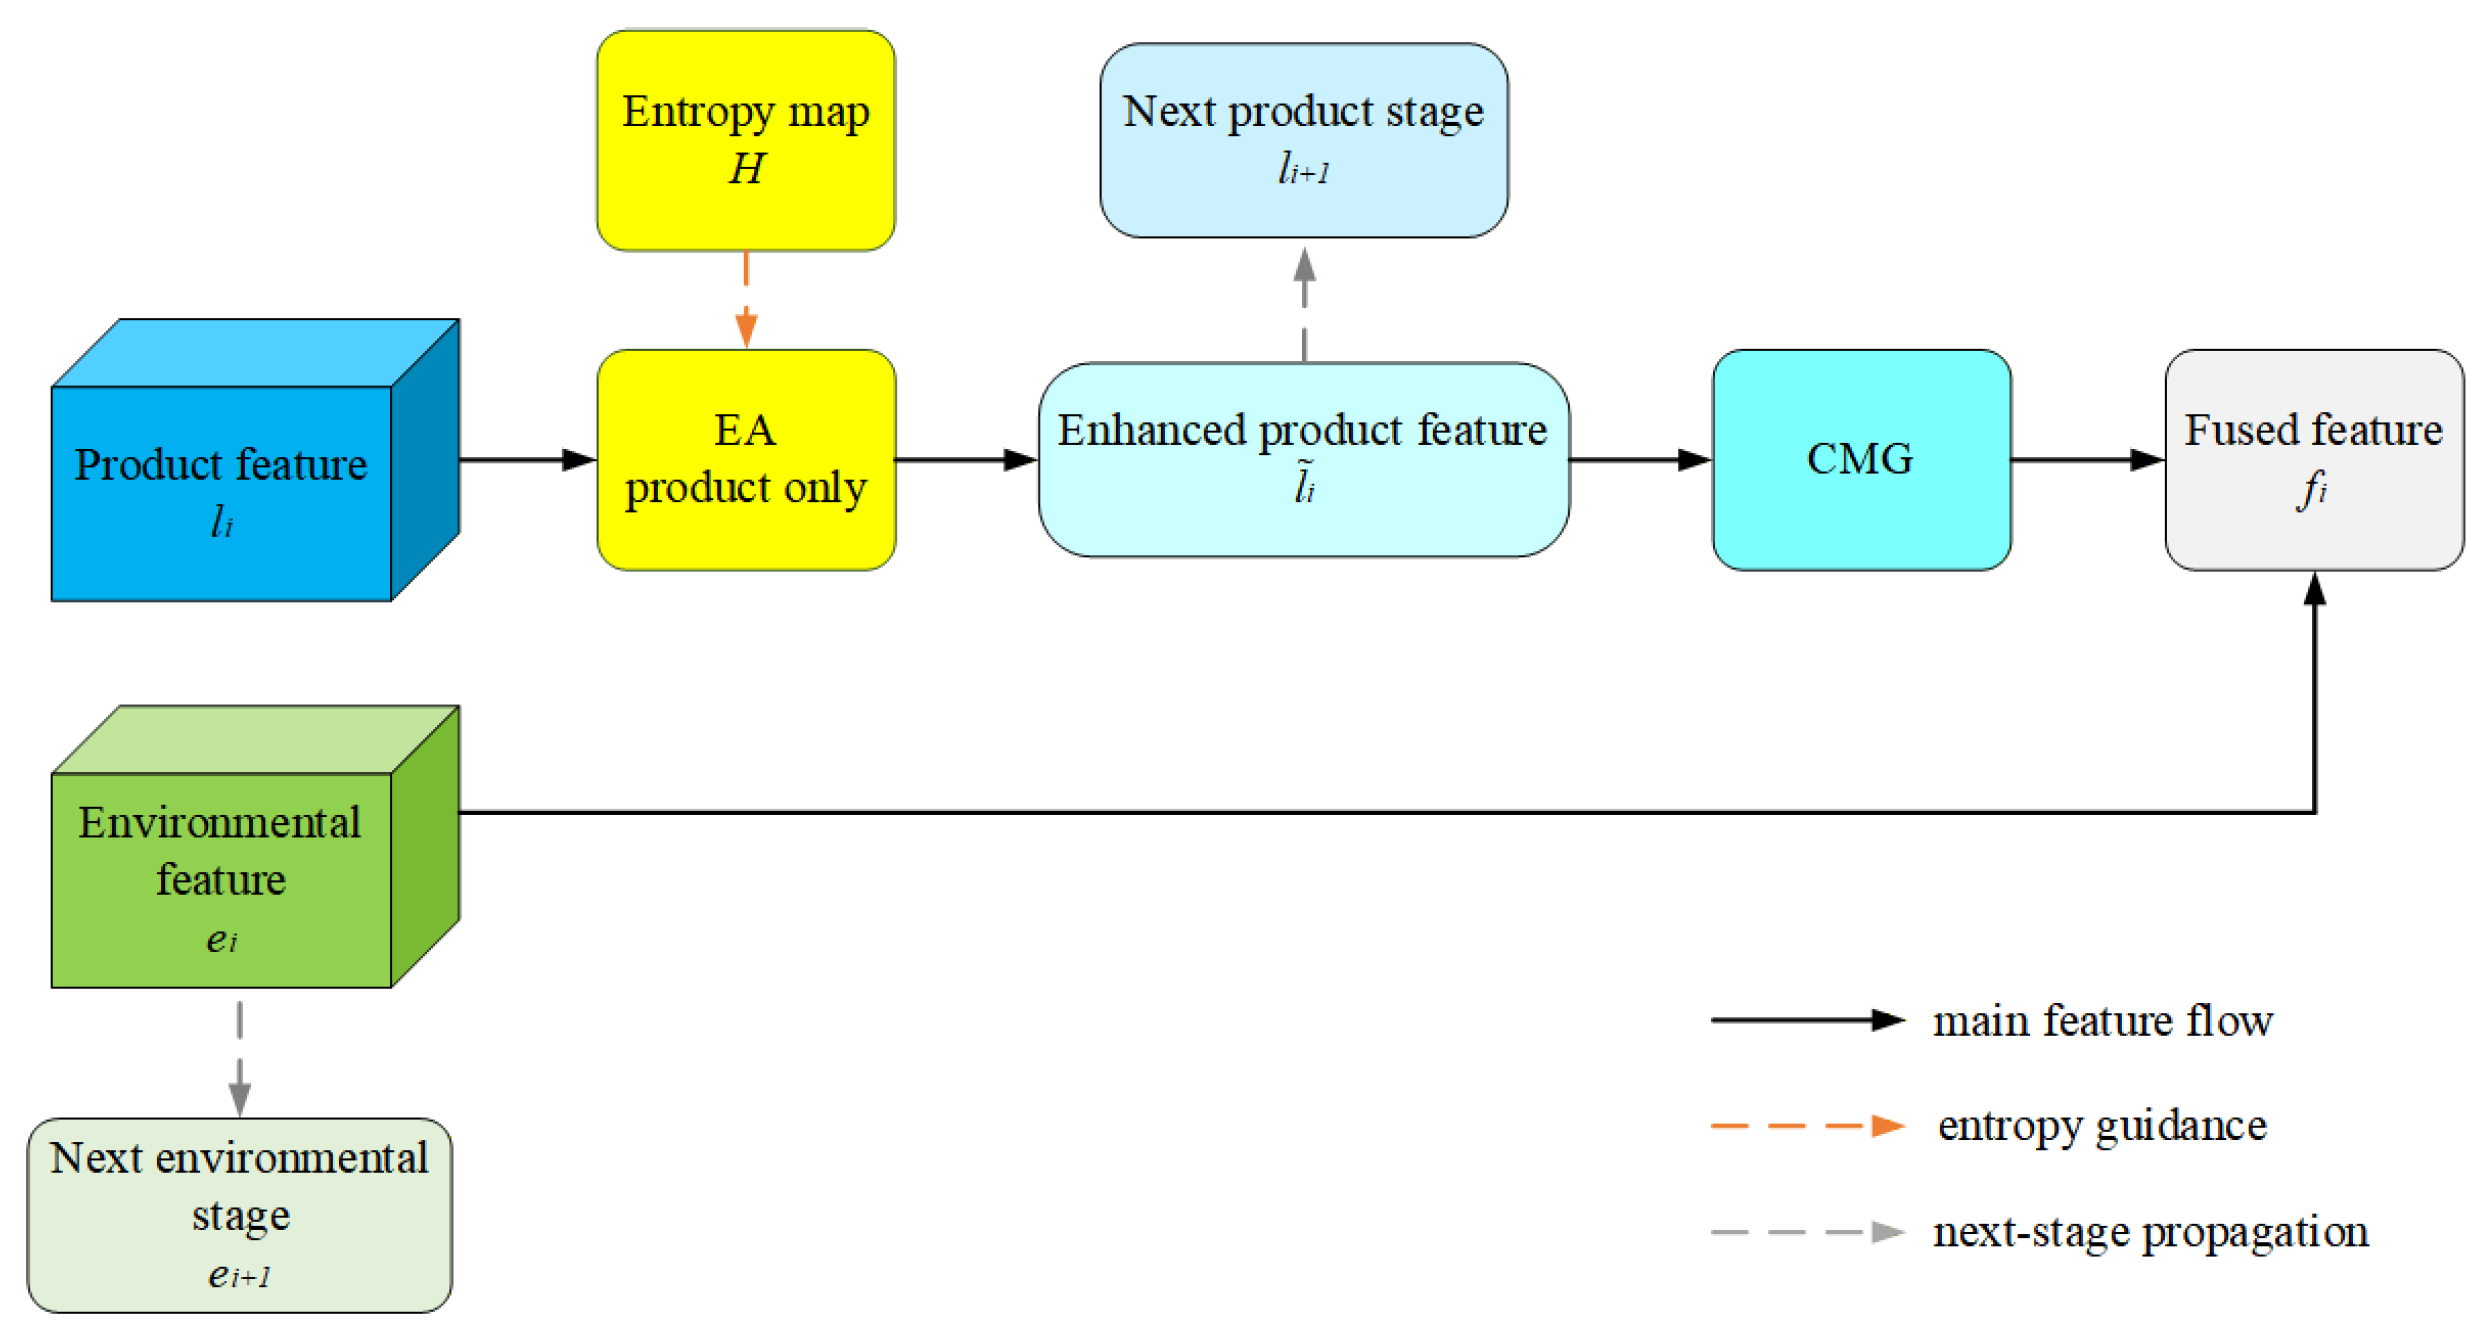
Voting entropy identifies where the source products disagree but does not determine which class assignment is more plausible. The entropy-guided dual-stream feature-fusion module (EA+CMG) therefore performs two complementary operations: Entropy Attention (EA) emphasizes product-stream features in areas of pronounced disagreement, whereas the Cross-Modal Gate (CMG) conditions these features on the regional geo-environmental context. As shown in Figure 4, the module receives the product-stream features, environmental-stream features, and voting-entropy map at each encoding stage and produces fused features for the decoder.
Figure 4.
Architecture of the entropy-guided dual-stream feature fusion module (EA+CMG).
At encoding stage i, let and denote the product-stream and environmental-stream features, respectively. The voting-entropy map is resampled to the spatial resolution of this stage to obtain Hi. EA enhances the product-stream features as
where denotes the enhanced product-stream features, αi is a learnable stage-specific weight, and ⊙ represents element-wise multiplication. The single-channel entropy map Hi is broadcast along the feature-channel dimension. The residual form 1 + αiHi retains the original product features while increasing their responses in proportion to the local level of source-product disagreement.
Disagreement intensity alone cannot indicate which land class is compatible with the surrounding environmental conditions. CMG therefore uses the environmental-stream features, which represent regional moisture, thermal, and topographic conditions, to modulate the entropy-enhanced product features:
where denotes the fused features, σ(⋅) is the sigmoid function, and Wg and We are 1 × 1 convolutions for environmental gating and feature projection, respectively. The function ϕ(⋅) denotes a residual convolutional fusion block. The gate generated from modulates the disagreement-sensitive product features, while projects and incorporates the environmental information into the same feature space. Thus, EA determines where product information requires greater attention, whereas CMG provides complementary environmental context for interpreting ambiguous product features.
The fused features are passed to the decoder through skip connections, while the product-stream and environmental-stream features continue to the next encoding stage. Repeating this operation across encoding stages provides discrepancy-aware multiscale features for subsequent reliability estimation and adaptive decision fusion.
2.3.3. Reliability Estimation and Reliability-Adaptive Decision Fusion
Source-product reliability varies across land classes and spatial locations. For example, a product may delineate cropland reliably in irrigated plains but become less reliable in piedmont transition zones or heterogeneous landscapes. Moreover, an initial routing weight indicates how strongly the model intends to use a source product but does not necessarily reflect whether that product’s current class assignment is correct. DRAFNet therefore estimates the reliability of each source product for the class it assigns at each pixel and uses this estimate to calibrate its routing weight. This continuous calibration avoids manually specified thresholds and allows product contributions to vary by pixel and class.
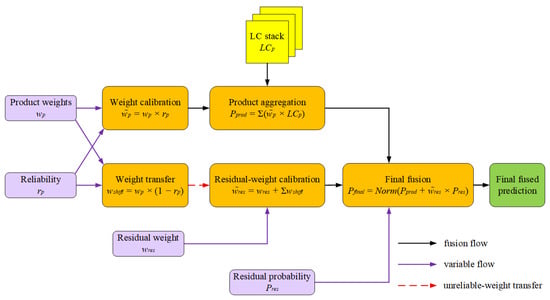
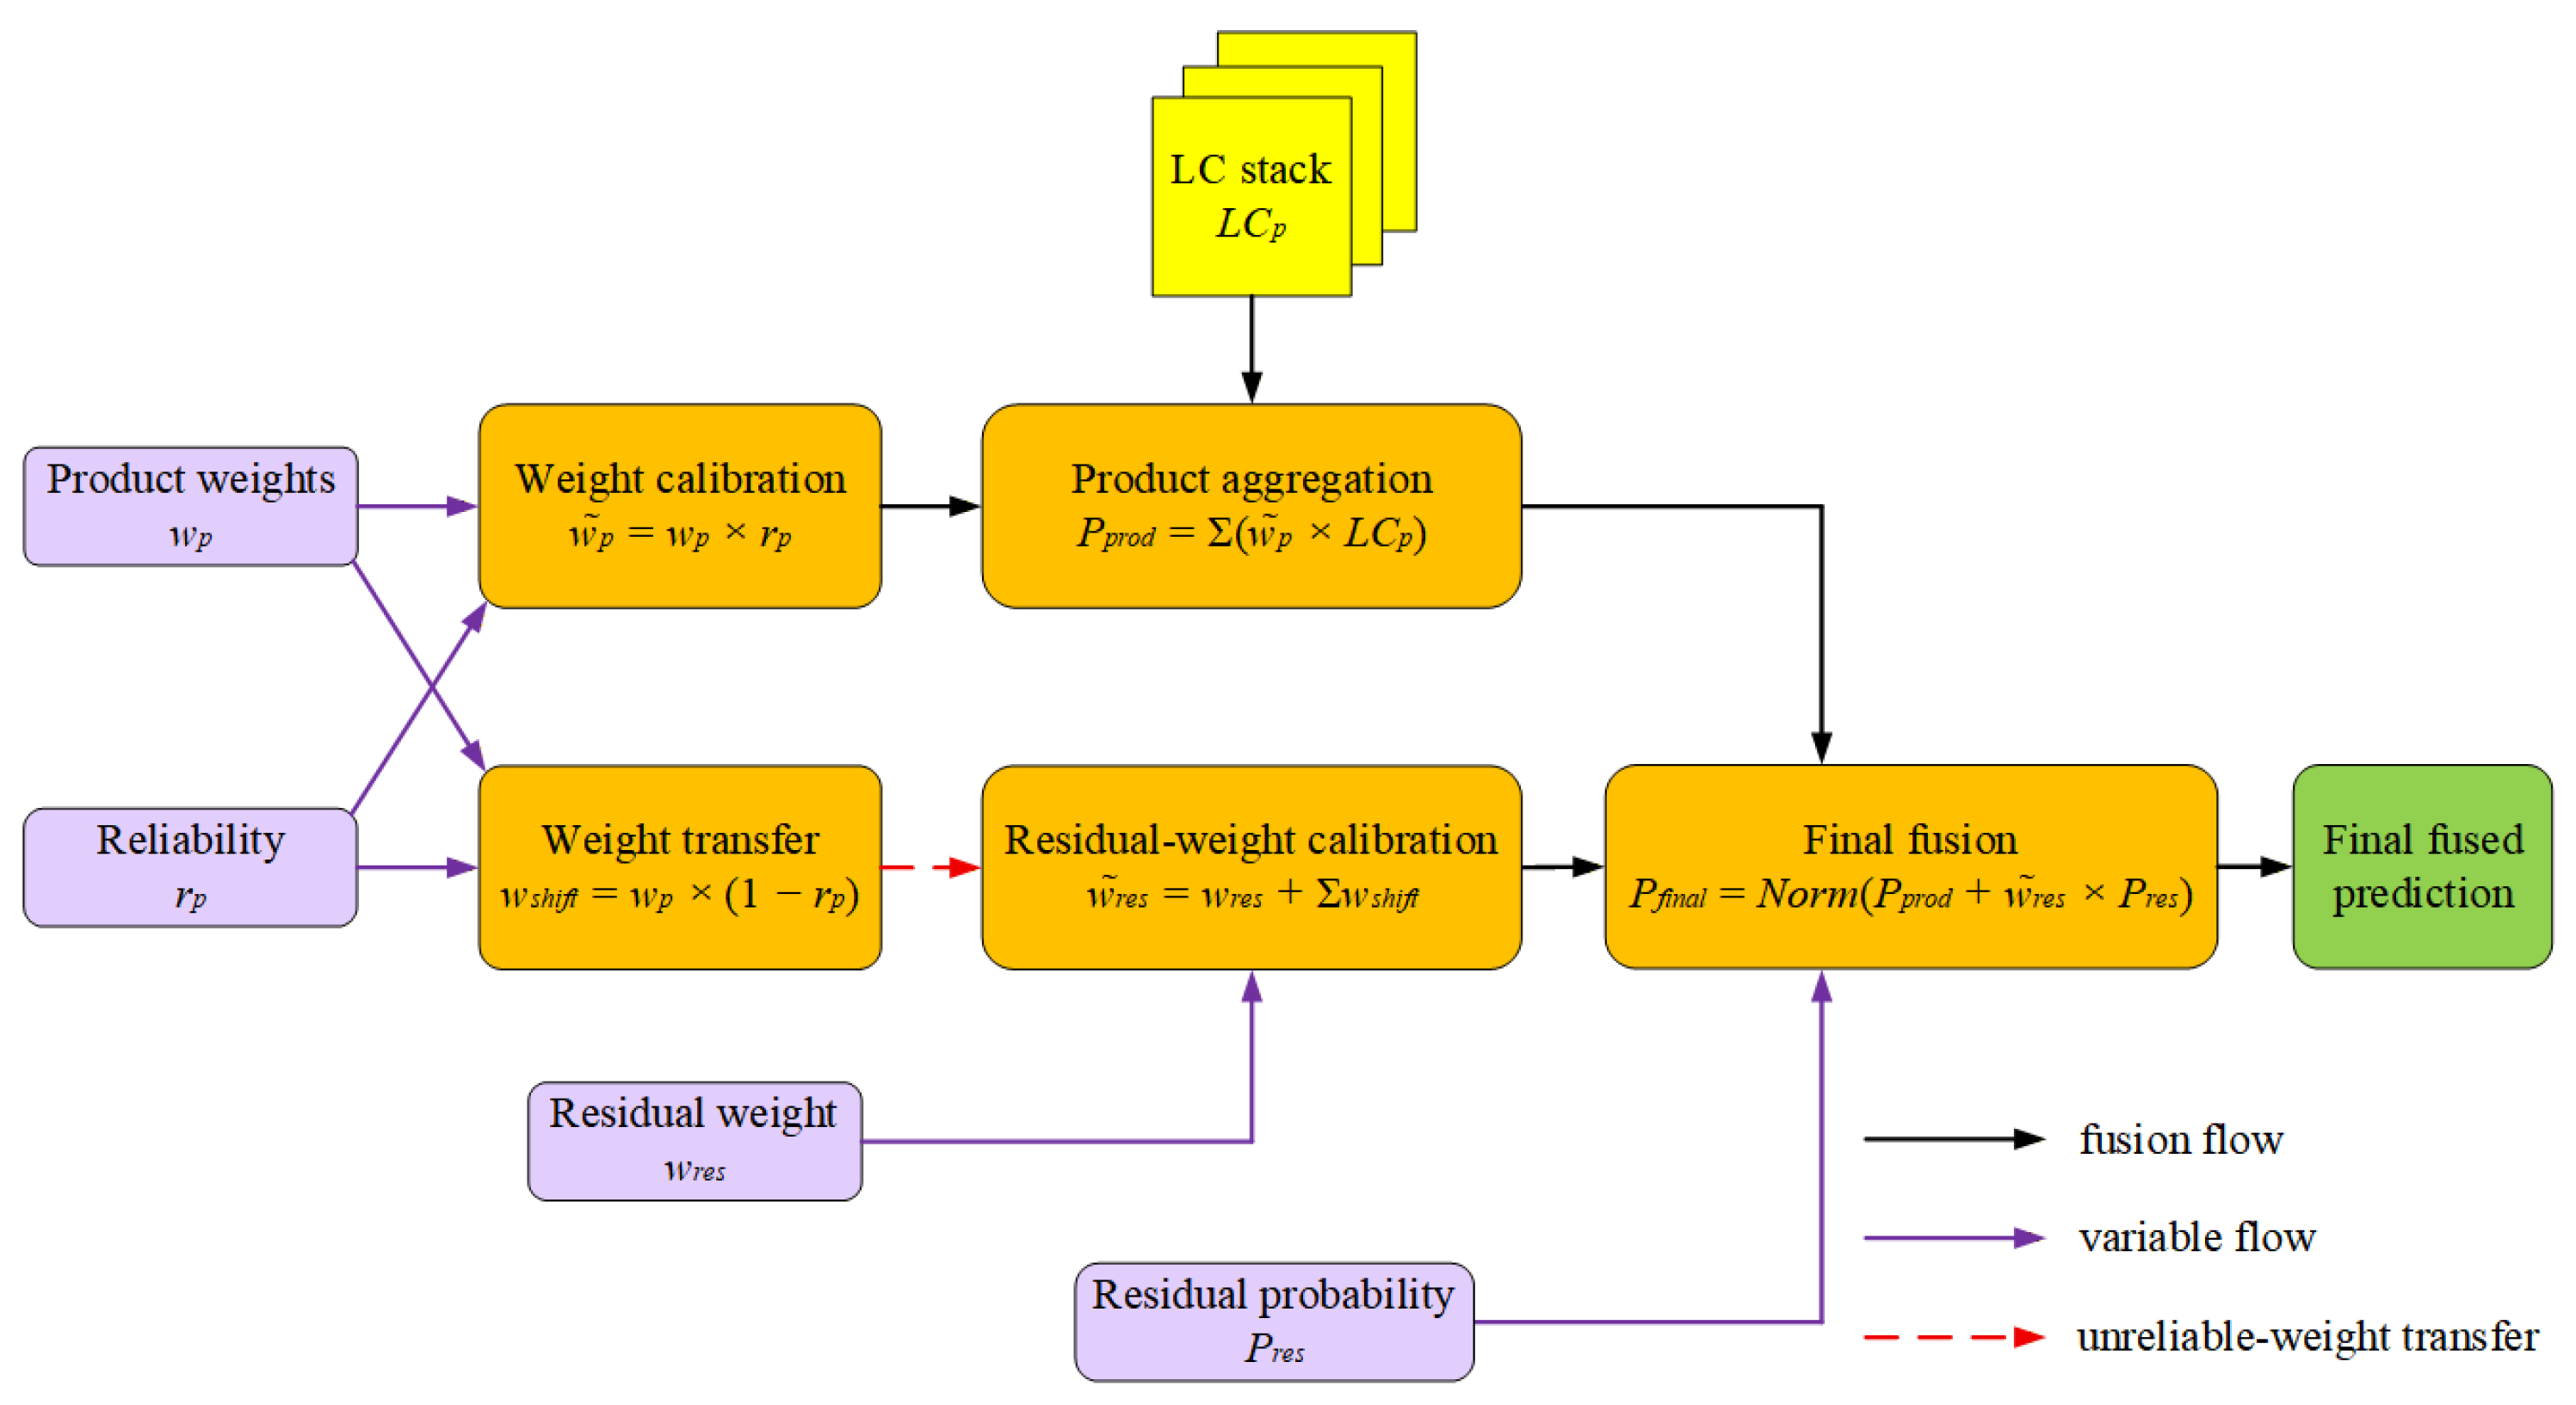
The Reliability-Adaptive Decision Fusion (RADF) module integrates the calibrated source-product decisions with an alternative prediction generated by the residual expert (Figure 5). Before entering RADF, the decoded feature d1 is processed by the Residual head, Router head, and Reliability head. These heads produce the residual-expert class probabilities , the initial routing weights and , and the source-product reliability estimates ri,s, respectively. Here, and represent the initial contributions of source product s and the residual expert at pixel i, whereas ri,s represents the reliability of the class currently assigned by that source product. The residual expert predicts a probability distribution over all classes rather than directly estimating source-product errors, thereby providing an alternative class decision when the source products are unreliable or make the same error.
Figure 5.
Architecture of the Reliability-Adaptive Decision Fusion (RADF) module.
For source product s at pixel i, the initial weight is calibrated by multiplying it by its estimated reliability ri,s, and the resulting calibrated weight is denoted by . Because ri,s ∈ [0,1], a reliable source product retains most of its initial weight, whereas the weight of a less reliable product is attenuated more strongly. The calibrated weights are then used to aggregate the class assignments in the LC stack. Let LCi,s(c) denote the one-hot encoding indicating whether source product s assigns pixel i to class c. The aggregated source-product class score is
Thus, each source product contributes its calibrated weight only to the class it assigns. This operation retains source-product consensus when the relevant products are estimated to be reliable while reducing the influence of questionable class assignments.
Simply attenuating an unreliable source-product weight would discard part of the routing contribution without strengthening an alternative decision pathway. RADF therefore transfers the attenuated portion to the residual expert. The weight transferred from source product s is
and the resulting residual-expert weight is
Here, is the initial residual-expert weight generated by the Router head, and is its weight after transfer. Reliability calibration and weight transfer therefore perform complementary roles: calibration reduces the contribution of unreliable source-product decisions, while transfer reallocates the attenuated contribution to the residual expert. Because the retained and transferred portions together equal the original source-product weight, the total routing weight is preserved rather than discarded.
Finally, RADF combines the aggregated source-product score with the residual-expert prediction:
where Norm(⋅) normalizes the final class probabilities. The final class assigned to pixel i is
Through this coupled calibration-and-transfer process, RADF retains reliable source-product decisions while increasing the contribution of the residual expert where the estimated reliability of the source products is low. It therefore provides a targeted correction pathway for areas of pronounced disagreement and for cases in which the source products make the same error.
2.3.4. Model Training and Implementation Details
DRAFNet and all deep learning benchmarks were trained on the same 256 × 256-pixel patches under a common optimization protocol. Each model was trained for a maximum of 100 epochs using the AdamW optimizer, with an initial learning rate of 1 × 10⁻⁴ and a weight-decay coefficient of 1 × 10⁻⁴. The learning rate was multiplied by 0.5 every 20 epochs. The batch sizes for training, validation, and testing were all set to 64. The same class weights and random horizontal and vertical flips were used for all models, and mixed-precision computation was enabled during training. The random seed was fixed at 42 for the comparative runs. For each model, the checkpoint with the highest validation mIoU was retained and subsequently evaluated on the held-out test set. To ensure a controlled comparison, the same hyperparameter protocol was applied to all deep learning models, and model selection was based only on validation mIoU; the test set was not used for hyperparameter selection or model selection. An additional repeated-run experiment was conducted with DRAFNet and U-Net++, the strongest benchmark in the primary comparison, to characterize run-to-run variability. Both models were trained with five random seeds (42, 3407, 2024, 2608, and 4499) using the same input features and data splits. For this additional experiment, the batch size was 32, training was limited to 100 epochs, and early stopping was applied when validation mIoU did not improve by at least 0.0005 for 20 consecutive epochs. All other optimization settings followed the common protocol described above. For each seed, the checkpoint with the highest validation mIoU was evaluated on the held-out test set.
For DRAFNet, the overall training objective comprises five complementary loss terms:
Here, is the class-weighted cross-entropy loss applied to the final fused prediction and constitutes the primary supervision. is a soft-target cross-entropy loss that supervises the allocation of routing weights among the three source products and the residual expert. For each labeled pixel, the routing target is distributed equally among the source products whose class assignments match the ground-truth label; when none of the source products is correct, the entire target is assigned to the residual expert. The class-weighted cross-entropy loss is applied independently to the Residual head to maintain the residual expert’s ability to distinguish among classes. is applied to the final fused prediction to alleviate class imbalance, with α and β set to 0.4 and 0.6, respectively, to place greater emphasis on false negatives. Finally, is a binary cross-entropy loss for source-product reliability estimation. Its target is set to 1 when the class assigned by a source product matches the ground-truth label and to 0 otherwise. Thus, supervises where the initial decision weight should be allocated, whereas supervises whether the contribution of each source product should be retained during reliability calibration. The loss weights λ1, λ2, λ3, λ4, and λ5 were set to 1.0, 0.3, 0.2, 0.2, and 0.1, respectively. Accordingly, the Reliability head output has a decision-level interpretation: a higher value supports retaining the class currently assigned by a source product, whereas a lower value attenuates its routing contribution and transfers a larger portion to the residual expert through RADF.
Full-map inference was performed using a sliding window of 256 × 256 pixels with a stride of 256 pixels. When the number of raster rows or columns was not divisible by the stride, the final window was shifted to the last valid starting position along the corresponding dimension to ensure complete coverage. The patch-level predictions were then stitched according to their spatial coordinates to produce the final land-cover map. The source code and implementation details of the proposed DRAFNet are provided in the Supplementary Materials to facilitate reproducibility.
2.4. Experiments and Evaluation
2.4.1. Comparative and Ablation Experiments
The evaluation comprised source-product comparisons, benchmark-method comparisons, and ablation experiments. The source-product comparison assessed whether DRAFNet improved upon FROM-GLC Plus, GLC-FCS30D, and GlobeLand30. The benchmark comparison examined whether DRAFNet’s task-specific reliability-adaptive fusion strategy offered advantages over traditional fusion, machine learning, and general-purpose semantic segmentation methods.
The traditional fusion methods included majority voting and Dempster–Shafer evidence fusion (D–S Evidence), representing rule-based and evidence-theory-based fusion, respectively. Random forest was included as a widely used nonlinear machine learning classifier. The deep learning benchmarks comprised U-Net, U-Net++, ResUNet, ResUNet++, DeepLabV3+, High-Resolution Network (HRNet), SegFormer, Swin-Unet, Mask2Former, and SegNeXt, covering representative convolutional, residual, multiscale, high-resolution, Transformer-based, and mask-classification architectures. Although these networks were not developed specifically for land-cover product fusion, they provide relevant general-purpose learnable baselines because the spatially aligned source products and geo-environmental variables can be represented as multichannel patch inputs, with land-cover class prediction as the common output task. Their inclusion tests whether direct multichannel feature learning can achieve comparable performance without explicitly retaining source-product decisions or modeling their reliability. For these benchmarks, the input layer was adapted to the same 17 input channels used by DRAFNet, and the output layer predicted the same four land-cover classes. All trainable models used identical training, validation, and test splits, and all methods were evaluated on the same held-out test samples using the same metrics. Majority voting, D–S Evidence, and random forest provided complementary comparisons with conventional fusion and machine learning approaches. The ablation experiments focused on the decision chain underlying RADF. Reliability calibration, reliability supervision, low-reliability weight transfer, and the residual expert were removed individually while the remaining settings were kept unchanged. The resulting performance changes were used to isolate the contribution of each mechanism and determine whether improvements arose from reliability-adaptive decision-making and residual correction rather than from feature extraction alone.
The source-decision scenario analysis examined the difficult conditions targeted by RADF. For each test patch, the reference sample at its center was assigned to one of three groups according to the decisions of the three source products: (i) all source products agreed and were correct, (ii) the source products disagreed, or (iii) all source products agreed on the same incorrect class. DRAFNet OA was calculated for each group in each of the five runs and then summarized as the mean and standard deviation.
2.4.2. Evaluation Metrics
Pixel-level performance was evaluated using the independent test samples. Overall performance was measured using overall accuracy (OA), Cohen’s kappa coefficient (Kappa), mean intersection over union (mIoU), and the macro-averaged F1 score (Macro F1). Class-wise performance was assessed using intersection over union (IoU), user’s accuracy (UA), producer’s accuracy (PA), and F1 score. The corresponding equations are provided in Table 2. Overall metrics characterize general classification performance, whereas class-wise metrics reveal differences in the identification of cropland, forestland, and grassland.
Table 2.
Formulae used to calculate the accuracy and area-agreement metrics.
Note: C is the number of classes; N is the total number of valid samples; nii is the number of samples of class i that are correctly classified; ni+ is the total number of reference samples belonging to class i; n+i is the total number of samples classified as class i; TPi, FPi, and FNi are the numbers of true positives, false positives, and false negatives for class i, respectively; and denote the mapped area and the FAO-reported statistical area, respectively, of class c in country k; S is the set of country–class combinations included in the area comparison; and M is the number of combinations.
The same metrics were also calculated separately for each country to characterize geographic variation in model performance and prevent study-area-wide averages from obscuring lower accuracy in individual countries. This analysis evaluates the regional consistency of DRAFNet within the five Central Asian countries included in the study area, but is not treated as an independent cross-region or cross-year transferability experiment.
Country–class area agreement was evaluated using log-ratio (LR) deviation because absolute area differences are dominated by spatially extensive classes, whereas conventional relative errors do not represent overestimation and underestimation symmetrically [39,40]. For cropland, forestland, and grassland, mapped areas were compared with statistics from the Food and Agriculture Organization of the United Nations (FAO). The mean and median absolute LR deviations were used as complementary measures of aggregate area agreement rather than as direct pixel-level accuracy measures. This comparison was therefore treated as a supplementary country-level consistency check, because FAO statistics and remote-sensing-derived areas differ in class definitions, reporting years, spatial support, and treatment of mixed pixels.
Computational efficiency and model scale were evaluated using trainable parameter count, floating-point operations (FLOPs), training time, per-patch inference time, and full-region inference time. Parameter count represents the number of trainable model parameters, and FLOPs were calculated using the same 256 × 256-pixel input size for all deep learning models. These measures were used to assess whether improvements in fusion accuracy were achieved at an acceptable computational cost for large-area land-cover mapping. Run-to-run stability and the statistical significance of the DRAFNet–U-Net++ comparison were quantified from the five seed-matched runs. Each overall metric was summarized as the mean and standard deviation across runs. Paired stratified bootstrap testing with 5000 replicates resampled the held-out test predictions with replacement within reference classes. For each replicate, the DRAFNet-minus-U-Net++ difference was calculated for every matched seed pair and then averaged across the five pairs. Two-sided bootstrap p-values and 95% confidence intervals were reported.
3. Results
3.1. Overall and Class-Wise Accuracy
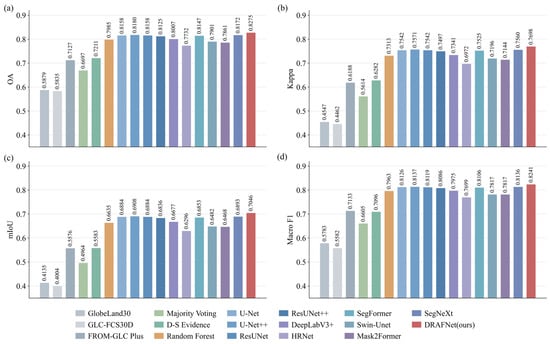
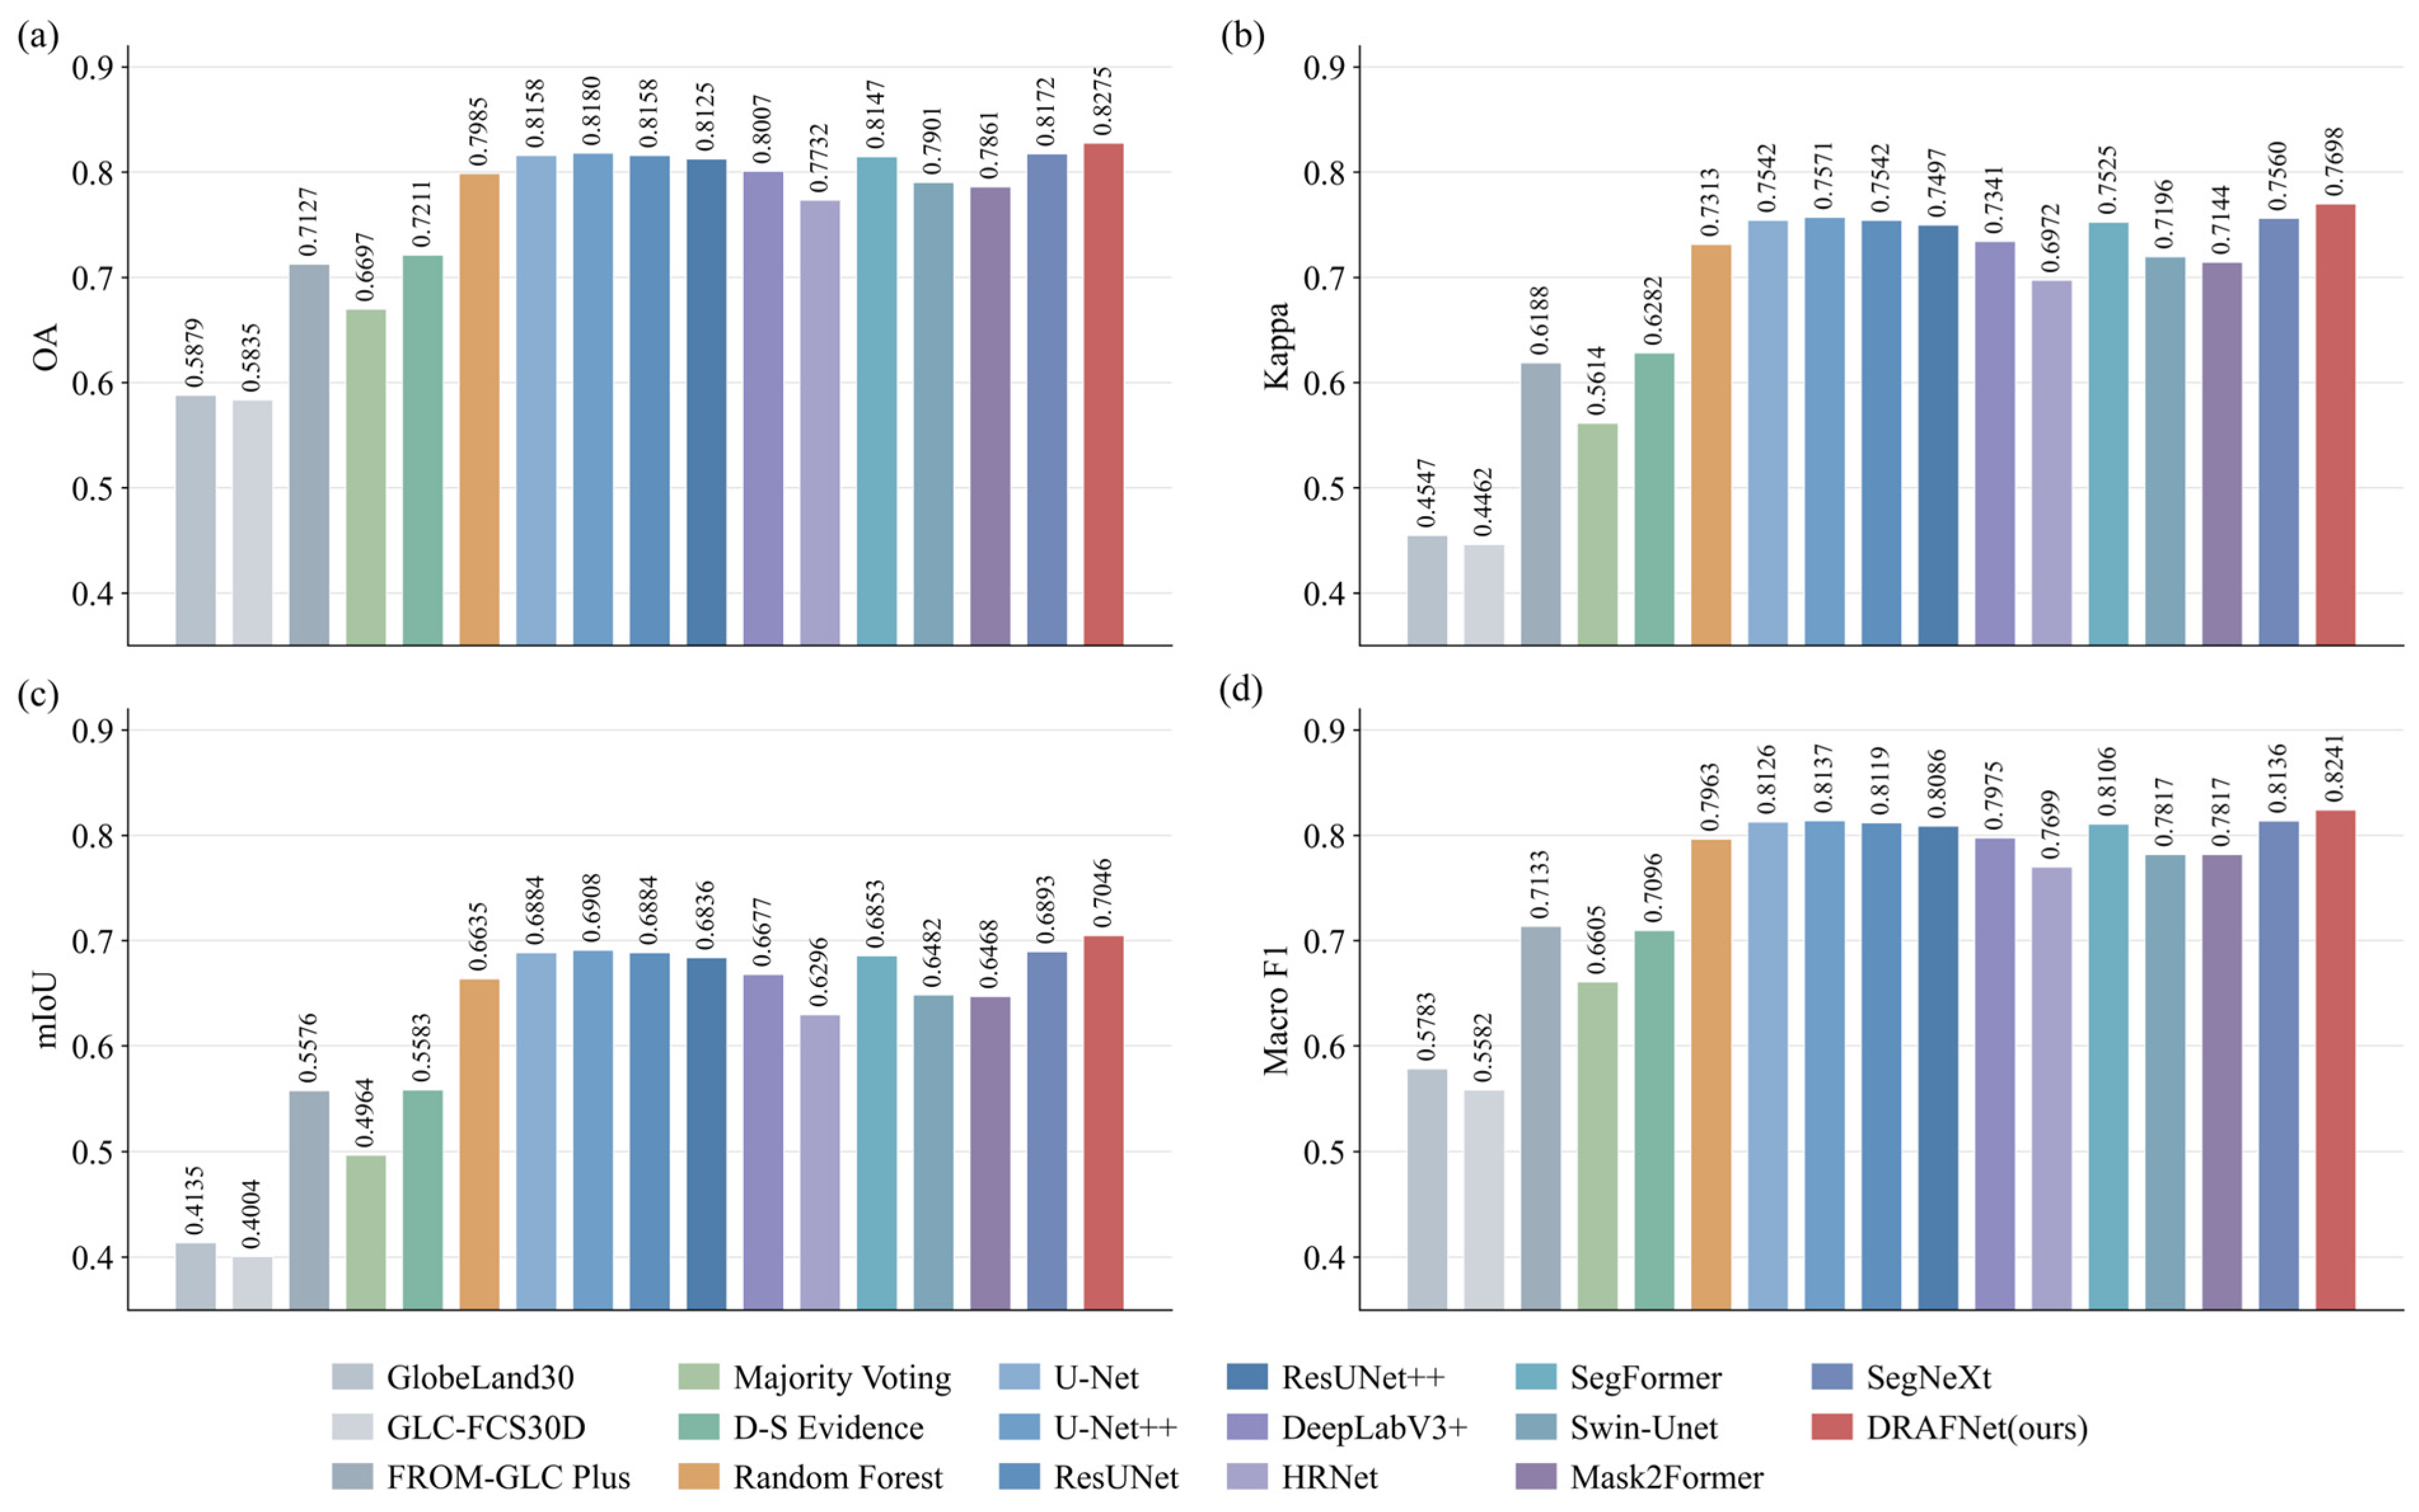
Using the common test samples and evaluation framework, DRAFNet achieved the highest overall performance (Figure 6). Its OA, Kappa, mIoU, and Macro F1 were 0.8275, 0.7698, 0.7046, and 0.8241, respectively, exceeding those of the three source products and all benchmark methods. Compared with U-Net++, the strongest benchmark, DRAFNet improved these metrics by 0.95, 1.27, 1.38, and 1.04 percentage points, respectively. Although the absolute gains were modest, their consistency across all four metrics indicates that the improvement was not confined to a single aspect of classification performance.
Figure 6.
Comparison of overall performance across different land-cover products and methods: (a) OA; (b) Kappa; (c) mIoU; and (d) Macro F1.
The traditional fusion methods and random forest produced lower overall accuracy, while the general-purpose deep learning models were more competitive but did not match DRAFNet. Because the trainable benchmarks used the same input features and data splits, these results suggest that explicitly modeling source-product disagreement and reliability is more effective for this task than relying solely on generic multichannel feature learning.
Across five independently trained runs, DRAFNet maintained higher mean OA, Kappa, mIoU, and Macro F1 values than U-Net++ (Table 3). The corresponding mean differences were 1.48, 1.96, 2.06, and 1.50 percentage points. All paired stratified bootstrap 95% confidence intervals excluded zero, and the two-sided p-values were below 0.001. The repeated-run results therefore confirm that the observed performance advantage was consistent across random initializations.
Table 3.
Five-run performance comparison and statistical test results for DRAFNet and U-Net++.
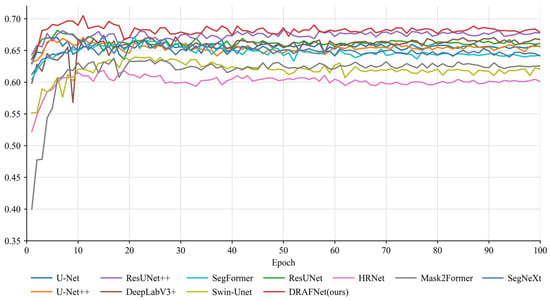
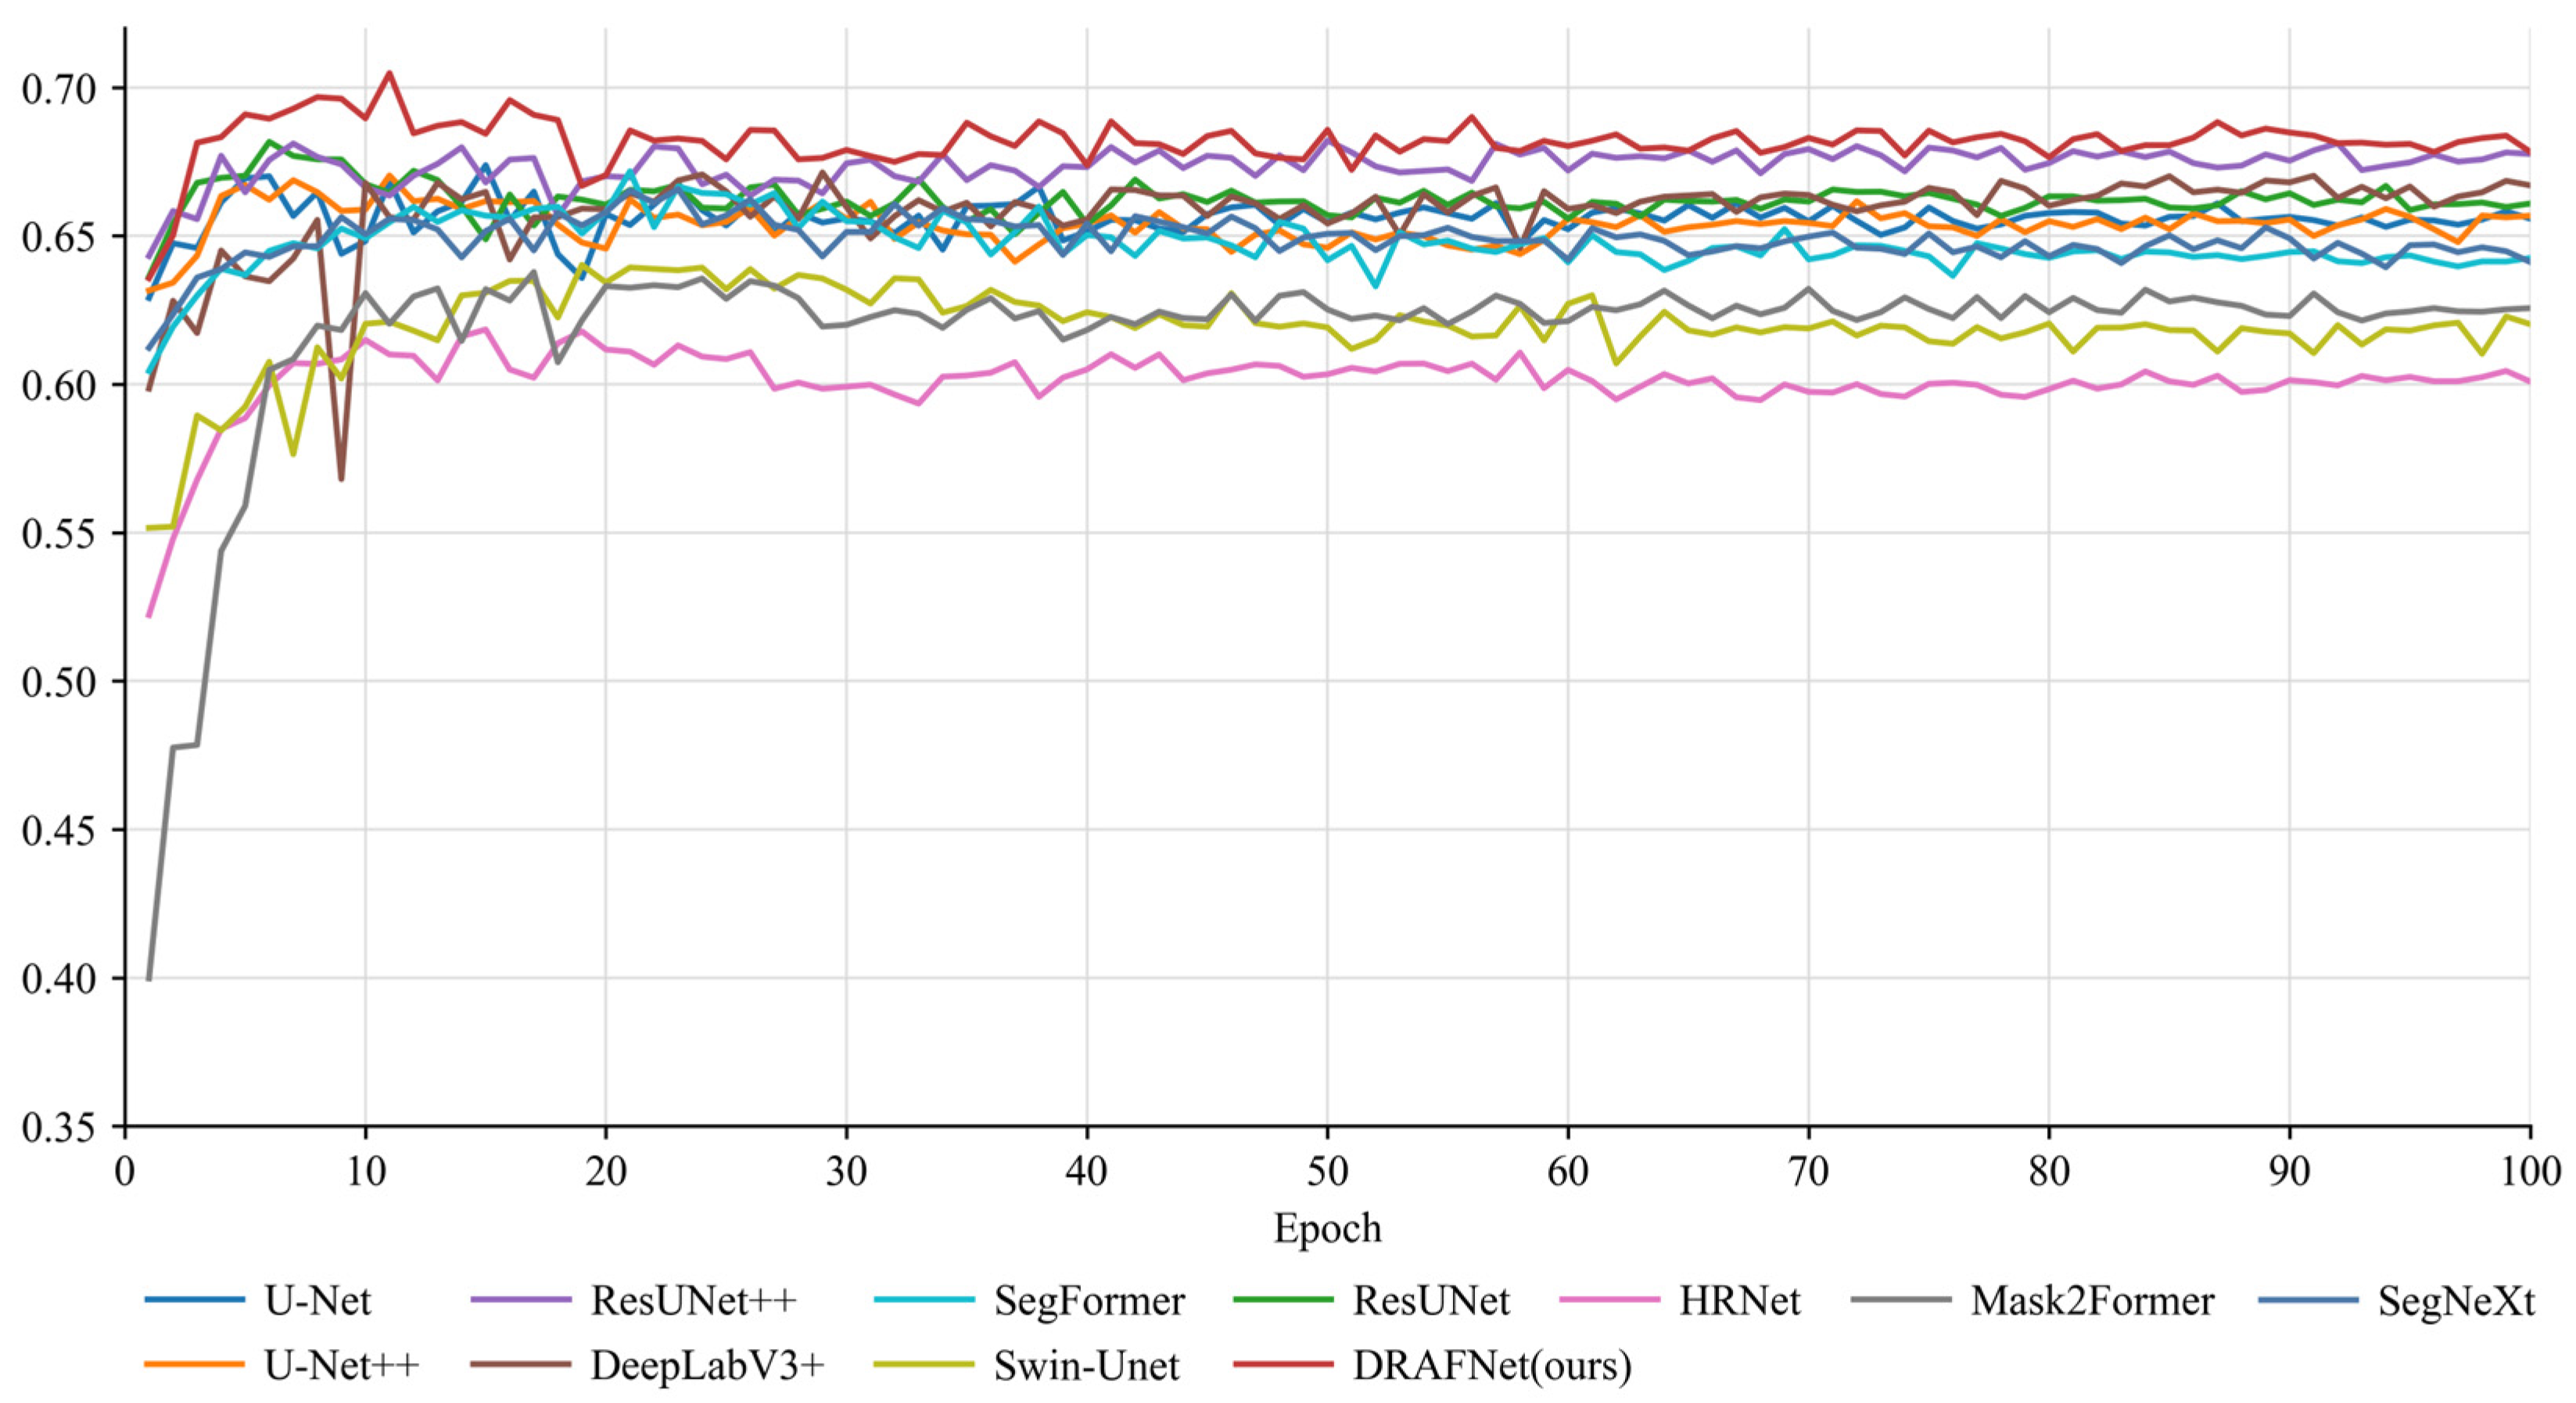
The validation curves provide further evidence of stable training behavior (Figure 7). Most deep learning models improved rapidly during the early epochs and stabilized thereafter. After epoch 20, DRAFNet achieved the highest validation mIoU in 75 of the remaining 80 epochs and remained close to the best-performing benchmark in the other five, indicating consistently strong validation performance during training.
Figure 7.
Validation mIoU curves of different deep learning models during training.
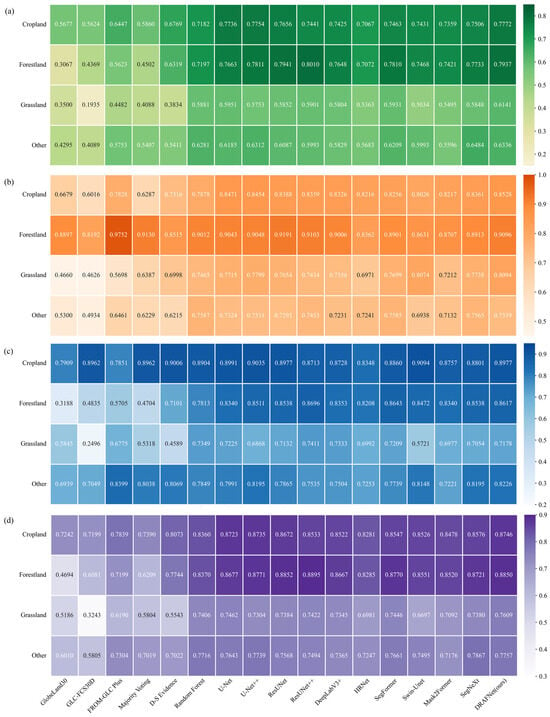
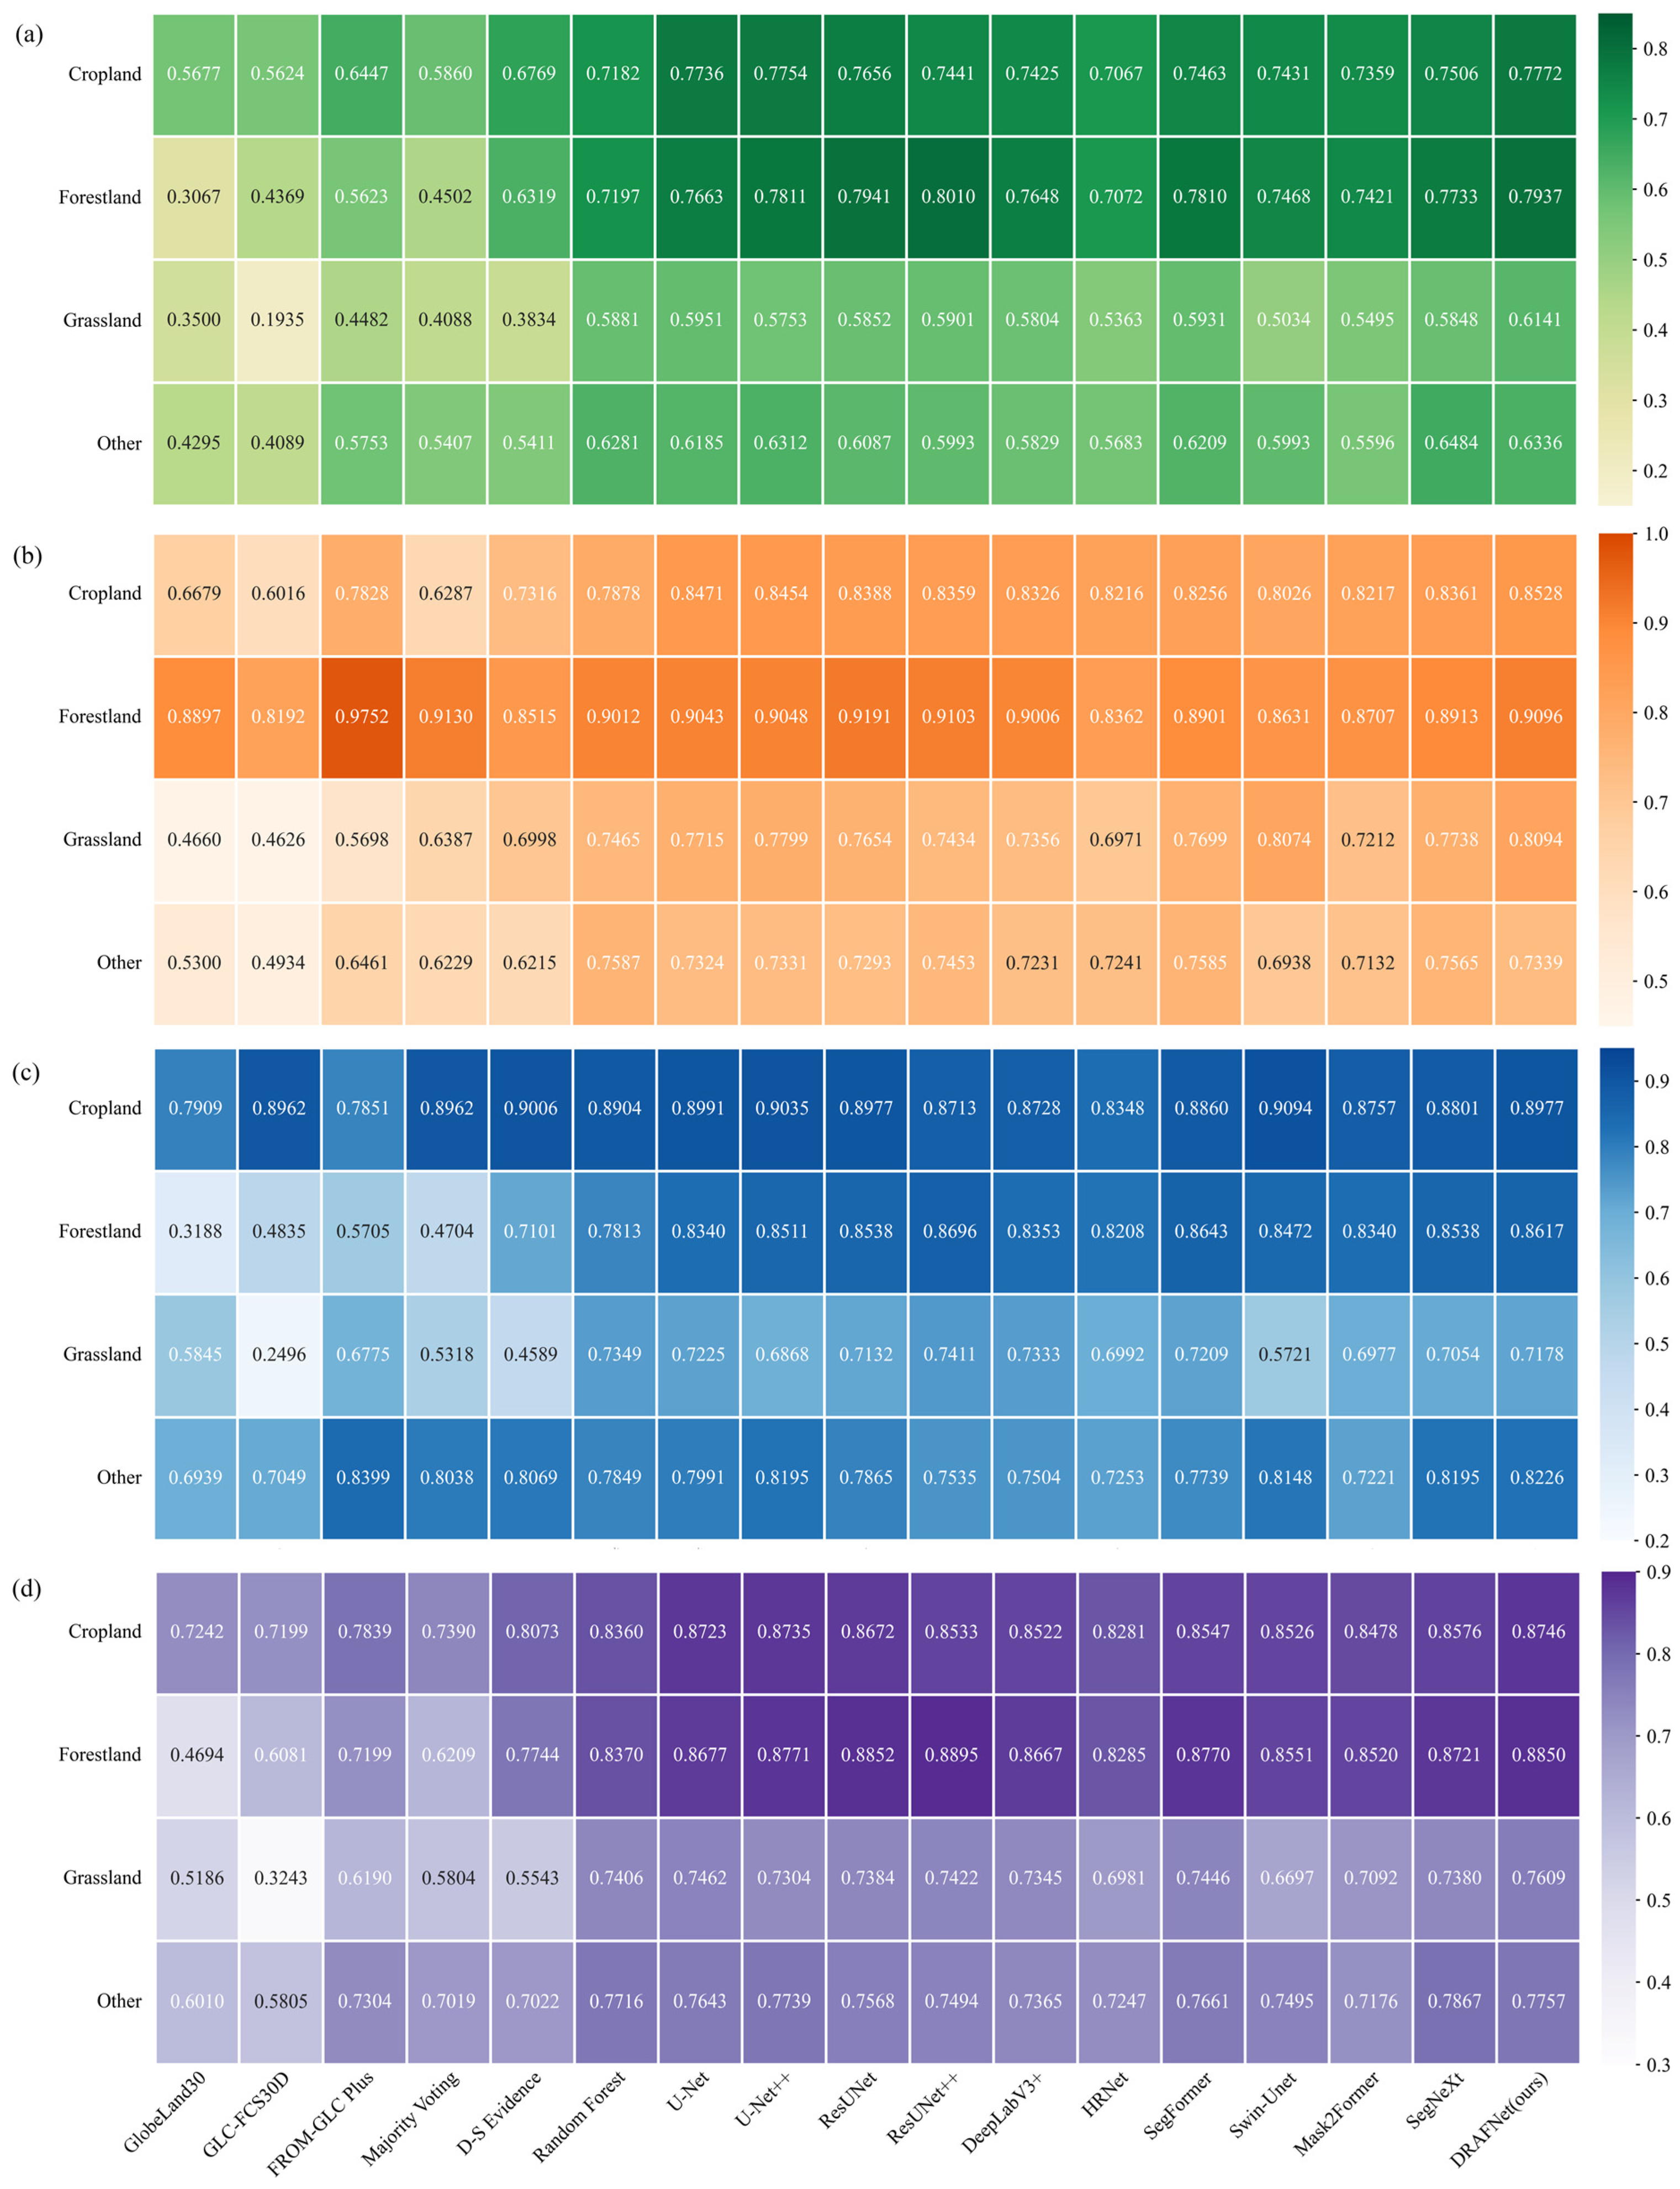
Class-wise performance is shown in Figure 8. For cropland, DRAFNet achieved IoU, UA, PA, and F1 values of 0.7772, 0.8528, 0.8977, and 0.8746, respectively. The corresponding values were 0.7937, 0.9096, 0.8617, and 0.8850 for forestland; 0.6141, 0.8094, 0.7178, and 0.7609 for grassland; and 0.6336, 0.7339, 0.8226, and 0.7757 for the other category. Forestland and cropland achieved the highest class-wise IoU and F1 values, whereas grassland remained more difficult to delineate because of its extensive occurrence in heterogeneous arid and semi-arid transition zones. Although some benchmark methods performed better for individual class–metric combinations, DRAFNet provided a more balanced performance across the four classes. This balance is important because improved identification of the three target classes was achieved without substantially reducing the accuracy of the other category.
Figure 8.
Comparison of class-wise accuracy across different land-cover products and methods: (a) IoU; (b) UA; (c) PA; and (d) F1.
3.2. Spatial Representation
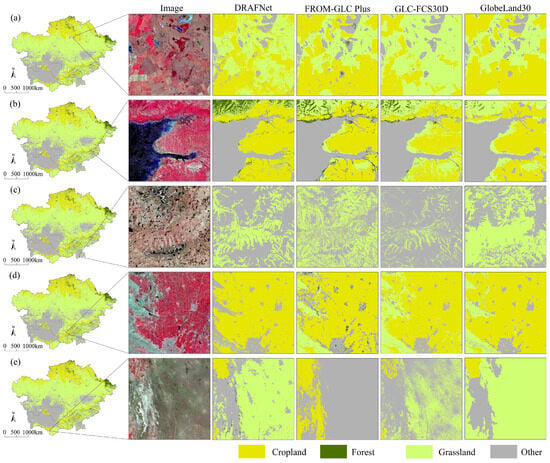
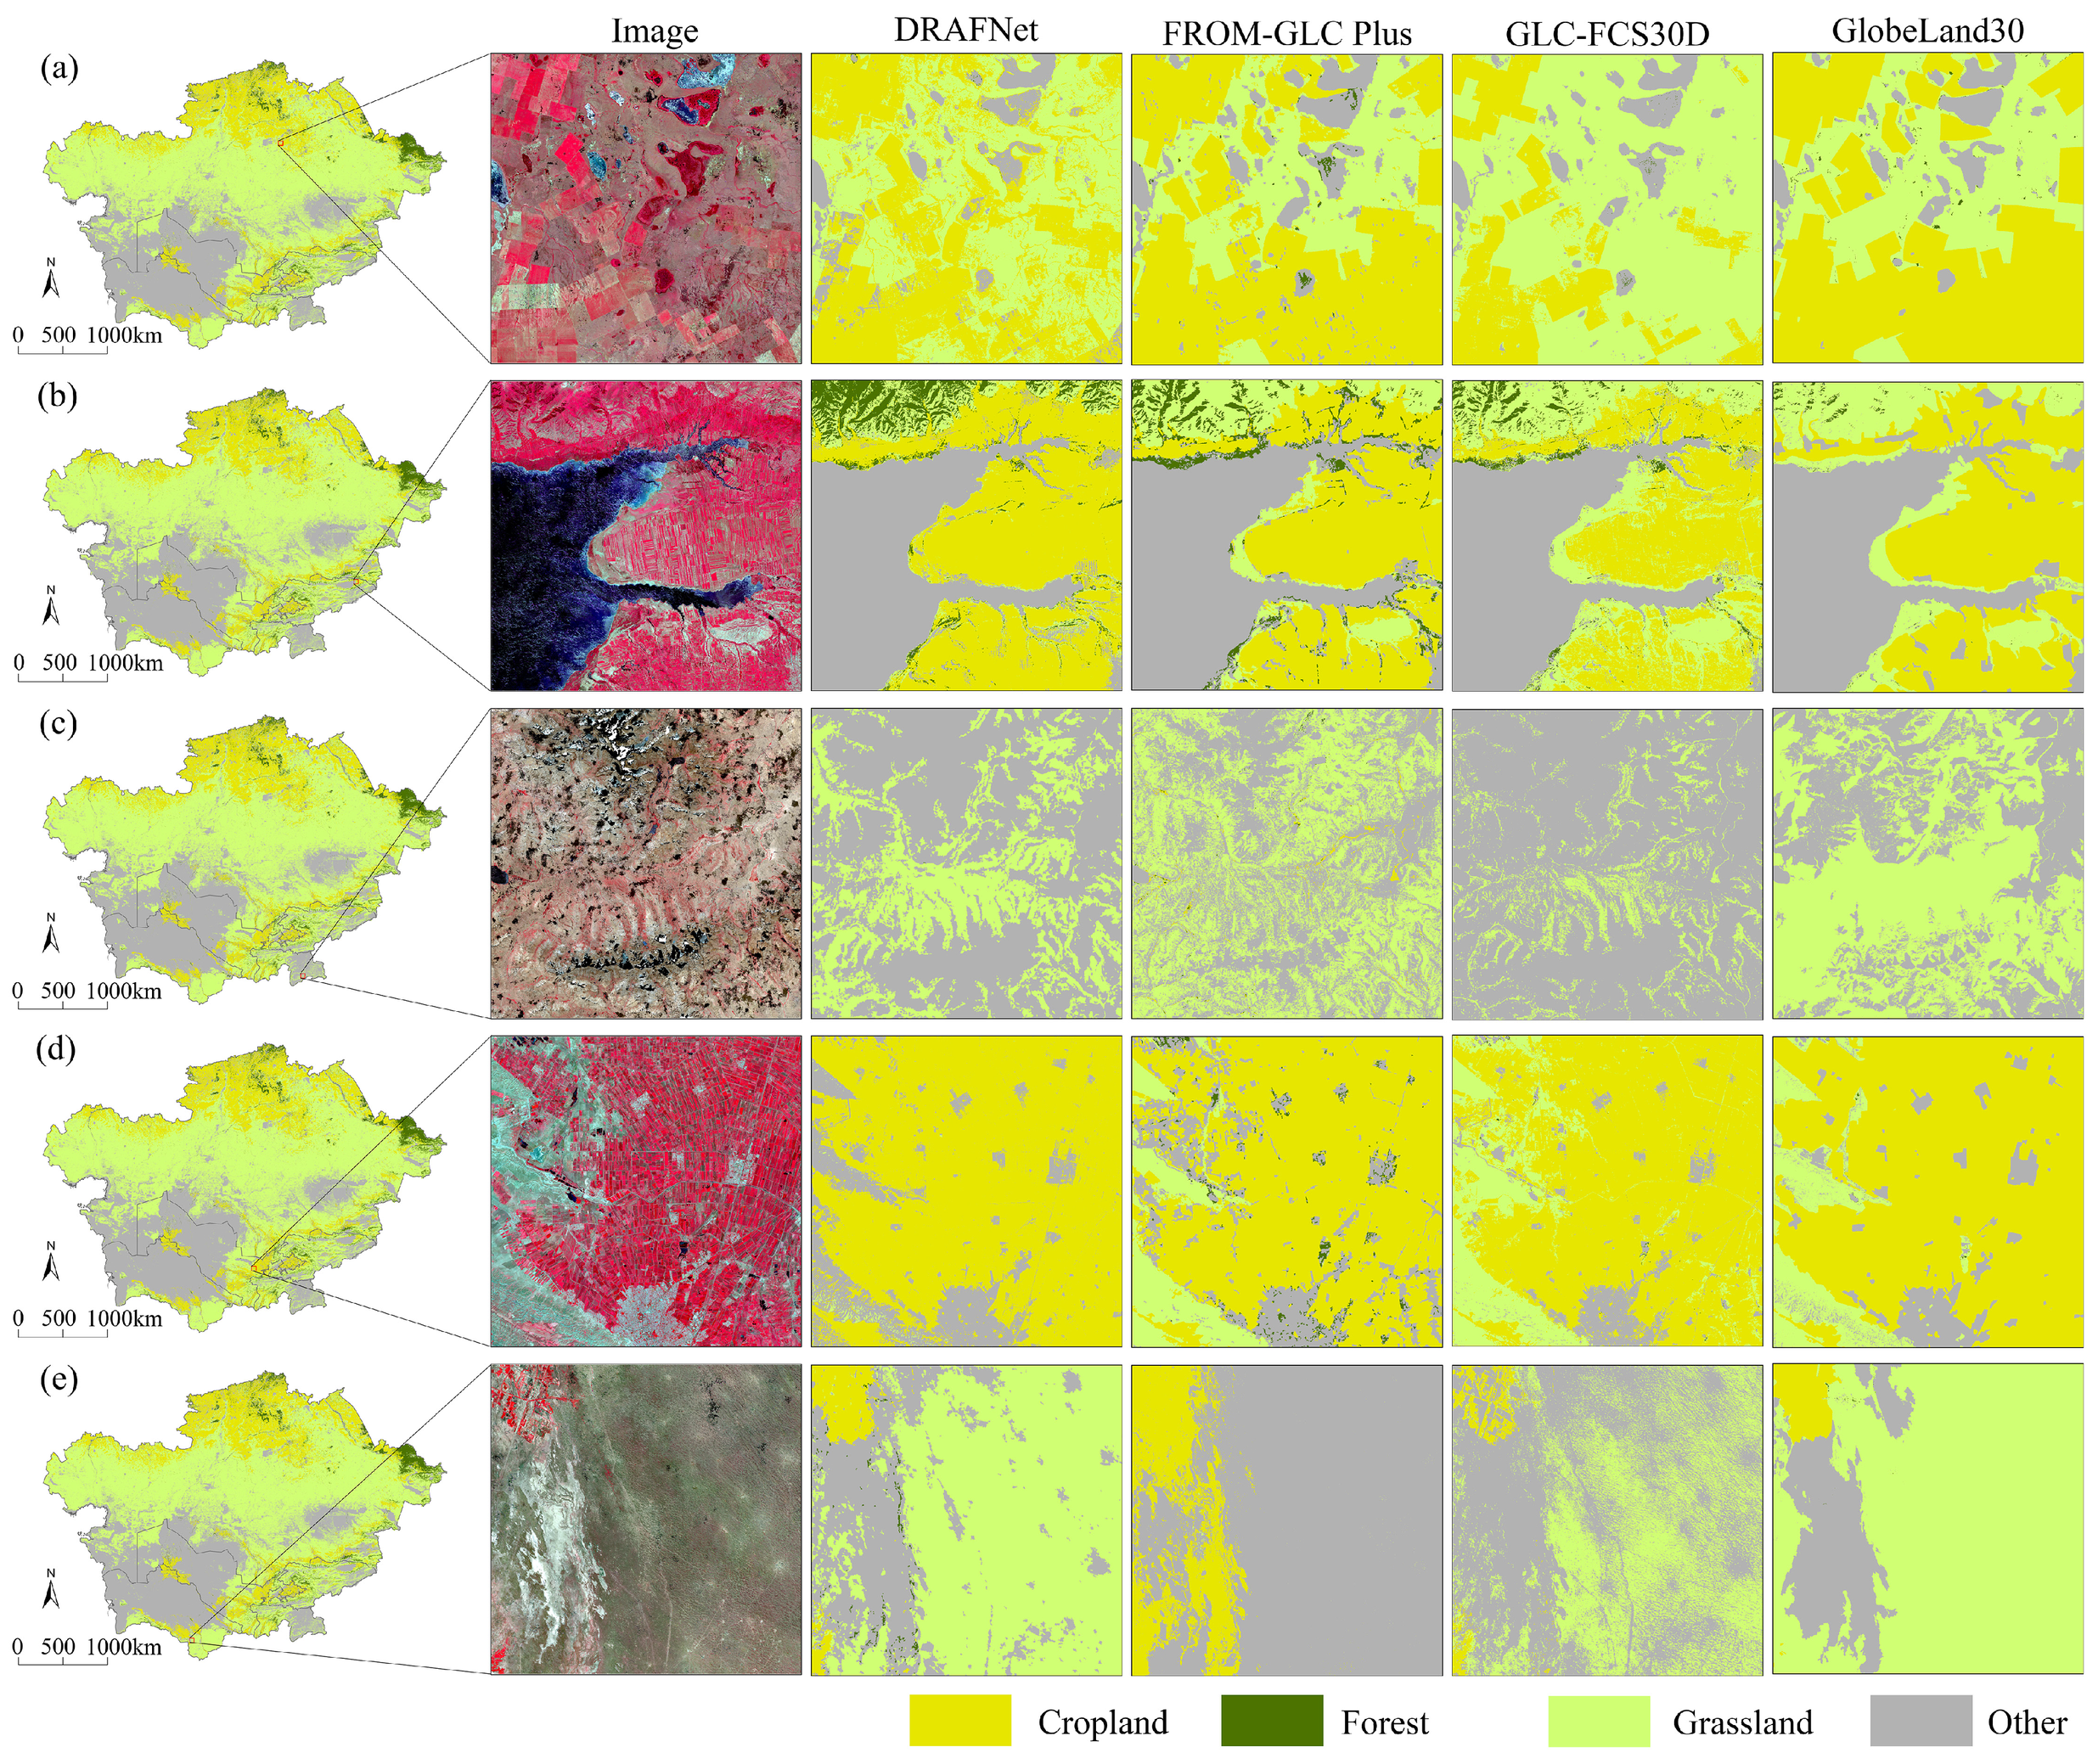
The local comparisons in Figure 9 indicate that DRAFNet produces more coherent representations of cropland, forestland, and grassland than the individual source products. The fused result generally preserves the continuity of the principal land-class patterns while reducing local fragmentation and boundary displacement. Its spatial patterns also correspond more closely to the textures and visible land-surface structures in the reference imagery.
Figure 9.
Local-scale spatial comparison between the fused result and the source products: (a) cropland-dominated area; (b) forestland–grassland mosaic; (c) forestland–grassland mosaic; (d) cropland-dominated area; and (e) arid and semi-arid grassland area.
In the cropland-dominated areas shown in Figure 9a,d, some source products overgeneralize the extent of cropland or produce fragmented field patterns. DRAFNet retains more contiguous cropland patches and delineates internal field structures and boundaries more clearly. In the forestland–grassland mosaics shown in Figure 9b,c, the source products differ markedly along mountain margins, valleys, and hillslopes. DRAFNet produces more continuous class transitions and better maintains the terrain-related spatial textures visible in the reference imagery.
The largest visual differences among the source products occur in the arid and semi-arid grassland area shown in Figure 9e. DRAFNet retains the dominant grassland distribution while reducing apparent overexpansion and excessive contraction relative to the reference imagery. Overall, the local comparisons indicate that the fused result improves the spatial continuity and boundary representation of key land classes, particularly in heterogeneous landscapes and transition zones characterized by pronounced inter-product disagreement. These improvements increase the practical utility of the resulting maps for regional cropland, forestland, and grassland assessment.
3.3. Mechanism Assessment and Regional Performance
3.3.1. Ablation Analysis
The complete DRAFNet model outperformed all ablated variants across OA, Kappa, mIoU, and Macro F1 (Table 4), indicating that each evaluated component contributed to the fusion performance.
Table 4.
Results of the DRAFNet ablation experiments.
Removing the residual expert caused the largest degradation, reducing mIoU from 0.7046 to 0.6254, while OA and Macro F1 declined to 0.7699 and 0.7675, respectively. This result indicates that reweighting the source-product decisions alone is insufficient when their class assignments are unreliable or when all source products make the same error. The residual expert provides an alternative class-probability distribution that enables correction beyond the available source-product decisions.
Removing reliability calibration and low-reliability weight transfer reduced mIoU to 0.6943 and 0.6940, respectively. The similar magnitudes of these reductions support the complementary roles of these operations within RADF: reliability calibration attenuates source-product decisions with low estimated reliability, whereas weight transfer reallocates the attenuated contribution to the residual expert instead of discarding it.
Removing the reliability-supervision loss reduced mIoU to 0.6986. Because this ablation changes the supervision of the Reliability head without removing the decision-fusion architecture, the decline indicates that explicit correctness-based targets improve the reliability estimates used for weight calibration. Overall, the ablation results show that DRAFNet benefits from the coordinated operation of reliability estimation, weight calibration, weight transfer, and residual correction rather than from any single component alone.
3.3.2. Source-Decision Scenario Analysis
Table 5 summarizes DRAFNet performance in the two difficult source-decision settings targeted by RADF. In the product-disagreement subset, DRAFNet achieved an OA of 0.7858 ± 0.0049, whereas the individual source-product OAs ranged from 0.3828 to 0.6117. When all three source products agreed on the same incorrect class, DRAFNet achieved an OA of 0.3644 ± 0.0476; because no source product was correct by definition in this subset, this value represents the correction rate for shared source-product errors. In the complementary subset in which all source products agreed and were correct, DRAFNet retained 0.9649 ± 0.0085 of the correct consensus decisions.
Table 5.
DRAFNet performance under source-product disagreement and shared-error conditions.
3.3.3. Country-Level Accuracy
The country-level results reveal geographic variation in DRAFNet performance across the study area (Table 6). Kyrgyzstan achieved the highest OA, Kappa, mIoU, and Macro F1 values of 0.8692, 0.8254, 0.7687, and 0.8687, respectively. Uzbekistan followed, with corresponding values of 0.8372, 0.7794, 0.7254, and 0.8398. Kazakhstan and Tajikistan had lower mIoU values of 0.6718 and 0.6554, respectively.
Table 6.
Pixel-level accuracy of DRAFNet across the five Central Asian countries.
These differences are consistent with country-specific variations in land-cover composition, class-transition complexity, and agreement among the source products. Nevertheless, OA remained above 0.79 in all five countries, and no country showed a pronounced deterioration across the overall metrics. The results therefore indicate broadly stable performance across the national settings represented within the study area, supporting the production of spatially continuous land-class information for transboundary land-resource assessment and ecological management.
3.4. Area Agreement and Computational Efficiency
DRAFNet showed closer aggregate agreement with the FAO area statistics than the three source products (Table 7). Its mean and median absolute log-ratio (LR) deviations across cropland, forestland, and grassland were 0.618 and 0.450, respectively, both lower than those of FROM-GLC Plus, GLC-FCS30D, and GlobeLand30. This result suggests closer country–class area consistency in a supplementary comparison. Because FAO statistics and remote-sensing-derived areas may differ in class definitions, reporting years, reporting practices, spatial bases, and treatment of mixed pixels, the comparison was interpreted as a complementary assessment of aggregate area consistency.
Table 7.
Overall absolute log-ratio deviations.
The country–class LR deviations varied considerably among the source products and DRAFNet (Table 8). DRAFNet was not the closest to the FAO statistics for every country–class combination but reduced several relatively large deviations. For example, its absolute LR deviation for forestland in Kyrgyzstan was 0.177, compared with 0.623 for FROM-GLC Plus, 1.195 for GLC-FCS30D, and 0.212 for GlobeLand30. The lower mean and median deviations therefore indicate an overall reduction in area bias rather than uniform improvement in every individual comparison.
Table 8.
Comparison of country–class-level log-ratio deviations.
DRAFNet contained 20.02 million parameters, required 27.43 GFLOPs, and completed full-region inference in 0.46 h (Table 9). Its inference time was comparable to that of several lighter benchmark models, while it achieved the highest test mIoU. These results indicate that the improvement in fusion performance was obtained without a disproportionate increase in computational cost.
Table 9.
Comparison of model efficiency and complexity.
4. Discussion
4.1. Reliability-Adaptive Fusion and Class-Specific Performance
Cropland, forestland, and grassland are central to land-resource use and ecological security in Central Asia, but their spatial extent and boundaries differ among existing land-cover products because of differences in input data, classification systems, and mapping procedures [41,42]. In this setting, inter-product disagreement is useful for locating questionable class assignments but does not identify which source product is correct. Conversely, agreement among the products does not guarantee correctness because they may share similar errors.
DRAFNet addresses these two situations by combining disagreement-aware feature learning with reliability-adaptive decision fusion. Voting entropy identifies pixels that require greater attention, while the environmental stream provides moisture, thermal, and topographic context for interpreting ambiguous source-product decisions. RADF then estimates the reliability of the class assigned by each source product and divides each product’s initial routing weight into a retained contribution and a portion transferred to the residual expert. DRAFNet differs from conventional fusion methods and general-purpose segmentation networks at the decision level. For each pixel, the Reliability head estimates the reliability of the class assigned by each source product and uses this estimate to calibrate the corresponding routing weight. The attenuated part of the routing weight is then transferred to the residual expert, which provides an alternative prediction. Conventional voting and region-based weighting do not model reliability jointly by source product, location, and assigned class. General-purpose segmentation networks learn a direct prediction from stacked inputs, but do not explicitly retain the source-product decisions or use reliability-guided weight transfer to correct unreliable decisions.
The ablation results support this interpretation. Removing the residual expert caused the largest performance decline, indicating that source-product reweighting alone cannot resolve errors shared by all input products. The reductions caused by removing reliability calibration or weight transfer show the complementary roles of suppressing an unreliable decision and strengthening the alternative correction pathway. The smaller but consistent effect of removing reliability supervision further indicates that correctness-based targets improve the reliability signals used in the fusion process. Because the encoder–decoder structure was unchanged across these ablations, the performance declines indicate that the gain was not due to feature extraction alone; reliability calibration, weight transfer, and residual correction also contributed.
The source-decision scenario results complement the ablation findings. DRAFNet improved performance in areas of source-product disagreement and corrected a proportion of cases in which all source products assigned the same incorrect class. These results are consistent with the intended reliability-adaptive decision process, in which routing weights retain or attenuate source-product decisions and the residual expert provides an alternative prediction when correction is required.
Recent studies using similar multi-source fusion frameworks provide useful quantitative context. Yang et al. [43] reported an OA of 0.869, a Kappa coefficient of 0.813, and an IoU of 0.718 for multi-source LULC fusion, while Hu et al. [44] achieved an OA of 89.8% and a cropland F1-score of 0.853 in global cropland mapping. In a related decision-level setting, Luo et al. [45] improved OA from 95.37% to 95.99% and mIoU from 80.38% to 81.13% through Bayesian fusion. Although direct comparison is limited by differences in study areas, class systems, and validation protocols, these results provide useful context for interpreting the performance of DRAFNet.
Performance nevertheless varied among land classes. Cropland and forestland generally have more distinct spatial structures and environmental associations, which facilitate relatively stable delineation. Grassland is widely distributed across heterogeneous arid and semi-arid transition zones and is readily confused with bare land, sparse vegetation, and shrubland. Variation in vegetation cover and growth conditions further increases this ambiguity. The remaining uncertainty in grassland therefore reflects not only model limitations but also its ecological heterogeneity, spatial fragmentation, and lower agreement among the source products. Improving its delineation remains important for grassland-resource and carrying-capacity assessments.
4.2. Area Agreement and Practical Implications
Pixel-level accuracy remains the primary basis for evaluating the fused map, while country–class area comparison provides an additional perspective on aggregate consistency [46,47]. In this supplementary comparison, the lower mean and median absolute LR deviations obtained by DRAFNet suggest closer agreement with the FAO statistics. However, DRAFNet was not closer to the statistical area in every country–class combination, and the result should not be interpreted as a systematic correction of all source-product area biases. The remaining area deviations can be explained by several factors. Statistical and remotely sensed areas may differ in class definitions, reporting years, reporting practices, spatial bases, and treatment of mixed pixels [48,49]. For example, FAO cropland, forestland, and grassland statistics may reflect administrative reporting, land-use criteria, management status, or national inventory rules, whereas remote-sensing products represent land-cover classes inferred from 30 m pixels. Discrepancies may also arise from sparse vegetation, shrub–grass transitions, irrigated oasis mosaics, mountainous terrain, mixed pixels, temporal mismatch, and uncertainty in national statistics. The two forms of information are therefore better viewed as complementary: remote-sensing products provide spatially explicit class distributions, whereas statistical records provide independently compiled aggregate quantities. Improved agreement with FAO statistics may increase the practical usefulness of the fused maps for regional resource assessment, but it does not make the two data sources interchangeable.
4.3. Limitations and Future Directions
Several limitations remain. First, the reference samples were derived from visual interpretation of high-resolution Google Earth imagery and were not verified by field observations. Interpretation uncertainty is likely to be greater in heterogeneous transition zones, particularly where low-cover grassland, sparse vegetation, shrubland, and bare land have gradual or visually similar boundaries. Such uncertainty may introduce label noise into both model training and performance evaluation. During training, an incorrect or ambiguous reference label may affect the learned class boundaries and the supervision of the Reliability head, whose target depends on whether a source-product decision matches the reference label. During evaluation, interpretation errors may affect the reported class-specific and overall accuracy metrics, especially when the performance differences between methods are small. Although all methods were trained and evaluated using the same data splits and reference-labeling protocol, providing a consistent basis for comparison, this does not eliminate possible systematic interpretation bias. The reported accuracy differences should therefore be interpreted with this limitation in mind. Second, the analysis was limited to 2020. Therefore, the present results do not demonstrate the temporal stability of DRAFNet, its transferability to other years, or its transferability to regions outside Central Asia. The country-level results characterize spatial consistency within the five Central Asian countries included in the study area, rather than cross-region or cross-year transferability. Third, the geo-environmental variables mainly describe long-term climatic conditions and static terrain. They may provide weaker constraints where land-cover patterns are strongly modified by irrigation, land-use intensity, or other human activities. The reliability estimates were used as adaptive decision signals but were not independently evaluated as calibrated probabilities and should not yet be interpreted as formal uncertainty measures.
Future research could incorporate multiyear land-cover products, time-series remote-sensing features, and independent regions to evaluate temporal stability, cross-year transferability, and cross-region generalization. In addition, advanced AI architectures, such as temporal Transformers, vision foundation models, and uncertainty-aware networks, could be explored to improve multiyear feature representation and transferability, while explainable AI methods could help interpret reliability estimates, residual-expert corrections, and class-specific fusion decisions. Future validation should combine higher-resolution imagery and field observations with independent interpretation by multiple analysts. Where field observations are unavailable, inter-interpreter agreement assessment and repeated interpretation could be used to quantify label uncertainty and identify samples requiring further verification. Additional regional samples would also improve discrimination among grassland, sparse vegetation, shrubland, and bare land, while dynamic indicators of irrigation and human activity could strengthen the environmental representation of intensively managed areas. Independent calibration of the reliability estimates could also support the development of spatial uncertainty products and confidence-weighted area estimates for cropland-resource accounting, forest-cover monitoring, grassland carrying-capacity assessment, and land-degradation analysis.
5. Conclusions
This study formulated multi-product land-cover fusion as a spatially varying and class-specific reliability decision problem and developed DRAFNet to improve the representation of cropland, forestland, and grassland across arid and semi-arid Central Asia. The model combines three 30 m land-cover products with regional moisture, thermal, and topographic information and uses source-product reliability estimation, adaptive weight transfer, and residual correction to resolve inconsistent class assignments. The main conclusions are as follows: (1) DRAFNet achieved OA, Kappa, mIoU, and Macro F1 values of 0.8275, 0.7698, 0.7046, and 0.8241, respectively, outperforming the individual source products and all benchmark methods. The class-wise and local spatial comparisons also showed balanced performance across the target classes, together with more spatially coherent patterns and clearer boundary delineation in areas of pronounced inter-product disagreement. (2) The ablation results showed that reliability estimation, weight calibration, low-reliability weight transfer, and residual correction jointly contributed to the performance improvement, supporting the reliability-adaptive decision design. (3) DRAFNet maintained OA values above 0.79 in all five countries, indicating broadly stable performance across the national settings represented within the study area. In the supplementary comparison with FAO statistics, its mean and median absolute LR deviations were 0.618 and 0.450, respectively, both lower than those of the individual source products, indicating closer aggregate area consistency. Full-region inference required 0.46 h, showing that the improvement was achieved at an acceptable computational cost. DRAFNet therefore provides a practical approach for generating spatially coherent information on key land classes to support land-resource assessment and ecological management in Central Asia.
Supplementary Materials
The following supporting information can be downloaded at: https://www.mdpi.com/article/10.3390/rs18172894/s1, File S1: The source code and implementation details of the proposed DRAFNet are provided as Supplementary Material.
Author Contributions
L.F.: conceptualization, data curation, formal analysis, investigation, methodology, writing—original draft; Y.Z.: conceptualization, funding acquisition, project administration, resources, supervision, writing—review and editing; B.L.: data curation, formal analysis, validation, visualization; S.Z.: formal analysis, supervision, writing—review and editing; H.C.: data curation, supervision, visualization. All authors have read and agreed to the published version of the manuscript.
Funding
This research was funded by the Science and Technology Basic Resources Investigation Program of China (Grant No. 2022FY101901-2).
Data Availability Statement
The raw data supporting the conclusions of this article will be made available by the authors on request.
Conflicts of Interest
The authors declare no conflicts of interest.
References
- Ding, Q.; Wang, L.; Fu, M. Spatial characteristics and trade-offs of ecosystem services in arid Central Asia. Ecol. Indic. 2024, 161, 111935. [Google Scholar] [CrossRef] [Scilit]
- Song, S.; Chen, X.; Zan, C.; Zhang, H.; Wang, C.; Hu, Z.; Li, Y. Integrated spatial priority assessment in Central Asia: Bridging biodiversity, ecosystem services, and human activities. Geogr. Sustain. 2025, 6, 100231. [Google Scholar] [CrossRef] [Scilit]
- Uereyen, S.; Klein, I.; Eisfelder, C.; Kuenzer, C. Multivariate analysis of land surface dynamics in Central Asia: Patterns of trends and drivers under a changing climate. GISci. Remote Sens. 2024, 61, 2364461. [Google Scholar] [CrossRef] [Scilit]
- Nandintsetseg, B.; Chang, J.; Sen, O.L.; Reyer, C.P.O.; Kong, K.; Yetemen, O.; Ciais, P.; Davaadalai, J. Future drought risk and adaptation of pastoralism in Eurasian rangelands. npj Clim. Atmos. Sci. 2024, 7, 82. [Google Scholar] [CrossRef] [Scilit]
- Peña-Guerrero, M.D.; Senay, G.B.; Umirbekov, A.; Tarasova, L.; Rufin, P.; Pulatov, B.; Müller, D. Climate change has increased crop water consumption in Central Asia despite less water-intensive cropping. Commun. Earth Environ. 2026, 7, 122. [Google Scholar] [CrossRef] [Scilit]
- Saidaliyeva, Z.; Muccione, V.; Shahgedanova, M.; Bigler, S.; Adler, C.; Yapiyev, V. Adaptation to climate change in the mountain regions of Central Asia: A systematic literature review. WIREs Clim. Change 2024, 15, e891. [Google Scholar] [CrossRef] [Scilit]
- Kolluru, V.; John, R.; Chen, J.; Konkathi, P.; Kolluru, S.; Saraf, S.; Henebry, G.M.; Xiao, J.; Jain, K.; Kussainova, M. Dominant role of grazing and snow cover variability on vegetation shifts in the drylands of Kazakhstan. Commun. Earth Environ. 2024, 5, 424. [Google Scholar] [CrossRef] [Scilit]
- Parente, L.; Sloat, L.; Mesquita, V.; Consoli, D.; Stanimirova, R.; Hengl, T.; Bonannella, C.; Teles, N.; Wheeler, I.; Hunter, M.; et al. Annual 30-m maps of global grassland class and extent (2000–2022) based on spatiotemporal machine learning. Sci. Data 2024, 11, 1303. [Google Scholar] [CrossRef] [Scilit]
- Potapov, P.; Turubanova, S.; Hansen, M.C.; Tyukavina, A.; Zalles, V.; Khan, A.; Song, X.P.; Pickens, A.; Shen, Q.; Cortez, J. Global maps of cropland extent and change show accelerated cropland expansion in the twenty-first century. Nat. Food 2022, 3, 19–28. [Google Scholar] [CrossRef] [Scilit] [PubMed]
- Liang, H.; Jiapaer, G.; Chang, C.; Yu, T.; Zhang, L.; Feng, P.; Lin, K.; Ju, T.; Jiang, X.; De Maeyer, P.; et al. Vegetation in Central Asia is more sensitive to soil moisture stress than to precipitation and vapor pressure deficit stresses. Agric. For. Meteorol. 2026, 383, 111140. [Google Scholar] [CrossRef] [Scilit]
- Li, J.; Chen, X.; De Maeyer, P.; Van de Voorde, T.; Li, Y. Modulating shrub-grassland proportion to improve ecosystem services and advance SDGs in the Alpine Basin of Central Asia. GISci. Remote Sens. 2026, 63, 2646566. [Google Scholar] [CrossRef] [Scilit]
- Naboureh, A.; Li, A.; Bian, J.; Moharrami, M.; Ebrahimy, H.; Lei, G.; Nan, X.; Zhang, Z.; Feizizadeh, B.; Dabove, P.; et al. Accuracies, discrepancies, and challenges of the 10 m global land cover products in mountains. GISci. Remote Sens. 2025, 62, 2556064. [Google Scholar] [CrossRef] [Scilit]
- Xu, P.; Tsendbazar, N.E.; Herold, M.; de Bruin, S.; Koopmans, M.; Birch, T.; Carter, S.; Fritz, S.; Lesiv, M.; Mazur, E.; et al. Comparative validation of recent 10 m-resolution global land cover maps. Remote Sens. Environ. 2024, 311, 114316. [Google Scholar] [CrossRef] [Scilit]
- Li, Z.; White, J.C.; Wulder, M.A.; Hermosilla, T.; Davidson, A.M.; Comber, A.J. Land cover harmonization using latent Dirichlet allocation. Int. J. Geogr. Inf. Sci. 2021, 35, 348–374. [Google Scholar] [CrossRef] [Scilit]
- Li, B.; Xu, X.; Liu, X.; Shi, Q.; Zhuang, H.; Cai, Y.; He, D. An improved global land cover mapping in 2015 with 30 m resolution (GLC-2015) based on a multisource product-fusion approach. Earth Syst. Sci. Data 2023, 15, 2347–2373. [Google Scholar] [CrossRef] [Scilit]
- Li, K.; Wang, J. A multi-source data fusion method for land cover production: A case study of the East European Plain. Int. J. Digit. Earth 2024, 17, 2339360. [Google Scholar] [CrossRef] [Scilit]
- Pérez-Hoyos, A.; Udías, A.; Rembold, F. Integrating multiple land cover maps through a multi-criteria analysis to improve agricultural monitoring in Africa. Int. J. Appl. Earth Obs. Geoinf. 2020, 88, 102064. [Google Scholar] [CrossRef] [Scilit]
- Kerner, H.; Nakalembe, C.; Yang, A.; Zvonkov, I.; McWeeny, R.; Tseng, G.; Becker-Reshef, I. How accurate are existing land cover maps for agriculture in Sub-Saharan Africa? Sci. Data 2024, 11, 486. [Google Scholar] [CrossRef] [Scilit]
- Witjes, M.; Herold, M.; de Bruin, S. Iterative mapping of probabilities: A data fusion framework for generating accurate land cover maps that match area statistics. Int. J. Appl. Earth Obs. Geoinf. 2024, 131, 103932. [Google Scholar] [CrossRef] [Scilit]
- Peng, X.; He, G.; Long, T.; Yin, R.; Wang, G.; Wang, J. A higher accuracy forest cover product of China by fusing heterogeneous forest-related datasets using Dempster–Shafer theory. Int. J. Digit. Earth 2024, 17, 1–20. [Google Scholar] [CrossRef] [Scilit]
- Yin, X.; Jiang, W.; Yang, Z.; Ling, Z.; Tsendbazar, N.E.; Hou, P.; Deng, Y.; Wang, X.; Xiao, Z.; Li, X.; et al. Hybrid wetland city map: Improved wetland characterization through the synergy of global land cover products. Int. J. Appl. Earth Obs. Geoinf. 2026, 146, 104994. [Google Scholar] [CrossRef] [Scilit]
- Zhang, W.; Wang, J.; Lin, H.; Cong, M.; Wan, Y.; Zhang, J. Fusing multiple land cover products based on locally estimated map-reference cover type transition probabilities. Remote Sens. 2023, 15, 481. [Google Scholar] [CrossRef] [Scilit]
- Cui, Y.; Zhao, C.; Pan, Y.; Ma, K.; Liu, X.; Gu, X. Decoding spatial consistency of multi-source land cover products in China: Insights from heterogeneous landscapes. Int. J. Appl. Earth Obs. Geoinf. 2025, 139, 104529. [Google Scholar] [CrossRef] [Scilit]
- Song, L.; Estes, A.B.; Estes, L.D. A super-ensemble approach to map land cover types with high resolution over data-sparse African savanna landscapes. Int. J. Appl. Earth Obs. Geoinf. 2023, 116, 103152. [Google Scholar] [CrossRef] [Scilit]
- Li, J.; Hong, D.; Gao, L.; Yao, J.; Zheng, K.; Zhang, B.; Chanussot, J. Deep learning in multimodal remote sensing data fusion: A comprehensive review. Int. J. Appl. Earth Obs. Geoinf. 2022, 112, 102926. [Google Scholar] [CrossRef] [Scilit]
- Liu, X.; Zou, H.; Wang, S.; Lin, Y.; Zuo, X. Joint network combining dual-attention fusion modality and two specific modalities for land cover classification using optical and SAR images. IEEE J. Sel. Top. Appl. Earth Obs. Remote Sens. 2024, 17, 3236–3250. [Google Scholar] [CrossRef] [Scilit]
- Roy, S.K.; Deria, A.; Hong, D.; Rasti, B.; Plaza, A.; Chanussot, J. Multimodal fusion transformer for remote sensing image classification. IEEE Trans. Geosci. Remote Sens. 2023, 61, 1–20. [Google Scholar] [CrossRef] [Scilit]
- Chen, Y.; Zhang, G.; Cui, H.; Li, X.; Hou, S.; Zhu, C.; Xie, Z.; Li, D. Superpixel-aware credible dual-expert learning for land cover mapping using historical land cover product. ISPRS J. Photogramm. Remote Sens. 2025, 223, 296–316. [Google Scholar] [CrossRef] [Scilit]
- Hu, Q.; Han, Z. Northward expansion of desert climate in Central Asia in recent decades. Geophys. Res. Lett. 2022, 49, e2022GL098895. [Google Scholar] [CrossRef] [Scilit]
- Khazieva, E.; Malek, Ž.; Verburg, P.H. A multi-data approach to evaluate progress towards land degradation neutrality in Central Asia. Ecol. Indic. 2023, 154, 110529. [Google Scholar] [CrossRef] [Scilit]
- Raab, C.; Spies, M. Characterising cropland fragmentation in post-Soviet Central Asia using Landsat remote-sensing time-series data. Appl. Geogr. 2023, 156, 102968. [Google Scholar] [CrossRef] [Scilit]
- Saidaliyeva, Z.; Shahgedanova, M.; Yapiyev, V.; Wade, A.J.; Akbarov, F.; Esenaman uulu, M.; Kalashnikova, O.; Kapitsa, V.; Kasatkin, N.; Rakhimov, I.; et al. Precipitation in the mountains of Central Asia: Isotopic composition and source regions. Atmos. Chem. Phys. 2024, 24, 12203–12224. [Google Scholar] [CrossRef] [Scilit]
- Yu, L.; Du, Z.; Li, X.; Gu, J.; Li, X.; Zhong, L.; Duojiweise; Wu, H.; Zhao, Q.; Ma, X.; et al. FROM-GLC Plus 3.0: Multimodal land change mapping with SAM and dense surface observations. J. Remote Sens. 2025, 5, 0728. [Google Scholar] [CrossRef] [Scilit]
- Zhang, X.; Zhao, T.; Xu, H.; Liu, W.; Wang, J.; Chen, X.; Liu, L. GLC_FCS30D: The first global 30 m land-cover dynamics monitoring product with a fine classification system for the period from 1985 to 2022 generated using dense-time-series Landsat imagery and the continuous change-detection method. Earth Syst. Sci. Data 2024, 16, 1353–1381. [Google Scholar] [CrossRef] [Scilit]
- Chen, J.; Chen, J.; Liao, A.; Cao, X.; Chen, L.; Chen, X.; He, C.; Han, G.; Peng, S.; Lu, M.; et al. Global land cover mapping at 30 m resolution: A POK-based operational approach. ISPRS J. Photogramm. Remote Sens. 2015, 103, 7–27. [Google Scholar] [CrossRef] [Scilit]
- Zomer, R.J.; Xu, J.; Trabucco, A. Version 3 of the Global Aridity Index and Potential Evapotranspiration Database. Sci. Data 2022, 9, 409. [Google Scholar] [CrossRef] [Scilit]
- Fick, S.E.; Hijmans, R.J. WorldClim 2: New 1-km spatial resolution climate surfaces for global land areas. Int. J. Climatol. 2017, 37, 4302–4315. [Google Scholar] [CrossRef] [Scilit]
- NASA Jet Propulsion Laboratory. NASADEM Merged DEM Global 1 Arc Second V001, Version 001; NASA EOSDIS Land Processes DAAC: Sioux Falls, SD, USA, 2020. [CrossRef]
- Hodson, T.O.; Over, T.M.; Smith, T.J.; Marshall, L.M. How to select an objective function using information theory. Water Resour. Res. 2024, 60, e2023WR035803. [Google Scholar] [CrossRef] [Scilit]
- Nakagawa, S.; Noble, D.W.A.; Lagisz, M.; Spake, R.; Viechtbauer, W.; Senior, A.M. A robust and readily implementable method for the meta-analysis of response ratios with and without missing standard deviations. Ecol. Lett. 2023, 26, 232–244. [Google Scholar] [CrossRef] [Scilit]
- Brown, C.F.; Brumby, S.P.; Guzder-Williams, B.; Birch, T.; Hyde, S.B.; Mazzariello, J.; Czerwinski, W.; Pasquarella, V.J.; Haertel, R.; Ilyushchenko, S.; et al. Dynamic World, near real-time global 10 m land use land cover mapping. Sci. Data 2022, 9, 251. [Google Scholar] [CrossRef] [Scilit]
- Tsendbazar, N.; Herold, M.; Li, L.; Tarko, A.; de Bruin, S.; Masiliunas, D.; Lesiv, M.; Fritz, S.; Buchhorn, M.; Smets, B.; et al. Towards operational validation of annual global land cover maps. Remote Sens. Environ. 2021, 266, 112686. [Google Scholar] [CrossRef] [Scilit]
- Yang, J.; Jiang, Y.; Song, Q.; Wang, Z.; Hu, Y.; Li, K.; Sun, Y. An Approach for Multi-Source Land Use and Land Cover Data Fusion Considering Spatial Correlations. Remote Sens. 2025, 17, 1131. [Google Scholar] [CrossRef] [Scilit]
- Hu, Q.; Cai, Z.; You, L.; Fritz, S.; Zhang, X.; Yin, H.; Wei, H.; Yang, J.; Li, Z.; Yu, Q.; et al. Hcropland30: A hybrid 30-m global cropland map generated by leveraging global land cover products and Landsat data via deep learning. Remote Sens. Environ. 2026, 344, 115552. [Google Scholar] [CrossRef] [Scilit]
- Luo, J.; Zhao, Y.; Xuan, M.; Zheng, J.; Zhou, Y.; Liu, X. Investigating Very-High-Resolution Land Cover Mapping in the Pearl River Delta with Remote Sensing Foundation Models and Multi-Source Data Bayesian Fusion. Remote Sens. 2026, 18, 897. [Google Scholar] [CrossRef] [Scilit]
- Tubiello, F.N.; Conchedda, G.; Casse, L.; Hao, P.; De Santis, G.; Chen, Z. A new cropland area database by country circa 2020. Earth Syst. Sci. Data 2023, 15, 4997–5015. [Google Scholar] [CrossRef] [Scilit]
- Du, Z.; Yu, L.; Li, X.; Zhao, J.; Chen, X.; Xu, Y.; Yang, P.; Yang, J.; Peng, D.; Xue, Y.; et al. Integrating remote sensing temporal trajectory and survey statistics to update land use/land cover maps. Int. J. Digit. Earth 2023, 16, 4428–4445. [Google Scholar] [CrossRef] [Scilit]
- Kebede, E.A.; Abou Ali, H.; Clavelle, T.; Froehlich, H.E.; Gephart, J.A.; Hartman, S.; Herrero, M.; Kerner, H.; Mehta, P.; Nakalembe, C.; et al. Assessing and addressing the global state of food production data scarcity. Nat. Rev. Earth Environ. 2024, 5, 295–311. [Google Scholar] [CrossRef] [Scilit]
- Johnson, B.A.; Umemiya, C.; Magcale-Macandog, D.B.; Estoque, R.C.; Hayashi, M.; Tadono, T. Better monitoring of forests according to FAO’s definitions through map integration: Significance and limitations in the context of global environmental goals. Int. J. Appl. Earth Obs. Geoinf. 2023, 122, 103452. [Google Scholar] [CrossRef] [Scilit]

Disclaimer/Publisher’s Note: The statements, opinions and data contained in all publications are solely those of the individual author(s) and contributor(s) and not of MDPI and/or the editor(s). MDPI and/or the editor(s) disclaim responsibility for any injury to people or property resulting from any ideas, methods, instructions or products referred to in the content. |
© 2026 by the authors. Licensee MDPI, Basel, Switzerland. This article is an open access article distributed under the terms and conditions of the Creative Commons Attribution (CC BY) license.