Topic Editors

School of Artificial Intelligence, Shenzhen Polytechnic University, Shenzhen 518055, China
College of Geography and Remote Sensing Sciences, Xinjiang University, Urumqi 830017, China
College of Geography and Remote Sensing Sciences, Xinjiang University, Urumqi 800017, China
Dr. Ivan Lizaga
Environmental Hydrology and Interactions with Climate and Human Activities, Instituto Pirenaico de Ecología (IPE-CSIC), Spanish National Research Council, Avenida Montañana, 50059 Zaragoza, Spain
MNR Key Laboratory for Geo-Environmental Monitoring of the Great Bay Area, Shenzhen University, Shenzhen 518060, China
School of Urban Design, Wuhan University, Wuhan 430072, China

Advances in Multi-Scale Geographic Environmental Monitoring: Ecosystem Differences and Multi-Scale Comparisons

Abstract submission deadline
31 May 2026
Manuscript submission deadline
31 August 2026
Viewed by
11502

Topic Information

Dear Colleagues,

The second volume of Advances in Multi-Scale Geographic Environmental Monitoring is dedicated to exploring the intricate dynamics of ecosystems and their responses to environmental changes through a multi-scale lens. This journal issue seeks to bridge the gap between ecosystem-specific studies and the broader understanding of ecological processes by emphasizing two central themes: ecosystem differences and multi-scale comparisons.

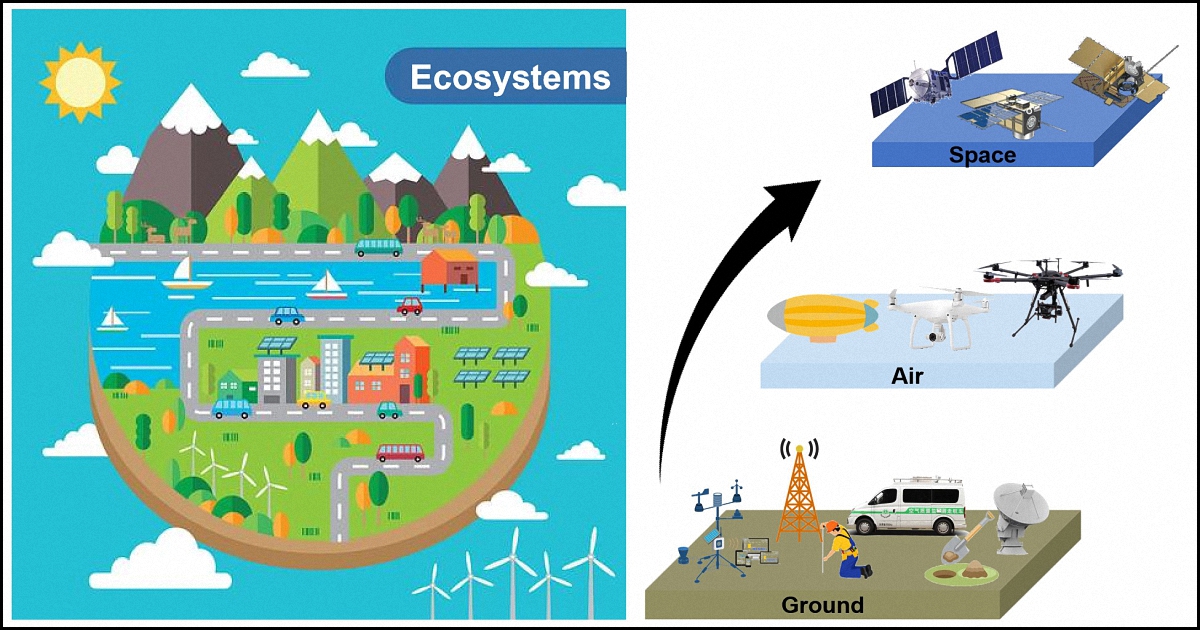
At its core, multi-scale geographic environmental monitoring involves the systematic observation and analysis of Earth's surface processes and human activities across varying spatial and temporal scales. By integrating data from global to local scales, this approach provides a comprehensive framework for understanding the complex interactions between natural systems and anthropogenic influences. The second volume builds on this foundation by focusing on the unique characteristics of different ecosystems—such as forests, wetlands, and urban areas—and how these ecosystems respond to environmental perturbations. Despite significant advancements in multi-scale monitoring, several critical gaps remain in the existing body of research. A notable limitation is the lack of comparative studies that span multiple ecosystems and scales, which hinders the ability to draw generalizable conclusions. Furthermore, current research often treats scales as isolated entities, failing to fully integrate them into a cohesive framework that captures the complexity of ecosystem processes. Another challenge lies in the limited application of advanced technologies, such as AI-driven remote sensing and IoT-enabled sensors, which, while promising, remain underutilized in multi-scale ecosystem studies. Future research directions aim to address these gaps while leveraging emerging technologies. A key priority is the development of cross-ecosystem frameworks that standardize methodologies for comparing ecosystems across scales. Enhancing scale integration is another critical focus, with efforts directed toward building models that explicitly account for scale dependencies and feedback mechanisms. Interdisciplinary collaboration will play a pivotal role in achieving these goals, fostering partnerships between ecologists, geographers, computer scientists, and policymakers to tackle complex environmental challenges. In light of the above, this topic aims to collect innovative original manuscripts on the theoretical, methodological, and applied aspects of multi-scale geographic environmental monitoring, especially concerning ecosystem differences and multi-scale comparisons. Review articles and meta-analysis papers on these topics are additionally welcome. Topics of interest include the following:

  • Multi-scale driving mechanisms of spatial heterogeneity in geographic environmental elements;
  • Coupled spatiotemporal modeling and validation of geographical environmental dynamics;
  • Reconstruction of holistic monitoring technology systems in the era of intelligent perception;
  • Multi-scale transmission and trade-off assessment of ecosystem service flows;
  • Simulation of multi-level interactive feedback in key land surface processes;
  • Identification of scale sensitivity thresholds in geographic environment research;
  • Assessment paradigms of environmental carrying capacity under human–land system coupling;
  • Cross-dimensional fusion and downscaling of multi-source heterogeneous geospatial big data;
  • Scale-based source analysis and error propagation models for uncertainties in geographic element monitoring.

Dr. Jingzhe Wang
Dr. Xiangyu Ge
Dr. Zipeng Zhang
Dr. Ivan Lizaga
Dr. Yinghui Zhang
Dr. Yangyi Wu
Topic Editors

Keywords

  • geographic environmental monitoring
  • remote sensing
  • scale effect
  • ecological response
  • climate change
  • geographic process
  • driving mechanism
  • spatiotemporal analysis
  • sustainable development goals

Participating Journals

Journal Name Impact Factor CiteScore Launched Year First Decision (median) APC
Agronomy
agronomy
3.4 6.7 2011 17 Days CHF 2600 Submit
Drones
drones
4.8 7.4 2017 20.8 Days CHF 2600 Submit
Geomatics
geomatics
2.8 5.1 2021 22.6 Days CHF 1200 Submit
ISPRS International Journal of Geo-Information
ijgi
2.8 7.2 2012 33.1 Days CHF 1900 Submit
Land
land
3.2 5.9 2012 17.5 Days CHF 2600 Submit
Remote Sensing
remotesensing
4.1 8.6 2009 24.3 Days CHF 2700 Submit

Preprints.org is a multidisciplinary platform offering a preprint service designed to facilitate the early sharing of your research. It supports and empowers your research journey from the very beginning.

MDPI Topics is collaborating with Preprints.org and has established a direct connection between MDPI journals and the platform. Authors are encouraged to take advantage of this opportunity by posting their preprints at Preprints.org prior to publication:

  1. Share your research immediately: disseminate your ideas prior to publication and establish priority for your work.
  2. Safeguard your intellectual contribution: Protect your ideas with a time-stamped preprint that serves as proof of your research timeline.
  3. Boost visibility and impact: Increase the reach and influence of your research by making it accessible to a global audience.
  4. Gain early feedback: Receive valuable input and insights from peers before submitting to a journal.
  5. Ensure broad indexing: Web of Science (Preprint Citation Index), Google Scholar, Crossref, SHARE, PrePubMed, Scilit and Europe PMC.

Published Papers (12 papers)

Order results
Result details
Journals
Select all
Export citation of selected articles as:
20 pages, 9183 KB  
Article
Simulation of Nitrogen Migration and Output Loads Under Field Scale in Small Watershed, China
by Yixiao Song, Ling Jiang and Ming Liang
Land 2026, 15(3), 442; https://doi.org/10.3390/land15030442 - 10 Mar 2026
Cited by 1 | Viewed by 442
Abstract
Field-scale nitrogen migration mechanisms in small watersheds remain poorly quantified due to insufficient representation of microtopographic heterogeneity. This study investigates nitrogen transport dynamics in a 1.27 km2 agricultural watershed in China’s Jianghuai region using unmanned aerial vehicle (UAV) -derived 0.1 m digital [...] Read more.
Field-scale nitrogen migration mechanisms in small watersheds remain poorly quantified due to insufficient representation of microtopographic heterogeneity. This study investigates nitrogen transport dynamics in a 1.27 km2 agricultural watershed in China’s Jianghuai region using unmanned aerial vehicle (UAV) -derived 0.1 m digital elevation models (DEMs) and coupled hydrological–erosion modeling. The Soil Conservation Service Curve Number (SCS-CN) and Modified Universal Soil Loss Equation (MUSLE) models quantified nitrogen output loads, while the multi-flow direction algorithm simulated migration trajectories for total nitrogen (TN), ammonium, and nitrate. Results revealed strong spatial heterogeneity in nitrogen exports (watershed mean: 29.66 kg TN/km2·a), with bare land and greenhouses exhibiting the highest outputs (448.54 and 363.41 kg/km2·a) and forested areas showing minimal export (<6.1 kg/km2·a). Nitrogen migration was predominantly controlled by topographic gradients, with microtopographic features—field ridges, ditches, and buildings—physically redirecting flows and creating critical export nodes at field boundaries. DEM resolution critically affected simulation accuracy: erosion intensity displayed a non-monotonic response with an inflection point near 1 m resolution, corresponding to the median elevation difference (1.2 m) of field ridges. Structural equation modeling confirmed that high-resolution DEMs (0.1–2 m) maintained topographic control over nitrogen migration (~80% contribution), whereas 30 m DEMs reduced this influence to 30%, inducing spurious meteorological dominance. This study demonstrates that decimeter-scale DEMs are essential for accurately capturing microtopographic regulation of nitrogen transport, providing a methodological basis for precision management of agricultural non-point source pollution. Full article
Show Figures

Figure 1

25 pages, 4900 KB  
Article
Analysis of Chlorophyll and Carotenoid Content Variations in Evergreen Forest in Winter Using Vegetation Indices Derived from GCOM-C and MODIS Satellite Data
by Yasushi Shiraishi, Takuya Hiroshima and Satoshi Tsuyuki
Geomatics 2026, 6(2), 25; https://doi.org/10.3390/geomatics6020025 - 10 Mar 2026
Viewed by 428
Abstract
The GCOM-C satellite possesses optimal wavelength bands around 530 nm and 570 nm for monitoring seasonal variations in the photochemical reflectance index (PRI) and chlorophyll–carotenoid index (CCI), which are sensitive to carotenoid contents and its ratio to chlorophyll contents, respectively. As well as [...] Read more.
The GCOM-C satellite possesses optimal wavelength bands around 530 nm and 570 nm for monitoring seasonal variations in the photochemical reflectance index (PRI) and chlorophyll–carotenoid index (CCI), which are sensitive to carotenoid contents and its ratio to chlorophyll contents, respectively. As well as NDVI, these indices are excellent indicators for monitoring pigment contents of evergreen trees in winter, which are considered susceptible to climate change impacts. In this study, to investigate the characteristics and usefulness of the GCOM-C-derived indices, the seasonal variations in these indices were analyzed between 2018 and 2024 at two evergreen forest sites in Japan, and compared to CCI and NDVI derived from MODIS, which also has a band near 530 nm. The satellite observation results show that the decreases in all indices for both satellites in winter were observed in the order of PRI, CCI, NDVI. This is thought to indicate that carotenoid contents increased in response to the decrease in land surface temperature to mitigate low-temperature stress, followed by a delayed decrease in chlorophyll contents. GCOM-C showed 0.1 larger NDVI values and 0.2 larger CCI values than MODIS, and the difference was estimated to be largely influenced by the disparity in sensor sensitivity in the red bands. The dispersion of each index was reduced by using data with small sensor zenith angles (below 20 degrees for GCOM-C and 0 to 30 degrees for MODIS); however, MODIS showed a decline in observation accuracy due to satellite drifting in 2024. Spectral measurements of leaves collected at the site also showed similar VI decreases; however, the satellite-derived CCI were 0.12 lower, suggesting that reflection from dead leaves influences the satellite data. This study confirmed that GCOM-C, which can measure both PRI and CCI with high spatial resolution, is suitable for observing seasonal variations in carotenoid and chlorophyll contents in evergreen forests. Full article
Show Figures

Graphical abstract

29 pages, 12213 KB  
Article
Assessment of Ecological Environment Quality in the Yellow River Basin Based on the Improved Remote Sensing Ecological Index
by Huimin Yang, Siyu Hou, Kun Yan, Jiangheng Qiu and Decai Wang
Remote Sens. 2026, 18(4), 617; https://doi.org/10.3390/rs18040617 - 15 Feb 2026
Viewed by 550
Abstract
The Yellow River Basin is among the regions in China most severely affected by soil erosion. Elucidating the evolution trend of its ecological environment quality and identifying the key driving factors can provide a theoretical basis for the management and protection of the [...] Read more.
The Yellow River Basin is among the regions in China most severely affected by soil erosion. Elucidating the evolution trend of its ecological environment quality and identifying the key driving factors can provide a theoretical basis for the management and protection of the ecological environment in the Yellow River Basin. In this study, an improved remote sensing ecological index (ARSEI) was constructed by incorporating the soil erosion factor (A) into the original remote sensing ecological index (RSEI). Subsequently, the Theil–Sen slope estimator, Mann–Kendall trend test, coefficient of variation, Hurst index and Geodetector were employed to analyze the spatiotemporal evolution trend and driving factors of the ecological environment quality in the basin from 2002 to 2022. The results were as follows: (1) During the study period, the mean ARSEI of the basin increased from 0.518 to 0.568, representing an increase of 9.65%, with a spatial pattern of “poor in the north and excellent in the south.” (2) 62.12% of the basin exhibited improved ecological quality, 75.74% of the area showed medium or lower fluctuation levels, and 35.12% of the region is projected to be at risk of degradation in the future. (3) Annual precipitation was identified as the dominant factor influencing the spatial variation in ARSEI (q = 0.428), followed by land use type (q = 0.299). All interactions between factors exhibited either nonlinear enhancement or bi-factor enhancement. Specifically, the interaction between annual precipitation and land use type was the strongest, with a maximum q-value of 0.693. This study provides a novel approach for assessing the ecological environment quality in regions severely affected by soil erosion. Full article
Show Figures

Figure 1

19 pages, 3201 KB  
Article
Detecting Drivers and Predicting Spatial Distribution of Soil Organic Carbon in an Arid Region Using Machine Learning
by Guiren Chen, Xianghe Ge, Zipeng Zhang and Lijing Han
Remote Sens. 2026, 18(4), 535; https://doi.org/10.3390/rs18040535 - 7 Feb 2026
Viewed by 700
Abstract
Soil organic carbon (SOC) plays a critical role in the terrestrial carbon cycle, yet its spatial patterns and drivers in arid regions remain poorly understood. This study aims to clarify SOC distribution mechanisms in the Akesai region, where limited water–heat conditions and land [...] Read more.
Soil organic carbon (SOC) plays a critical role in the terrestrial carbon cycle, yet its spatial patterns and drivers in arid regions remain poorly understood. This study aims to clarify SOC distribution mechanisms in the Akesai region, where limited water–heat conditions and land use create high environmental heterogeneity. Four machine learning models were applied to predict SOC content and produce high-resolution spatial maps, and SHAP analysis was used to quantify the contributions of key environmental variables. The Gradient Boosting model had the best performance (R2 = 0.675; RMSE = 1.304 g kg−1), followed by XGBoost, LightGBM, and Random Forest. The results indicated that the main factors controlling SOC variation were NDVI, DEM, sand, clay, mean temperature, and ERVI. Furthermore, NDVI and clay parameters were positively associated with promoted SOC accumulation, while sand showed a negative effect. Spatially, higher SOC values were found in mountainous zones and vegetated valleys, while low SOC values were observed in flat, arid plains. These findings demonstrate that incorporating vegetation-type indicators substantially improves large-scale SOC estimation and enhances our understanding of SOC spatial dynamics and the driving mechanisms in arid environments. This provides a scientific basis for carbon-stock assessment and sustainable land management. Full article
Show Figures

Figure 1

31 pages, 20786 KB  
Article
Multi-Scale Analysis of Ecosystem Service Trade-Off Intensity and Its Drivers Based on Wavelet Transform: A Case Study of the Plain–Mountain Transition Zone in China
by Congyi Li, Penggen Cheng, Xiaojian Wei, Bei Liu, Yunju Nie and Zhanhui Zhao
Land 2026, 15(2), 278; https://doi.org/10.3390/land15020278 - 7 Feb 2026
Viewed by 488
Abstract
Identifying the multi-scale drivers of ecosystem service (ES) trade-off intensity is essential for promoting regional sustainability. However, the existing multi-scale ES studies typically rely on predefined administrative units or fixed grid sizes due to the absence of scientifically sound scale-partitioning approaches, which limits [...] Read more.
Identifying the multi-scale drivers of ecosystem service (ES) trade-off intensity is essential for promoting regional sustainability. However, the existing multi-scale ES studies typically rely on predefined administrative units or fixed grid sizes due to the absence of scientifically sound scale-partitioning approaches, which limits the identification of characteristic scales and obscures scale-dependent interactions. This study broke new ground by combining continuous wavelet transform (CWT) and optimal parameter geographic detector (OPGD) to automatically identify the characteristic scales of trade-offs between ecosystem services, thus opening up a new avenue in multi-scale studies. Taking China’s plain–mountain transition zone as a case study, we evaluate trade-off intensity among four key ecosystem services—water yield (WY), habitat quality (HQ), soil conservation (SC), and carbon storage (CS). The results show that the following: (1) The identification of 36 characteristic scales (ranging from 5 km to 55 km) indicates that ecosystem service trade-offs operate across a wide range of spatial extents, implying that a single management scale cannot effectively address all ES interactions. (2) From 2000 to 2020, CS-HQ, SC-HQ, and WY-HQ trade-off intensities were jointly driven by both natural conditions and human activities, whereas CS-SC was predominantly influenced by natural and climatic factors. The trade-off intensities between CS-WY and WY-SC were mainly controlled by climatic forces. (3) The explanatory power (q value) of each factor varied distinctly with spatial scale, and the interaction effects between multiple factors were substantially stronger than their individual effects. This indicates that ecosystem service trade-offs are primarily governed by coupled processes rather than isolated drivers. Consequently, management strategies targeting single drivers are unlikely to be effective. Instead, ecosystem management should be designed around combinations of drivers that operate at specific spatial scales and provide a concrete pathway for translating trade-off analyses into spatially differentiated management actions. Full article
Show Figures

Figure 1

18 pages, 4409 KB  
Article
CAE-RBNN: An Uncertainty-Aware Model of Island NDVI Prediction
by Zheng Xiang, Cunjin Xue, Ziyue Ma, Qingrui Liu and Zhi Li
ISPRS Int. J. Geo-Inf. 2026, 15(2), 65; https://doi.org/10.3390/ijgi15020065 - 3 Feb 2026
Viewed by 476
Abstract
The unique geographical isolation and climate sensitivity of island ecosystems make them valuable for ecological research. The Normalized Difference Vegetation Index (NDVI) is an important indicator when monitoring and evaluating these systems, and its prediction has become a key research focus. However, island [...] Read more.
The unique geographical isolation and climate sensitivity of island ecosystems make them valuable for ecological research. The Normalized Difference Vegetation Index (NDVI) is an important indicator when monitoring and evaluating these systems, and its prediction has become a key research focus. However, island NDVI prediction remains uncertain due to a limited understanding of vegetation growth and insufficient high-quality data. Deterministic models fail to capture or quantify such uncertainty, often leading to overfitting. To address this issue, this study proposes an uncertainty prediction model for the island NDVI within a coding–prediction–decoding framework, referred to as a Convolutional Autoencoder–Regularized Bayesian Neural Network (CAE-RBNN). The model integrates a convolutional autoencoder with feature regularization to extract latent NDVI features, aiming to reconcile spatial scale disparities with environmental data, while a Bayesian Neural Network (BNN) quantifies uncertainty arising from limited samples and an incomplete understanding of the process. Finally, Monte Carlo sampling and SHAP analysis evaluate model performance, quantify predictive uncertainty, and enhance interpretability. Experiments on six islands in the Xisha archipelago demonstrate that CAE-RBNN outperforms the Convolutional Neural Network–Recurrent Neural Network (CNN-RNN), the Convolutional Recurrent Neural Network (ConvRNN), Convolutional Long Short-Term Memory (ConvLSTM), and Random Forest (RF). Among them, CAE-RBNN reduces the MAE and MSE of the single-time-step prediction task by 8.40% and 10.69%, respectively, compared with the suboptimal model and decreases them by 16.31% and 22.57%, respectively, in the continuous prediction task. More importantly, it effectively quantifies the uncertainty of different driving forces, thereby improving the reliability of island NDVI predictions influenced by the environment. Full article
Show Figures

Figure 1

15 pages, 6693 KB  
Article
Bridging the Time-Space Scale Gap: A Physics-Informed UAV Upscaling Framework for Radiometric Validation of Microsatellite Constellations in Heterogeneous Built Environments
by Seung-Hwan Go, Dong-Ho Lee, Won-Ki Jo and Jong-Hwa Park
Drones 2026, 10(2), 99; https://doi.org/10.3390/drones10020099 - 30 Jan 2026
Viewed by 510
Abstract
The exponential rise in microsatellite constellations offers unprecedented temporal resolution for urban monitoring. However, ensuring the radiometric integrity of these sensors over heterogeneous built environments remains a critical challenge due to low signal-to-noise ratios and spectral uncertainties. Traditional vicarious calibration relies on homogeneous [...] Read more.
The exponential rise in microsatellite constellations offers unprecedented temporal resolution for urban monitoring. However, ensuring the radiometric integrity of these sensors over heterogeneous built environments remains a critical challenge due to low signal-to-noise ratios and spectral uncertainties. Traditional vicarious calibration relies on homogeneous pseudo-invariant calibration sites (PICS) in deserts, which fail to represent the spectral complexity and adjacency effects of urban landscapes. This study presents a novel triple-platform validation framework integrating ground (Hyperspectral), UAV (Multispectral), and satellite (Sentinel-2) data to bridge the “Point-to-Pixel” scale gap. We introduce a physics-informed “Double Calibration” protocol—combining the empirical line method with spectral response function convolution—and a block kriging spatial upscaling technique to mathematically model intra-pixel heterogeneity. Results from a 2025 campaign in a complex urban environment (Cheongju, Republic of Korea) demonstrate that simple point-averaging introduces significant representation errors (R20.46 with time lag). In contrast, our UAV-based block kriging approach recovered high correlations even with a 1-day time lag and dramatically improved the coefficient of determination (R2) under simultaneous acquisition conditions: from 0.68 to 0.92 in the blue band and to 0.96 in the NIR band. Furthermore, quantitative spatial analysis identified artificial grass as the most stable “Urban PICS” (σ0.020), whereas asphalt exhibited unexpected high spatial heterogeneity (σ> 0.09) due to surface aging and challenging conventional assumptions. This framework establishes a rigorous, scalable standard for validating “New Space” data products in complex urban domains. Full article
Show Figures

Graphical abstract

30 pages, 22514 KB  
Article
Spatiotemporal Heterogeneity Analysis of Net Primary Productivity in Nanjing’s Urban Green Spaces Based on the DLCC–NPP Model: A Long-Term and Multi-Scenario Approach
by Yuhao Fang, Yuyang Liu, Yuan Wang, Yilun Cao and Yuning Cheng
ISPRS Int. J. Geo-Inf. 2026, 15(1), 38; https://doi.org/10.3390/ijgi15010038 - 12 Jan 2026
Viewed by 641
Abstract
In the context of the “Dual Carbon” goals, accurately predicting the spatiotemporal evolution of urban Net Primary Productivity (NPP) is crucial for resilient urban planning. While recent studies have coupled land use models with ecosystem models to project NPP dynamics, they often face [...] Read more.
In the context of the “Dual Carbon” goals, accurately predicting the spatiotemporal evolution of urban Net Primary Productivity (NPP) is crucial for resilient urban planning. While recent studies have coupled land use models with ecosystem models to project NPP dynamics, they often face challenges in acquiring high-resolution future vegetation parameters and typically overlook the stability of NPP under changing climates. To address these gaps, this study focuses on Nanjing and develops a long-term, multi-scenario analysis framework based on the Dynamic Land Cover–Climate Model (DLCC–NPP). This framework innovatively integrates the PLUS model with a Random Forest (RF) algorithm. By establishing a direct statistical mapping between macro-climate/micro-land cover and NPP, the RF model functions as a statistical downscaling tool. This approach bypasses the uncertainty accumulation associated with simulating future vegetation indices, enabling precise spatiotemporal NPP prediction at a 30 m resolution. Using this approach, we systematically analyzed the NPP dynamics from 2004 to 2044 under three SSP scenarios. The results revealed that Nanjing’s NPP exhibited a fluctuating upward trend, with urban forests contributing the highest productivity (mean NPP ~266.15 gC/m2). Crucially, the volatility analysis highlighted divergent response characteristics: forests demonstrated the highest stability and “buffering effect,” whereas grasslands and croplands showed high volatility and sensitivity to climate fluctuations. Spatially, a distinct “stable high-NPP core, decreasing periphery” pattern was identified, driven by the interaction of urban expansion and ecological conservation policies. In conclusion, the DLCC–NPP framework effectively overcomes the data scarcity bottleneck in future simulations and characterizes the spatiotemporal heterogeneity of vegetation carbon fixation in urban ecosystems, providing scientific support for optimizing green space patterns and enhancing urban ecological resilience in high-density cities. Full article
Show Figures

Figure 1

18 pages, 10989 KB  
Article
Aerodynamic Roughness Retrieval at Typical Antarctic Stations Based on Multi-Source Remote Sensing
by Yongzhe Sun, Zhaoliang Zeng, Che Wang, Lizhong Zhu, Biao Tian, Ruqing Zhu and Minghu Ding
Remote Sens. 2026, 18(1), 67; https://doi.org/10.3390/rs18010067 - 25 Dec 2025
Viewed by 704
Abstract
Antarctica’s aerodynamic roughness length (z0m) is crucial for surface energy exchange and atmospheric modeling, but its remote sensing estimation remains challenging due to complex ice-surface conditions and limited observations. To address these challenges, this study establishes a z0m retrieval framework [...] Read more.
Antarctica’s aerodynamic roughness length (z0m) is crucial for surface energy exchange and atmospheric modeling, but its remote sensing estimation remains challenging due to complex ice-surface conditions and limited observations. To address these challenges, this study establishes a z0m retrieval framework derived from the Raupach model using Unmanned Aerial Vehicle (UAV), Reference Elevation Model of Antarctica (REMA), and Ice, Cloud, and land Elevation Satellite-2 (ICESat-2) datasets at three representative Antarctic sites. The results show that UAV benchmarks yield mean z0m values of 0.009795, 0.011597, and 0.005203 m at Zhongshan Station, Great Wall Station, and Qinling Station, respectively. In experiments with ICESat-2 data, z0m derived from ATL06 demonstrates accuracy comparable to that from ATL03 (RMSE = 7.45 × 10⁻⁶ m), with the best performance obtained at a 2 km window. Spatially, the agreement with UAV-derived z0m decreases in the order: REMA > ICESat-2 (IDW-interpolated). The accuracy of REMA and ICESat-2 decreased with terrain complexity, from ice-free zones to the ice-shelf front and finally to the steep ice sheet margin. The elevation and slope variations emerge as dominant controls of z0m spatial patterns. This study demonstrates the complementary strengths of UAV, REMA, and ICESat-2 datasets in Antarctic aerodynamic roughness estimation, providing practical guidance for data selection and methodology optimization. This study develops an improved z0m retrieval method for Antarctica, clarifies the applicability and limitations of UAV, REMA, and ICESat-2 data, and provides methodological and data support for simulations of near-surface atmospheric parameters in Antarctica region. Full article
Show Figures

Graphical abstract

27 pages, 14009 KB  
Article
Stacking-Based Solar-Induced Chlorophyll Fluorescence Downscaling for Soil EC Estimation
by Kuangda Cui, Jianli Ding, Jinjie Wang, Jiao Tan and Jiangtao Li
Remote Sens. 2025, 17(18), 3222; https://doi.org/10.3390/rs17183222 - 18 Sep 2025
Viewed by 1019
Abstract
The Xinjiang Province of China, characterized as a typical arid to semi-arid region, is increasingly facing severe issues related to soil salinization. Timely and accurate estimation of soil salinization in this region is crucial for the sustainable development of agriculture and food security. [...] Read more.
The Xinjiang Province of China, characterized as a typical arid to semi-arid region, is increasingly facing severe issues related to soil salinization. Timely and accurate estimation of soil salinization in this region is crucial for the sustainable development of agriculture and food security. However, current methods for detecting soil salinization primarily rely on various environmental covariates, which assess the extent of soil salinization by analyzing the relationship between environmental factors and the accumulation of soil salts. Nonetheless, these conventional environmental covariates often suffer from response delays, making it challenging to promptly reflect the dynamic changes in soil salinity. Solar-induced chlorophyll fluorescence (SIF) has been widely used to assess vegetation photosynthetic efficiency and is considered a direct indicator of plant photosynthetic activity. In contrast, SIF provides a timely means of monitoring the status of plant photosynthesis, indirectly reflecting the impact of soil salinization on plant growth. However, the spatial resolution of SIF products derived from satellites is typically low, which significantly limits the accurate estimation of soil salinization in Xinjiang. This study proposes a novel method for monitoring soil salinization, based on SIF data. The approach employs a Stacking ensemble learning model to downscale SIF data, thereby improving the spatial resolution of soil salinity monitoring. Using the GOSIF dataset, combined with environmental covariates, such as MODIS, the Stacking framework facilitates the fine-scale downscaling of SIF data, generating high-resolution SIF products, ranging from 0.05° to 0.005°, with a spatial resolution of 30 m. This refined SIF data is then used to predict soil electrical conductivity (EC). The experimental results demonstrate that: (1) the proposed Stacking-based SIF downscaling method is highly effective, with a high degree of fit to reference SIF data (R2 > 0.85); (2) the high-resolution SIF data, after downscaling, more accurately reflects the spatial heterogeneity of soil salinization, especially in shallow soils (r < −0.6); and (3) models combining SIF and environmental covariates exhibit superior accuracy compared to models that rely solely on SIF or traditional environmental covariates (R2 > 0.65). This research provides new data support and methodological advancements for precision agriculture and ecological environmental monitoring. Full article
Show Figures

Figure 1

27 pages, 31400 KB  
Article
Multi-Scale Analysis of Land Use Transition and Its Impact on Ecological Environment Quality: A Case Study of Zhejiang, China
by Zhiyuan Xu, Fuyan Ke, Jiajie Yu and Haotian Zhang
Land 2025, 14(8), 1569; https://doi.org/10.3390/land14081569 - 31 Jul 2025
Cited by 3 | Viewed by 1466
Abstract
The impacts of land use transition on ecological environment quality (EEQ) during China’s rapid urbanization have attracted growing concern. However, existing studies predominantly focus on single-scale analyses, neglecting scale effects and driving mechanisms of EEQ changes under the coupling of administrative units and [...] Read more.
The impacts of land use transition on ecological environment quality (EEQ) during China’s rapid urbanization have attracted growing concern. However, existing studies predominantly focus on single-scale analyses, neglecting scale effects and driving mechanisms of EEQ changes under the coupling of administrative units and grid scales. Therefore, this study selects Zhejiang Province—a representative rapidly transforming region in China—to establish a “type-process-ecological effect” analytical framework. Utilizing four-period (2005–2020) 30 m resolution land use data alongside natural and socio-economic factors, four spatial scales (city, county, township, and 5 km grid) were selected to systematically evaluate multi-scale impacts of land use transition on EEQ and their driving mechanisms. The research reveals that the spatial distribution, changing trends, and driving factors of EEQ all exhibit significant scale dependence. The county scale demonstrates the strongest spatial agglomeration and heterogeneity, making it the most appropriate core unit for EEQ management and planning. City and county scales generally show degradation trends, while township and grid scales reveal heterogeneous patterns of local improvement, reflecting micro-scale changes obscured at coarse resolutions. Expansive land transition including conversions of forest ecological land (FEL), water ecological land (WEL), and agricultural production land (APL) to industrial and mining land (IML) primarily drove EEQ degradation, whereas restorative ecological transition such as transformation of WEL and IML to grassland ecological land (GEL) significantly enhanced EEQ. Regarding driving mechanisms, natural factors (particularly NDVI and precipitation) dominate across all scales with significant interactive effects, while socio-economic factors primarily operate at macro scales. This study elucidates the scale complexity of land use transition impacts on ecological environments, providing theoretical and empirical support for developing scale-specific, typology-differentiated ecological governance and spatial planning policies. Full article
Show Figures

Figure 1

21 pages, 5313 KB  
Article
MixtureRS: A Mixture of Expert Network Based Remote Sensing Land Classification
by Yimei Liu, Changyuan Wu, Minglei Guan and Jingzhe Wang
Remote Sens. 2025, 17(14), 2494; https://doi.org/10.3390/rs17142494 - 17 Jul 2025
Cited by 1 | Viewed by 2241
Abstract
Accurate land-use classification is critical for urban planning and environmental monitoring, yet effectively integrating heterogeneous data sources such as hyperspectral imagery and laser radar (LiDAR) remains challenging. To address this, we propose MixtureRS, a compact multimodal network that effectively integrates hyperspectral imagery and [...] Read more.
Accurate land-use classification is critical for urban planning and environmental monitoring, yet effectively integrating heterogeneous data sources such as hyperspectral imagery and laser radar (LiDAR) remains challenging. To address this, we propose MixtureRS, a compact multimodal network that effectively integrates hyperspectral imagery and LiDAR data for land-use classification. Our approach employs a 3-D plus heterogeneous convolutional stack to extract rich spectral–spatial features, which are then tokenized and fused via a cross-modality transformer. To enhance model capacity without incurring significant computational overhead, we replace conventional dense feed-forward blocks with a sparse Mixture-of-Experts (MoE) layer that selectively activates the most relevant experts for each token. Evaluated on a 15-class urban benchmark, MixtureRS achieves an overall accuracy of 88.6%, an average accuracy of 90.2%, and a Kappa coefficient of 0.877, outperforming the best homogeneous transformer by over 12 percentage points. Notably, the largest improvements are observed in water, railway, and parking categories, highlighting the advantages of incorporating height information and conditional computation. These results demonstrate that conditional, expert-guided fusion is a promising and efficient strategy for advancing multimodal remote sensing models. Full article
Show Figures

Graphical abstract

Back to TopTop