


Highlights
What are the main findings?
- A phenology-aware daily framework integrating stage-specific heat thresholds and crop water demand revealed distinct CHDE dynamics across summer maize growth stages.
- CHDE frequency increased across all stages, with the fastest increase occurring during tasseling-to-maturity, where mean duration also increased significantly; mean intensity declined significantly at the EGS scale and during S–J but showed no significant trends during J–T or T–M.
- Potential exposure was concentrated in major maize-producing regions and was highest during the tasseling-to-maturity stage.
What is the implication of the main findings?
- Phenology-specific CHDE assessment identifies critical growth stages and high-risk regions, supporting targeted agrometeorological monitoring, irrigation strategies, and climate adaptation.
Abstract
Compound heat and drought events (CHDEs) increasingly threaten crop production, yet conventional assessments rarely account for phenological changes in crop heat sensitivity and water demand. Here, we developed a phenology-aware daily framework for summer maize in the Huang–Huai–Hai (HHH) Plain, China, integrating stage-specific heat thresholds with a crop-coefficient-adjusted standardized precipitation evapotranspiration index (SPEI_KC) and a fixed cultivation distribution. Using daily meteorological observations from 1980 to 2020, CHDEs were characterized across the sowing-to-jointing, jointing-to-tasseling, and tasseling-to-maturity stages. Across the growing season, CHDE frequency and mean duration increased significantly, whereas mean intensity declined. Stage-specific responses differed markedly: frequency increased across all stages, while the tasseling-to-maturity stage showed the fastest increase in frequency and a significant lengthening of duration. Potential exposure also became progressively concentrated over crop development and was highest during tasseling-to-maturity in major maize-producing areas. By incorporating phenological variation into both heat and drought characterization, this framework resolves within-season differences in compound stress that are obscured by uniform-threshold approaches and provides a crop-relevant basis for stage-targeted monitoring and adaptation.
1. Introduction
Under global warming, extreme heat and drought events are becoming increasingly frequent. Land–atmosphere feedbacks, increasing evaporative demand, and soil moisture deficits can interact to increase the likelihood of compound heat and drought events (CHDEs), whose impacts often exceed those of heat or drought alone [1,2]. These compound events pose substantial threats to major crops, including maize, rice, wheat, and soybean, particularly when they occur during critical growth stages [3]. Among these crops, maize is one of the most widely cultivated staple crops worldwide and plays a central role in global food production and supply [4,5]. Compared with rice and wheat, it is particularly sensitive to extreme heat and water deficits, especially during tasseling and silking, pollination and kernel set, and grain filling. Even short periods of heat or water stress can reduce pollen viability, disrupt pollination synchrony, limit assimilate accumulation, and shorten the grain-filling period [6,7,8]. The vulnerability of maize to heat and water stress is of particular concern in China, the world’s second-largest maize producer. During 2016–2020, China produced approximately 260 million tonnes of maize annually, accounting for about 23% of global maize production [9]. Within China, the Huang–Huai–Hai (HHH) Plain is a major summer maize production region, contributing approximately 30–40% of the national maize output [10]. In this region, the summer maize growing season frequently coincides with concurrent heat and drought, making CHDEs an important climatic threat to maize production [11,12,13].
Heat sensitivity, water demand, and responses to climatic stress in summer maize vary markedly among phenological stages. Heat or water stress during the sowing-to-jointing stage (S–J) can impair seedling emergence, root establishment, and early vegetative growth. Compound heat and drought stress during the jointing-to-tasseling stage (J–T) can impair rapid vegetative growth and reproductive organ differentiation, with potential consequences for subsequent pollination and kernel formation [14]. The tasseling-to-maturity stage (T–M), encompassing pollination, kernel set, and grain filling, is particularly sensitive to compound heat and drought stress. Even short-lived compound stress during this period can disrupt pollination, reduce kernel number, and shorten the grain-filling period, potentially leading to substantial yield losses [6,7,8]. These pronounced stage-dependent differences highlight the limitation of identifying CHDEs over the entire summer maize growing season as a single period and demonstrate the need for phenological-stage-specific CHDE identification.
Previous studies have examined CHDEs in agricultural systems through event identification, index development, and exposure assessment [15]. He et al. projected continued increases in days characterized by concurrent drought and heat across global maize-growing regions, indicating a growing climatic threat to maize production [16]. Feng et al. further demonstrated that estimates of CHDE frequency and spatial extent are sensitive to the choice of drought index [17]. Despite these advances, most previous assessments have relied on broad temporal windows, such as the calendar year, summer season, or entire crop growing season. Such temporal aggregation may obscure phenological changes in crop heat sensitivity and water demand during development. Yang et al. identified daily CHDEs across phenological stages of spring maize in Northeast China but applied a uniform event threshold across stages [18]. This limitation is particularly relevant because Li et al. showed that heat-damage thresholds for summer maize in the HHH Plain vary across developmental stages, with tasseling, flowering, and grain filling being particularly sensitive to high temperatures [14]. A similar limitation applies to drought characterization. Conventional meteorological drought indices are typically based on the balance between precipitation and reference evapotranspiration and rarely incorporate crop coefficients or phenological changes in crop water demand [19,20], which may limit their ability to characterize crop-relevant water stress. Beyond CHDE identification, recent studies have increasingly considered agricultural exposure. Wang et al. showed that future cropland exposure to extreme compound drought–heatwave events is jointly shaped by changes in compound-event occurrence and the spatial distribution of cropland [21]. Cheng et al. further linked compound heat and drought extremes to the spatial distributions of major crops, demonstrating the value of integrating meteorological stress with crop distribution [22]. Taken together, these studies underscore the need for phenology-aware CHDE identification that accounts for stage-specific heat sensitivity and crop water demand, while also characterizing how potential summer maize exposure differs among phenological stages.
To address these gaps, a daily, phenology-aware CHDE identification framework was developed to account for stage-specific heat sensitivity and crop water demand. Within this framework, long-term changes and spatial patterns of CHDEs were examined across phenological stages of summer maize in the HHH Plain. Specifically, two research questions were addressed: (1) How do long-term trends and spatial patterns of CHDEs differ among phenological stages, and what stage-specific signals are obscured when the summer maize growing season is treated as a single period? (2) How the magnitude and spatial patterns of potential summer maize exposure to CHDEs vary among phenological stages. To answer these questions, daily CHDEs were identified separately for the S–J, J–T, and T–M stages using stage-specific heat-stress thresholds and a crop-coefficient-adjusted water-deficit index. Their frequency, duration, intensity, and spatial patterns were then characterized, and potential summer maize exposure was assessed for each phenological stage. The results provide a basis for identifying critical phenological periods for compound heat and drought stress and for supporting stage-specific agrometeorological monitoring and adaptation planning in the HHH Plain.
2. Study Area and Data
2.1. Study Area
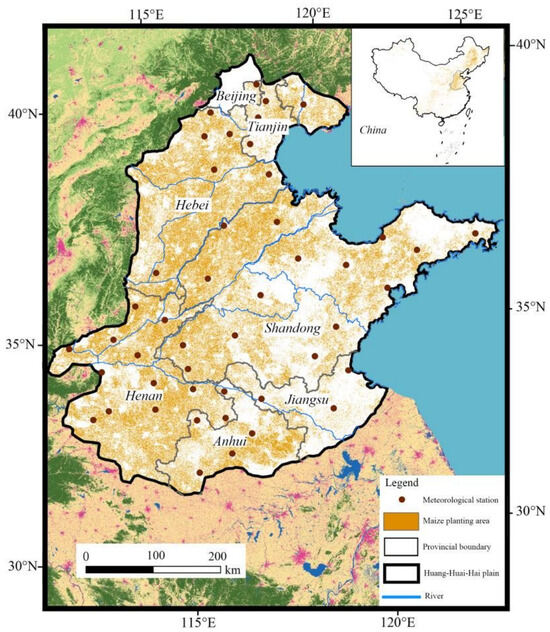
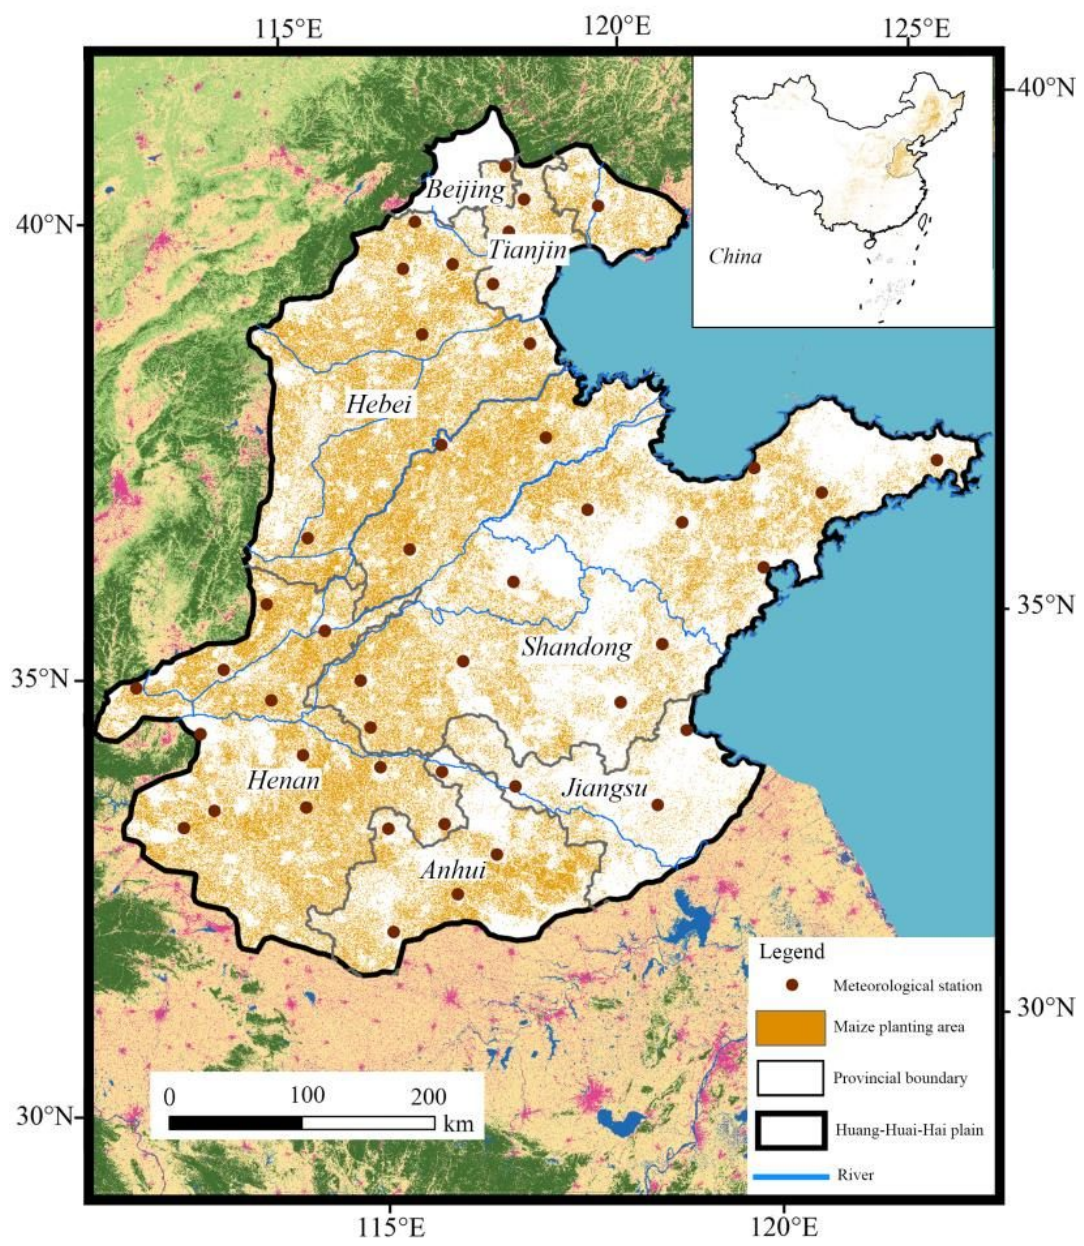
The HHH Plain (112°42′55″–122°42′21″E, 32°16′50″–41°03′34″N) is located in eastern China. It is a major agricultural region and one of China’s core summer maize production areas. The region has a warm-temperate, semi-humid monsoon climate. Mean annual temperature ranges from approximately 8 to 15 °C, and annual precipitation ranges from approximately 500 to 900 mm. Approximately 70–80% of the annual precipitation falls between June and September. The summer maize growing season largely coincides with the warmest months of the year. Variability in summer precipitation can lead to intermittent water deficits during crop development. Figure 1 shows the study area, the locations of meteorological stations, and the spatial distribution of summer maize cultivation.
Figure 1.
Study area, meteorological stations, and spatial distribution of summer maize cultivation.
2.2. Data
Daily meteorological observations for 1980–2020, summer maize phenological and cultivation data, and basic geospatial data were used in this study. Daily meteorological observations were obtained from the China Surface Climate Daily Dataset (V3.0), provided by the China Meteorological Data Service Centre (https://data.cma.cn). A total of 47 meteorological stations within the study area were selected. The variables included daily precipitation (Pre, mm), mean relative humidity (, %), mean air temperature (, °C), maximum air temperature (, °C), minimum air temperature (, °C), mean wind speed (, m s−1), and sunshine duration (SSD, h).
Phenological dates for summer maize, including sowing, jointing, tasseling, and maturity, were obtained from the major-crop phenology dataset provided by the National Earth System Science Data Center, National Science & Technology Infrastructure of China (https://www.geodata.cn). Summer maize cultivation data were obtained from the China Maize Cultivation Distribution Dataset released by the National Ecosystem Science Data Center (http://www.nesdc.org.cn), at a spatial resolution of 30 m. The dataset provides annual maize cultivation maps for 2001–2020. Because the meteorological analysis covered 1980–2020, the 2020 summer maize distribution, representing the most recent cultivation pattern available in the dataset, was used as a fixed cultivation mask. This provided a consistent spatial basis for comparing mean potential exposure among phenological stages over the study period. The study-area boundary and other basic geographic data were obtained from the Resource and Environmental Science Data Platform (https://www.resdc.cn) and were used for mapping and spatial data clipping.
3. Methods
3.1. Identification of Compound Heat and Drought Events
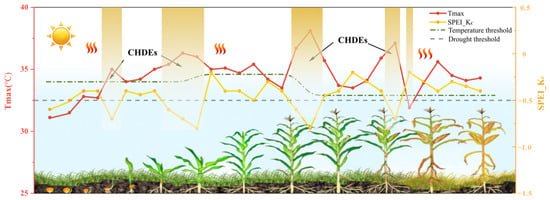
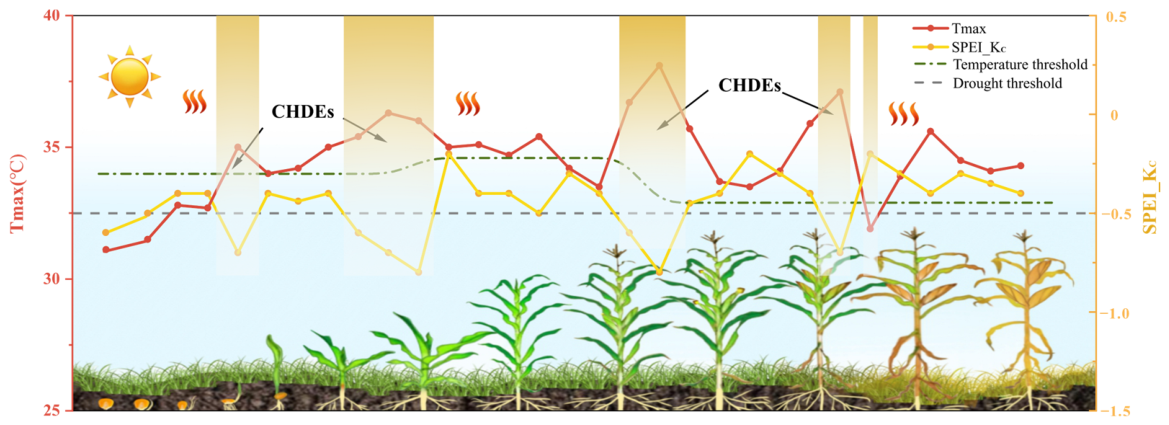
Based on the multi-year mean dates of sowing, jointing, tasseling, and maturity at each meteorological station, the summer maize growing season was divided into three phenological stages: S–J, J–T, and T–M. Stage-specific heat-stress thresholds and crop coefficients were applied to characterize phenological differences in heat and water stress at the daily scale (Figure 2).
Figure 2.
Schematic illustration of CHDE identification across summer maize phenological stages.
Daily maximum temperature () was used to characterize meteorological heat exposure at the regional scale. According to the phenological-stage-specific heat-damage thresholds for summer maize proposed by Li et al. [14], the daily maximum temperature thresholds for the S–J, J–T, and T–M stages were set to 34.0, 34.6, and 32.9 °C, respectively (Table 1).
Table 1.
Summer maize phenological stages and stage-specific heat-stress thresholds.
The daily heat exceedance was calculated as: for day in phenological stage , we classified the day as a heat-stress day if daily maximum temperature equaled or exceeded the stage-specific heat-stress threshold . To express daily heat excess in degree-day units, we defined the amount above the threshold as follows:
where is the daily maximum temperature on day , and is the heat-stress threshold for phenological stage . A day was classified as a heat-stress day when , with a larger indicating a greater exceedance above the stage-specific threshold.
Based on the crop water requirements at key phenological stages of summer maize, the crop coefficients () at sowing, jointing, tasseling, and maturity were set to 0.51, 1.08, 1.30, and 0.50, respectively [23]. The values at these phenological dates were used as control points, and daily values were obtained by linear interpolation according to the number of days between adjacent phenological dates at each meteorological station, thereby generating a continuous daily series over the entire summer maize growing season. Reference evapotranspiration () was calculated using the FAO-56 Penman–Monteith method [24], and daily crop evapotranspiration () was subsequently calculated by combining with the corresponding daily values:
The daily crop water balance was then calculated as:
where is the precipitation on day . To represent the accumulated effect of short-term water deficits, the daily water balance was aggregated using a 30-day rolling window and standardized following the conventional SPEI procedure [19,25] to obtain daily . A day was classified as a drought-stress day when .
To ensure a consistent direction of stress severity between heat and drought, daily drought severity was defined relative to the drought threshold of −0.5 as:
Thus, when , whereas lower values correspond to larger values and stronger drought stress.
Because and differ in their units and statistical distributions, they were separately transformed into marginal cumulative probabilities using a nonparametric empirical probability approach [26]. For each meteorological station and phenological stage, the empirical cumulative distributions of and were constructed using all valid daily samples pooled over 1980–2020, including zero values representing non-stress conditions. Both variables were ranked in ascending order so that larger and values corresponded to larger marginal probabilities. Daily compound heat–drought stress intensity was then calculated as:
where and are the marginal cumulative probabilities of heat exceedance and drought severity, respectively. is dimensionless, with larger values indicating stronger concurrent heat and drought stress.
A day was classified as a compound heat–drought stress day when both and were satisfied. Consecutive compound-stress days were grouped into independent episodes using run theory [27], and an episode was defined as a CHDE when the compound-stress condition persisted for at least three consecutive days [28]. For the entire growing season (EGS), the three phenological stages were sequentially combined while retaining the stage-specific heat threshold and daily value assigned to each date; no additional uniform heat threshold was applied at the EGS scale.
CHDE characteristics were described using frequency, mean duration, and mean intensity. Frequency was defined as the number of independent CHDEs occurring within a given year and phenological stage. The duration of an individual CHDE was defined as the number of consecutive compound-stress days within the event, and mean duration was calculated as the average duration of all CHDEs identified during the corresponding period. The mean compound intensity of each CHDE was calculated as:
where is the daily compound heat–drought stress intensity on day of event , calculated using Equation (5), is the duration of event . Mean intensity was calculated as the average of the event-mean intensities of all CHDEs identified within the corresponding year and phenological stage.
For the regional interannual analysis, annual frequency, mean duration, and mean intensity were first calculated separately at each meteorological station. The corresponding station-level values were then averaged across the 47 stations for each year and phenological stage to construct the regional annual time series used in the trend analysis.
3.2. Quantification of Summer Maize Compound-Stress Land Exposure
To quantify potential summer maize exposure to CHDEs, we followed the premise that crop exposure is jointly determined by compound-event characteristics and cultivation scale [22]. We constructed a cumulative compound-stress index. First, we calculated the stage-specific cumulative compound-stress index () for phenological stage :
jointly reflects compound-stress intensity and event persistence. is an event-day indicator. when day belongs to an identified CHDE; otherwise, . Thus, accumulates daily compound-stress severity only during identified CHDEs.
The annual values at each meteorological station during 1980–2020 were averaged to obtain the multi-year mean annual for each phenological stage and for the entire growing season. The multi-year mean annual values were then spatially interpolated using ordinary kriging [29] and combined with the 2020 summer maize cultivation area to calculate the potential land exposure () for each phenological stage:
where is the multi-year mean annual .
3.3. Sen’s Slope and Mann–Kendall Trend Test
Sen’s slope estimator was used to quantify the long-term rates of change in the annual time series of CHDE event frequency, mean duration, and mean intensity for the entire growing season and individual phenological stages during 1980–2020. The statistical significance of these trends was evaluated using the nonparametric Mann–Kendall (M–K) test. A positive Sen’s slope indicates an increasing trend in the corresponding CHDE characteristic, whereas a negative slope indicates a decreasing trend. Because the trend analysis was based on annual time series, the Sen’s slope represents the annual rate of change in the corresponding characteristic. A two-sided M–K test was applied, with considered statistically significant. Sen’s slope estimates and the corresponding M–K test p-values were reported.
4. Results
4.1. Phenological-Stage Differences in Long-Term Trends of CHDE Characteristics
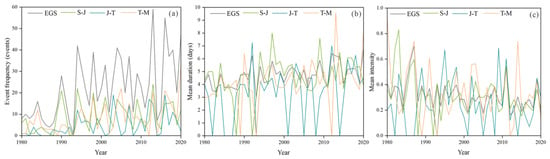
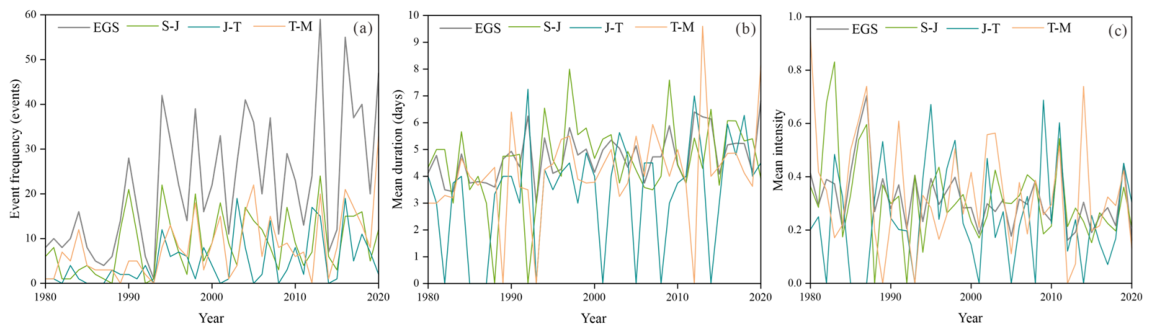
Long-term trends in CHDE characteristics differed among phenological stages during 1980–2020 (Figure 3; Table 2). For the entire growing season (EGS), CHDE frequency and mean duration increased significantly, with Sen’s slopes of 0.6667 events yr−1 and 0.0394 d yr−1, respectively, whereas mean intensity decreased significantly, with a Sen’s slope of −0.0038 yr−1. The stage-specific trends, however, differed from the overall pattern observed for the EGS.
Figure 3.
Interannual changes in CHDE frequency (a), mean duration (b), and mean intensity (c) during 1980–2020 for the entire growing season and three phenological stages.
Table 2.
Mann–Kendall trend test results and Sen’ s slope estimates for CHDE characteristics during the entire growing season and three phenological stages, 1980–2020.
CHDE frequency was the only metric to increase significantly across all three phenological stages (Figure 3a). Sen’s slopes were 0.1640, 0.1250, and 0.2500 events yr−1 for the S–J, J–T, and T–M stages, respectively, with the largest estimated increase occurring during the T–M stage. In contrast to frequency, changes in mean duration were stage dependent (Figure 3b). Significant increases were detected only during the J–T and T–M stages, with Sen’ s slopes of 0.0278 and 0.0298 d yr−1, respectively, whereas no significant trend was detected during the S–J stage (0.0167 d yr−1). Mean intensity showed a different stage-specific pattern (Figure 3c). Although Sen’ s slopes were negative for all three stages, a significant decline was detected only during the S–J stage (−0.0043 yr−1). The trends during the J–T (−0.0021 yr−1) and T–M (−0.0034 yr−1) stages were not significant. Overall, frequency showed a consistent increase across phenological stages, whereas significant changes in duration and intensity were restricted to specific stages.
4.2. Phenological-Stage Differences in Spatial Patterns of CHDE Characteristics
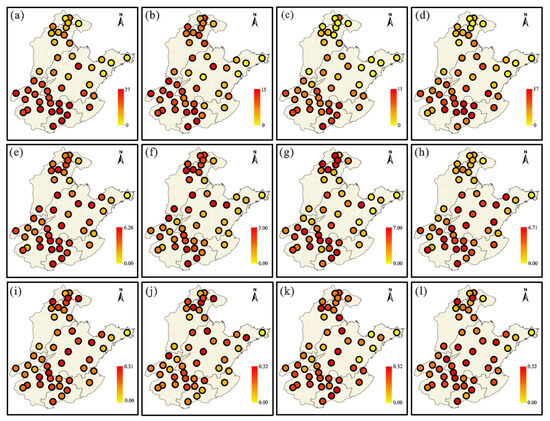
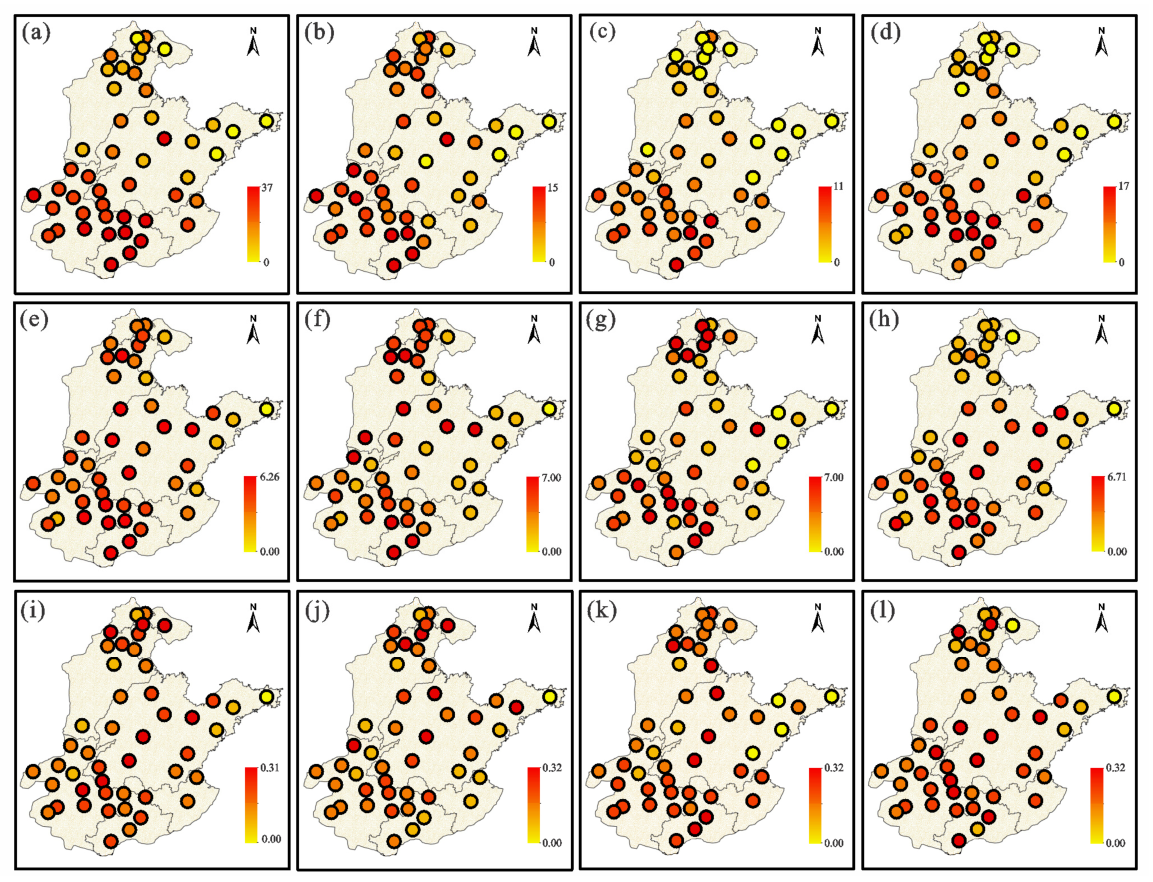
Stage-dependent differences were also evident in the spatial distribution of CHDE characteristics across the HHH Plain (Figure 4 and Figure 5). At the EGS scale, CHDE frequency showed pronounced spatial heterogeneity. Higher frequencies were concentrated mainly in central-southern and eastern Henan, northern Anhui, northern Jiangsu, and southwestern Shandong, whereas lower frequencies occurred mainly in northern Hebei, the Shandong Peninsula, and eastern coastal areas (Figure 4a).
Figure 4.
Spatial distributions of CHDE frequency (a–d), mean duration (e–h), and mean intensity (i–l) across the HHH Plain. The four columns represent the EGS, S–J, J–T, and T–M stages, respectively.
Figure 5.
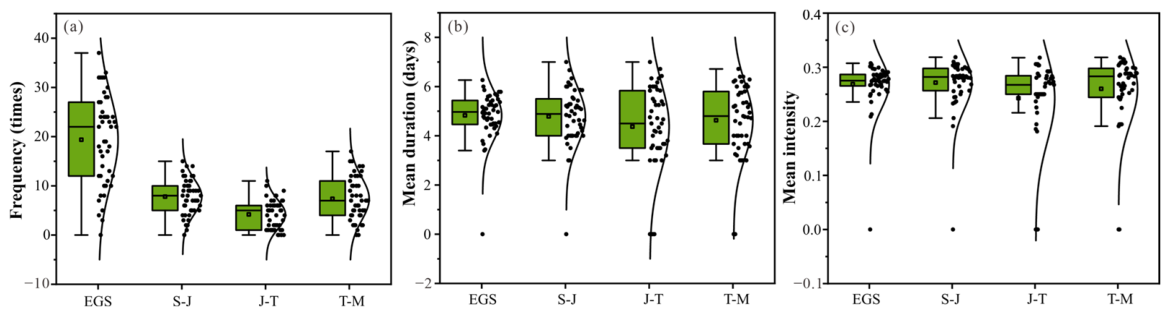
Station-level distributions of CHDE frequency (a), mean duration (b), and mean intensity (c) for the entire growing season (EGS) and three phenological stages.
Among the three phenological stages, spatial differentiation was most evident for CHDE frequency. During the S–J stage, higher-frequency stations were relatively widely distributed across Henan, northern Anhui, and southwestern Shandong. This pattern became more spatially localized during the J–T stage, when CHDE frequency was generally lower and higher-frequency stations occurred mainly in eastern Henan, northern Anhui, and parts of western Shandong. During the T–M stage, higher frequencies were again concentrated in central-southern and eastern Henan, northern Anhui, and northern Jiangsu (Figure 4b–d). Consistent with these spatial patterns, station-level CHDE frequency was lower during J–T than during S–J and T–M (Figure 5a).
In contrast, mean duration showed weaker spatial differentiation among phenological stages. Relatively long durations occurred at both southern and some northern stations, with several northern stations showing comparatively long events during J–T (Figure 4f–h). Nevertheless, the station-level distributions of mean duration overlapped substantially among the S–J, J–T, and T–M stages (Figure 5b).
Mean intensity showed even less spatial differentiation among phenological stages. High and low values were scattered across the HHH Plain, with no persistent high-intensity cluster evident across stages (Figure 4j–l). The station-level distributions of mean intensity also overlapped strongly among the three phenological stages (Figure 5c). Overall, phenological-stage differences in spatial patterns were most evident for CHDE frequency, whereas mean duration and mean intensity showed greater spatial similarity among stages.
4.3. Phenological-Stage Differences in Potential Summer Maize Exposure to CHDEs
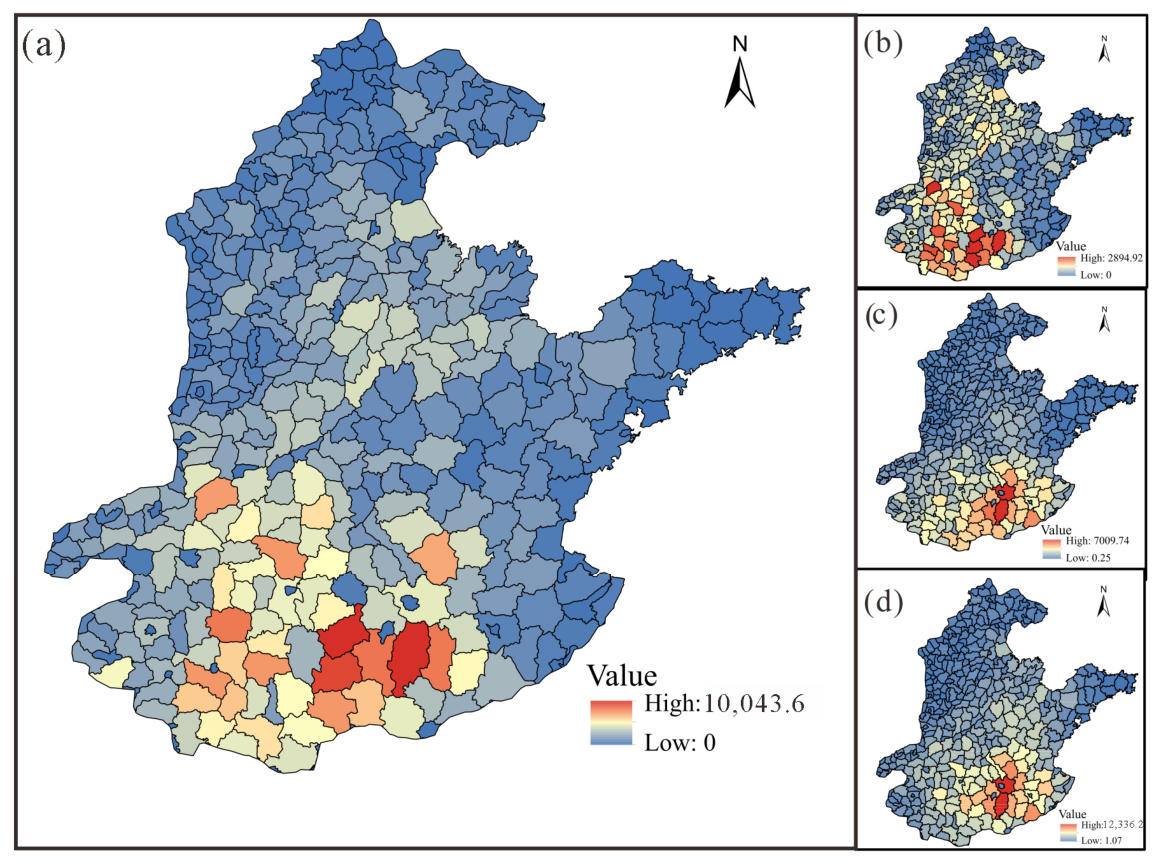
Potential summer maize exposure to CHDEs varied markedly across phenological stages, with the spatial pattern becoming progressively more concentrated over the course of the growing season (Figure 6). At the EGS scale, high exposure was concentrated mainly in central-southern and eastern Henan, northern Anhui, and adjacent parts of northern Jiangsu, whereas most northern areas of the HHH Plain and the Shandong Peninsula were characterized by relatively low exposure (Figure 6a). This seasonal-scale pattern was not equally expressed throughout the growing season, but became progressively clearer across successive phenological stages.
Figure 6.
Spatial distribution of potential summer maize exposure to CHDEs across the HHH Plain during the entire growing season and three phenological stages. (a) EGS; (b) S–J; (c) J–T; and (d) T–M.
During the S–J stage, potential exposure was relatively dispersed, with moderate-to-high values scattered across several parts of the southern HHH Plain and no clearly dominant exposure center (Figure 6b). By the J–T stage, the previously dispersed high-exposure areas became increasingly concentrated in central-southern Henan and northern Anhui, forming a more distinct southern exposure center (Figure 6c). This concentration strengthened further during the T–M stage, when high exposure extended across central-southern and eastern Henan, northern Anhui, and adjacent northern Jiangsu, forming a more spatially coherent high-exposure belt in the southern HHH Plain (Figure 6d). Across phenological stages, potential exposure shifted from a relatively dispersed S–J pattern to a more concentrated distribution during J–T and T–M. High-exposure areas increasingly converged toward the southern HHH Plain, with the strongest spatial concentration occurring during T–M.
5. Discussion
5.1. Phenological-Stage Differences in Summer Maize CHDEs and Their Agronomic Implications
Stage-specific analysis showed that long-term changes in CHDE frequency and mean duration became more pronounced toward the middle and late stages of summer maize development. The S–J stage was characterized by a relatively high baseline frequency, whereas mean duration showed no significant increase. Mean duration increased significantly during J–T, while T–M showed the fastest increase in frequency together with a significant increase in mean duration. The T–M stage therefore showed the most pronounced concurrent increases in CHDE frequency and mean duration, with the significant increase in mean duration already evident during J–T.
This stage dependence is consistent with phenological variation in heat sensitivity and crop water demand [14,23]. During J–T, maize transitions from vegetative to reproductive growth, while crop water demand increases toward tasseling [23]. Persistent compound heat and drought stress during this stage may impair rapid vegetative growth and reproductive organ differentiation [14]. The T–M stage encompasses tasseling, pollination, kernel set, and grain filling, when maize is particularly sensitive to heat and water deficits [14]. These findings support prioritizing the J–T and T–M stages for compound heat–drought risk management across the HHH Plain, particularly by maintaining adequate water supply around tasseling and during grain filling. Integrating short-term heat forecasts with crop water-deficit monitoring could help identify persistent compound-stress episodes requiring timely intervention. Over the longer term, heat- and drought-tolerant cultivars may further reduce crop vulnerability during critical growth stages.
5.2. Spatial Heterogeneity of CHDEs and Potential Summer Maize Exposure
Spatial differentiation of CHDEs across phenological stages was most evident in frequency, whereas regional contrasts in mean duration and mean intensity were comparatively weak. Phenological differences in CHDE spatial patterns were therefore expressed mainly through regional variation in frequency. Agricultural drought and compound heat–drought conditions across the HHH Plain are influenced by hydroclimatic conditions, land-surface thermal characteristics, and topography, and the relative importance of these factors varies spatially [30,31]. Such regional environmental heterogeneity likely contributes to the stronger spatial variation in CHDE frequency across phenological stages. The observed spatial patterns thus reflect the combined effects of crop phenology and regional environmental conditions on CHDE occurrence.
Potential exposure was more spatially concentrated, with higher values in central-southern and eastern Henan, northern Anhui, and adjacent northern Jiangsu. During T–M, the fastest increase in frequency and the significant increase in mean duration occurred alongside relatively high potential exposure in these major summer maize production areas. The co-occurrence of stronger long-term CHDE changes and concentrated potential exposure identifies T–M as the clearest late-season risk window in the HHH Plain. Adequate water supply during critical growth stages can reduce heat- and drought-related impacts on maize [32], while breeding advances can improve drought resistance [33]. In the identified high-exposure areas, adaptation should therefore focus on compound heat–drought monitoring during T–M, water management during critical growth periods, and the deployment of drought-resistant cultivars.
5.3. Limitations
This study has several limitations. First, the 3-day minimum-duration criterion excludes 1–2-day compound episodes, and the event definition does not capture sequential or lagged heat–drought interactions [34,35]. The use of climatological phenological dates throughout 1980–2020 also ignores interannual variability and long-term shifts in crop development, which may affect the assignment of CHDEs to phenological stages. Second, station-based and represent regional meteorological compound stress and may not fully capture field-scale crop conditions [32,36,37]. LE estimates also inherit uncertainty from the spatial interpolation of station-based CSI [38]. Annual or dynamically simulated phenology, crop-relevant observations, and higher-resolution meteorological data would help reduce these uncertainties. Finally, LE was estimated using the 2020 summer maize cultivation map as a fixed spatial reference because comparable annual cultivation data are unavailable for the full 1980–2020 period. LE therefore represents long-term potential exposure under the 2020 cultivation pattern rather than historical exposure. Expansion of maize cultivation toward 2020 may overestimate exposure for earlier periods, whereas cultivation contraction may lead to underestimation. Time-varying crop maps would allow this uncertainty to be quantified [39].
6. Conclusions
Rather than treating the summer maize growing season as a uniform climatic window, this study explicitly incorporated phenological-stage differences in heat sensitivity and crop water demand into both CHDE identification and potential exposure assessment. This phenology-aware framework reveals pronounced within-season contrasts that are obscured at the whole-growing-season scale, demonstrating that the evolution of compound stress is strongly dependent on crop developmental stage. Most notably, the tasseling-to-maturity stage showed the fastest increase in CHDE frequency together with a significant lengthening of event duration, identifying this period as the dominant late-season window of increasing compound stress. Potential exposure also became progressively more spatially concentrated as the crop developed, with the strongest exposure during tasseling-to-maturity centered in major summer-maize-producing areas of central-southern and eastern Henan, northern Anhui, and adjacent northern Jiangsu. These findings demonstrate that explicitly resolving phenological-stage-specific crop sensitivity can substantially improve the identification of when and where compound heat–drought stress poses the greatest potential threat, providing a more targeted basis for agrometeorological monitoring, irrigation management, and climate adaptation.
Author Contributions
Conceptualization, X.P., J.Y. and J.W.; methodology, X.P., H.Z. and J.Y.; software, X.P. and C.Z.; validation, H.Z., C.Z. and J.Y.; formal analysis, X.P. and H.Z.; investigation, X.P., H.Z. and C.Z.; resources, J.Y., W.Z. and J.W.; data curation, X.P., H.Z. and J.Y.; writing—original draft preparation, X.P.; writing—review and editing, J.Y., W.Z. and J.W.; visualization, X.P. and C.Z.; supervision, W.Z. and J.W.; project administration, W.Z. and J.W. All authors have read and agreed to the published version of the manuscript.
Funding
This research was funded by Ministry of Science and Technology of the People’s Republic of China: 2022xjkk0600.
Data Availability Statement
The datasets analyzed in this study are publicly available from the data repositories described in Section 2.2.
Conflicts of Interest
The authors declare no conflicts of interest.
Abbreviations
The following abbreviations are used in this manuscript:
| CHDE | compound heat and drought event |
| HHH | Huang–Huai–Hai |
| S–J | sowing-to-jointing stage |
| J–T | jointing-to-tasseling stage |
| T–M | tasseling-to-maturity stage |
| EGS | entire growing season |
| Pre | precipitation |
| daily mean relative humidity | |
| daily mean temperature | |
| daily maximum temperature | |
| daily minimum temperature | |
| daily mean wind speed | |
| SSD | sunshine duration |
| SPEI | standardized precipitation evapotranspiration index |
| crop-coefficient-adjusted standardized precipitation evapotranspiration index | |
| reference evapotranspiration | |
| crop evapotranspiration | |
| DS | drought severity |
| HD | daily heat exceedance |
| CHDS | compound heat–drought stress intensity |
| CHDI | compound heat–drought intensity |
| CSI | cumulative compound-stress index |
| LE | potential land exposure |
References
- Zscheischler, J.; Westra, S.; Van Den Hurk, B.J.J.M.; Seneviratne, S.I.; Ward, P.J.; Pitman, A.; AghaKouchak, A.; Bresch, D.N.; Leonard, M.; Wahl, T.; et al. Future Climate Risk from Compound Events. Nat. Clim. Change 2018, 8, 469–477. [Google Scholar] [CrossRef] [Scilit]
- Grossiord, C.; Buckley, T.N.; Cernusak, L.A.; Novick, K.A.; Poulter, B.; Siegwolf, R.T.W.; Sperry, J.S.; McDowell, N.G. Plant Responses to Rising Vapor Pressure Deficit. New Phytol. 2020, 226, 1550–1566. [Google Scholar] [CrossRef] [Scilit] [PubMed]
- Heino, M.; Kinnunen, P.; Anderson, W.; Ray, D.K.; Puma, M.J.; Varis, O.; Siebert, S.; Kummu, M. Increased Probability of Hot and Dry Weather Extremes during the Growing Season Threatens Global Crop Yields. Sci. Rep. 2023, 13, 3583. [Google Scholar] [CrossRef] [Scilit]
- Shiferaw, B.; Prasanna, B.M.; Hellin, J.; Bänziger, M. Crops That Feed the World 6. Past Successes and Future Challenges to the Role Played by Maize in Global Food Security. Food Secur. 2011, 3, 307–327. [Google Scholar] [CrossRef] [Scilit]
- Erenstein, O.; Jaleta, M.; Sonder, K.; Mottaleb, K.; Prasanna, B.M. Global Maize Production, Consumption and Trade: Trends and R&D Implications. Food Secur. 2022, 14, 1295–1319. [Google Scholar] [CrossRef] [Scilit]
- Schlenker, W.; Roberts, M.J. Nonlinear Temperature Effects Indicate Severe Damages to U.S. Crop Yields under Climate Change. Proc. Natl. Acad. Sci. USA 2009, 106, 15594–15598. [Google Scholar] [CrossRef] [Scilit] [PubMed]
- Li, H.; Tiwari, M.; Tang, Y.; Wang, L.; Yang, S.; Long, H.; Guo, J.; Wang, Y.; Wang, H.; Yang, Q.; et al. Metabolomic and Transcriptomic Analyses Reveal That Sucrose Synthase Regulates Maize Pollen Viability under Heat and Drought Stress. Ecotoxicol. Environ. Saf. 2022, 246, 114191. [Google Scholar] [CrossRef] [Scilit] [PubMed]
- Shen, S.; Liang, X.; Zhang, L.; Zhao, X.; Liu, Y.; Lin, S.; Gao, Z.; Wang, P.; Wang, Z.; Zhou, S. Intervening in Sibling Competition for Assimilates by Controlled Pollination Prevents Seed Abortion under Postpollination Drought in Maize. Plant Cell Environ. 2020, 43, 903–919. [Google Scholar] [CrossRef] [Scilit] [PubMed]
- Luo, N.; Meng, Q.; Feng, P.; Qu, Z.; Yu, Y.; Liu, D.L.; Müller, C.; Wang, P. China Can Be Self-Sufficient in Maize Production by 2030 with Optimal Crop Management. Nat. Commun. 2023, 14, 2637. [Google Scholar] [CrossRef] [Scilit] [PubMed]
- Ren, P.; Huang, F.; Li, B. Spatiotemporal Patterns of Water Consumption and Irrigation Requirements of Wheat-Maize in the Huang-Huai-Hai Plain, China and Options of Their Reduction. Agric. Water Manag. 2022, 263, 107468. [Google Scholar] [CrossRef] [Scilit]
- Liu, R.; Sun, S.; Ju, L.; Wang, Q.; Zou, Y.; Zhang, Y.; Miao, L. Evolutionary Characteristics and Spatiotemporal Trend of Meteorological Drought in the Huang-Huai-Hai Plain. Trans. Chin. Soc. Agric. Eng. 2023, 39, 85–92. [Google Scholar] [CrossRef]
- Liu, S.; Wu, W.; Yang, X.; Yang, P.; Sun, J. Exploring Drought Dynamics and Its Impacts on Maize Yield in the Huang-Huai-Hai Farming Region of China. Clim. Change 2020, 163, 415–430. [Google Scholar] [CrossRef] [Scilit]
- Liu, Z.; Qiu, R.; Zhang, Q. Differences in Effects of Varying Compound Extreme Temperature and Precipitation Events on Summer Maize Yield in North China. Agric. Water Manag. 2025, 307, 109237. [Google Scholar] [CrossRef] [Scilit]
- Li, Q.; Wang, P.; Li, Y.; Tang, J.; Li, X.; Zhang, Y.; Han, D.; Zhao, Y.; Wang, Q.; Yang, Z. Identifying Trigger Thresholds for Heat Damage at Different Growth Stages of Summer Maize: A Case Study of the Huang-Huai-Hai Plain, China. Eur. J. Agron. 2025, 170, 127729. [Google Scholar] [CrossRef] [Scilit]
- Wang, R.; Zhang, X.; Cong, L.; Wang, Y.; Bai, X. Risk Assessment of Compound Dry–Hot Events for Maize in Liaoning Province. Atmosphere 2024, 15, 834. [Google Scholar] [CrossRef] [Scilit]
- He, Y.; Zhao, Y.; Duan, Y.; Hu, X.; Fang, J. Projected Increase in Compound Drought and Hot Days over Global Maize Areas under Global Warming. Water 2024, 16, 621. [Google Scholar] [CrossRef] [Scilit]
- Feng, S.; Hao, Z.; Wu, X.; Zhang, X.; Hao, F. A Multi-Index Evaluation of Changes in Compound Dry and Hot Events of Global Maize Areas. J. Hydrol. 2021, 602, 126728. [Google Scholar] [CrossRef] [Scilit]
- Yang, J.; Wu, J.; Zhou, L.; Zhou, H.; Zhang, Z.; Zhang, R. Characteristics of Compound Heat and Drought Events during the Spring Maize Growing Season in Northeast China Based on a Novel Daily-Scale Analysis Framework. J. Hydrol. Reg. Stud. 2025, 57, 102140. [Google Scholar] [CrossRef] [Scilit]
- Vicente-Serrano, S.M.; Beguería, S.; López-Moreno, J.I. A Multiscalar Drought Index Sensitive to Global Warming: The Standardized Precipitation Evapotranspiration Index. J. Clim. 2010, 23, 1696–1718. [Google Scholar] [CrossRef] [Scilit]
- Wan, C.; Yang, X.; Cheng, C.; Zhang, Y.; Du, B.; Zhang, Z.; Ye, S. Understanding the Regional Impacts of Extreme Climate Events on Maize Yield by Incorporating Machine Learning with Crop Model in the Black Soil Region of China. Ecol. Indic. 2026, 186, 114846. [Google Scholar] [CrossRef] [Scilit]
- Wang, A.; Tao, H.; Ding, G.; Zhang, B.; Huang, J.; Wu, Q. Global Cropland Exposure to Extreme Compound Drought Heatwave Events under Future Climate Change. Weather Clim. Extrem. 2023, 40, 100559. [Google Scholar] [CrossRef] [Scilit]
- Cheng, X.; Gao, M.; Sun, X.; Wu, J.; Huang, J.; Duan, M.; Jiang, T.; Su, B. Regional Disparity in Impacts of Compound Heat and Drought Extremes on Population and Major Crops Across China. Int. J. Disaster Risk Sci. 2026, 17, 317–333. [Google Scholar] [CrossRef] [Scilit]
- Zhang, X.-X.; Sun, Z.-F.; Zheng, F.-X.; Liu, J.; Li, C.-R.; Wang, Y.-H. Characteristics of Drought Distribution for Summer Maize over Whole Growth Period in Huang-Huai-Hai Plain Based on Crop Water Deficit Index. Chin. J. Agrometeorol. 2021, 42, 495–506. [Google Scholar] [CrossRef]
- Allen, R.G.; Pereira, L.S.; Raes, D.; Smith, M. Crop Evapotranspiration: Guidelines for Computing Crop Water Requirements; FAO Irrigation and Drainage Paper 56; Food and Agriculture Organization of the United Nations: Rome, Italy, 1998. [Google Scholar]
- Dong, J.; Xing, L.; Cui, N.; Zhao, L.; Guo, L.; Gong, D. Standardized Precipitation Evapotranspiration Index (SPEI) Estimated Using Variant Long Short-Term Memory Network at Four Climatic Zones of China. Comput. Electron. Agric. 2023, 213, 108253. [Google Scholar] [CrossRef] [Scilit]
- Gringorten, I.I. A Plotting Rule for Extreme Probability Paper. J. Geophys. Res. 1963, 68, 813–814. [Google Scholar] [CrossRef] [Scilit]
- Yevjevich, V.M. An Objective Approach to Definitions and Investigations of Continental Hydrologic Droughts; Hydrology Paper No. 23; Colorado State University: Fort Collins, CO, USA, 1967. [Google Scholar]
- Deng, J.; Duan, Y.; Ma, Z.; Li, Z.; Li, M.; Wei, W.; Yang, Q.; Zheng, Z. Regional Compound Drought and Heatwave Events over China and Evaluation of ERA5-Land Dataset Based on Classification Approach. Weather Clim. Extrem. 2026, 52, 100874. [Google Scholar] [CrossRef] [Scilit]
- Cressie, N.A.C. Statistics for Spatial Data, Revised edition; Wiley: New York, NY, USA, 1993. [Google Scholar] [CrossRef] [Scilit]
- Hou, X.-X.; Liu, Y.; Zhang, X.; Ma, Q.; Shang, G. Spatiotemporal Dynamics and Drivers of Agricultural Drought in the Huang-Huai-Hai Plain Based on Crop Water Stress Index and Spatial Machine Learning. Remote Sens. 2025, 17, 3678. [Google Scholar] [CrossRef] [Scilit]
- Zhao, Y.; Wang, L.; Jiang, Q.; Wang, Z.; Guo, X. Spatiotemporal Evolution of Compound Soil Drought-Heat Events and Their Impact Mechanisms on Ecosystem Productivity across China. J. Environ. Manag. 2025, 395, 127981. [Google Scholar] [CrossRef] [Scilit] [PubMed]
- Zhang, L.; Bai, G.; Evett, S.R.; Colaizzi, P.D.; Xue, Q.; Marek, G.; Dhungel, R.; Zhao, H.; Wan, N.; Lin, X. Increased Irrigation Could Mitigate Future Warming-Induced Maize Yield Losses in the Ogallala Aquifer. Commun. Earth Environ. 2025, 6, 483. [Google Scholar] [CrossRef] [Scilit]
- Zhao, H.; Tack, J.B.; Kluitenberg, G.J.; Kirkham, M.B.; Sassenrath, G.F.; Zhang, L.; Wan, N.; Liu, Z.; Zhao, J.; Ashworth, A.; et al. Concurrent Improvements in Maize Yield and Drought Resistance through Breeding Advances in the U.S.Corn Belt. Nat. Commun. 2025, 16, 9389. [Google Scholar] [CrossRef] [Scilit] [PubMed]
- Li, Q.; Wang, P.; Zhang, Y.; Tang, J.; Li, Y.; Han, D.; Feng, R.; Cheng, L. Dominant Types of Compound Agricultural Drought and Heat Events and Their Distinct Impacts on Maize Yield. J. Integr. Agric. 2026. [Google Scholar] [CrossRef] [Scilit]
- Sutanto, S.J.; Zarzoza Mora, S.B.; Supit, I.; Wang, M. Compound and Cascading Droughts and Heatwaves Decrease Maize Yields by Nearly Half in Sinaloa, Mexico. npj Nat. Hazards 2024, 1, 26. [Google Scholar] [CrossRef] [Scilit]
- Navarrete Sánchez, R.A.; Tognetti, P.M.; Maddonni, G.A. Immediate and Lasting Effects of Heat or Water Stress on Summer Tropical Maize Lines and Derived Hybrids. Eur. J. Agron. 2025, 170, 127731. [Google Scholar] [CrossRef] [Scilit]
- Guo, Y.; Chen, Y.; Ren, H.; Wang, H.; Zhao, B.; Zhang, J.; Ren, B.; Liu, P. Heat and Drought Stress Impair Nitrogen Uptake and Allocation in Maize by Reshaping Root Morpho-Physiology. J. Integr. Agric. 2026, in press. [Google Scholar] [CrossRef] [Scilit]
- Doherty, C.T.; Wang, W.; Hashimoto, H.; Brosnan, I.G. A Method for Quantifying Uncertainty in Spatially Interpolated Meteorological Data with Application to Daily Maximum Air Temperature. Geosci. Model Dev. 2025, 18, 3003–3016. [Google Scholar] [CrossRef] [Scilit]
- Fu, Y.; Dong, J.; Shen, R.; Peng, Q.; Li, X.; Zheng, Y.; Pan, B.; Dong, J.; Qiu, B.; Huang, J.; et al. A 30-m Annual Distribution Dataset of Major Crops in China from 2001–2024. Sci. Data 2026, 13, 1074. [Google Scholar] [CrossRef] [Scilit] [PubMed]

Disclaimer/Publisher’s Note: The statements, opinions and data contained in all publications are solely those of the individual author(s) and contributor(s) and not of MDPI and/or the editor(s). MDPI and/or the editor(s) disclaim responsibility for any injury to people or property resulting from any ideas, methods, instructions or products referred to in the content. |
© 2026 by the authors. Licensee MDPI, Basel, Switzerland. This article is an open access article distributed under the terms and conditions of the Creative Commons Attribution (CC BY) license.