


Appl. Sci. 2026, 16(10), 5170; https://doi.org/10.3390/app16105170 (registering DOI) - 21 May 2026
Abstract
The transformative role of Digital Twins (DTs) in the Architecture, Engineering, and Construction (AEC) sector lies in their capacity to generate dynamic, data-driven representations of physical assets that support design, construction, and lifecycle management. To achieve their full potential, DTs must integrate accurate
[...] Read more.
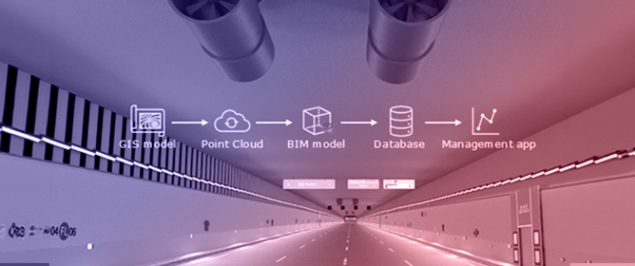
The transformative role of Digital Twins (DTs) in the Architecture, Engineering, and Construction (AEC) sector lies in their capacity to generate dynamic, data-driven representations of physical assets that support design, construction, and lifecycle management. To achieve their full potential, DTs must integrate accurate geometric models with continuously updated information reflecting real-world conditions. This information is inherently multidisciplinary and heterogeneous, encompassing structural, environmental, operational, and monitoring data characterized by different spatial and temporal scales. Integrating these diverse datasets into a unified DT environment presents significant challenges related to data heterogeneity, interoperability, varying resolutions, data quality, and uncertainty. This paper presents a PRISMA-based systematic literature review of data fusion techniques applied to DTs within the AEC sector, with particular emphasis on geotechnical and underground infrastructure. A Scopus search conducted on 31 March 2026 retrieved 10,124 records. After sequential screening, 1916 geotechnical-related records were retained for quantitative characterization, 719 records were assessed for eligibility, 454 reports were retained for manual assessment, and 82 studies were finally included in the detailed qualitative review. Existing approaches are classified according to their integration paradigms, methodological foundations, and application domains. Particular attention is given to applications in Geotechnical Engineering, where DTs must integrate sparse, indirect, and highly uncertain subsurface data. Geological conditions are characterized by strong spatial variability, limited observability, material heterogeneity, and epistemic uncertainty, which introduce additional complexities for data fusion compared to surface infrastructure systems. By synthesizing current developments and identifying methodological trends and research gaps, this review provides a structured framework to support the selection and adaptation of data fusion strategies for geotechnical DTs and other complex AEC applications operating under high uncertainty.
Full article