1. Introduction
High blood pressure (hypertension) is a prominent cause of death and disability worldwide. Between 1990 and 2019, the number of people with hypertension (blood pressure of ≥140
systolic or ≥90
diastolic) or on medication increased from 650 million to 1.3 billion [
1]. Unfortunately, most patients with hypertension are unaware of their ailment, although it silently affects their internal body organs (e.g., brain, eyes, kidneys, and viscus), which is why it is known as a silent killer [
2]. Therefore, accurate, continuous, beat-to-beat, blood pressure estimation is crucial for preventing heart disease and improving human health.
Traditional blood pressure estimation methods comprised cuff-based readings and continuous monitoring. However, cuff-based measures can be heavily influenced by aspects such as operator skill, cuff size, measuring setup and human error [
3]. Furthermore, this process only provides a single measurement of blood pressure at a specific moment, making it not ideal to trace blood pressure fluctuations over time. Blood pressure (BP) can fluctuate significantly over time due to various factors, such as diet, exercise, mental state, and stress [
4]. Continuous blood pressure monitoring, on the other hand, allows for a higher accurate estimation of a patient’s blood pressure state, comprising nightly blood pressure changes and variations during exercise. This approach allows doctors to more correctly assess patients’ problems and offer more personalized treatment solutions. It allows the early discovery of BP changes and the application of a suitable method to limit the continuation of hypertension. This is particularly crucial for preventing cardiovascular and cerebrovascular events, as well as lowering disease risks [
5]. Nonetheless, current continuous blood pressure monitoring techniques usually require the use of intrusive devices, such as intravascular catheters, which are prone to infections, difficult to handle, etc., [
6]. Traditional blood pressure measuring techniques have limits in practical applications, necessitating a non-invasive, continuous, and accurate method.
More researchers are delving into continuous blood pressure estimate techniques based on biosignals such as photoplethysmograms (PPGs), electrocardiograms (ECGs), and ballistocardiograms (BCGs) as a result of the recent developments in sensor technology, computer science, and artificial intelligence. Compared to traditional blood pressure measurement techniques, these unique systems that use Pulse Transit Time (PTT), Pulse Wave Velocity (PWV), and other manual feature extraction techniques offer various benefits, including non-invasiveness, real-time continuous monitoring, and user-friendliness [
7,
8,
9]. Many substantial gains have been produced in studies, focusing on estimating approaches that combine ECG and PPG data, demonstrating remarkable precision in blood pressure measurements [
10]. However, there are certain drawbacks to monitoring ECG signals. Prolonged usage of patch electrodes on the skin can limit airflow and cause pain for users [
11]. Moreover, blood pressure measurement systems that rely on various biological signals, including PPG, BCG, ECG and other signals, encounter challenges with data synchronization, information fusion, complex implementation, increased development costs, and limited noise resistance [
12]. In comparison, because the PPG waveform is normally recorded in the fingers, it provides a better consistent estimation value than multiple channel signal gathering, making it ideal for long blood pressure estimation trials. The PPG signal is a simple and inexpensive way to depict the volumetric change of blood flow in the heart. An oximeter that illuminates the skin is used to measure it, and the reflection it produces is directly related to variations in blood flow volume. The PPG signal is a viable option for blood pressure estimation in an environment with limited resources due to its adaptability in terms of the inference to efficiency ratio [
13]. Although systems based solely on a single PPG signal provided a more straightforward method by avoiding the intricacies and problems linked with several sensors, machine learning and some deep learning methods relied on a sophisticated manual feature extraction technique [
14,
15], which requires professional knowledge and experience, necessitating a fully automatic PPG feature extraction technique using deep learning methods to further simplify the data collection/processing procedure. Thus, it is important to eliminate the need for complex expert domain knowledge manual feature extraction methods [
5,
16,
17].
This research describes a unique approach for continuous blood pressure measurement using an efficient single-model
cBP-Tnet multi-task learning Transformer network with automated PPG feature extraction.
cBP-Tnet enhances the accuracy and robustness of non-invasive continuous blood pressure estimation using large-scale Multiparameter Intelligent Monitoring in Intensive Care II (MIMIC-II) public datasets [
18,
19]. The proposed
cBP-Tnet method for the cuff-less estimation of blood pressure has the potential to be integrated and enable non-invasive continuous monitoring via home and mobile healthcare devices. The key contributions of this work are summarized below:
- a.
To date,
cBP-Tnet was the only deep learning method with automatic photoplethysmogram feature extraction [
5,
16,
17] to have both systolic (MAE: 4.32 mmHg) and diastolic (MAE: 2.18 mmHg) blood pressure acceptable in accordance to the Association for the Advancement of Medical Instrumentation (AAMI)’s international standards (<5 mmHg, >85 subjects) [
20].
- b.
cBP-Tnet was designed effectively as it is a single-channel model, taking into account recent deep learning methods for continuous non-invasive blood pressure monitoring [
5,
16,
17], which were hybrid and/or complex in design and needed multiple models to operate.
- c.
The
cBP-Tnet method is 13.67% faster to train and outputs better as well as AAMI-accepted results compared to recent studies [
5] in the field.
The rest of this work is organized as follows:
Section 2 addressed the current AI methods for continuous non-invasive blood pressure measurement with a single-channel PPG.
Section 3 covered the pipeline and the suggested
cBP-Tnet single-channel and model deep learning architecture for blood pressure estimation.
Section 4 presents the experimental findings, compares them to the AAMI international standards and other recent publications, and
Section 5 concludes the research.
2. Related Works
Existing AI methods for continuous cuff-less non-invasive blood pressure measurement with a single-channel PPG are divided into two types: classical machine and deep learning methods. Classical machine learning approaches include manually identifying features from raw PPG data and then developing a regression algorithm using classical machine learning models to measure diastolic and systolic blood pressure in people [
15]. As an example, one of the initial trials for BP measurement using PPG signals was only undertaken by Teng and Zhang in 2003 [
21], wherein they investigated the association between Arterial Blood Pressure (ABP) and specific PPG waveform characteristics. Data were obtained from 15 healthy and young subjects utilizing specialized equipment in a well-controlled atmosphere with no movement, complete silence, and constant temperature. Correlation analysis was utilized for feature selection, and the relationship was modeled with a linear regression approach. In another work, Kurylyak et al. in 2013 [
22] retrieved 21 factors from more than 15,000 cardiac training samples in the MIMIC database. These characteristics were used as input features for an ANN that estimated blood pressure with PPG data. This strategy proves to be better than the linear regression technique. Liu et al. in 2017 [
23] used 14 features from the second derivative of PPG (SDPPG) and blended them with the 21 features from [
22]. To better forecast systolic and diastolic blood pressure, they used an SVM as a BP estimator. Compared to [
22]’s 21 characteristics and the use of an ANN, their strategy improved BP estimation accuracy by 40%. The need for superior PPG waveforms to reliably detect PPG waveform feature points is a fundamental issue for systems that combine manual features with classical machine learning for blood pressure calculation. However, PPG waveforms captured by wearable devices frequently contain high motion aberrations and noise, making it hard to detect crucial feature points such as troughs, inflection points, peaks and dicrotic notches. As a result, the series of features formed by arranging these feature points has significant errors. Furthermore, generating and selecting manual features necessitates professional expertise and experience, as well as multiple efforts to identify the ideal feature set, which limits practical applications.
With the improvement in processing capacity, we have switched our focus to automated feature extraction methodologies for PPG waveforms utilizing deep learning models [
15]. Deep learning models, unlike classical machine learning models, are great at learning features exactly from original data, removing the requirement for manual feature engineering and capitalizing on the latent data contained in original signals. Slapničar et al. in 2019 [
16] proposed a residual neural network (ResNet) model that used a recurrent (RNN) and convolutional neural network (CNN) to interpret PPG signals’ frequency and time-domain details and then combined the recovered characteristics to estimate SBP and DBP. Their analyses of 510 participants from the MIMIC III database yielded an MAE of 6.88 mmHg and 9.43 mmHg for DBP and SBP measurements, respectively. However, their ResNet model needs a very long training sequence of 10,000 epochs, making it prone to overfitting. Additionally, both DBP and SBP failed to meet the accuracy requirements outlined by the AAMI international standard that the MAE must be less than 5 mmHg [
20]. In another study, Rong and Li in 2021 [
17] introduced a multi-type feature fusion (MTFF) neural network model for blood pressure (BP) estimation using PPG only. The model consists of two CNNs that train the morphological and frequency spectrum aspects of the PPG signal, as well as a bidirectional long short-term memory (BiLSTM) network that trains the temporal features of the PPG signal. The MAE of the MTFF-ANN was 5.59 mmHg for SBP and 3.36 mmHg for DBP. However, MTFF-ANNs involve a complex feature extraction process and a low sample size of only 11,546 samples, which is not enough for deep learning methodologies; thus, they cannot be generalized. Furthermore, DBP failed to meet the accuracy requirements outlined by the AAMI international standard. Recently, Dai et al. in 2024 [
5] proposed a continuous blood pressure estimation model that joins the convolutional block attention module (CBAM) plus the temporal convolutional network (TCN). The MAE of SBP and DBP estimation using their TCN-CBAM algorithm is 5.35 mmHg and 2.12 mmHg, respectively, outperforming previous deep learning architecture with convolutional and recurrent neural network architectures. However, TCN-CBAM still needs a long training sequence of 1,500 epochs but becomes more efficient compared to [
16]. It also has a complex/hybrid deep learning architecture that uses two (2) models. In addition, the DBP still failed to meet the accuracy requirements outlined by the AAMI international standard.
Thus, none of the tested performance of three current deep learning models—ResNet, MTFF-ANN, and TCN-CBAM with automatic feature extraction using PPG signal—met both the SBP and DBP blood pressure estimation accuracy criteria defined by the AAMI international standard [
20]. Moreover, previous studies utilized complex automatic feature extraction [
17], hybrid models [
5], and long training times [
16], limiting the developed AI models’ potential to be integrated and enable non-invasive continuous monitoring via home and mobile healthcare devices. This study will explore transformer architectures, which have recently proven to be extremely effective for sequential data modeling by leveraging self-attention mechanisms to capture both local and global dependencies without the vanishing gradient issues of RNNs or the limited receptive fields of CNNs [
24]. As Transformers have the ability to collect both local waveform features and global temporal contexts, it makes them ideal for continuous, non-invasive blood pressure estimation based on sequential PPG data.
3. Materials and Methods
The
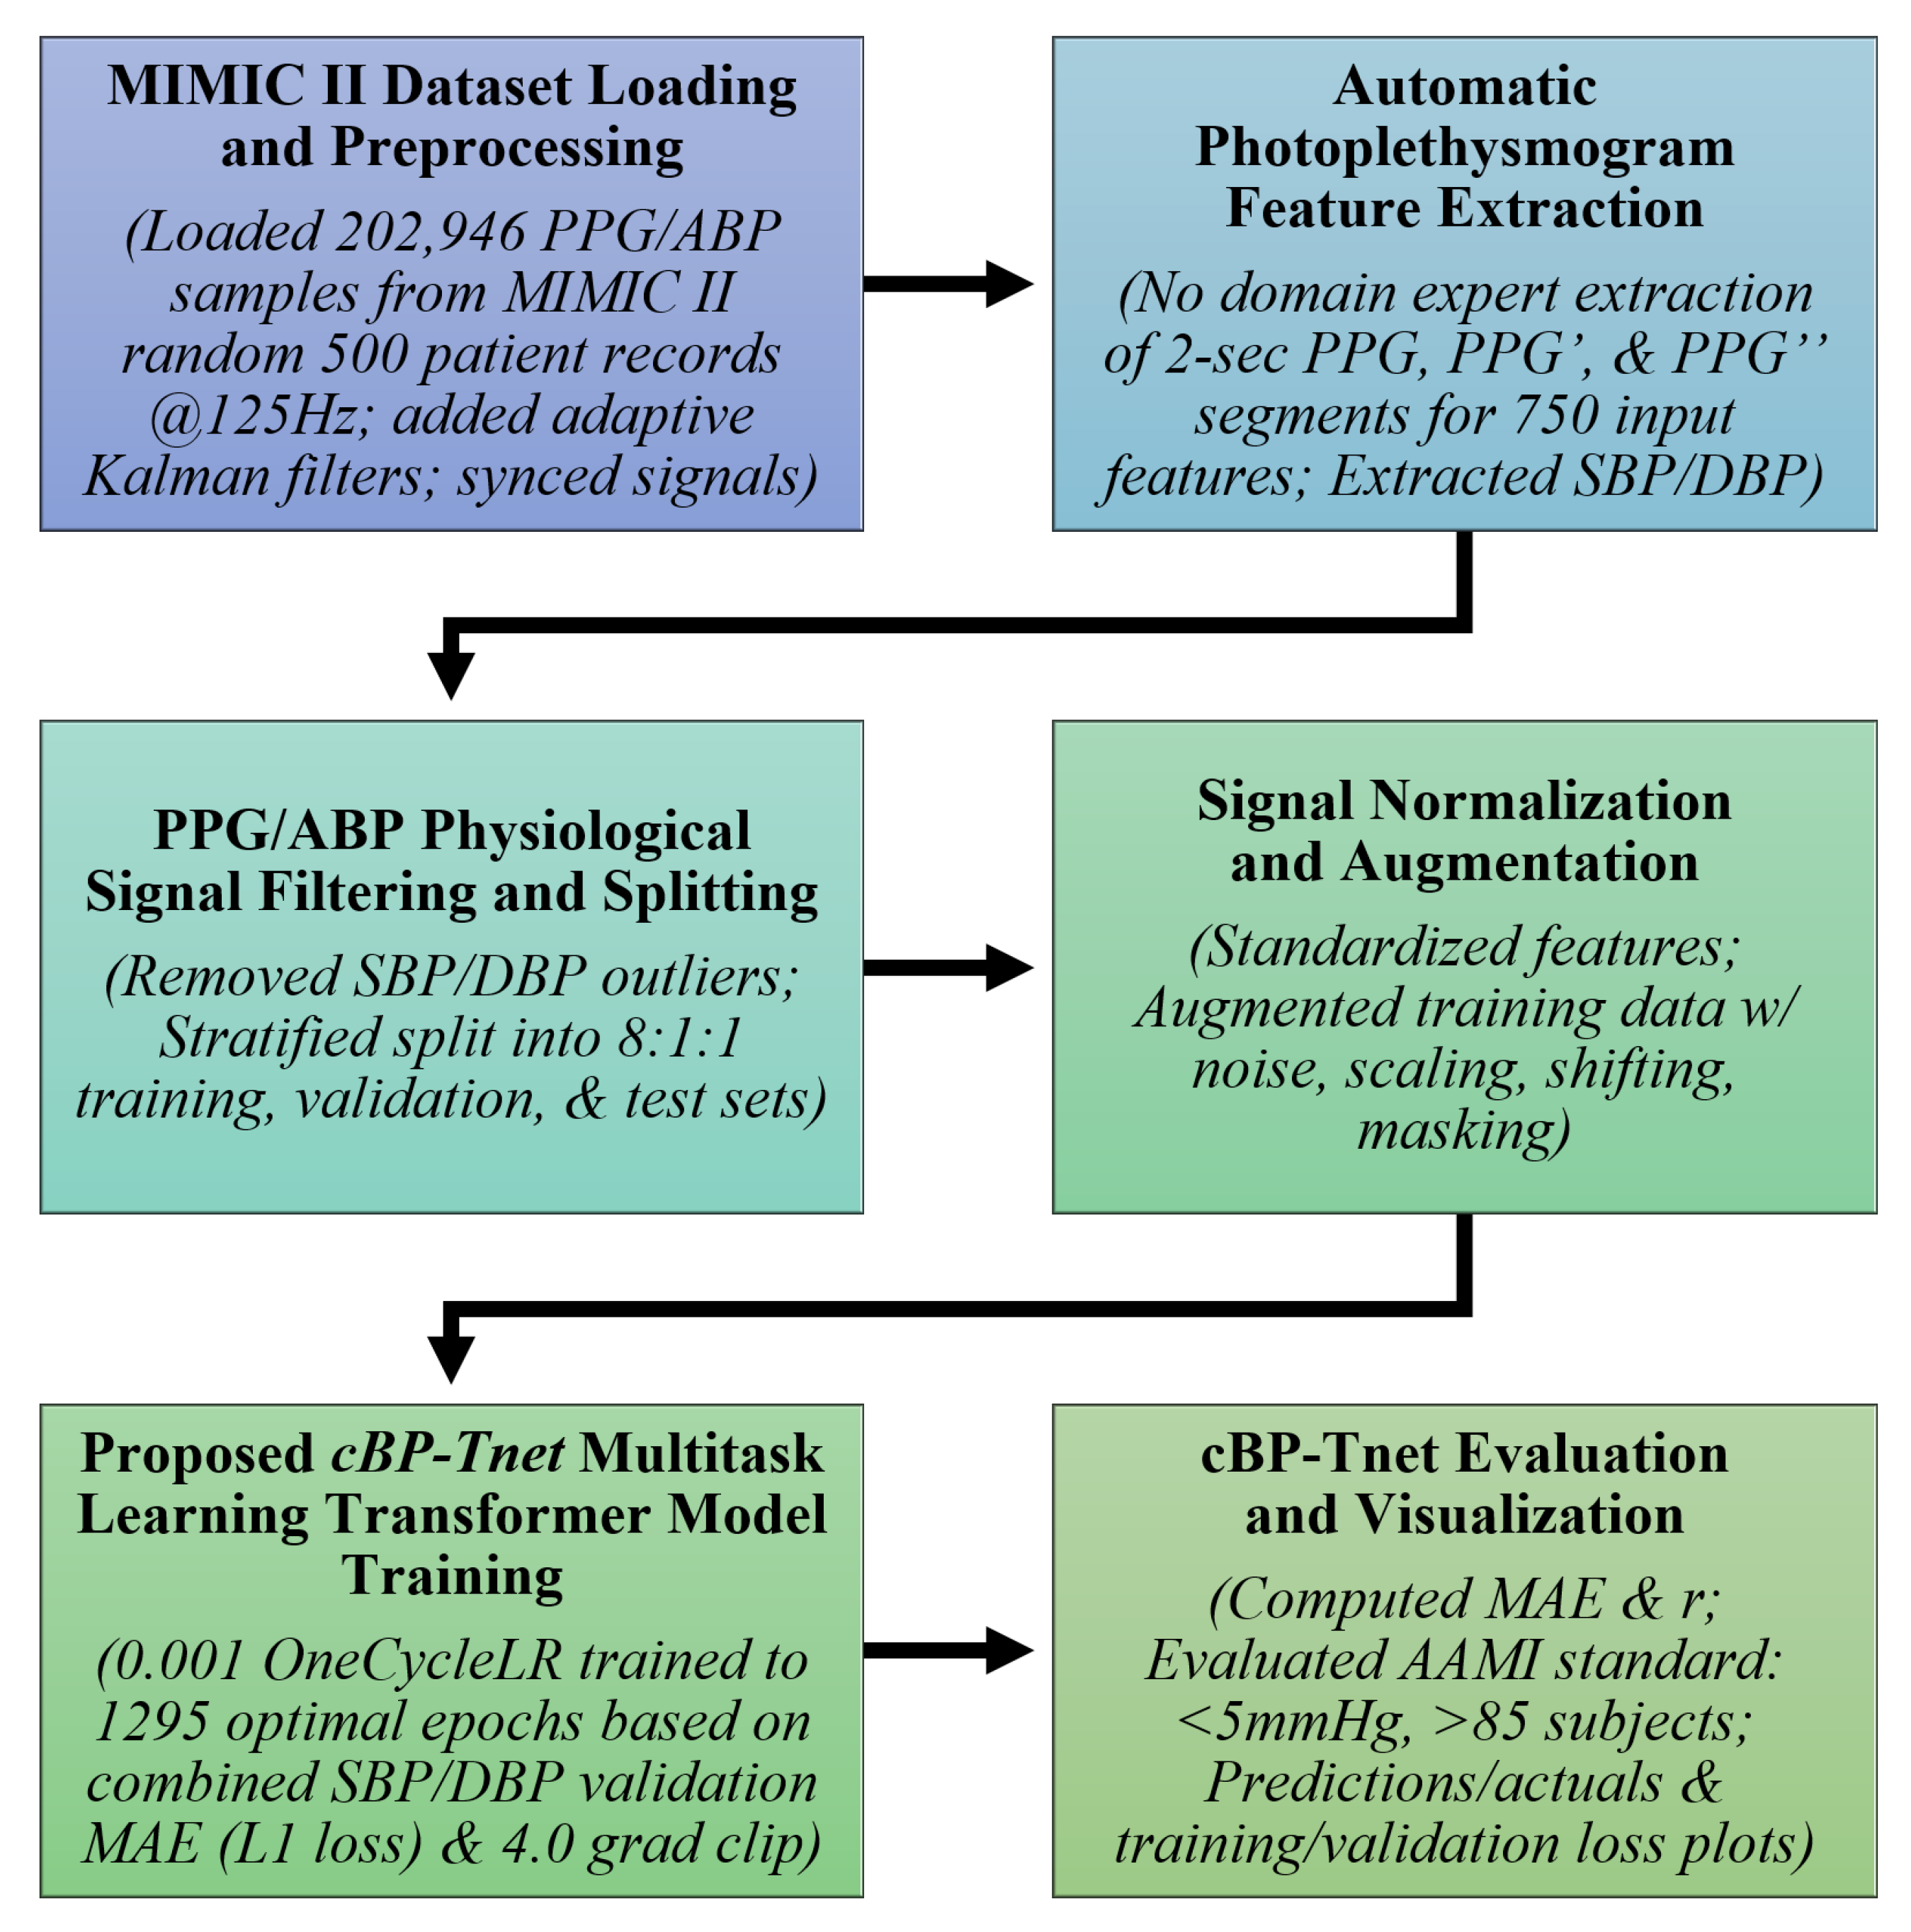
cBP-Tnet pipeline, as shown in
Figure 1, employs a multi-task learning Transformer-based architecture for continuous non-invasive blood pressure estimation. Transformers, which were originally developed for natural language processing, have proven useful for a variety of sequence modeling challenges due to their ability to capture long-range relationships through self-attention techniques [
24]. In this research, the input sequences are derived from a physiological signal—PPG. In classical machine learning contexts, a model is typically trained to perform a single predicted job. For example, you may use a regression model to estimate only SBP without DBP and vice versa. However, blood pressure measurement tasks frequently require closely related physiological signals. Systolic blood pressure (SBP) and diastolic blood pressure (DBP) are not independent; they result from the same underlying circulatory dynamics. Multi-task learning (MTL) takes advantage of this relatedness [
25]. By training a single model to predict both SBP and DBP simultaneously, the researchers hope to improve model generalization by sharing representations and constraints between tasks. Moreover, they hope to reduce the requirement for individual models, potentially increasing estimation accuracy for both SBP and DBP.
cBP-Tnet further uses adaptive Kalman filters to preprocess 202,956 synchronized PPG/ABP samples from random 500 subjects from the Multi-parameter Intelligent Monitoring in Intensive Care II (MIMIC II) database [
26], and it automatically extracts features from raw and derived PPG signals (PPG′ and PPG″), reducing the need for manual feature engineering. Outliers were removed, and the data were stratified for training (80%), validation (10%), and testing (10%). Signal augmentation and normalization improve robustness, while the multi-task learning Transformer model incorporates temporal relationships to predict both systolic and diastolic blood pressure simultaneously. The pipeline was tested against an international clinical benchmark—Advancement of Medical Instrumentation (AAMI) standards (<5 mmHg, >85 subjects)—confirming accurate, real-time, non-invasive blood pressure measurement and its potential to be integrated/enable non-invasive continuous monitoring by home and mobile healthcare devices.
Additionally, the pseudocode below, in
Table 1, further explains the pipeline of the
cBP-Tnet workflow implemented in JupyterLab (Version: 4.0.11): initially, random seeds are fixed and PPG/ABP CSV data are loaded, followed by signal smoothing with an adaptive Kalman filter. Next, filtered PPG/ABP pairs are synchronized and PPG peaks are detected. For each detected beat, a fixed-length PPG segment plus its first and second derivatives are concatenated into a feature vector. The corresponding SBP and DBP targets are obtained as the maximum and minimum of the aligned ABP segment. Out-of-range samples (SBP
or DBP
) are deleted, and the remaining data are stratified and divided into training, validation, and test sets. The process involves standardizing features, creating PyTorch (Version: 2.5.1) DataLoaders, and training is carried out with a multi-task Transformer model with a OneCycleLR scheduler and L1 loss; the best weights are saved. Finally, the model is tested on validation and test sets—calculating MAE, correlation coefficient, AAMI, and BHS metrics—and then converted to TorchScript for edge deployment, with test set MAE comparisons being reported.
3.1. MIMIC II Dataset Loading and Preprocessing
The Physionet Multi-parameter Intelligent Monitoring in Intensive Care (MIMIC) II Waveform database [
26] contains recordings of numerous physiological signals and parameters from ICU patients. The information was gathered from Boston’s Beth Israel Deaconess Medical Center (BIDMC) over a seven-year period beginning in 2001. MIMIC II version 2.6 had roughly 33,000 patients, with 25,000 adults (age
at time of last hospitalization) and 8000 newborns (age
at time of initial admission) [
27]. The researchers experimented on the subset of Kachuee et al.’s MIMIC II-derived cleaned cuff-less blood pressure estimation dataset [
19]. From the cleaned dataset, the researchers loaded 202,946 PPG/ABP samples from random 500 patient records at 125 Hz. Before training the multi-task Transformer, the raw signals (PPG and ABP) were filtered with an adaptive Kalman filter [
28] to decrease noise and then aligned in time using cross-correlation algorithms. The adaptive Kalman filter starts with a state estimate of 0, an error covariance of 1, a process variance of
, and a measurement variance of
. At each time point, the algorithm first projects the state forward and multiplies the covariance by the current process variance. It then calculates the Kalman gain, which is the ratio of projected covariance to the sum of projected covariance plus measurement variance, and it applies that gain to include the new measurement into the state estimate, updating the covariance accordingly. The sample’s filtered output is derived from the updated state. Finally, the squared difference between the measurement and the prior prediction is used to smooth both variances using exponential smoothing: each is multiplied by
and then incremented by
times the squared residual, allowing the filter to gradually adjust its confidence in the model versus the measurements. The synchronization function first converts each signal to a one-dimensional NumPy array and subtracts its mean before computing the full-length cross-correlation using
np.correlate(…, mode=‘full’). It calculates the lag by finding the index of the maximum correlation and subtracting
. If the lag is positive, it discards that many initial samples from the ABP signal and truncates the PPG signal to the same remaining length. If the lag is negative, it discards
samples from the start of the PPG signal and truncates the ABP signal accordingly. If the lag is zero, both signals remain unchanged. Finally, it returns a pair of synchronized, equal-length signal segments. These preprocessing stages produce cleaner, more aligned inputs, allowing the multi-task Transformer to focus on relevant patterns rather than being confused by noise or misalignment. Since PPG and ABP signals may not be perfectly aligned in time, cross-correlation was used to determine the lag between them. We synchronized signals for model training since the model attempts to map the non-invasive PPG to a continuous estimation of BP that resembles the ABP waveform [
15].
3.2. Automatic Photoplethysmogram Feature Extraction
The
cBP-Tnet automatically extracts 2 s features from raw and derived PPG signals, including its first and second derivatives (PPG′ and PPG″). The derivatives of the PPG signal also highlight biologically significant alterations (e.g., systolic and diastolic peaks), which are closely linked with SBP and DBP. The first and second derivatives emphasize slope changes and points of inflections, which are empirically proven effective with regard to being able to improve the models’ performance [
5,
16]. This reduces the need for handmade feature engineering, which was time-consuming and restricted to specific use cases [
5,
16,
17]. Instead, the model learns directly from minimally processed inputs, drawing on multi-task learning Transformer networks’ data driven capabilities:
The combination of [PPG, PPG′, PPG″] generates a rich feature space that captures waveform morphology. That is, a segment of PPG signal (and its derivatives) were truncated or zero-padded to a fixed length L [
29] for uniformity in 2 s intervals @125 Hz (250 samples each):
After synchronization, the segments had a total of 750 input features since raw PPG, PPG′ and PPG″ were sampled at 125 Hz. Simultaneously, SBP and DBP were extracted from ABP. By automatically extracting essential features directly from the PPG signal, the model minimizes domain-specific bias and assures scalability over a wide range of patient populations and situations.
3.3. PPG/ABP Data Filtering and Splitting
To provide robustness, the physiological signals were filtered and separated. Outlier elimination protects the model from being impacted by very high and atypical SBP/DBP values (SBP ≥ 180, SBP < 80, DBP ≥ 130, DBP ≤ 60) [
14]. After data filtering, to preserve the distribution of physiological targets of systolic blood pressure (SBP) and diastolic blood pressure (DBP) throughout all subsets, the dataset is stratified (8:1:1 ratio) into training (97,761), validation (12,220), and test sets (12,221). Because SBP and DBP are continuous variables, a common strategy is to bin (N=10) them into discrete categories before stratification. This limits the possibility of overfitting and guarantees a fair and thorough performance evaluation. A stratified splitting method (scikit-learn’s
train_test_split with the stratify option, N = 10) splits the dataset into training, validation, and test sets, each with similar SBP and DBP distributions [
30]. This technique assures that model evaluation represents real-world clinical situations and that performance indicators are not distorted by a disproportionate representation of specific blood pressure ranges.
3.4. Signal Normalization and Augmentation
Signal normalization and augmentation are important processes in the
cBP-Tnet pipeline. Normalization assigns a consistent scale to all raw 750 input PPG features. Normalizing guarantees that the model does not become biased toward any particular amplitude range, allowing the model to learn patterns rather than exact values. Subsequent data standardization of input features is performed. Because physiological data are frequently limited, several augmentation approaches are used to improve model resilience. During training, each raw PPG feature vector undergoes four random augmentations: with 50% probability, we add zero-mean Gaussian noise (std = 0.05); with 50% probability, we apply a uniform scaling factor drawn from
(scale_factor = 0.1); with 30% probability, we shift (“pan”) the signal by an integer between
and
samples (max_shift = 10), padding or truncating as needed; and with 30% probability, we zero out a contiguous block of 10 samples (mask_size = 10). Each augmentation is applied independently per sample, so multiple transforms can be combined on the same signal. By incorporating modifications, like noise addition, scaling, shifting, and masking, the model learns to be insensitive to tiny changes in signal amplitude, baseline shifts, and temporal distortions [
31]. These strategies simulate real-world variability, such as sensor placement and patient situations, hence improving model robustness.
3.5. Proposed cBP-Tnet Multi-Task Transformer Model Training
The pipeline’s main component is the proposed
cBP-Tnet model, a single-channel model deep learning architecture that makes use of a multi-task learning Transformer network.
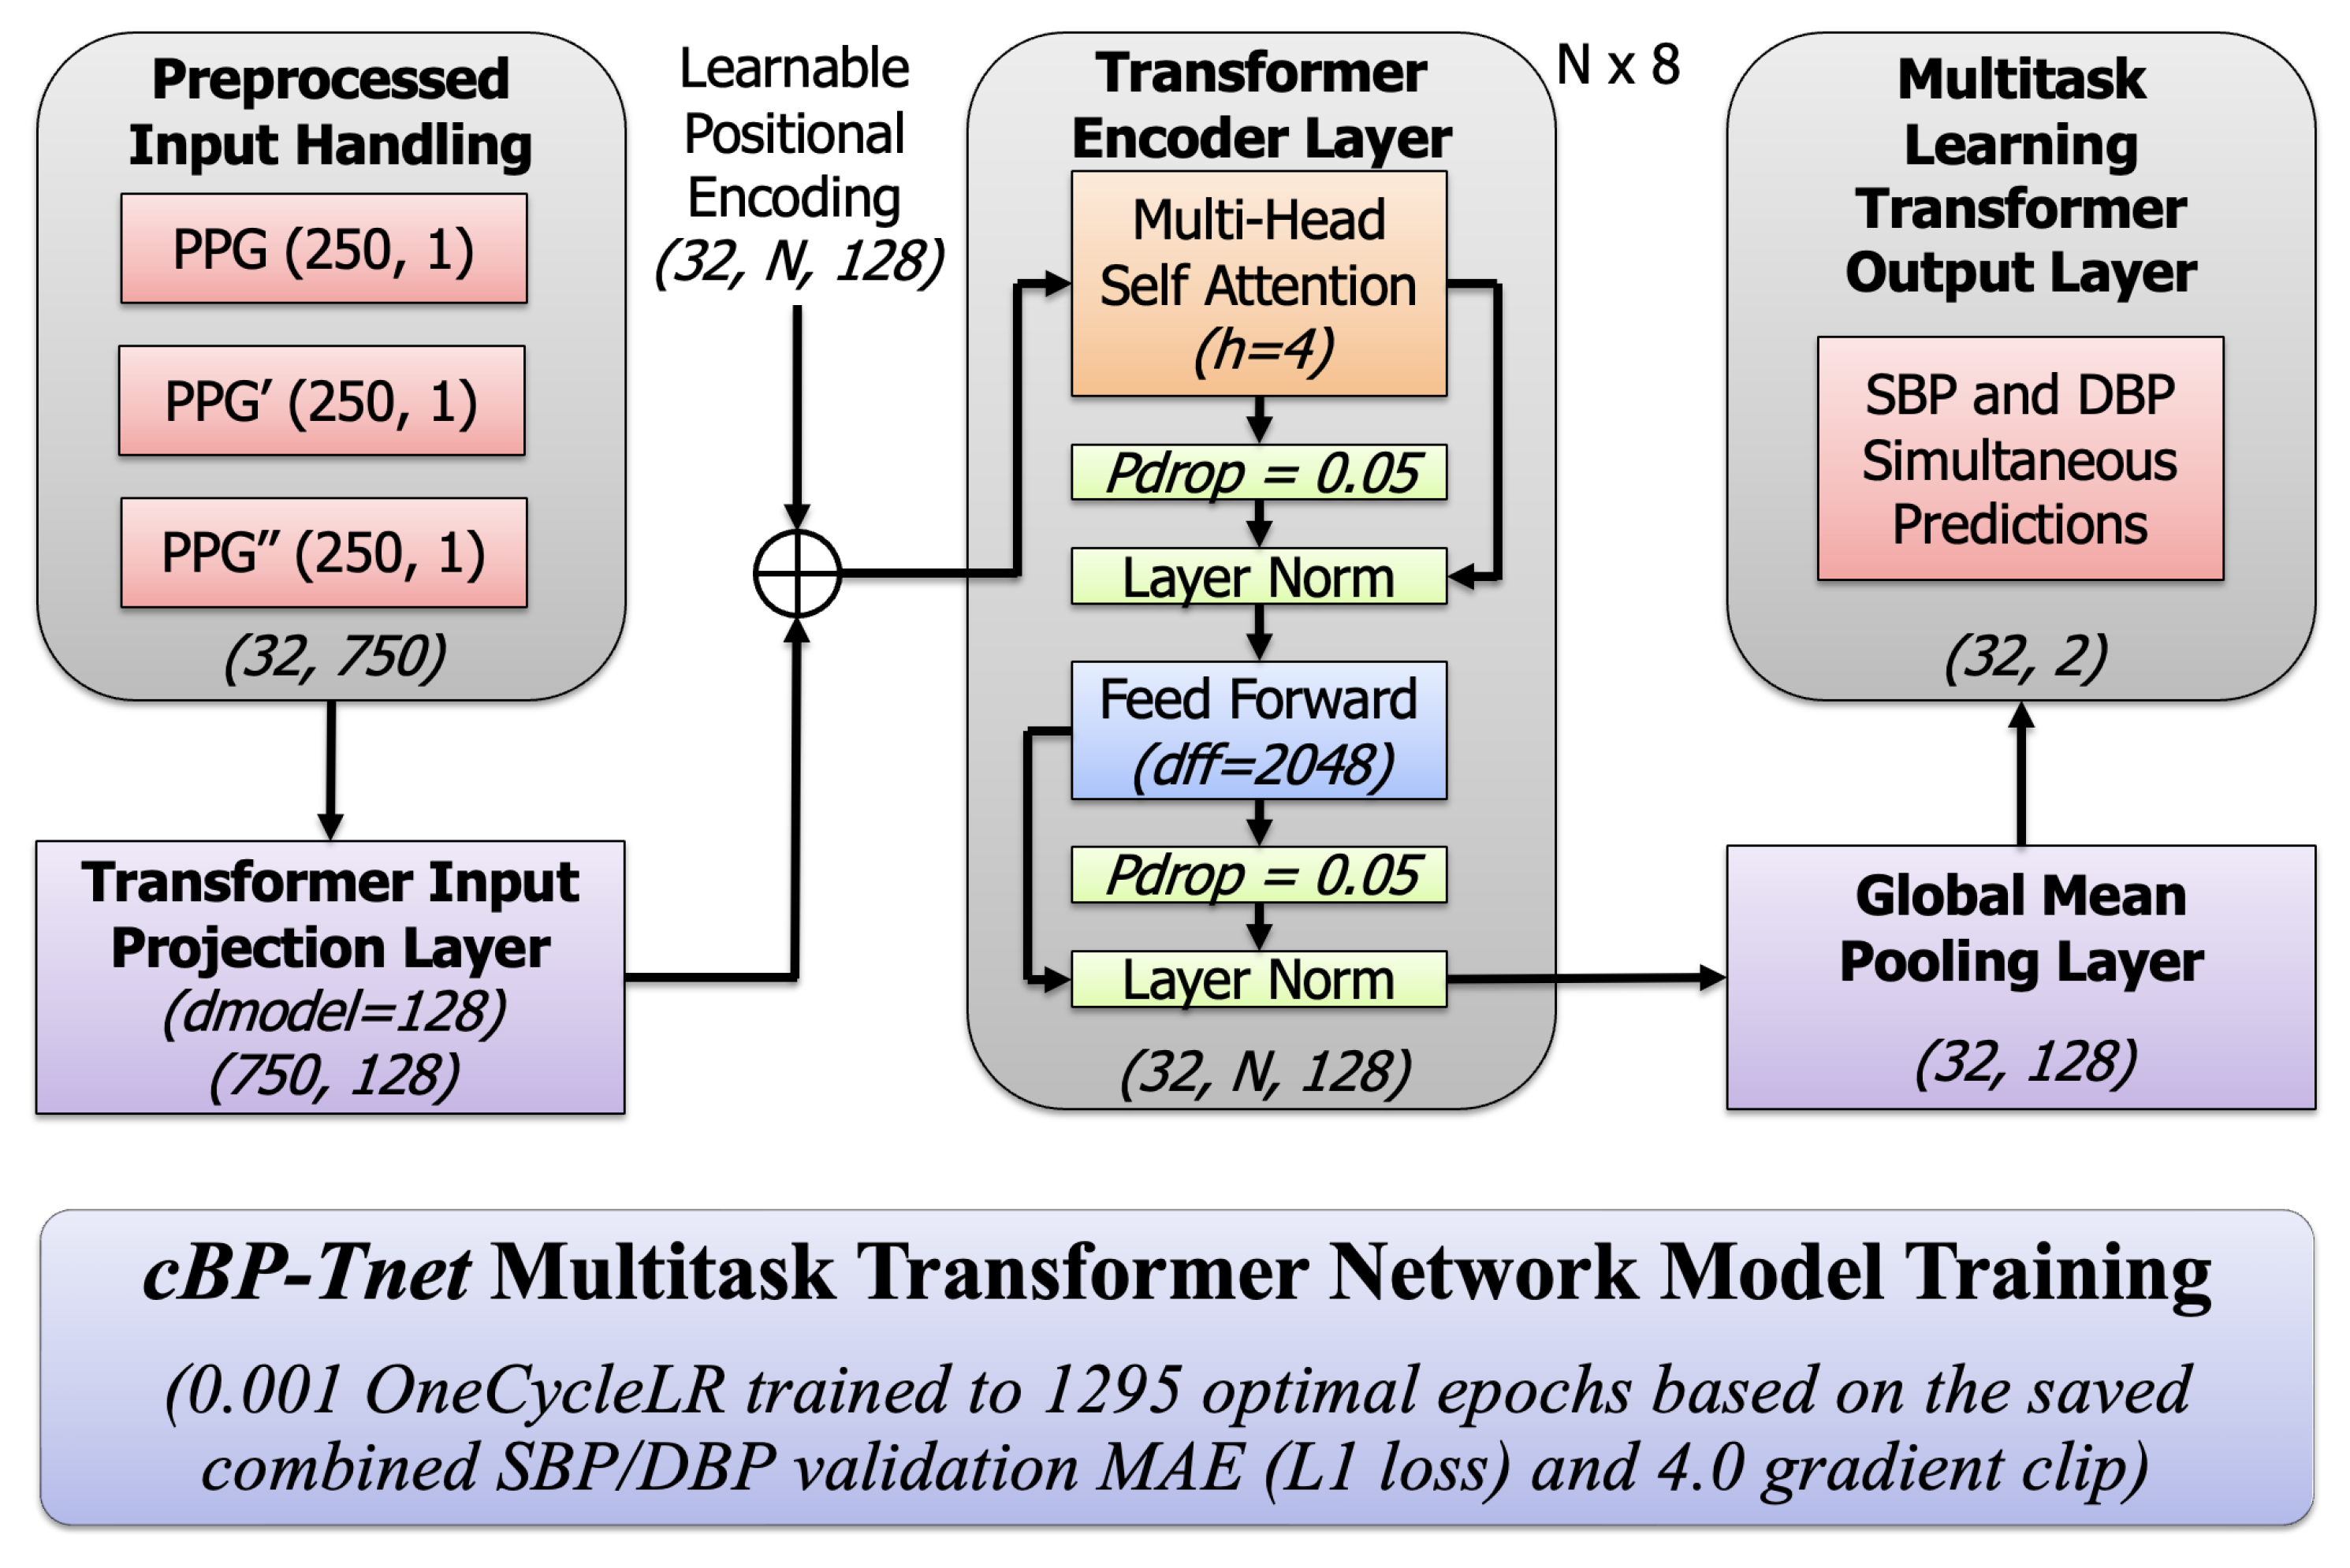
Figure 2 below displays a high-level architectural and training overview of a multi-task Transformer-based neural network called
cBP-Tnet, which was efficiently designed to predict blood pressure metrics using PPG data with automatic feature extraction. Transformers excel at processing sequential data because of their self-attention processes, which allow the model to dynamically weigh different parts of input signals [
24]. This can help catch tiny waveform patterns associated with blood pressure variations. The multi-task configuration (predicting both SBP and DBP) increases overall model performance. By learning both tasks concurrently, the model benefited from shared underlying representations in the PPG waveform, resulting in better generalization. The training procedure contains advanced approaches such as
OneCycleLR learning rate scheduling that starts with 0.001, which stabilizes and accelerates convergence [
32], designed to save the best model based on the best combined validation L1 loss to prevent overfitting [
15]. The model was trained across an optimal amount of 1295 epochs with combined SBP and DBP loss function L1 loss, providing task balance and smooth gradient updates with a 4.0 grad clip value [
33]. Using a
OneCycleLR scheduler, training begins with a gradual increase (“warm-up”) of the learning rate and then smoothly anneals it toward zero by the end of training, allowing the optimizer to avoid shallow local minima early on, accelerate convergence, and frequently result in lower validation loss and better generalization. Meanwhile, gradient clipping caps the gradient norm (4.0 in this case), preventing any single batch from producing excessively large updates that could destabilize training; this keeps weight updates stable, reduces oscillations, and protects against exploding gradients, particularly in deep or recurrent architectures. Together, these strategies result in faster, more stable training dynamics and higher ultimate accuracy on both the validation and test sets.
The optimal number of 1295 epochs was found while training the model for 1500 epochs (1500 epochs was the epoch used by the latest previous research, TCN-CBAM method [
5]). We coded
cBP-Tnet to store the best model and output the optimal model after training for 1500 epochs. Nonetheless, 1295 epochs found is still 13.67% faster than the latest deep learning method in the field, the TCN-CBAM method [
5], computed based on the percent change formula. To solve the percent change when transitioning from TCN-CBAM (previous value of 1500 epochs) to
cBP-Tnet (new value of 1295 epochs), we defined the old value as
and the new value as
and used the percent change standard formula. On the left, the model starts with preprocessed input data streams that comprise not just the raw PPG waveform but also its first and second derivatives. These three inputs, each with a 2 s duration of 250 samples at 125 Hz, were combined to generate a concatenated input dimension of (32,750), for a batch size of 32 instances, each with 750 features from the three PPG-related signals. This preprocessing step was intended to capture both the core form of the PPG pulse wave and the subtle inflections shown by its derivatives. The input data were then projected into a compact, learned feature space using a linear projection layer, which converts the raw signals into a 128-dimensional embedding.
3.5.1. Input Projection and Positional Encoding
Given an input sequence of features
, where
N is the sequence length (250 PPG samples) and
is the concatenated feature dimension
.
where
projects the input to the model dimension
(
). The output shape was
. A learnable positional encoding
is added to inject sequence ordering because Transformers are inherently order-agnostic [
24]:
The learnable positional encoding output shape was (32, N, 128). This enables the model to distinguish the temporal order of samples, which is crucial for time-series data in the study. This stage is crucial because it converts the raw physiological waveforms into a representation that is better suited to the Transformer’s self-attention processes. The next essential activities that take place in the multi-task Transformer encoder layer occurred when a multi-head self-attention module (with four heads) and a feed-forward network (with a large inner dimension of 2048) collaborated to simulate the PPG signal’s complicated temporal dependencies and non-linear interactions.
3.5.2. Multi-Head Scaled Dot-Product Attention
Each multi-task Transformer layer uses multi-head self-attention (
). For each attention head
h, the input
(from the previous layer or the input projection for the first layer) is linearly projected into queries (
), keys (
), and values (
):
where
and
. The scaled dot-product attention for one head is computed as follows:
For
heads, multi-head attention is
where
denotes concatenation and
[
24]. This attention technique enables the model to pay attention to several parts of the input at the same time.
3.5.3. Residual Connections and Layer Normalization
To aid training and stabilize gradients, each sub-layer is wrapped with residual (skip) connections and layer normalization (LN):
This ensures that the model learns more successfully by avoiding vanishing and exploding gradients. The dropout rate () and the existence of layer normalization stabilize training and prevent overfitting.
3.5.4. Position-Wise Feed-Forward Network (FFN)
Each multi-task Transformer encoder layer has the same feed-forward network (
) applied to each position in the sequence. Given the input
, we have the following:
where
Now,
is typically larger than
to allow for more sensitive transformations [
24].
3.5.5. Global Max Pooling Layer
After passing through N multi-task Transformer encoder layers (×8) with an output shape of (32, N, 128), a global max pooling operation [
5] reduces the sequence-wide representation to a single 128-dimensional summary vector, which successfully captures the most important properties from the whole input waveform, such as its peaks, dicrotic notches, troughs, and inflection points. It was applied to produce a fixed-length vector:
and reducing sequence dimension (32, 128).
3.5.6. Multi-Task Learning Output Layer
This latent vector z now encodes the learned representation of the input signal segment. For multi-task learning (MTL), it uses a linear layer that outputs both SBP and DBP simultaneously [
34]:
where
and
. For multi-task learning (MTL), we predict systolic and diastolic blood pressure simultaneously. The training objective for MTL is to minimize the combined
loss (MAE) of SBP and DBP. Given
and ground-truth values
, we define the loss as:
where
Minimizing the combined
loss enables the
cBP-Tnet model to improve performance on both tasks at the same time, balancing learning and guaranteeing that the latent representation can predict both SBP and DBP. The training section shows the usage of a
OneCycleLR learning rate schedule at
and an optimal training run (1295 epochs) that is still 13.67% faster than the current state-of-the-art one [
5], outperforming the best model based on the best combined validation
loss. A gradient clipping threshold (
) was also implemented to stabilize the training phase; that is, it employed the OneCycle learning rate schedule [
35] with an
loss that initially increased and then decreased the learning rate to help converge to better minima. Gradient clipping prevents gradients from exploding, as follows:
where
is a predefined threshold (
). The final output shape was
. The code was made available at
https://github.com/apimentel-ECE/cBP-Tnet.git (accessed on 19 December 2024).
4. cBP-Tnet Experimental Results and Discussions
This section includes Leave-One-Subject-Out (LOSO) experiments, hyperparameter tuning/analysis, comparative analysis with related works, and model evaluation and visualization to understand the effect of gradual performance improvement of various factors added to the model and to further optimize model performance.
4.1. Leave-One-Subject-Out (LOSO) Experiments
Table 2 depicts the incremental improvement of the proposed
cBP-Tnet for estimating blood pressure from raw PPG signals automatically. In our Leave-One-Subject-Out-style study, “subject” refers to each successive experimental condition. “Leaving one subject out” refers to removing or adding one signal-processing component at a time (raw PPG, PPG′, PPG″, Kalman filtering, outlier removal, synchronization, augmentation) and measuring the MAE using the same LOSO cross-validation scheme. Framing each pipeline option as a “subject” allows us to isolate the performance increase generated by each new factor, allowing us to determine which processing steps improve accuracy the most and thus direct future model modification.
Each row illustrates a different model and preprocessing pipeline, beginning with a simple baseline (just the raw PPG waveform) and gradually introducing additional signal derivatives, filtering algorithms, data synchronization and augmentation mechanisms. The values shown are the mean absolute errors (MAEs) in mmHg for both systolic and diastolic blood pressure measurements using a Leave-One-Subject-Out (LOSO) scheme, in which each individual in the dataset is removed from the training set in turn to assess how well the model generalizes to previously unseen subjects. The validation loss MAE was used initially in the base model while the extended (final) model used the testing loss MAE. It should be noted that based on the AAMI international standard, the MAE must be less than 5 mmHg when there are more than 85 subjects [
20]. Firstly, the model reaches certain baseline errors using only the raw PPG signal (for example, 5.72 mmHg for systolic pressure and 3.09 mmHg for diastolic pressure). The error values gradually decrease as more detailed signal processing processes are added to following rows, such as adding the first and second derivatives of the PPG waveform (PPG′ and PPG″). Using the LOSO scheme, adding the first derivative (PPG′) of the PPG to the raw signal reduced the SBP MAE from 5.72 mmHg to 5.08 mmHg (11.24% improvement) and the DBP MAE from 3.09 mmHg to 2.79 mmHg (9.6% improvement), demonstrating that the slope information—reflecting arterial compliance and pulse transit dynamics—enhances blood pressure estimates; further, incorporating the second derivative (PPG″) produced additional reductions to 5.00 mmHg SBP MAE (1.56% further gain) and 2.75 mmHg DBP MAE (1.43% further gain), showing that curvature and inflection points (e.g., dicrotic notch) capture reflected wave timing and vascular stiffness. These quantitative gains confirm that derivative features reveal critical rate-of-change and curvature characteristics of the PPG waveform that are otherwise obscured, greatly increasing prediction accuracy. This shows that more information about the signal’s rate of change and acceleration can assist the model capture more subtle blood pressure aspects. Finally, data augmentation procedures artificially increase the diversity and quantity of training samples, hence enhancing model generalization. The model’s error metrics improve gradually when more components are added. The MAEs decrease significantly as the pipeline comprises not only the original signal and its derivatives but also advanced filtering, outlier treatment, synchronization, and augmentation. These improvements show that blood pressure prediction using PPG signals is sensitive to noise, alignment, and data quality. Systematic signal processing and advanced modeling approaches can considerably improve the reliability of non-invasive blood pressure predictions, as seen by the lower MAEs in the table’s final rows.
4.2. Hyperparameter Tuning/Analysis
Table 3 summarizes hyperparameter tuning experiments performed on the proposed
cBP-Tnet model to increase its capabilities to estimate systolic blood pressure and diastolic blood pressure (SBP and DBP) from raw PPG input data. Each row represents a change in one or more model parameters, including the model dimensionality (
), the number of heads (
h) in the multi-head attention mechanism, the number of encoder blocks (
N), the probability of dropout (
), and the gradient clipping threshold (
). Along with these parameter settings, the table shows the corresponding mean absolute error (MAE) values for SBP and DBP, which indicate how well the model predicts blood pressure relative to genuine observed results—the lower the MAE, the better. In the “Base” configuration, where
,
,
,
, and
, the model originally trained for 150 epochs (10% of the previous state-of-the-art one [
5]) produces MAEs of
for SBP and
for DBP. The next rows (A through E) indicate proposed systematic experimental trials that could be carried out to change important parameters. In row (A), the model dimensionality is either reduced to 64 or increased to 256. We observe that a smaller dimensionality significantly increases error (SBP MAE
), while a larger dimensionality (256) improves performance slightly (SBP MAE
) but not beyond the original baseline. Similarly, in row (B), decreasing the number of attention heads from four to two impairs forecasts, whereas increasing to eight heads brings SBP MAE closer to the original values but with no substantial improvement over the baseline. Part C adjusts the number of encoder layers (N), comparing 6 and 10 layers to the original 8. Adjustments to the depth result in minor error variations, but no significant improvement in performance (SBP MAE
–
and DBP MAE
–
). Part (D) tests various dropout probabilities. A
dropout rate results in comparable performance (SBP MAE
) to the baseline, indicating that a moderate dropout value may provide stability but is not necessary. A greater dropout rate (
) somewhat decreases performance, implying that excessive dropout may degrade model accuracy.
Finally, part (E) examines the impact of gradient clipping. Eliminating gradient clipping () results in a catastrophic failure (SBP MAE rises to ), indicating that uncontrolled gradients significantly disrupt training. In contrast, a high gradient clip value () returns performance to the baseline, demonstrating the necessity of managing gradient explosions. By the end of these extensive experimental trials and hyperparameter tuning/analysis, the researchers identified the final optimal configuration: and . Training the model for up to the optimal 1295 epochs (based on the best combined SBP/DBP validation loss) yielded a noticeable improvement in accuracy, reducing the SBP MAE to and the DBP MAE to . This showed that careful and methodical tuning of network architecture and training parameters is necessary to achieve robust performance in blood pressure prediction tasks, and that certain settings—particularly controlling model size, maintaining moderate dropout, and preventing gradient explosion—are key to achieving high-quality, stable results.
4.3. Comparison Against Related Deep Learning Methods to Estimate Blood Pressure with Automatic Feature Extraction Using Photolethysmogram Feature Extraction
Table 4 summarizes the progress of research methods and performance benchmarks for non-invasive continuous blood pressure estimation using PPG signals with automatic feature extraction mechanisms. The top row, representing Slapničar et al. [
16] (2019), uses a ResNet-based architecture on 510 participants but performs poorly, with MAEs well exceeding the AAMI standard threshold of 5 mmHg for both systolic blood pressure and diastolic blood pressure. Not only do the results fail to reach the AAMI requirements, but the model apparently requires lengthy training periods (up to 10,000 epochs), indicating problems with training efficiency and scalability. Rong and Li [
17] (2021) apply a multi-type feature fusion (MTFF-ANN) technique to a small dataset of 11,546 samples only, yielding a better but still insufficient systolic MAE. While the diastolic estimate meets the AAMI criteria, the very complex and difficult automatic feature extraction process and the small sample size call into question the model’s applicability to larger populations and situations. Dai et al. [
5] (2024) incorporate temporal convolutional networks and a CBAM attention mechanism over a huge dataset of 270,488 samples to achieve even greater improvements. Although the diastolic MAE is high and meets the AAMI standard, systolic estimation fails, and the model takes at least 1500 epochs to converge. This intricacy and extensive training burden indicate a smart but not totally efficient system.
In contrast, the proposed
cBP-Tnet model that makes use of a multi-task learning Transformer-based network outperforms all the recent studies. It was based on 500 random patients’ records (202,956 samples); it achieves significantly lower MAEs for both systolic blood pressure (4.32 mmHg) and diastolic blood pressure (2.18 mmHg), meeting the AAMI requirements. Remarkably, this strategy reduces the training time to only 1295 epochs, a 13.67% improvement over its latest competitor [
5], while employing a simpler single-model deep learning framework. This not only simplifies model design but may also reduce computational and infrastructure demands. The proposed
cBP-Tnet AI model demonstrates that systematic improvements in model architectures, sample sizes, and training protocols can finally close the clinical standard gap, paving the way for more practical and widespread use of continuous non-invasive blood pressure monitoring tools, optimizing the potential to be integrated/enable non-invasive continuous monitoring by home and mobile healthcare devices.
4.4. cBP-Tnet Evaluation and Visualization
Figure 3 and
Figure 4 show how well a
cBP-Tnet AI model predicts systolic and diastolic blood pressure values from specific input signals. In
Figure 3, the training loss (blue line) begins at a very high value and rapidly drops in the initial epochs, demonstrating that the model is effectively learning the underlying patterns in the data. As training develops beyond the early stages, the loss gradually decreases, eventually stabilizing at a lower value. The validation loss (yellow line), while initially higher, follows a general downward trend, indicating that the model is generalizing to previously unseen data rather than overfitting. By 1295 epochs, the training and validation losses appeared to have stabilized, indicating that the chosen training duration was appropriate as it was designed to save the best model based on the best combined validation L1 loss.
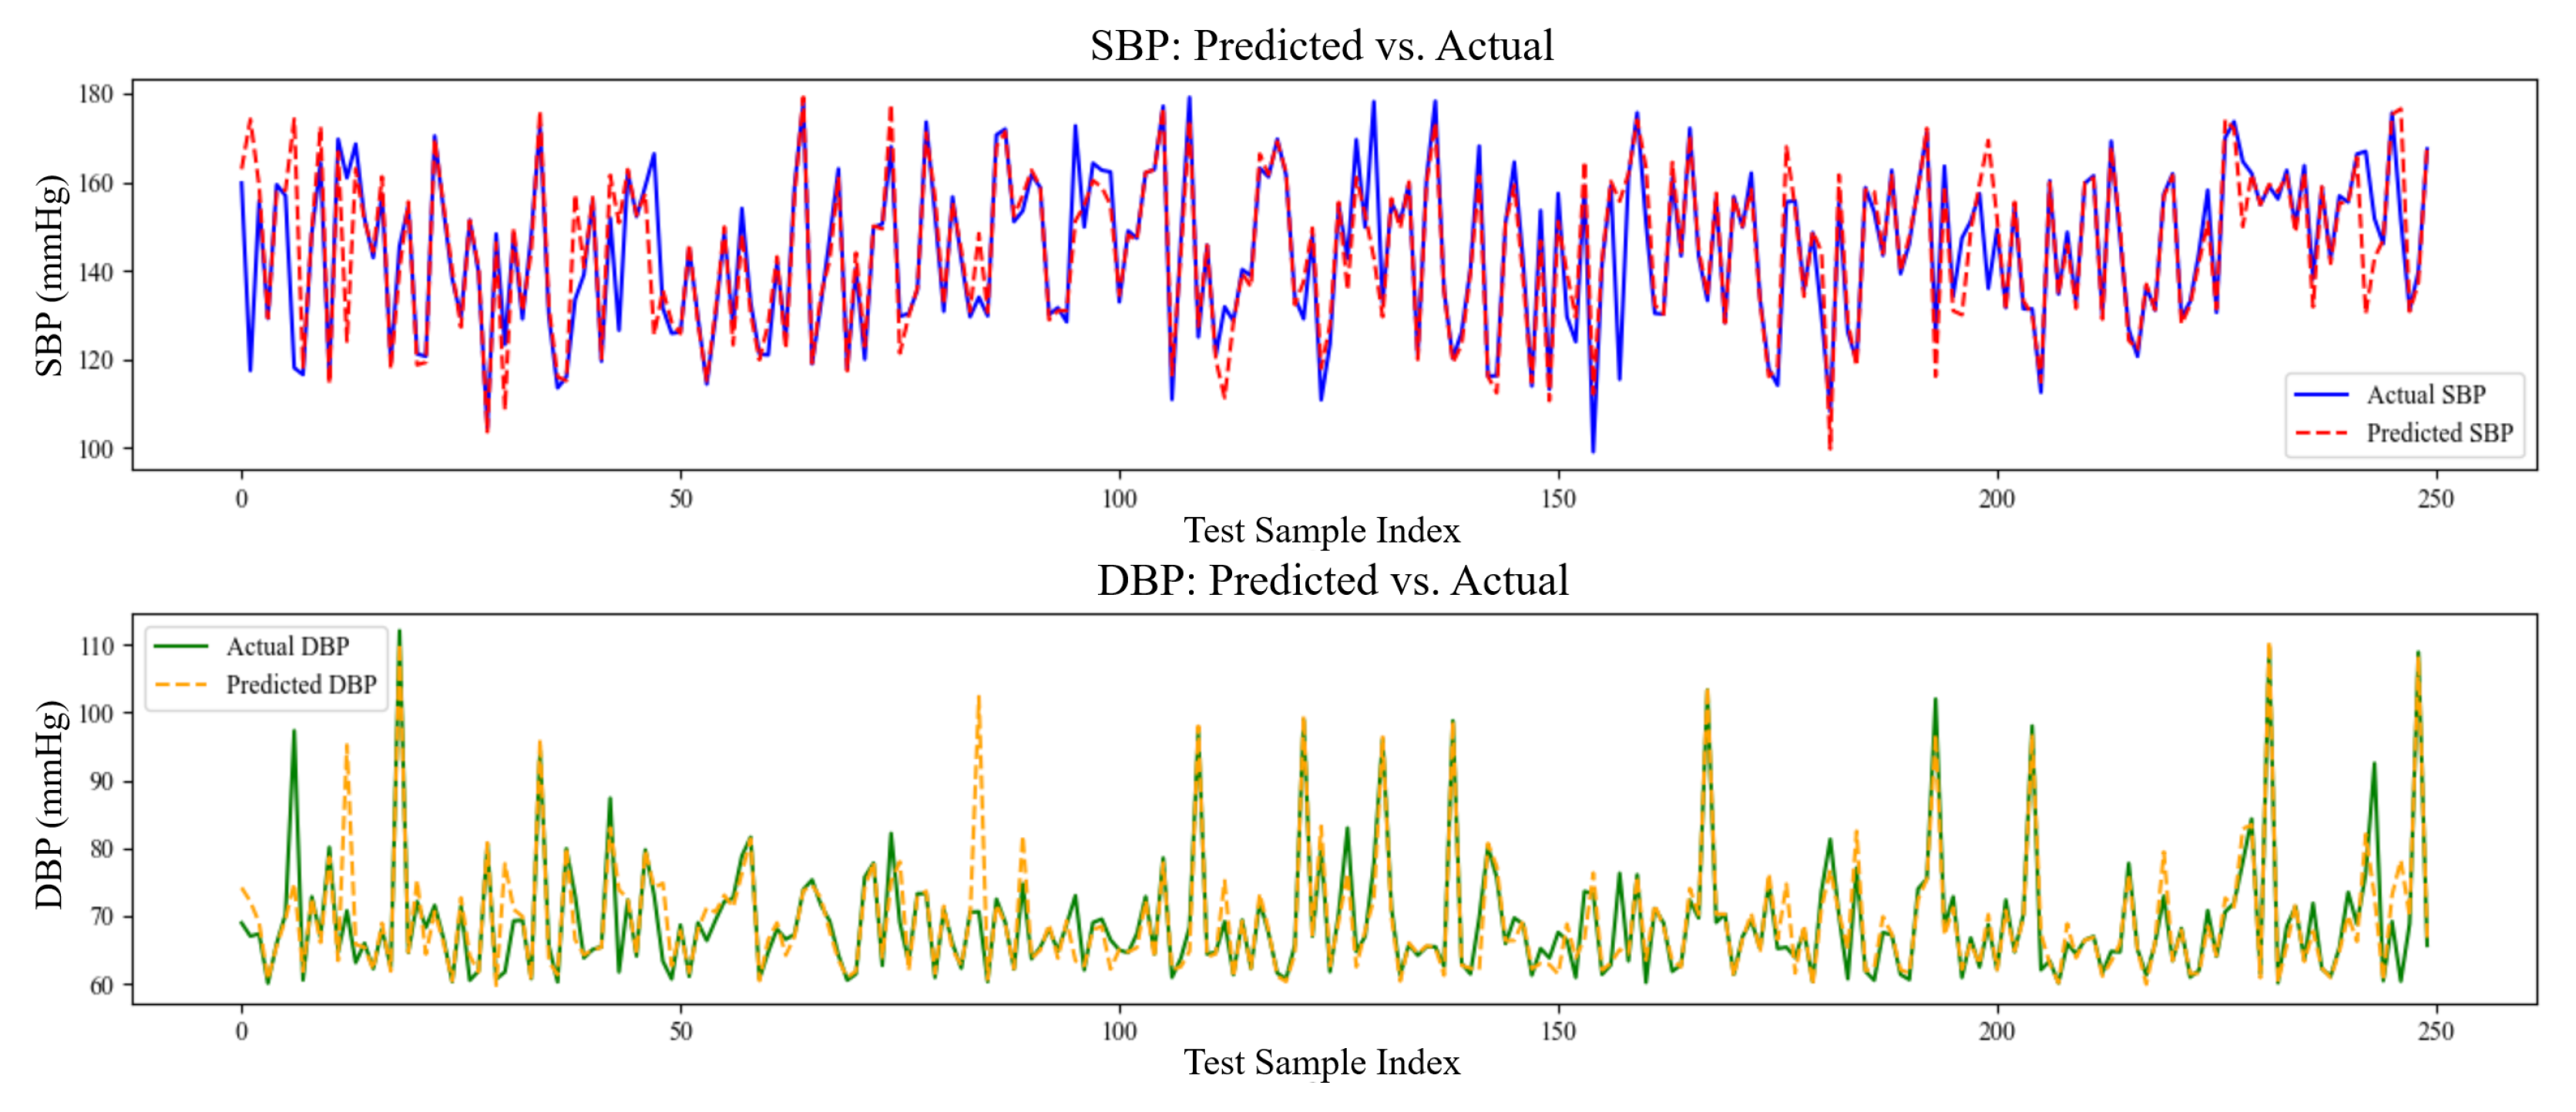
The model’s performance was better highlighted in the SBP and DBP prediction against the actual plots, as shown in
Figure 4. The predicted SBP (dashed red line) closely reflects the real SBP (solid blue line) values across the sample series, suggesting a high capacity to simulate the dynamic changes of systolic pressure. Similarly, while DBP fluctuates to a greater extent and considering that the peaks and troughs may not coincide completely, the predicted values (green line) show a general relationship with the actual data (yellow line). This shows that the model has learned the most common patterns in DBP; however, it may be more susceptible to noise or more complex fluctuations in diastolic pressure.
The predicted vs. actual scatter graph test results for systolic blood pressure (SBP) in
Figure 5 and diastolic blood pressure (DBP) in
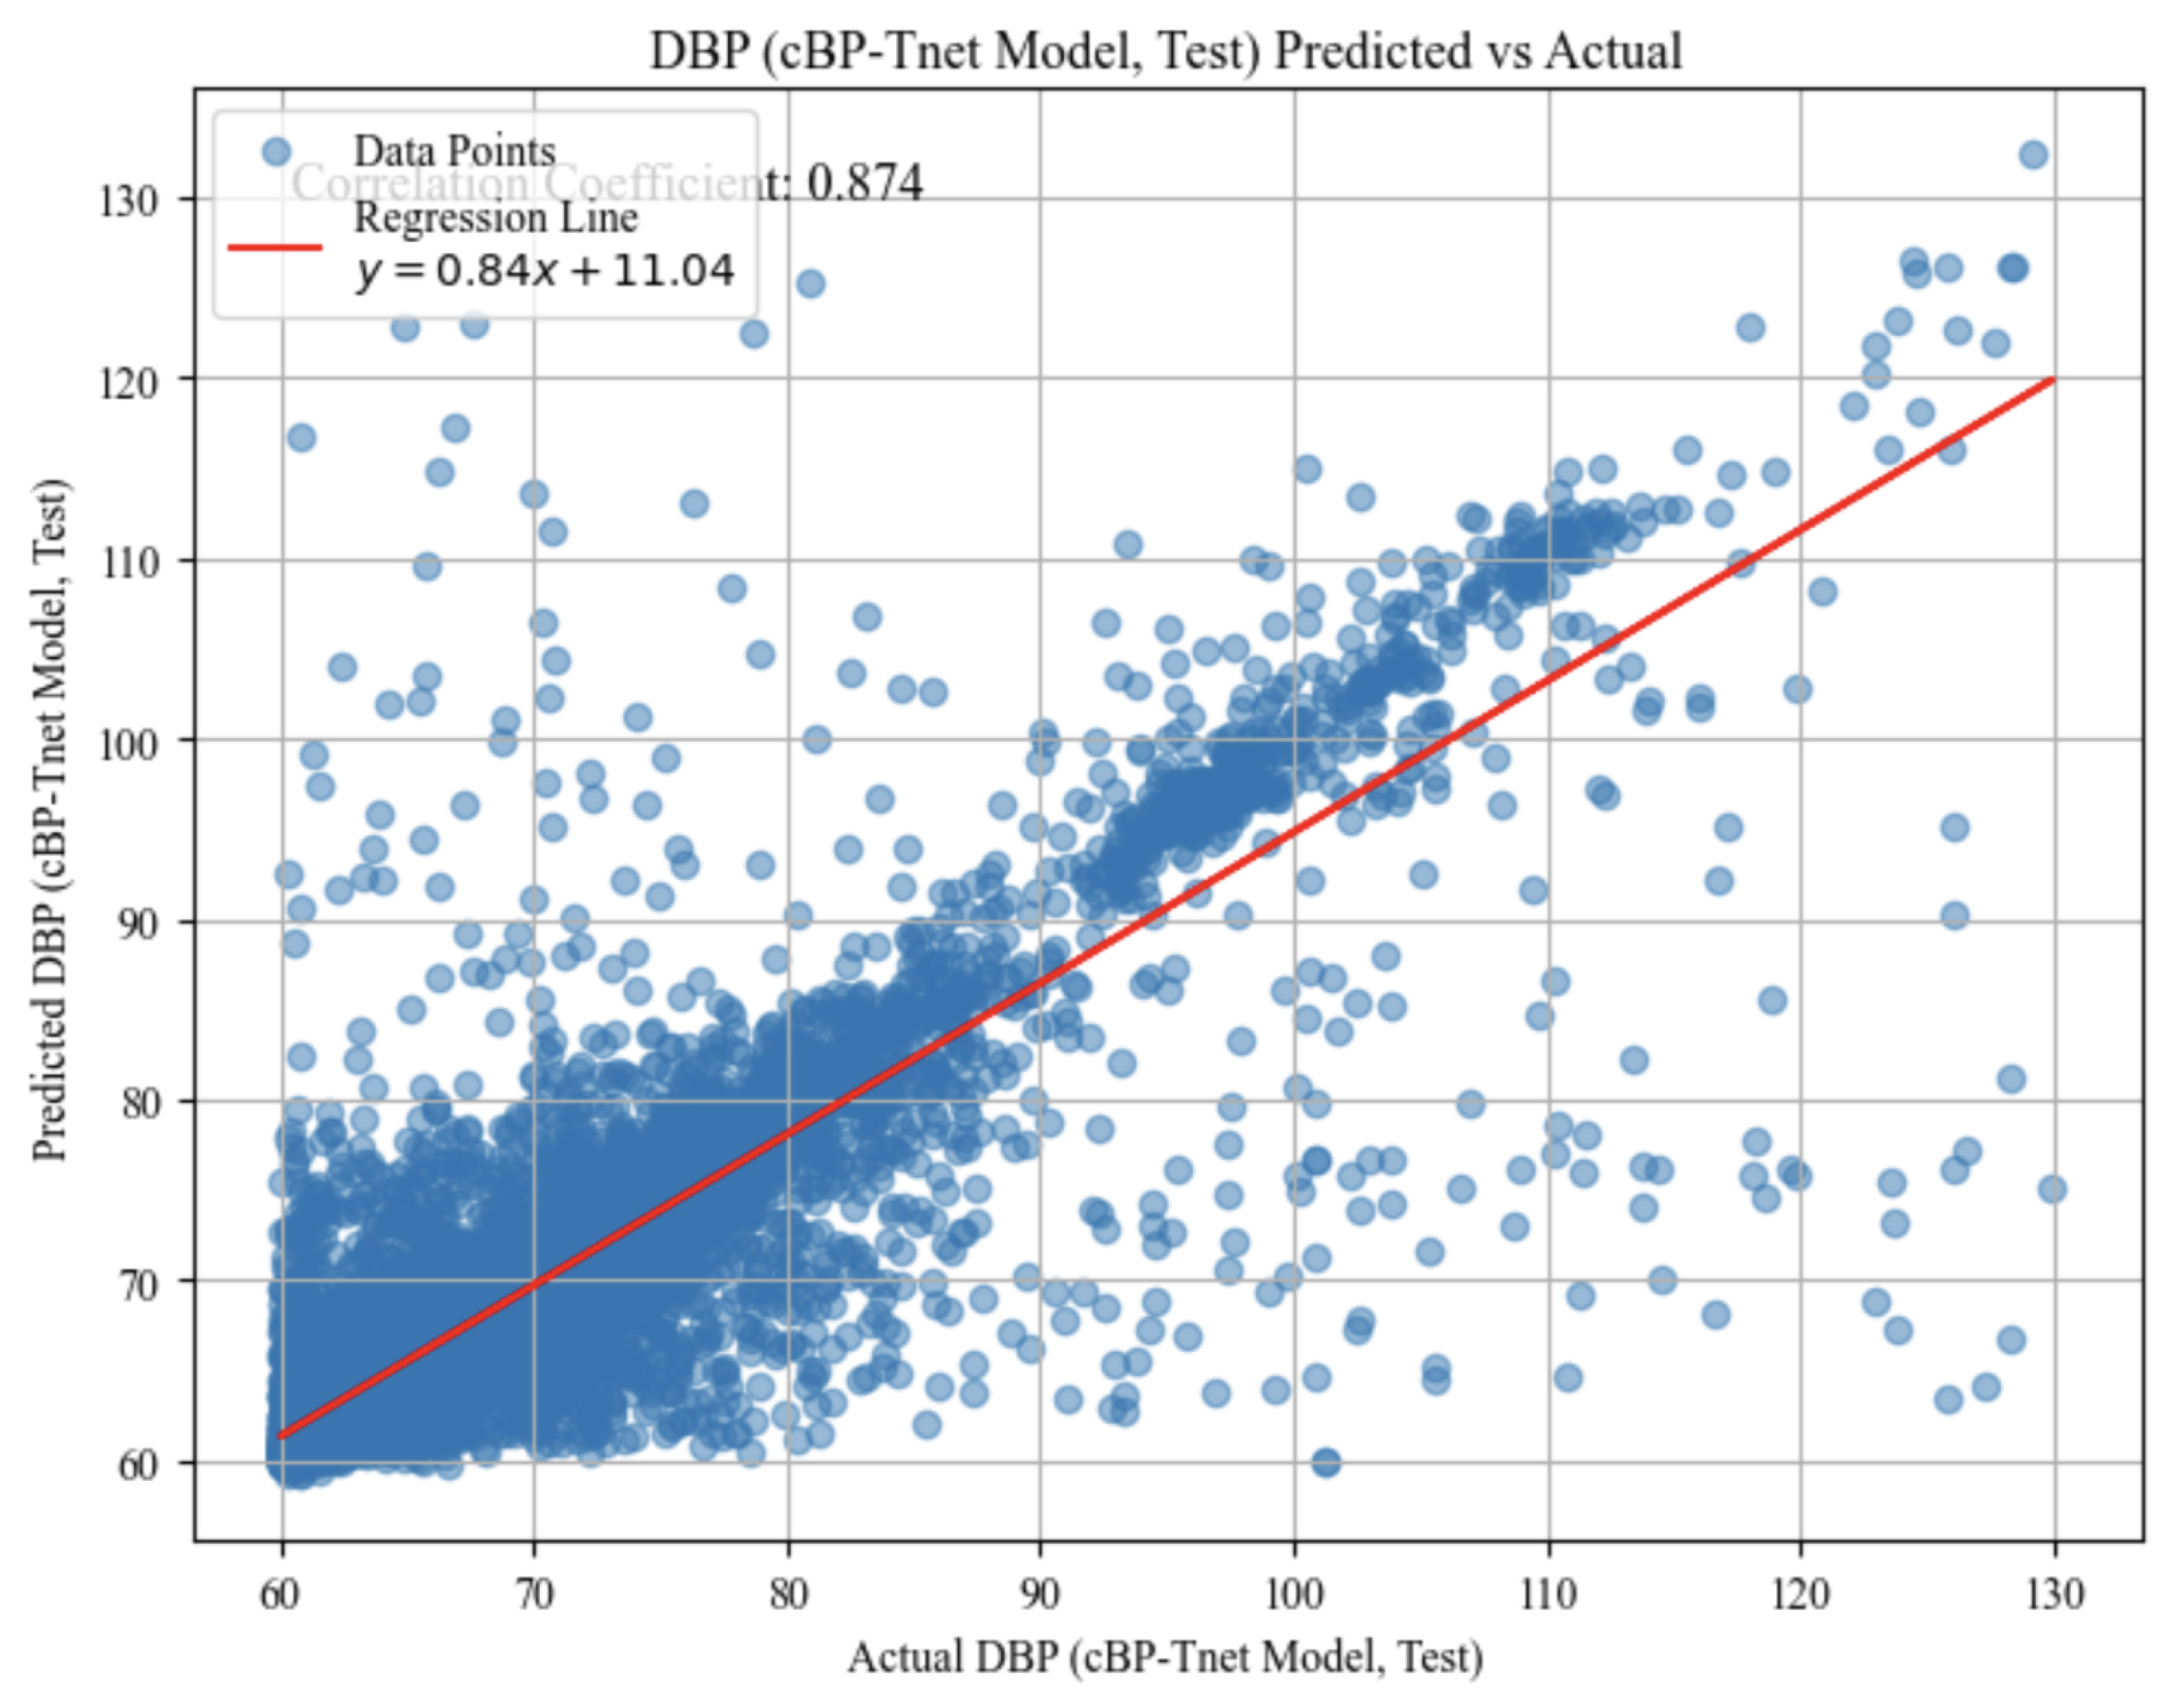
Figure 6 show how the model’s anticipated values compare to the actual measurements. Each point represents a single test case, with the horizontal axis representing the actual measured blood pressure and the vertical axis representing the model’s predicted value for that same instance. These plots demonstrates the performance of the model within different blood pressure ranges. A strong linear trend, as seen in both graphs, implies that the model is capturing a significant portion of the underlying pattern: correlation coefficients of approximately 0.885 for SBP and 0.874 for DBP indicate a high degree of linear relationship. The red regression lines fitted across the data points, with slopes of approximately 0.87 for SBP and 0.84 for DBP and moderate intercept values, demonstrate that forecasts often grow in tandem with actual values.
However, the appearance of substantial scatter around these regression lines indicates that, while the model’s predictions are frequently accurate, they are not flawless. Some examples fall well above or below the line, indicating over- or under-prediction. Nevertheless, these plots provide a visual assessment of prediction accuracy, demonstrating that the model performs well for a substantial portion of the data but has room for improvement in terms of precision and consistency.
Beyond its empirical performance, cBP-Tnet contributes to our theoretical understanding of how transformer-based architectures can internalize the rich hemodynamic dynamics encoded in raw PPG waveforms. It demonstrates that multi-head self-attention naturally learns slope, curvature, and reflection-timing cues that were previously difficult to manually engineer. By framing SBP and DBP estimates as a multi-task problem, the model takes use of shared vascular compliance patterns while maintaining their separate physiological bases, resulting in more robust representations and closer generalization limitations. The combination of adaptive Kalman filtering and targeted data augmentation improves learning stability by denoising and expanding the signal distribution, strengthening the model’s resilience to real-world artifacts. Practically, cBP-Tnet’s single-channel, end-to-end design reduces development complexity and training time by more than 13.67%, lowering the barrier to deployment on resource-constrained wearables and home monitoring hubs. Meeting the AAMI standard on a large, diverse ICU dataset verifies its suitability for clinical translations, paving the way for continuous, cuff-free blood pressure monitoring in telemedicine, chronic care management, and consumer health applications.


