Article

An Interface Design Method Based on Situation Awareness and Immersive Analytics for Augmented and Mixed Reality Decision Support Systems in Construction

1
Department of Construction Engineering and Management, School of Engineering, Pontificia Universidad Católica de Chile, Vicuña Mackenna 4860, Santiago 7820436, Chile
2
Department of Computer Science, School of Engineering, Pontificia Universidad Católica de Chile, Vicuña Mackenna 4860, Santiago 7820436, Chile
3
National Center for Artificial Intelligence (CENIA), National Research and Development Agency (ANID), Vicuña Mackenna 4860, Santiago 7820436, Chile
4
Infrastructure Human Tech (IHT) Lab, Department of Civil and Environmental Engineering, University of Alberta, 9211 116 Street NW, Edmonton, AB T6G 2R3, Canada
*
Author to whom correspondence should be addressed.
Appl. Sci. 2025, 15(14), 7820; https://doi.org/10.3390/app15147820 (registering DOI)
Submission received: 29 May 2025 / Revised: 29 June 2025 / Accepted: 1 July 2025 / Published: 11 July 2025

Abstract

Research on augmented reality (AR) and mixed reality (MR) demonstrated their potential to support decision-making in construction. However, most efforts emphasized technological advancements, often overlooking how to present and interact with information to effectively support decision-making in AR/MR environments. This study proposes an interface design method that integrates situation awareness (SA) and immersive analytics (IA), two complementary frameworks that address user information needs and immersive interaction design. The method guides the design of AR/MR interfaces by aligning information content, presentation, and interaction with SA requirements and IA design principles. To evaluate its effectiveness, the method was applied to develop AR and MR interface prototypes for a simulated decision-making task involving field managers during indoor construction activities of high-rise construction projects. Results show high levels of SA achieved by participants, with no statistically significant differences between AR and MR interfaces, demonstrating the method’s effectiveness to support SA in both environments. The proposed method provides a structured approach for designing immersive interfaces that enable better perception, comprehension, and projection in dynamic construction scenarios. Moreover, it provides designers with practical guidance for interface development and allows practitioners to assess existing AR/MR solutions based on their capacity to enhance SA through IA.

1. Introduction

Construction sites are complex and dynamic environments where practitioners process large amounts of information for decision-making [1]. Over the years, augmented reality (AR) and mixed reality (MR) have been explored to support this process. AR and MR are immersive technologies that enhance user perception by superimposing digital information onto the real world [2,3]. While different standpoints exist regarding the definitions and devices associated with AR and MR [4], this research considers them as separate technologies, given their practical differences. This distinction aims to leverage their distinct immersive capabilities to support decision-making in construction scenarios. AR primarily overlays digital information [3], while MR not only overlays, but also integrates it into the real environment, enabling natural manipulation and real-time interaction between virtual and physical objects, thereby providing a more immersive experience [3,5,6]. AR/MR capabilities allow real-time access to project data and increase context awareness by presenting information directly in the user’s field of view, improving perception and interpretation, ultimately supporting decision-making [7,8,9].
Diverse research and applications leveraged AR and MR in the construction domain. For instance, Katika et al. [10] developed an MR solution that displays real-time data from site elements within a virtual building model to enhance occupational health and safety inspection. Ratajczak et al. [11] presented an AR mobile application that provides building information on the worksite to support construction monitoring. Kunic and Naboni [12] proposed a multi-user workflow and interface for MR environments to facilitate collaborative design and decision-making during assembly processes.
While studies such as these have shown the potential of AR and MR solutions to facilitate decision-making, most efforts emphasized the technological development and application over the information design, that is, over what information to present and how to present and interact with it in AR/MR environments to effectively support decision-makers. Given the complexity and volume of information in construction, it is critical to consider information presentation as it impacts context awareness [13]. For instance, AR/MR interfaces with unclear or unnecessary content can cause practitioners to overlook key information, leading to misunderstandings about the situation [14]. In this regard, although AR/MR inherently enables context awareness, poor designs can diminish its effectiveness [14]. AR/MR solutions should allow users to easily interpret and interact with virtual content for better context awareness and decision-making [8,15].
Previous research explored two key approaches for improving information presentation and user interaction in AR/MR to support decision-making: situation awareness and immersive analytics.
Situation awareness (SA) aims to design user-centered systems by defining information requirements and its presentation to improve users’ perception, comprehension, and projection of the future status of their environment, thereby enabling more informed decision-making [15]. For instance, Gheisari and Irizarry [16] identified the information requirements of facility managers to develop an AR mobile application that presents the necessary information to easily comprehend the current situation, reducing cognitive load and facilitating decision-making. Moreover, Woodward et al. [17] examined how different textual presentation styles in AR affect user’s perception and comprehension, denoting the importance of designing information to support task performance. Likewise, Woodward and Ruiz [13] reviewed the use of AR for SA, identifying key design features and guidelines for creating interfaces that support situation awareness in AR/MR environments.
Immersive analytics (IA) leverages technologies, such as AR and MR, to enhance data understanding and information processing to support decision-making [2,18]. For instance, Martins et al. [19] used multi-perspective renderings, transitional interfaces, and multi-modal data (visual/audio) techniques to extend the AR’s limited field of view, improving user perception and interaction in the immersive environment. Schwajda et al. [20] proposed a framework to transform 2D graph data from the real environment into 3D layouts in AR, showing how these visual transitions can enhance interpretation and task performance. Moreover, Martins et al. [21] reviewed how AR/MR improves decision-making through real-time context-aware data visualizations, providing guidelines for designing effective decision support systems.
Notably, SA and IA provide complementary approaches for designing decision support systems. SA addresses the user requirements by formalizing and presenting information to enhance context awareness and decision-making. On the other hand, IA leverages AR/MR technologies to present and interact with information in ways that support analytical reasoning and decision-making [18], complementing SA from a technological perspective. Both approaches are necessary, as even the most advanced systems may fail in utility and acceptance if they do not consider the user needs [22]. By integrating SA and IA, AR/MR solutions can align information presentation and interaction with user requirements, achieving high levels of perception, comprehension, and projection of the situation, i.e., enabling effective situation awareness for better decision-making.
Despite being complementary, SA and IA are usually treated separately in the literature. In this regard, there is still no formal and comprehensive method that systematically integrates both approaches. That is, there is a lack of a structured framework that (a) defines interface requirements for achieving high levels of SA; (b) translates these requirements into content, presentation, and interaction design concepts aligned with IA principles; and (c) can be replicated and evaluated across projects. Current research often relies on ad hoc design guidelines or single-case implementations, which limits their transferability. As a result, designers are left without a repeatable workflow and researchers without a refence model to test. This gap limits research and development efforts for effective AR/MR decision support systems in construction.
To address this gap, this study proposes a method that integrates SA and IA frameworks to guide the design of AR/MR decision support interfaces. The method leverages AR/MR immersive capabilities to improve the practitioner’s perception, comprehension, and projection of the situation, supporting more informed decision-making. Its effectiveness was evaluated through a practical application, using as criterion its capacity to produce AR/MR interfaces that enable users to achieve high levels of SA. The evaluation was conducted in the context of the decision-making of field managers during indoor construction activities of high-rise building projects. Field managers were selected due to their relevance, as they are considered responsible for the major decisions that control the on-site construction process [23,24].
The proposed method is not intended to replace existing methods, techniques, or best practices for interface design, but to complement them from the standpoint of SA and IA. That is, the method focuses on the processes where SA can be enhanced through design, supporting current research and development efforts to create more effective decision support solutions.
The following sections review the SA and IA frameworks, explain the research processes, introduce the method and its application, and discuss conclusions, limitations, and implications for future research.

2. Theoretical Background

2.1. Situation Awareness (SA)

SA is a user-centered design methodology for developing decision support systems. Essentially, SA aims to perceive and comprehend the current situation to make more effective projections of its future status [25], which is critical for successful decision-making in dynamic environments [15]. To design systems that achieve high levels of SA, the SA-oriented design presents three components, as stated by Endsley, Bolté, et al. [15], and briefly reviewed below.
(1)
SA requirements analysis. This component determines the information required for decision-making, i.e., the SA requirements. It uses the goal-directed task analysis (GDTA) method, based on interviews, to elicit the decision-maker’s goals for successful job performance, the decisions needed to achieve those goals, and the information required for those decisions. The SA requirements are structured in three levels: level 1—perception of the elements in the environment, level 2—comprehension of the current situation, and level 3—projection of the future status. This construct represents how the information is processed in the mind of the decision-maker to address a decision, which is the basis of the SA-oriented design [26].
(2)
SA-oriented design principles. This component outlines principles for designing interfaces that increase SA. The principles are designed to present information effectively in alignment with how users process it for decision-making and goal attainment, allowing efficient information management and reducing cognitive load. Likewise, the principles aid designers to leverage technological features, such as display and audio, to improve perception and promote a deeper understanding of the situation, thereby supporting and enhancing SA.
(3)
SA measurement. This component presents methods for evaluating the design’s capacity to support SA and identifying SA design aspects for improvement. SA can be measured indirectly by inferring it from observable processes, behaviors, or performance outcomes, or directly from the user when interacting with the system. Indirect methods include verbal protocol analysis, psychophysiological assessment, performance assessment, among others. Direct methods can be subjective or objective. Subjective methods encompass the situational awareness rating technique (SART), SA-subjective workload dominance technique (SA-SWORD), self-ratings, and observer ratings. Objective methods include online probes, post-test questionnaires, and the situation awareness global assessment technique (SAGAT). These methods can be used individually or combined, depending on the purposes, resources, and circumstances of the study.
Several domains applied many aspects of the SA approach in the design of decision support systems. For instance, in the military domain, Endsley, Bolstad, et al. [26] determined the SA requirements and applied SA-oriented design principles to create display suites for army command and control operations. In the medical domain, Kaber et al. [27] used the GDTA method to understand the goals, decisions, and SA requirements of bio-pharmacologists to improve supervisory control interfaces for biological screening processes. For maritime navigation, Hong et al. [28] used the SAGAT and SART techniques to evaluate the SA of an AR interface design for operating uncrewed maritime vessels.

2.2. Immersive Analytics (IA)

IA is a research field of computer science that studies “how new interaction and display technologies can be used to support analytical reasoning and decision-making” [18]. It covers topics such as data visualization; visual analytics; virtual, augmented, and mixed reality; human-in-the-loop algorithms; and human–computer interaction to design more natural interfaces that harness immersive technologies to better understand data and support information processing [2,18].
IA presents six features for designing more appropriate human–computer interfaces, as described by Marriott et al. [2] and summarized below.
(1)
Situated analytics. Relates to the use of data representations associated or organized in relation to objects, persons, or locations in the physical world to support in situ sense-making and decision-making.
(2)
Embodied data exploration. Addresses the use of natural interaction techniques (e.g., touch, gesture, voice, gaze, and tangible interaction) in the design of user interfaces that allow more intuitive and engaging data exploration in immersive environments.
(3)
Collaboration. Addresses how immersive technologies and visual analytics techniques can support shared interaction to enable different types of collaboration (i.e., co-located or remote, synchronous or asynchronous).
(4)
Spatial immersion. Addresses the visual aspects of 2D and 3D data representations within immersive environments, as well as the use of the real-world environment as a workspace for immersive visualizations and interactions.
(5)
Multi-sensory presentation. Relates to the use of other sensory channels (i.e., audio, haptic, smell, and taste) to present data as complements to vision for supporting technological immersion or as substitutes when vision is unavailable or not applicable.
(6)
Engagement (of stakeholders). Refers to the use of immersive technologies to generate immersive interactive narrative visualizations that deeply involve the users to support data understanding and more informed decision-making.
Research in the different areas (features) of IA has been applied across various domains. For instance, in the health sector [29], collaborative immersive analytics enabled synchronous interaction across multiple remote locations by using display wall systems and handset devices, allowing a collaborative work environment for specialists situated in different places. In architecture [30], IA spatial immersion through an MR environment facilitated the on-site visual analysis of different façade alternatives, aiding architectural designers to evaluate the impact of their designs. Similarly, in construction [31], IA spatial immersion through an AR environment supported multi-criteria decision-making by providing digital representations of various construction alternatives and their attributes, enabling visual comparative analysis for more informed decision-making.

3. Research Process and Methods

Figure 1 presents the research process employed in this study.
The process began with a literature review on the use of AR/MR for supporting SA, aiming to identify the design features that enable SA in AR/MR immersive environments. These design features, hereafter termed SA enablers, represent the design requirements for achieving high levels of SA through AR/MR interfaces.
The next step involved a content analysis of IA and SA frameworks to understand how the different design aspects of IA can be used to address the SA enablers identified. The relationship between SA-enablers and IA design aspects led to defining the parameters for designing SA-enabling AR/MR interfaces.
After defining the design parameters, they were incorporated into a method for designing interfaces. The interface design method proposed in this study was built upon the SA-oriented user interface design process outlined by Endsley, Bolté, et al. [15]. Adapting this process to the context of AR/MR environments in construction involved considering the particularities of these immersive technologies and the challenges inherent to construction environments. The result is a tailored method for designing AR/MR interfaces that effectively enable high levels of SA to support decision-making in construction.
Lastly, the proposed interface design method was applied to evaluate its effectiveness. This involved designing and developing the AR and MR interface prototypes to assess their capacity for enabling SA in a field managers’ decision-making scenario. The following sections detail the activities of the research process and present the results obtained from each of them.

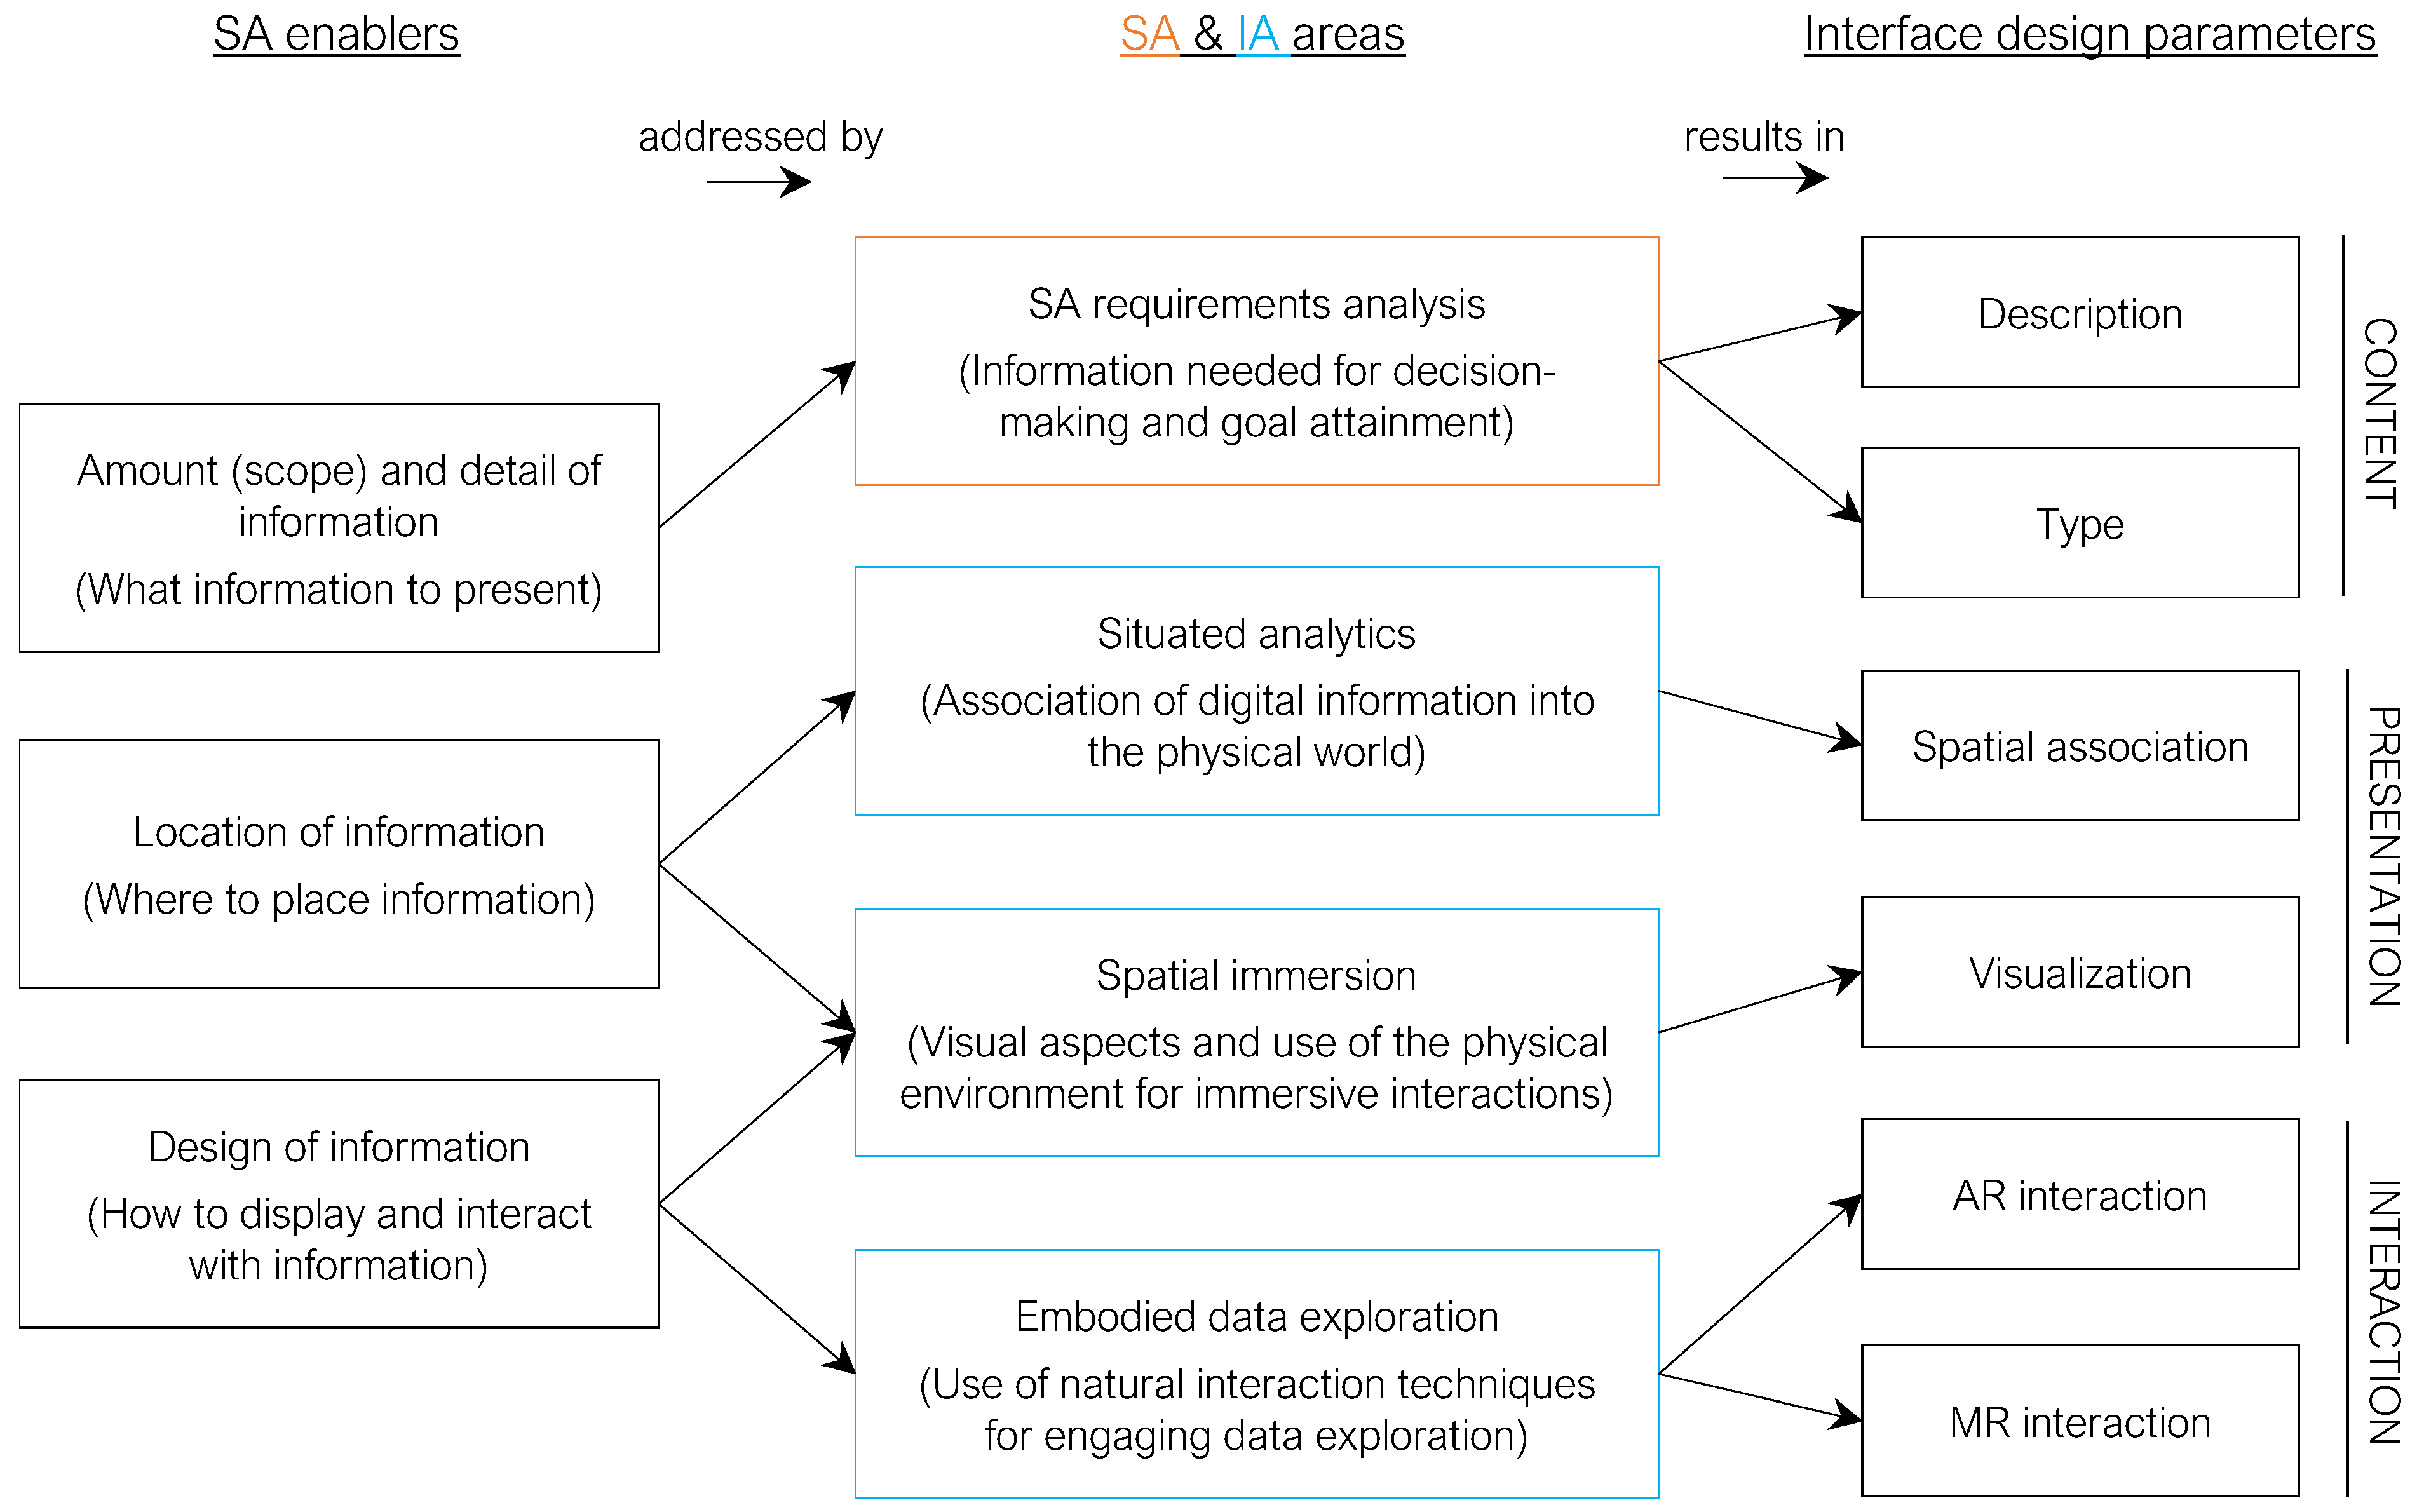
4. SA Enablers and Interface Design Parameters

Following the findings by Woodward and Ruiz [13], there are three design features to consider when presenting information for enabling SA in AR/MR environments, i.e., three SA enablers, which are as follows:
(1)
Amount (scope) and detail of information. This refers to what information to present to support SA.
(2)
Location of information. This refers to where to place the information to increase SA.
(3)
Design of information. This concerns how to display and interact with information in AR/MR.
These SA enablers represent the design challenges that need to be addressed to achieve effective SA in AR/MR. To translate these SA enablers into actionable design parameters, a thematic content analysis of the SA and IA theoretical frameworks was conducted. This process involved mapping the specific theoretical components within the SA and IA areas to the corresponding SA enablers they address, as depicted in Figure 2.
From Figure 2, the amount (scope) and detail of the information enabler is directly addressed by the SA requirements analysis area from the SA framework, which defines the information needed for decision-making and goal attainment. This analysis yields the description and type parameters for the “content” of the interface, which define and categorize the required information, respectively. The location of information and the design of information enablers are addressed by three of the six areas of the IA framework, as shown in Figure 2. The situated analytics area, which focuses on associating digital information into the physical world, directly underpins the spatial association parameter for the “presentation” of the interface. Likewise, the IA areas of spatial immersion (concerning visual representation) and embodied data exploration (concerning natural interaction) provide the theoretical foundation for the visualization and the AR/MR interaction parameters, respectively, which define the “interaction” aspects of the interface. This association led to the proposal of six interface design parameters, grouped into three categories, as presented in Table 1.
Design guidelines for the proposed parameters are outlined in the SA framework and the associated IA areas from the IA framework, as detailed in Section 5.3. The parameters and their design guidelines steer designers toward developing design concepts that specify how to present the information that will be included in the SA-oriented AR/MR interface.
The categories, parameters, and information required for decision-making (i.e., SA requirements) are organized into a matrix, as illustrated in Figure 3.
The matrix is the core of the proposed interface design method. The specifics and application of the proposed method are explained in detail in the next section.

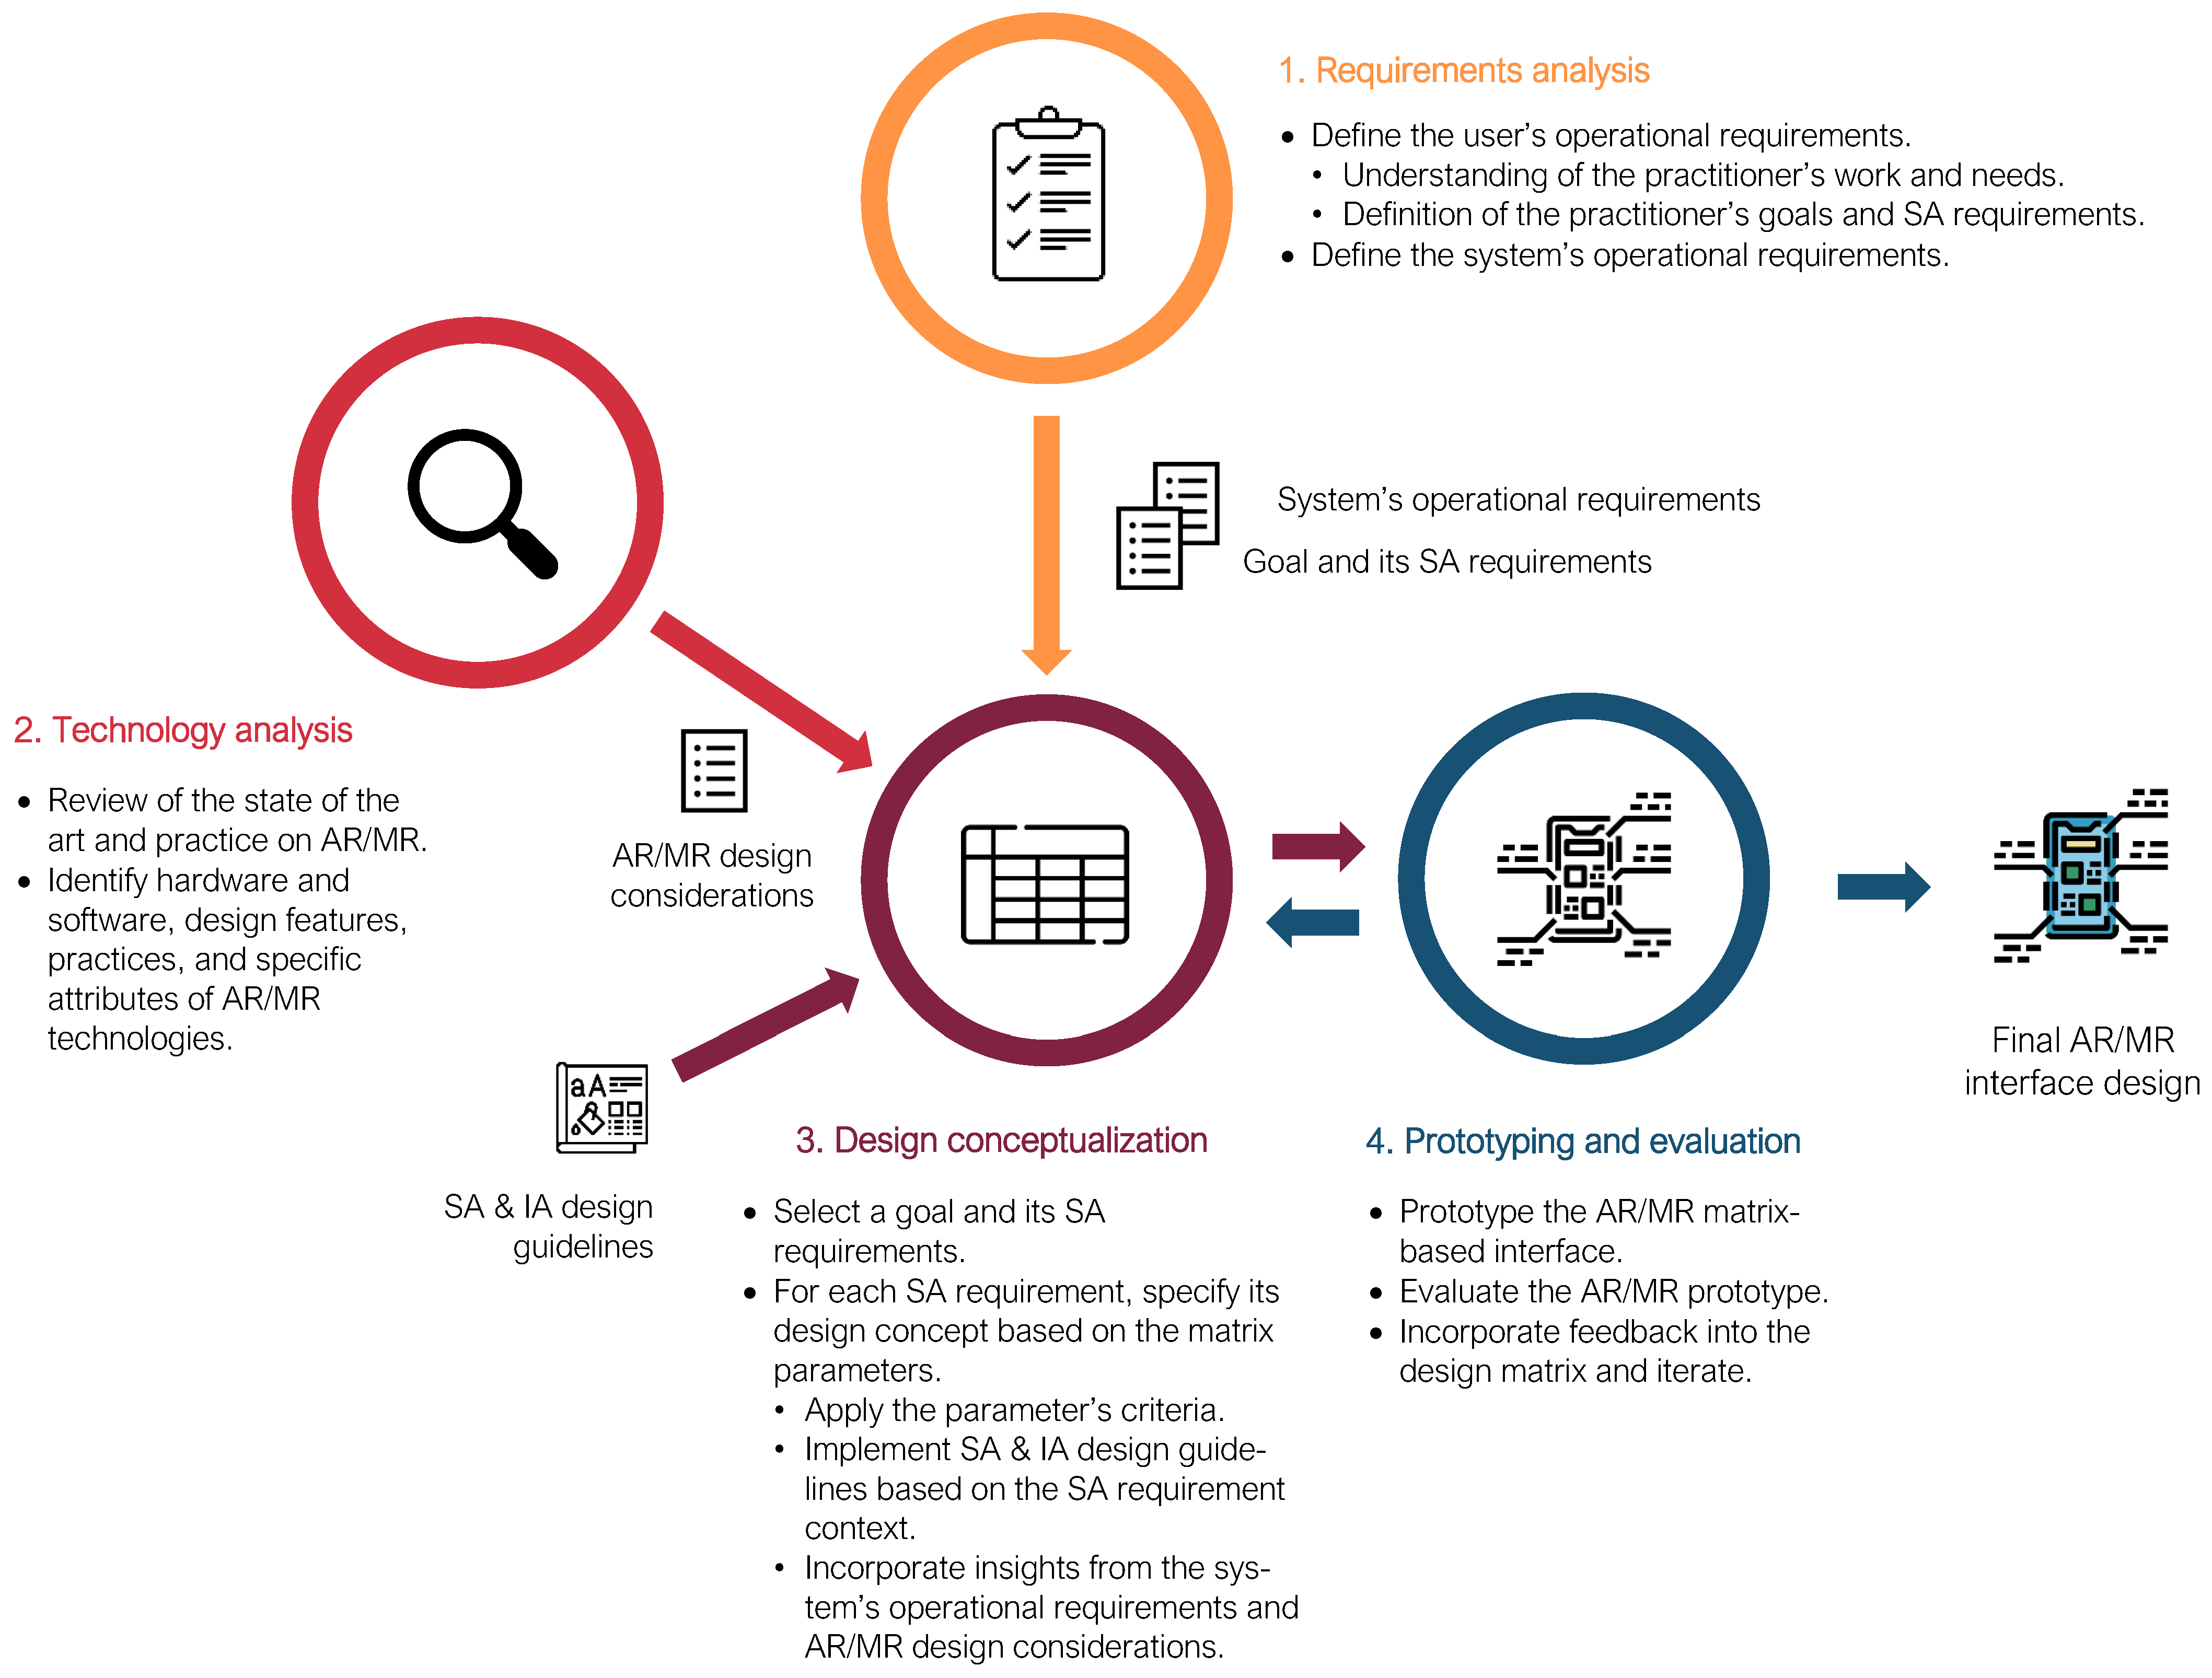
5. Proposed Interface Design Method

Figure 4 presents the method for designing interfaces that enable effective SA in AR/MR environments. The method encompasses four phases: requirements analysis, technology analysis, design conceptualization, and prototyping and evaluation. They are elaborated below.

5.1. Requirements Analysis

The first step is to define the user’s operational requirements. It involves understanding how the users work, the cognitive processes they employ, and identifying their information needs. This can be achieved through the SA requirements analysis using the GDTA method. As described by Endsley, Bolté, et al. [15], the GDTA is implemented through a series of individual unstructured or semi-structured interviews with subject matter experts (SME), considered practitioners with expertise in their fields [32]. The initial interviews aim to elicit the user’s goals for successful job performance, the decisions needed to attain those goals, and the information required to make those decisions (SA requirements). The data collected from the interviews are then analyzed and mapped to build a preliminary set of relational, hierarchical diagrams that structure the goals, decisions, and information, providing insights into how practitioners process information for successful job performance. These insights are also useful for defining the system’s operational requirements. To ensure completeness and accuracy, the diagrams are iteratively refined through subsequent interviews with the SMEs until a consensus is reached. The reader can consult [15,24] for a more detailed exploration of the GDTA implementation.
The user’s goals and SA requirements elicited through the GDTA are the basic elements for designing the interface and will be used in the design conceptualization phase.
The next step is to define the system’s operational requirements. It involves translating factors such as environmental conditions (e.g., noise levels, safety requirements), user characteristics (e.g., background knowledge, languages), and other operational requirements (e.g., types of information sources), along with the user’s operational requirements (previously defined in the GDTA), into characteristics and operational behavior that the system must meet.
For example, field managers often work in dynamic, hazardous, and noisy environments. This context leads to several system’s operational requirements: (a) the system must be portable so it can run on mobile devices (handset or headset) on the construction site; (b) the system interface must not compromise the user’s awareness of their physical surroundings to prevent hazards; and (c) in noisy environments, the system must prioritize visual presentation over audio. Likewise, the SA information requirements elicited from the GDTA lead to cognitive aspects that the system must meet. For instance, a cognitive requirement is that the system must present information (level 1 SA) in a way that minimizes the user’s cognitive load and directly supports the comprehension of the current situation (level 2 SA) and the projection of its future status (level 3 SA). More practical examples are provided in Section 6.1: Requirements Analysis of the Practical Application and Results section.
Following the framework proposed by Dennis et al. [33], the system’s operational requirements are organized into key areas, including technical environment, physical environment, system integration, portability, and maintainability. An additional area, cognitive requirements, was included to address the cognitive aspects of the SA-oriented design. Designers must consider the system’s operational requirements when conceptualizing information presentation.

5.2. Technology Analysis

This consists of reviewing the state of the art and the practice of AR/MR to examine the latest design features and practices that can be harnessed to enhance SA. It also includes analyzing available hardware and software for AR/MR to select devices and development tools that meet the technical/operational requirements of the decision support system. The identified design features and practices, and the specific attributes of AR/MR technologies, such as device types and distinct interaction modes available (e.g., tactile input, eye/head gaze, and hand gesture), are considered during the design conceptualization phase.

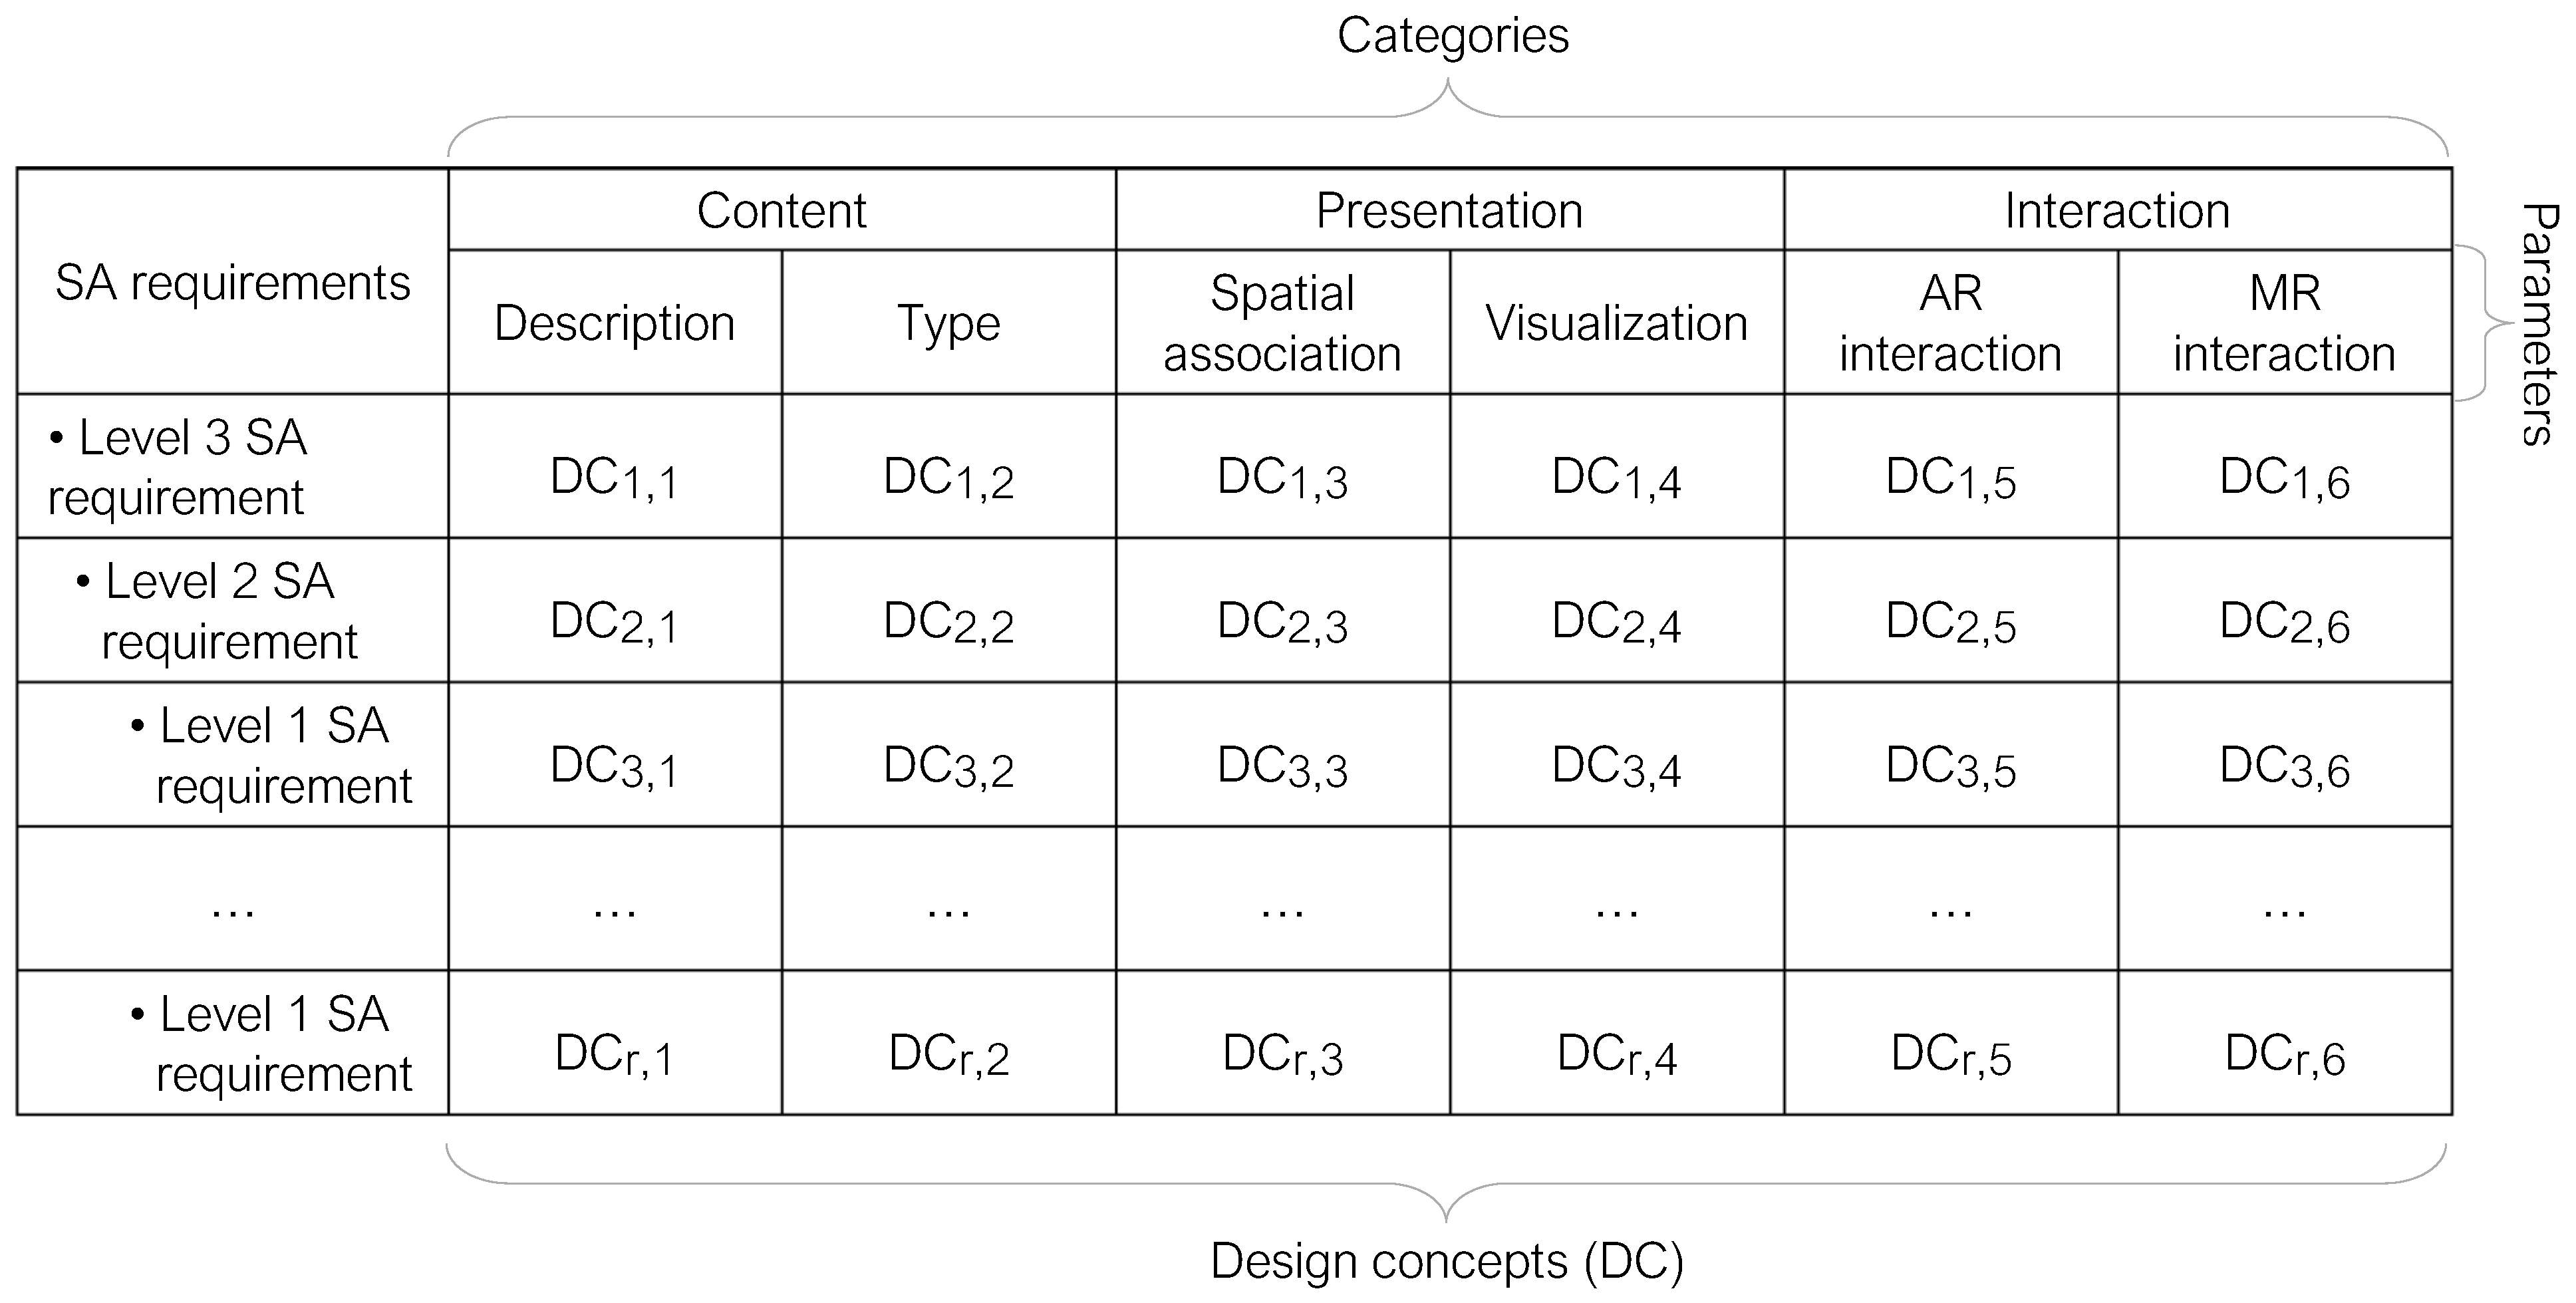
5.3. Design Conceptualization

As depicted in Figure 4, the design conceptualization integrates the outcomes from prior phases along with the SA and IA design guidelines. These guidelines comprise 50 SA-oriented design principles (available in [15]) and design guidelines derived from the different areas of the IA theoretical framework (found in [2,34,35,36,37]). A subset of these principles and guidelines, used in the practical application of the proposed method, is presented in Section 6.3. Design conceptualization within the Practical Application and Results section.
The conceptualization process begins with selecting a goal and its SA requirements, which are elicited in the requirements analysis phase. The SA requirements are added to the design matrix, as depicted in Figure 3. The next step is to specify the design concept for each SA requirement according to the six design parameters of the matrix, as detailed below.
(1)
Description. The GDTA method facilitates the description of the SA requirement by providing context or insights into the practitioners’ work and information needs. It also identifies the SA level of the information requirement, which is crucial for effectively applying the SA and IA design guidelines.
(2)
Type. As indicated in Table 1, SA requirements can be explicit or implicit. For explicit SA requirements (e.g., text, numeric, date, and files such as attachments or multimedia), their type can be identified within their information source. Implicit SA requirements are mental constructs (e.g., SA levels 2-comprehension or 3-projection, practitioner’s experience) and it should be stated in the design concept.
(3)
Spatial association. The association of a SA requirement with specific elements within the immersive environment depends on its nature or context. For instance, a “practitioner’s experience” is implicit information that cannot be directly linked to an element. In contrast, a “planned task” is explicit information that can be associated with all the building elements involved in that task. In both cases, the design concept should explicitly state it. Additionally, the IA design guidelines from the situated analytics area provide insights for addressing the spatial association parameter.
(4)
Visualization. This specifies the position, visibility scope, arrangement, notifications, and other display features for the addressed SA requirement. The SA and IA design guidelines steer this specification. The designer should filter and apply the appropriate guidelines based on the SA level, type, and context of the SA requirement. A practical example is provided in Section 6.3 to assist the designer in this process.
(5)
AR and MR interaction, respectively. It specifies the devices (e.g., handset, headset), interaction modes (e.g., tactile, eye/head gaze, and hand gesture), interaction tasks (e.g., selecting, tracking, and navigating), and the overall AR/MR interaction flow for all SA requirements addressed. AR/MR design considerations from the technology analysis phase assist in this specification. In addition, the SA and IA design guidelines, particularly those from the embodied data exploration area, contribute to conceptualizing the interaction flow.
The system’s operational requirements can provide valuable insights during the conceptualization process. Additionally, AR/MR design considerations and design guidelines from the various IA areas can support the conceptualization process across parameters. In this regard, it is recommendable for the designer to gather and thoroughly review these inputs for a more complete information presentation.
The completed matrix documents the AR/MR interface design specifications, providing sufficient detail for prototyping and evaluating the design to effectively enable SA.

5.4. Prototyping and Evaluation

Designers may apply any of the various software development methods to prototype the interface, including the agile, lean, and waterfall, to mention a few. However, a method particularly well-aligned with the SA-oriented design is the Lean startup method by Ries [38]. It is an incremental iterative design and development process that focuses on quickly formulating and validating ideas with end users to gain early insights into critical design features and trade-offs that allow for refining the design concept and reducing uncertainties [39,40]. Using a build–measure–learn feedback loop, the method enables rapid interface prototyping, from basic versions, such as paper-based mockups and storyboards, to high-fidelity prototypes.
The system interface prototype, materializing the developed design concepts, can be assessed for SA using one or a set of SA measurement methods, as mentioned in Section 2.1. Among them, the situation awareness global assessment technique (SAGAT) is recommended. In this study, SAGAT was selected over other techniques because it objectively measures SA, which is crucial for evaluating the effectiveness of the AR and MR interfaces designed through the proposed method. SAGAT measures SA by querying users during a simulated operational environment and comparing their perception of the situation with what is actually happening to determine the accuracy of their SA [15]. This approach contrasts with subjective tools such as self-rating techniques (e.g., SART), which can be influenced by user biases, or with performance-based or behavioral measures, which may not accurately reflect the user’s understanding of the situation [15]. Moreover, SAGAT’s validity and reliability have been empirically proved [41], and it is a well-known SA measurement tool [42,43]. The reader can refer to [15] to explore SAGAT and other SA measurement methods.
The feedback from the evaluation processes must be analyzed and integrated into the design matrix for further prototyping-evaluation iterations until an acceptable SA score and desired design are achieved. Notably, there is no predefined minimum score for effective SA enablement. The target SA score depends on the margin for error that one is willing to accept [44].

6. Practical Application and Results

The following sections illustrate a practical application of the proposed method.

6.1. Requirements Analysis

The user’s operational requirements for the field manager’s role during indoor construction activities for high-rise building projects were identified through a GDTA. The procedure, analysis, and results are available in [24]. For this method’s application, only the first goal outlined in the GDTA results—“Verify constraint removal on the weekly/immediate work plan” (goal 1.1.1 of the referenced GTDA)—was addressed. The goal, its decisions, and SA requirements are presented in Table 2.
From Table 2, to achieve goal 1.1.1, the field manager needs to know the “current status of the constraints of the weekly/immediate work plan” (level 2 SA—comprehension) to determine readiness for task execution. If constraints remain, the field manager must assess the “probability of removing the constraints in time” (level 3 SA—projection) to take further action. To support these mental processes, the system interface must present the SA requirements in a way that enables quick comprehension and projection of the situation, facilitating the easy attainment of SA levels 2 and 3. This is a critical system’s operational requirement, derived directly from the analysis of a user’s operational requirement.
There are other system operational requirements for working during indoor construction activities. For instance, the system can run on handset or headset devices to access information on-site. However, to prevent accidents, it must not compromise the practitioner’s awareness of their surroundings when in use. Given the noisy nature of construction sites, the system should prioritize visual information over audio or other sensory inputs to enhance user interaction. Notably, presenting SA requirements may require data from multiple sources. Thus, the system should integrate these sources and support scalability to allow the addition of new goals and SA requirements. In addition, the system must keep information updated to ensure users stay accurately informed. These and other key considerations are detailed in Table 3.

6.2. Technology Analysis

The state-of-the-art review provided various design considerations, including AR/MR design recommendations for supporting SA [13], guidelines for AR/MR user interface design [45,46,47], and basics of user experience design [48], to mention a few. To examine the state of practice, AR applications for smartphones and MR software for headsets were tested, focusing on exploring the interface design, capabilities, and user experience of current AR/MR solutions for construction. Regarding devices, smartphones were selected for the AR prototype, and the Trimble XR10 headset was used for the MR prototype due to its compliance with construction safety standards. Interaction modes specific to each device were considered for the interaction conceptualization.

6.3. Design Conceptualization

The design conceptualization for each design parameter is exemplified using the first SA requirement from Table 2: “Current status of the constraints of the weekly/immediate work plan”, as explained below.
(1)
Description. This is a level 2 SA requirement, as it involves comprehending the current situation of constraints for planned tasks based on perceived information. This cognitive outcome represents the field manager’s mental picture of whether planned tasks have their constraints removed or not, being most important in the latter as they need to be addressed.
(2)
Type. This is a mental construct about the constraints’ situation.
(3)
Spatial association. This mental construct cannot be directly associated with elements in the environment. However, it can be formed by associating information about tasks and their constraints with related virtual elements. For this, the digital building model should be overlaid onto its physical twin version to present and access information on demand.
(4)
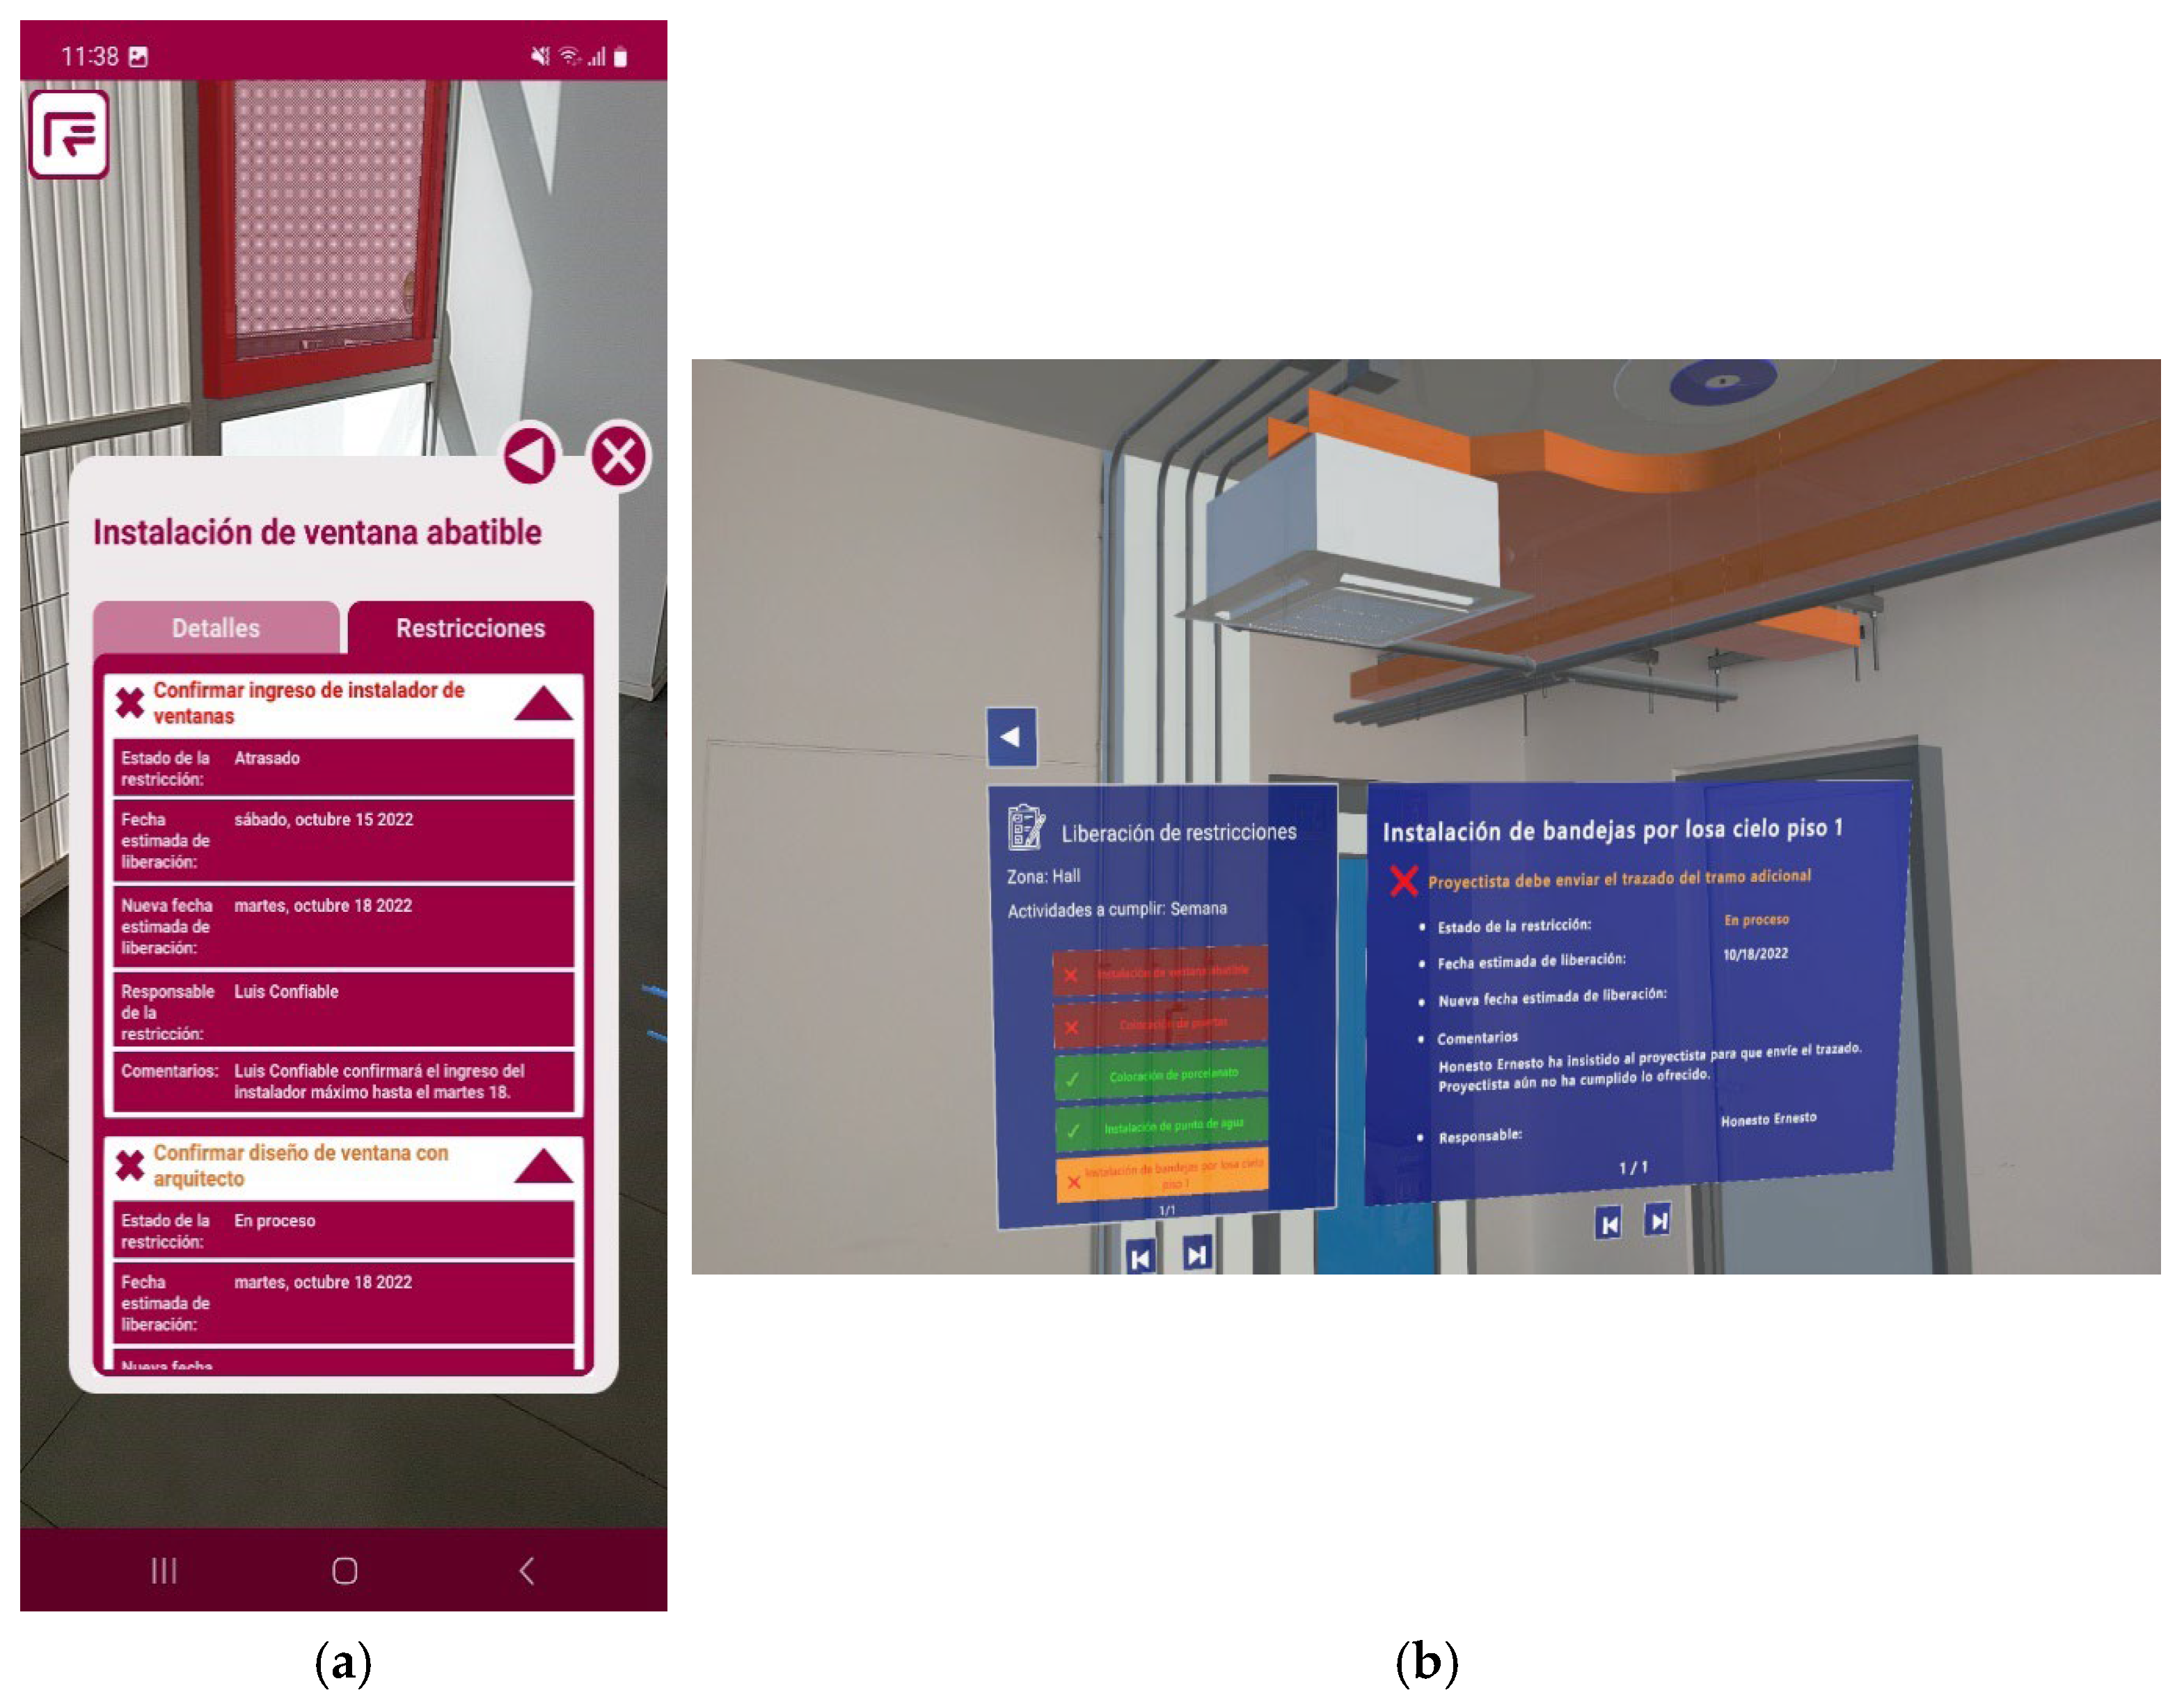
Visualization. Following the guidelines in Table 4, the interface should “present level 2 information directly” (guideline 2) to support the comprehension of the task constraints situation. This involves visualizing if tasks have their constraints removed or not within the immersive environment. For this, the interface should use a visual encoding that informs without hindering the user’s actions (guideline 29). One approach is to use colors on virtual building elements associated with tasks with constraints not removed (guidelines 39 and 40). For tasks with constraints removed, their associated elements should be hidden to focus the field manager’s attention on the constraints not removed (guidelines 15 and 26). If all tasks have their constraints removed, i.e., no colored building elements are visible, the interface should display a notification to inform the field manager. This design concept highlights the critical cues that activate the mental schema of the situation (guideline 5) and minimizes task complexity (guideline 17), enabling the field manager to recognize, at a glance, planned tasks with constraints to be addressed.
(5)
AR interaction. Handsets, specifically smartphones, were employed for AR interaction, using tactile gestures as the interaction mode (Table 4, guideline 37). Proposed interaction tasks included tap for selecting and body-based physical movement for exploring/navigating within the immersive environment. The AR interaction flow begins with selecting the option/button for goal 1.1.1. Once selected, if all constraints were removed, a colored message appears in the center of the screen to notify the user (guidelines 31 and 36). If not, the interface displays only the colored virtual building elements with tasks with constraints not removed (guideline 31). In this state, the field manager can navigate the immersive environment by physically moving while holding and gazing at the handset to inspect the work area (guidelines 32 and 38).
(6)
MR interaction. The Trimble XR10 headset was employed for MR interaction, using multimodal interaction such as eye/head gaze and hand gesture as the interaction modes (Table 4, guideline 37). The interaction tasks included head gaze and eye gaze for tracking; air-tap, point and commit with hands, and eye gaze and pinch for selecting; and body-based physical movement for exploring/navigating. The MR interaction flow is similar to AR, differentiating in the application of interaction modes that MR provides.
Table 5 provides an excerpt of the design matrix, presenting the design concepts developed for the addressed level 2 SA requirement and its level 1 SA requirements. The complete matrix is provided in Table S1 of the Supplementary Material.

6.4. Prototyping and Evaluation

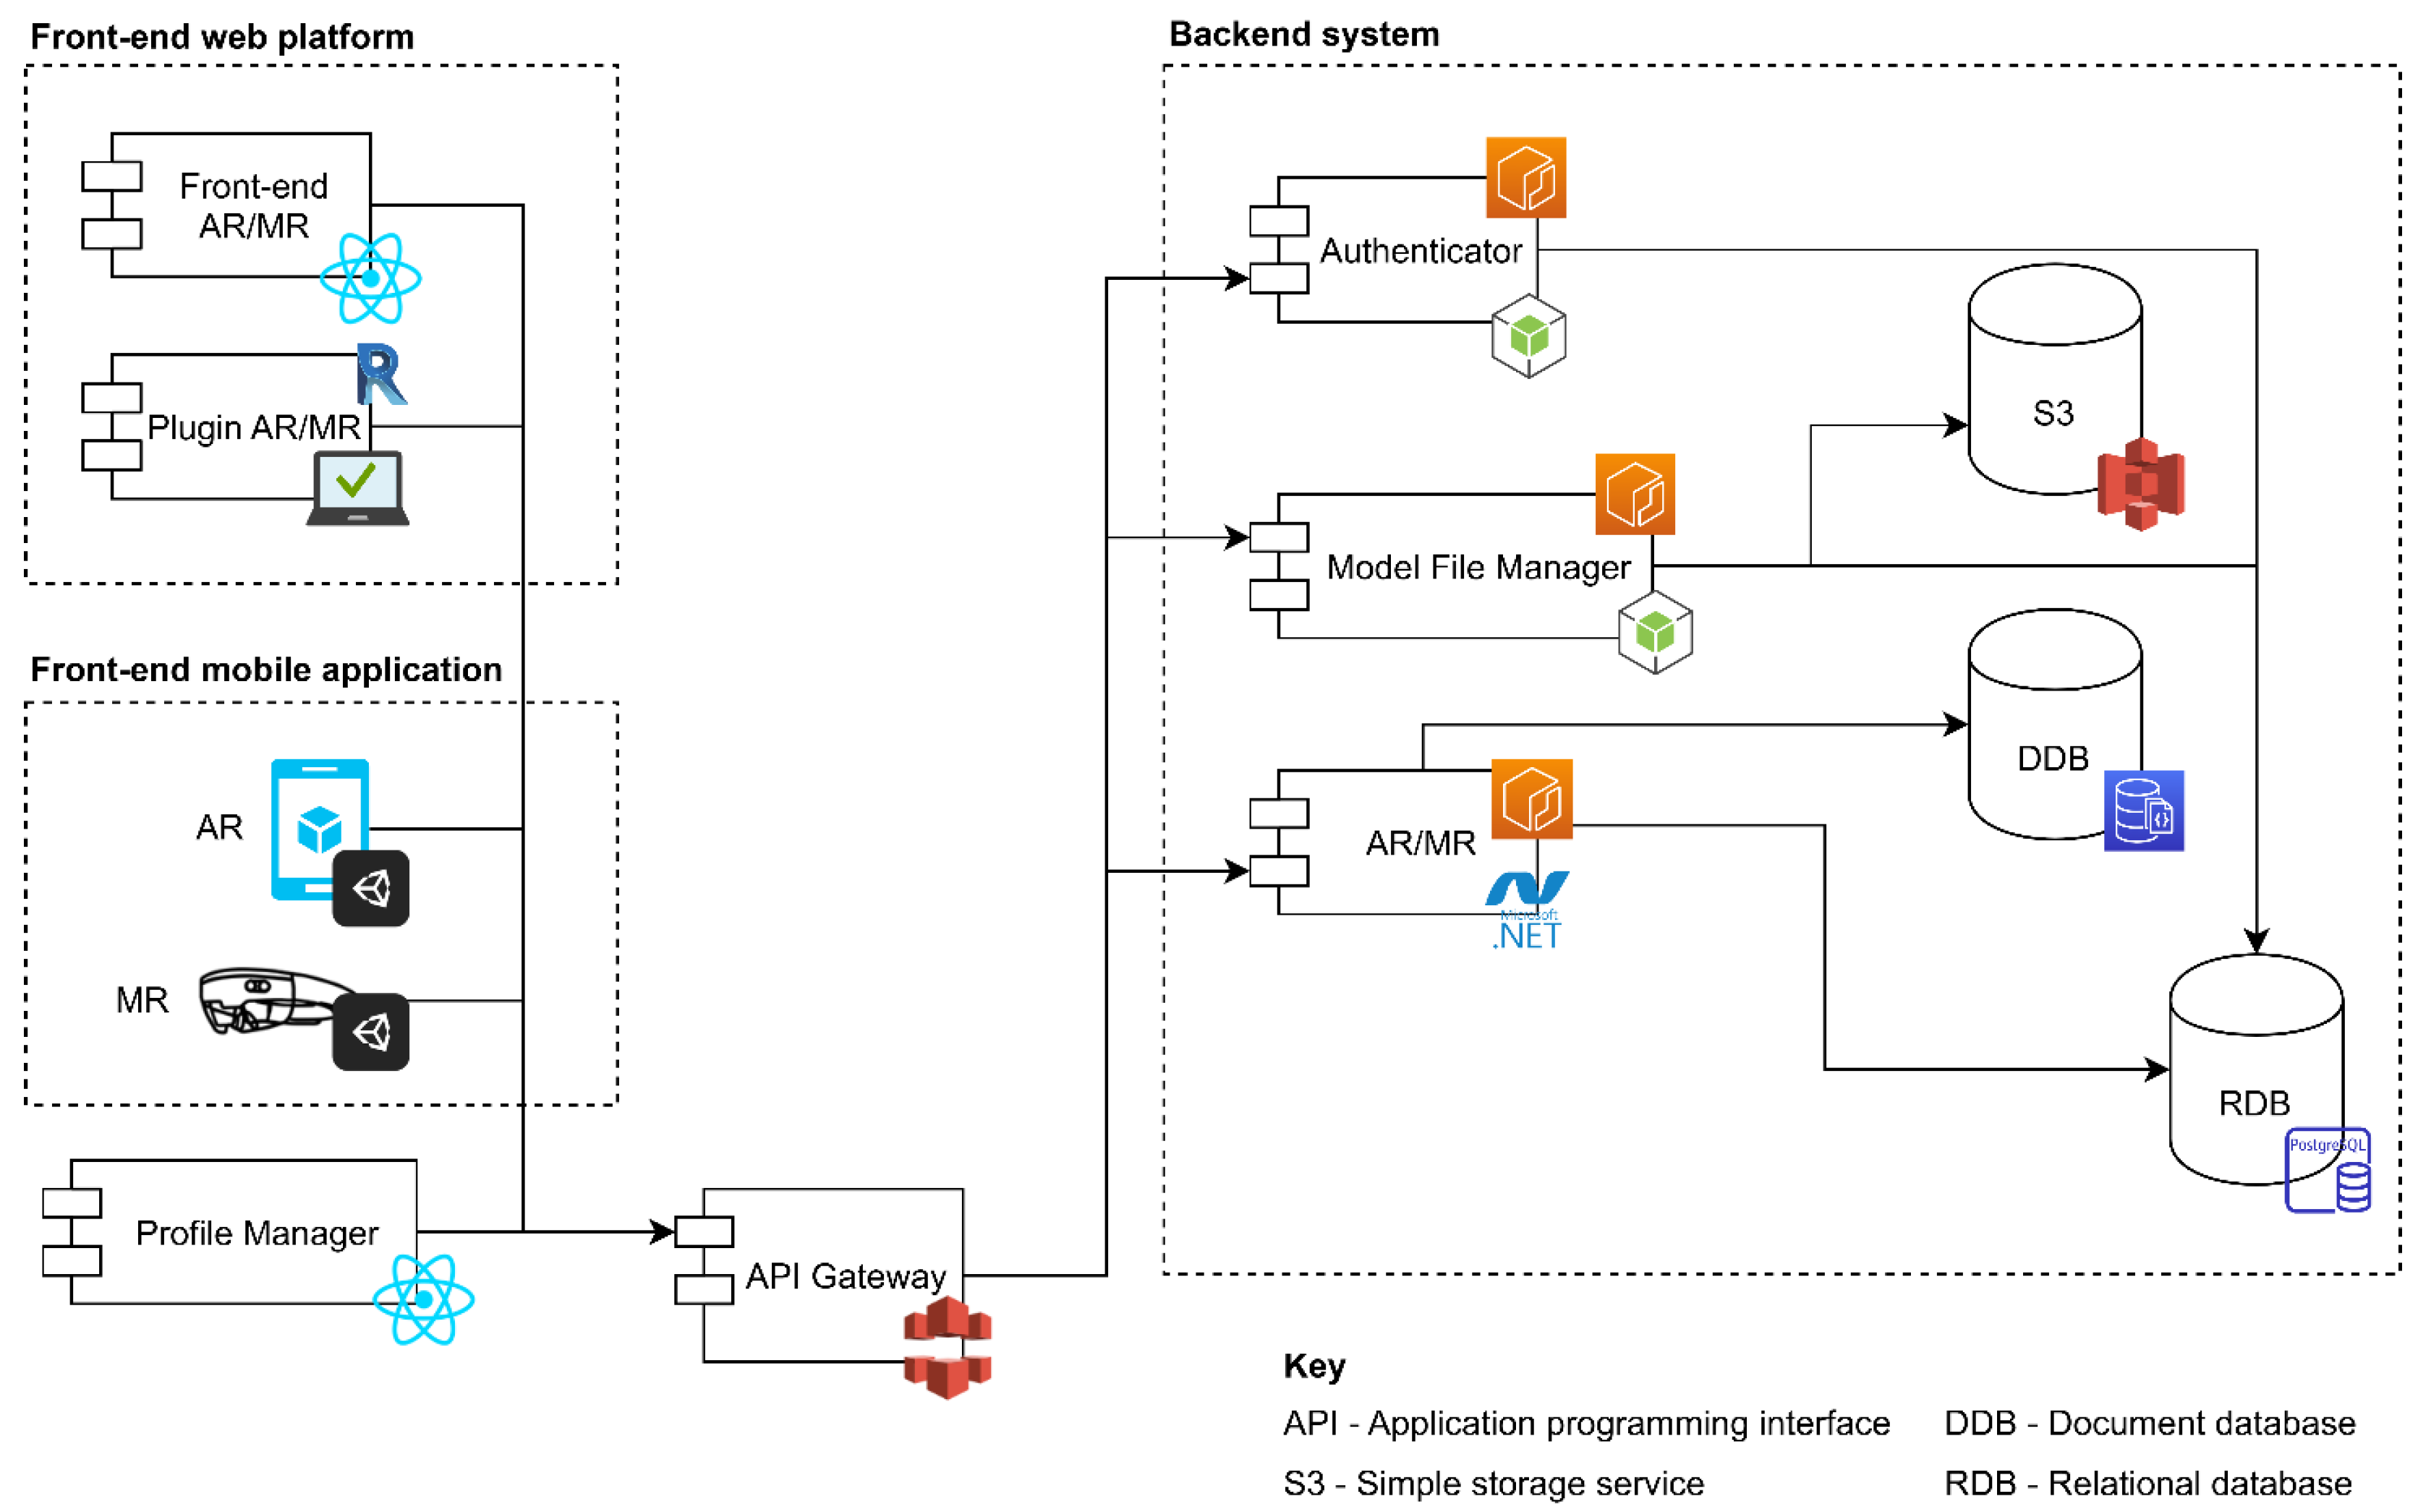
6.4.1. Rapid Prototyping

The lean startup method [38] was employed, applying the iterative build–measure–learn feedback loop over three cycles, as detailed below.
First cycle. Built. AR and MR interface mockups were created in PowerPoint following the design concepts from the matrix. These mockups served as a minimum viable product (MVP) as they were created with minimal resources but sufficient features to present the proposed design concepts and collect validated feedback from end users. The PowerPoint presentation was designed as a storyboard to emulate the interaction with the proposed AR/MR interfaces in an indoor construction decision-making scenario.
Measure. The AR and MR mockups were presented in a workshop with two field managers. Participants were asked to follow the storyboards, simulating the experience of engaging with the AR/MR interfaces to make decisions and achieve goal 1.1.1. During this process, the verbal protocol analysis (VPA) was applied by asking the practitioner to think out loud while performing the task [49] to obtain feedback regarding the following: (a) the sufficiency of information to support decision-making; (b) the perceived level of SA achieved using the mockups; and (c) the workflow and perceived usefulness of the AR/MR MVP.
Learn. It was observed that the proposed interface design allowed participants to address the decision-making task efficiently. A key observation was made regarding the workflow for accessing information. According to participants, field managers query information depending on the job or purpose at hand, whether it is a general inquiry (e.g., reviewing planned tasks’ constraints within the work area) or a particular inquiry (e.g., reviewing planned tasks’ constraints for a specific building element). This approach led to two ways to access information: general and particular. General access involves starting with available information in a work area and then narrowing down to the specific information needed. Particular access involves retrieving information directly through a specific element. In this context, the granularity of the BIM model must be sufficient to associate required information with specific elements. This requirement was included in the system’s operational requirements in Table 3. The information access approach was included in the interaction flow of the AR/MR interaction parameter of the design matrix (refer to the design matrix in Table S1). Additional user feedback included suggestions for date format adjustments and buttons for accessing general project information. All observations and suggestions were implemented in the design matrix and the AR/MR MVP for the next development cycle.
Second cycle. AR/MR interface mockups were developed for smartphones and the Trimble XR10 headset to test the implemented feedback in a laboratory setting. A practitioner with the same profile as previous participants conducted the test, maintaining the same design and purpose from the first cycle. Only minor style observations were made.
Third cycle. After applying minor style adjustments, the AR/MR interface mockups were tested by a field manager at a building on the university campus. The test design remained the same, with no significant observations reported.
After receiving positive feedback from the last test, the AR/MR interfaces were fully developed along with a decision support solution that adheres to the system’s operational requirements from Table 3. The solution’s architecture, based on the microservice approach [50], is depicted in Figure 5.
The proposed solution has three main components: front-end web platform, back-end system, and front-end mobile application.
(1)
Front-end web platform. This is where users upload the information sources that provide data for the AR/MR solution. A plugin for Autodesk Revit was developed to facilitate the upload of BIM model metadata. In addition, a spreadsheet was created for manually assigning the SA information requirements to building elements of the BIM model. The spreadsheet was also uploaded to the web platform.
(2)
Back-end system. This organizes, stores, and processes data received from the front-end web platform. Likewise, it retrieves data from the storage services, including a simple storage service (S3), document database (DDB), and relational database (RDB), and formats it for consumption by the front-end mobile application. An application-programming interface (API) facilitates communication between the back-end and front-end, efficiently managing data traffic.
(3)
Front-end mobile application. It is the user interface of the AR and MR prototype solutions, implemented for Android smartphones and Trimble XR10/Microsoft HoloLens headsets, respectively. Visual representations of these interfaces are provided in Figure 6 and Figure S1 of the Supplementary Material. It is noteworthy that the prototypes only display information and do not include user input capabilities.
The developed AR and MR prototypes can integrate project documentation and present the SA requirements within an AR/MR environment according to the goal being addressed. This allows for assessing the impact of the proposed design concepts on users’ SA using SA evaluation metrics.

6.4.2. Simulation Testing

The SAGAT was applied following the framework outlined by Endsley [41,51], as detailed below.
Experimental design. The SAGAT experiment quantitatively measured the participants’ SA while using the designed interfaces. A within-subjects design was applied, where each participant tested both the AR and MR interfaces to compare their impact on the level of SA, which is the dependent variable.
The sample size was determined through a power analysis using G*Power 3.1.9.7 software. A one-tailed Fisher’s exact test was applied with a desired statistical power of 0.80, significance level (alpha) of 0.05, and expected proportions of 0.9 and 0.4 for a large effect size, yielding a minimum of 13 participants per condition (AR/MR interface).
The recruitment process was based on a minimal participant profile, requiring basic knowledge of construction practices and terminology, as the experimental task did not require advanced domain expertise. Invitations were sent via email to undergraduate and postgraduate civil engineering students listed in the department’s academic database, as well as to industry practitioners within the research team’s network. Ultimately, the study engaged a total of 14 volunteers, including final-year undergraduate civil engineering students and construction practitioners with experience as field managers with an average of 13.6 years of experience. Participant profiles are detailed in Table 6.
Notably, although the number of participants in this study may seem small, it is consistent with sample sizes commonly used in SA/SAGAT research, involving realistic simulations and participants with domain-specific knowledge [43,52,53]. These types of studies are often exploratory in nature, with an emphasis on the depth and quality of insights obtained from each participant rather than on generalization to a broader population [54,55]. In this context, the sample size of 14 participants was considered appropriate, as the purpose of this study was to evaluate the feasibility of the proposed interface design method and its impact on users’ SA rather than to achieve generalizability.
The experiment was conducted at the same building as the last test, using two Samsung Galaxy S10 Lite smartphones for the AR prototype, one Trimble XR10 and one HoloLens 2 for the MR prototype, and four laptops to administer the experiment queries (SAGAT queries). All devices were connected to the internet. This setup allowed sessions with up to four participants simultaneously.
In each session, participants conducted a trial using the AR and MR prototypes, as depicted in Figure 7.
The trial involved addressing the study goal in a simulated decision-making scenario. To minimize learning effects, two different sets of construction project information were provided (one per device) and their order was counter-balanced per participant. During the trial, participants answered the queries administered through the laptops using the Qualtrics web-based survey tool.
The SAGAT queries assessed each SA requirement. They were developed to be consistent with how users process information [15] and to be straightforward to obtain categorical answers, avoiding additional transformations or decisions [41]. Given the dichotomous nature of the assessed items (correct or incorrect), the Kuder–Richardson formula 20 [56], yielding a score of 0.73, deemed acceptable for the purpose of the test, based on values considered in similar studies [57,58]. The SAGAT queries developed for goal 1.1.1 are available in Table S2 of the Supplementary Material.
Data collection. The procedure for data collection is depicted in Figure 8. It was conducted as follows.
(1)
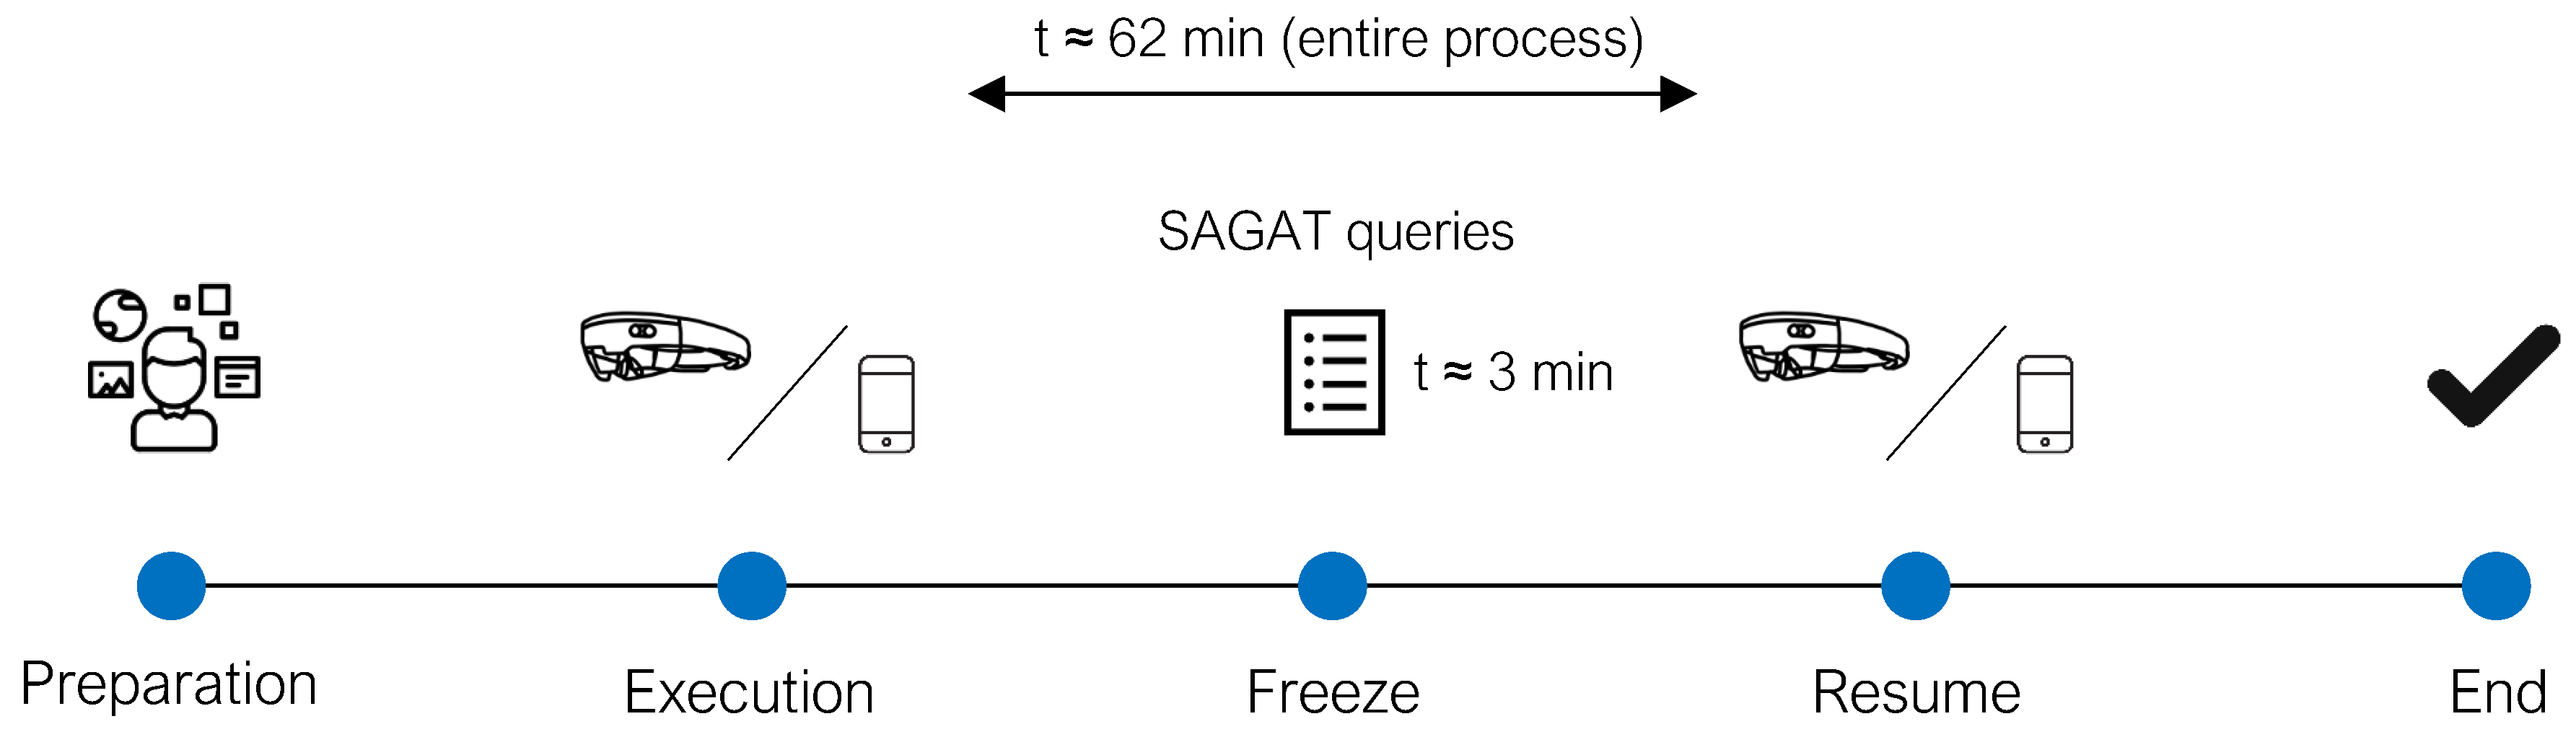
Preparation. Participants were briefed on the research and the purpose of the experiment. They then received detailed instructions on how to perform the trial and answer the queries. To familiarize themselves with the task and devices, participants conducted training trials using demo information with both AR and MR prototypes. Practice continued until they felt ready to proceed to the actual trial.
(2)
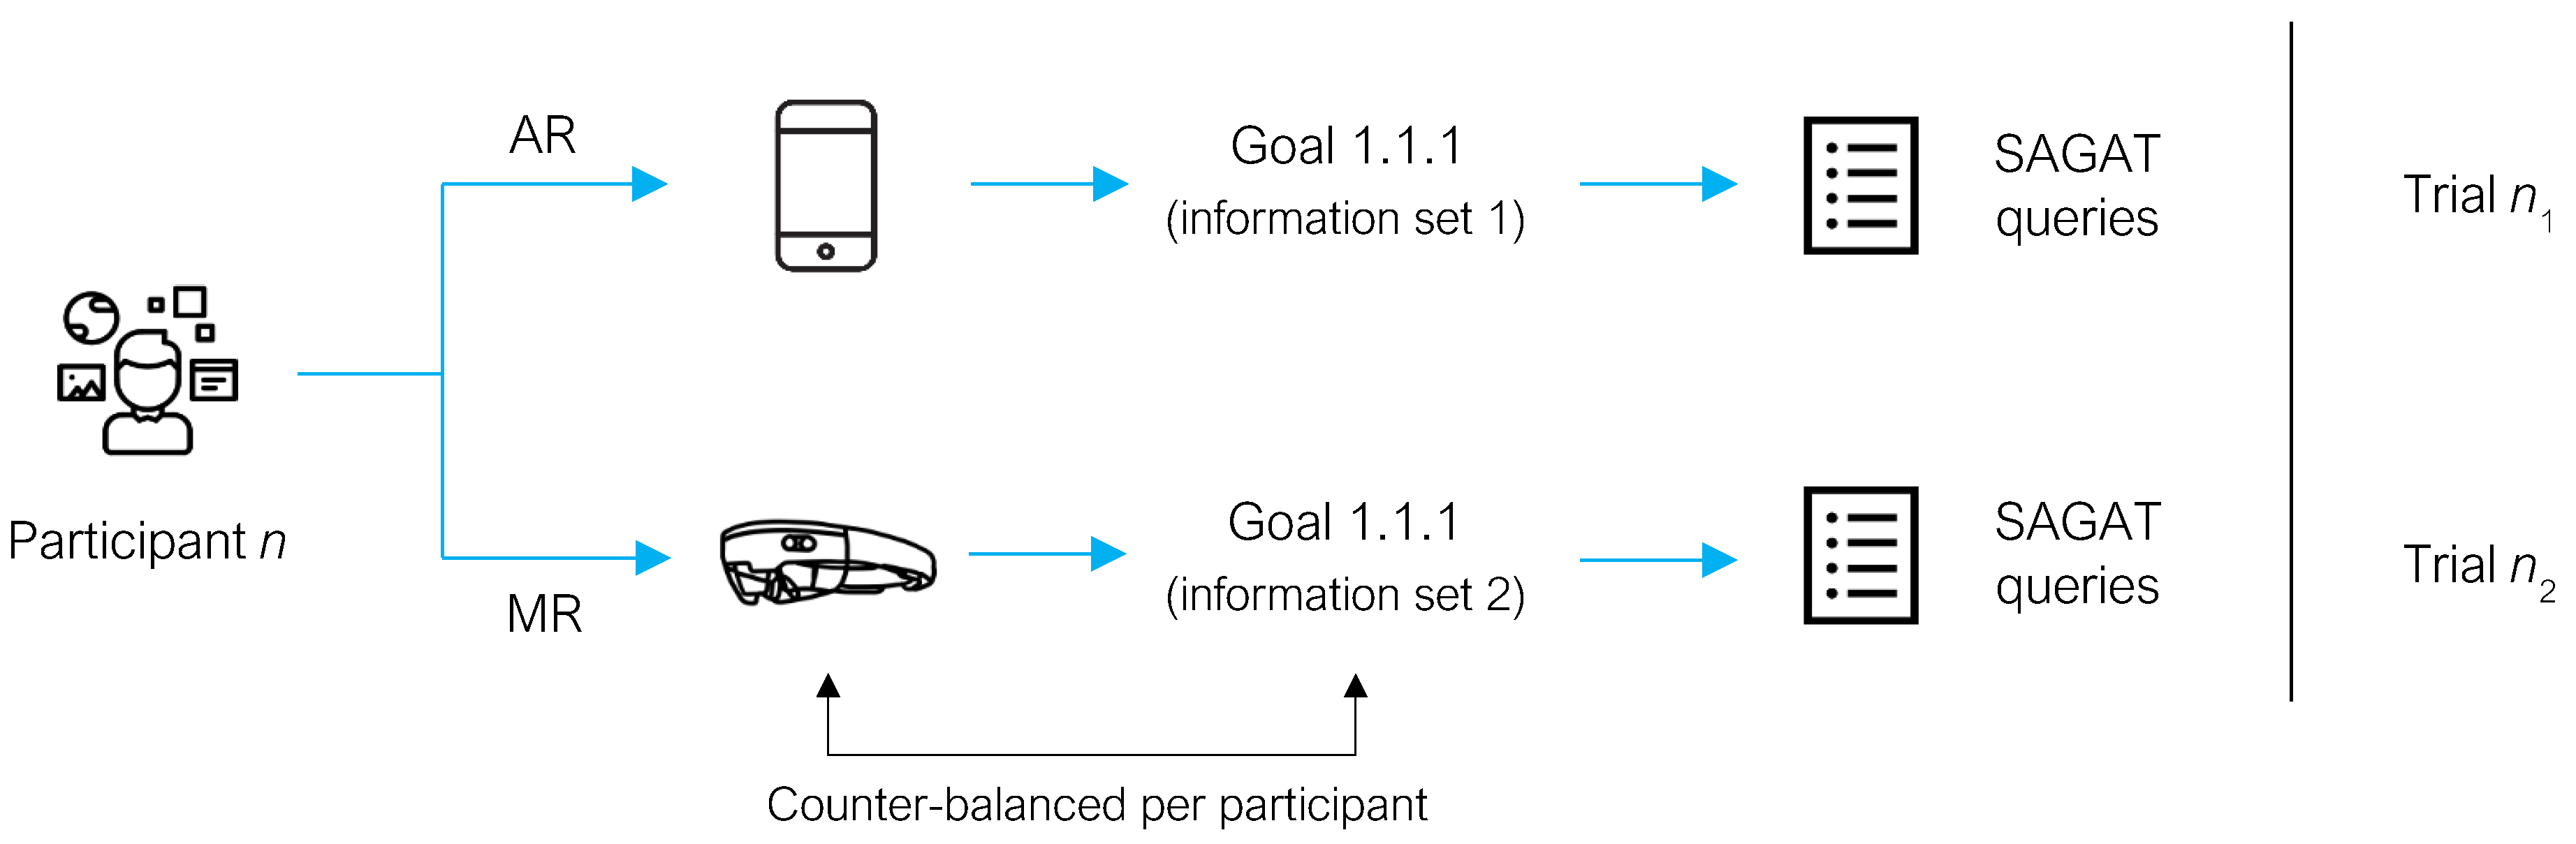
Execution. Participants were asked to perform a task as a field manager would normally do. The task intent was to verify the constraint removal on the weekly work plan (goal 1.1.1). For this, each participant was provided with five scheduled activities, some with constraints not removed. The AR/MR prototype provided information on which activities had constraints not removed and assisted the participant in deciding whether constraints could be removed on time or if rescheduling was necessary.
(3)
Freeze. During the task, a random pause was introduced (between 3 and 5 min after starting) where participants were required to leave the prototype and answer the SAGAT queries. The unexpected freeze prevented participants from preparing their answers in advance. The purpose of the pause was to take a mental picture of the information gathered by the participant through the prototype, which formed the current perception of the situation at that moment. Later, this perception could be compared to the actual status of each variable (i.e., the correct answer to each query) to measure the participant’s SA objectively.
(4)
Resume. After answering the queries, the trial was resumed, leaving the participant to continue reviewing the information to decide about the activities with constraints not removed.
(5)
End. The experiment concluded once the participant completed the assigned task.
Data analysis. A tabulation of the frequency of correctness was conducted for each SA requirement in both AR and MR conditions to evaluate the effectiveness of the interfaces for enabling SA.
The analysis began by examining whether statistically significant differences existed between the results of students and practitioners in both AR and MR environments. For this purpose, the Fisher’s exact test, a nonparametric test for analyzing categorical outcomes with a small sample size [59], was applied. Table 7 presents the results of the analysis.
As shown in Table 7, no statistically significant differences were found between students and practitioners in either AR or MR environments. However, when comparing the percentage of correct answers (Table 8), the MR environment presented notable differences in SA requirements 4, 5, and 10. In these SA requirements, students scored higher than practitioners, suggesting that prior experience was not a determining factor in achieving higher SA in this study.
Overall, the results are highly consistent across groups, with no statistically significant differences. Therefore, the data from all participants were combined to provide a comprehensive analysis of the prototypes’ impact on enabling SA. These results are presented as percentages in Figure 9.
Considering that the target SA score depends on the margin for error that one is willing to accept [44], this study arbitrarily set a minimum SA score of 70%, given that the test was conducted in a simulated scenario. In an actual situation, field managers would be familiar with the construction project, which may result in more internalized information requirements, potentially leading to higher SA when using the proposed interfaces.
As shown in Figure 9, participants achieved high comprehension of the constraint’s current status (level 2 SA) in both AR and MR interfaces, scoring 100% and 93%, respectively. This comprehension was supported by its level 1 SA requirements, assessed through queries 2, 3, and 4, as detailed in the same figure. Although participants could not perfectly recall the number of constraints removed and not removed, their overall perception enabled them to form an excellent mental schema of the constraints’ situation.
Continuing in Figure 9, for the probability of removing the constraints on time (level 3 SA), four of its level 1 SA requirements, assessed through queries 5, 6, 8, and 9, did not achieve acceptable SA scores individually. However, the SA requirements in conjunction enabled participants to understand and project the probability of removing the constraints in time, achieving scores of 71% in AR and 86% in MR. Overall, the developed AR and MR interfaces effectively enabled participants to achieve the higher levels of SA: level 2—comprehension and level 3—projection.
The Fisher’s exact test was used to assess whether the AR and MR interfaces differed significantly in achieving SA. This nonparametric test was suitable for the experimental design, which involved two independent conditions (AR and MR) and categorical outcomes with a small sample size. Table 9 presents the test results, showing that all p-values exceed 0.05, indicating no statistically significant differences between AR and MR in enabling SA for the addressed goal. Although Figure 9 visually suggests some differences between AR and MR results, these differences were not statistically significant and cannot be confidently attributed to the type of immersive interface used.
SAGAT identifies the design concepts that need improvement to better support SA. In this regard, low-scored SA requirements from queries 5, 6, 8, and 9 in Figure 9 were analyzed and amendments were proposed.
Starting with the “name of the constraint not removed”, the AR interface presented this information in a drop-down box displaying the constraint’s name and details. However, apart from color, no major format distinguished the constraint’s name from other SA requirements. Similarly, in MR, only color differentiated the constraint’s name from the rest of the text in the information box. To improve visibility, the visualization design concept should emphasize the constraint’s name by using distinctive techniques, such as the use of bold or larger text and icons, among others. Additionally, fixing it at one point in the box would aid the user to see the constraint name constantly.
Regarding the “estimated removal date”, both AR and MR interfaces displayed this information next to the scheduled removal date. This might have confused participants when selecting the correct one. To address this issue, the dates could be separated. The “estimated removal date”, which is the new proposed date for constraint removal, could be included in the “comments on the constraint removal” along with any contextual details supporting the estimated removal date.
The “comment on the constraint removal” in the MR interface was displayed as a paragraph, sometimes occupying much of the information box. It may have caused information overload, hindering participants from quickly understanding the idea. A better approach could be to display key comments as bullet points.
Lastly, participants had difficulty in recalling the “name of the responsible individual for the constraint removal” in both interfaces. This may be due to the nature of this SA requirement, as it aims to activate the field manager’s mental schema on the reliability of the responsible individual by reading their name, which is easier in real construction scenarios. Adding a photograph could facilitate this process.
These proposed changes were included in the design matrix for further prototyping and evaluation.

7. Discussion

The criterion for evaluating the effectiveness of the proposed method was its capacity to produce interfaces that enable users to achieve high levels of SA, which is quantitatively measured through SAGAT. For this evaluation, a minimum SA score of 70% was set as the acceptable threshold for effectiveness within the context of a simulated scenario, as described in Section 6.4.2. The results show that the design concepts derived from the proposed interface design method enabled participants to achieve high SA scores for level 2 SA (comprehension of the current situation: 100% AR, 93% MR) and level 3 SA (projection of future status: 71% AR, 86% MR), with no statistically significant differences between AR and MR (all p-values > 0.05), demonstrating the method’s effectiveness in supporting SA for both immersive environments.
This effectiveness lies in the method’s structured approach, which systematically provides the conditions for achieving high SA. The first condition is ensuring that only the necessary information is presented, which reduces the practitioner’s cognitive load and enables rapid access to relevant information. The second condition is leveraging the immersive capabilities of AR/MR to present this information in a way that facilitates rapid access and interpretation within the user’s immersive environment. These conditions increase the users’ perception (level 1 SA), thereby facilitating their comprehension of the situation (level 2 SA) and enabling a more accurate projection of its future status (level 3 SA), that is, achieving a high level of SA. While the inherent capabilities of AR/MR, such as presenting information directly within the user’s field of view, significantly support decision-making, it is the method’s structured alignment of these capabilities with the users’ cognitive needs that ultimately contributes to enhanced SA and more informed decision-making.
Although AR and MR scores were similar across most SA requirements, a notable difference was observed in SA requirement 8, “comments on the constraint removal”, where participants scored lower in MR. This could be attributed to how that information was presented in MR, as it was displayed as a paragraph occupying a large portion of the text box, potentially causing information overload and hindering quick comprehension. In contrast, while AR also presented the information as a paragraph, participants performed better, possibly because users are more familiar with reading large amounts of information on smartphones than on MR headsets. These findings suggest that the amount of information (one of the SA enablers) is particularly sensitive to the MR environment. This observation supports the findings of Woodward and Ruiz [13], who emphasized the need to tailor information presentation in AR/MR to effectively support users’ SA.
Another interesting finding is that there was no statistically significant difference between the SA scores of students and practitioners, suggesting that experience was not a determining factor for achieving higher SA. This contrasts with the idea that seasoned practitioners have an advantage because they rely on experience to easily comprehend the situation by associating it with a known mental model [15]. Two factors may explain this finding: the nature of the task and the formalized information presented in the AR/MR prototypes. The task “verify the constraints removal from the weekly work plan” involved identifying activities with constraints not removed, reviewing the corresponding information, and deciding accordingly. Therefore, it could be said that the task was not particularly demanding, making it suitable for both experienced and inexperienced participants. In addition, the AR/MR prototypes presented only the information required for decision-making. This feature reduced the advantage that seasoned practitioners might have in handling large quantities of information compared to inexperienced participants [60], thereby equalizing the conditions for both types of participants in completing the task.
Notably, construction sites introduce additional challenges beyond those addressed in the conducted task, such as increased task complexity, time pressure, and other factors that may increase practitioners’ cognitive load and could compromise the level of SA achieved through AR/MR systems. However, the proposed method is designed to adapt to more complex tasks than the one employed in the practical case, as it uses SA-oriented design principles specifically intended for complex and dynamic environments such as construction. These principles aim to reduce perceptual overload and increase SA in such scenarios. Moreover, the proposed method adjusts the interface design based on the goal/task to address. In this regard, more complex tasks would require more tailored design concepts, a process that is systematically supported by the method. Additionally, in real on-site scenarios, practitioners are typically familiar with the project context, which can lead to more internalized information requirements and potentially higher SA. In this context, it is expected that system interfaces designed through the proposed method can achieve SA levels comparable to, or even exceeding, those reported in this study, even under complex field conditions.
Overall, the practical case provided valuable evidence of the applicability and utility of the method in effectively enabling SA within AR and MR environments. The results not only validate the method’s approach, but also provide insights for improving the immersive interface design to better support cognitive performance in complex and dynamic decision-making contexts.
This study contributes to a body of knowledge where the AR/MR interface design advanced along two complementary yet often disconnected research areas: SA and IA. SA research addresses the user’s cognitive needs (what information is required) for designing system interfaces. For instance, Wang et al. [61] proposed a dynamic spatial information design framework that combines SA theory with the skill, rule, knowledge taxonomy, and a cognitive-centric guide for interface and system design, to develop an AR head-up display that improved drivers’ SA and hazard response. On the other hand, IA research focuses on how to present information in immersive environments, as exemplified by the study of Lee et al. [62], which identified ten common design patterns for situated visualization in AR and provided design guidelines for implementation.
In contrast to these approaches, the present study introduces a unified structured method that integrates both SA and IA. The method aligns what information to present with how to present it to ensure that interface design is grounded in the user’s cognitive needs, leading to more effective AR/MR decision support systems for complex and dynamic environments, such as construction. Moreover, the method incorporates key human–computer interaction (HCI) principles, including designing interfaces that are intuitive to use, responsive to user interaction, and iteratively improved through user feedback [63]. In this regard, the proposed method advances not only SA and IA research, but also represents a contribution to HCI practice in immersive contexts.

8. Conclusions

This study proposed a method for designing AR/MR interfaces that effectively enable SA to support decision-making in construction environments. The method organizes knowledge, techniques, and design considerations from the SA and IA frameworks to assist designers in presenting information to increase practitioners’ perception and comprehension of the situation, enhancing the projection of its future status, thereby supporting more informed decision-making.
The method was applied and evaluated in a practical case. Participants achieved high SA levels with both AR and MR interfaces: 100% vs. 93% for level 2 SA (comprehension of the current situation) and 71% vs. 86% for level 3 SA (projection of future status). Fisher’s exact tests confirmed no statistically significant differences between AR and MR environments (all p-values > 0.05). These results demonstrate that interfaces designed using the proposed method effectively support high SA in both immersive environments.
Regarding practical implications, the proposed method provides a structured approach for designing immersive interfaces. It enables designers to create AR/MR interfaces that increase SA in complex decision-making environments, where cognitive overload and timely decisions are critical. The method addresses this complexity by first formalizing the information required for decision-making and then systematically translating these user needs into intuitive, traceable, and actionable design specifications for developers.
Moreover, the method is useful in scenarios where formal design guidance is lacking by providing designers and researchers with a replicable workflow that can be applied across diverse projects. Likewise, developers can use the design matrix to understand the rationale behind the interface designs, thereby guiding development efforts. Although the method was focused on construction, it is readily applicable across various disciplines.
The structured nature of the method allows construction practitioners and general users to explore its different phases, including requirement analysis, technology analysis, design conceptualization, and practical applications and outcomes, to critically evaluate the capacity of AR/MR solutions to support SA.
It is important to recognize the limitations of the study. The practical application focused on a single goal/task. Therefore, it is possible that more complex goals could lead to significant differences in the SA achieved between AR and MR designs, as well as between students and practitioners. Future research can apply the proposed method to develop AR and MR solutions for a broader range of goals to confirm or complement the results of this study.
Likewise, this study used only SAGAT to evaluate the interface effectiveness. Measures such as usability heuristics or workload assessment are also valuable for that purpose; however, this study primarily focused on presenting a novel AR/MR interface design method for supporting SA. Moreover, the developed interfaces were proof-of-concept prototypes aimed to demonstrate the potential of the method. In this regard, other assessments beyond SA fall outside the scope of the study and may not provide meaningful insights due to the preliminary nature of the prototypes. Future work could include complementary assessment methods to provide a more comprehensive evaluation and obtain additional insights into interface effectiveness.
Finally, the study did not compare the developed interface prototypes against a control condition. At the time of the study, there was no widely accepted baseline method specifically tailored for promoting SA in AR/MR environments, making it difficult to establish an adequate comparison. Moreover, this study aimed to demonstrate the feasibility and theoretical foundation of the method, rather than conduct a broad comparative analysis. Implementing meaningful control conditions would require significant additional resources and development, falling outside the scope and purpose of the study. Nonetheless, these limitations at this stage do not diminish the contribution of the study. Instead, this research provides the necessary theoretical and practical groundwork, establishes the parameters for SA-enabled interface design, and creates the base for future usability and comparative assessments.
This research contributes to the body of knowledge of human factors and human–computer interaction by providing insights for designing and evaluating SA-oriented AR/MR solutions, supporting current efforts to create more effective decision support systems.

Supplementary Materials

The following supporting information can be downloaded at: https://www.mdpi.com/article/10.3390/app15147820/s1, Table S1: SA-enabling interface design matrix for goal 1.1.1—Verify the constraints removal on the weekly/immediate work plan; Figure S1: Visual representations of the developed SA-enabling AR and MR interface prototypes; Table S2: SAGAT queries for SA requirements in goal 1.1.1.

Author Contributions

Conceptualization, E.P., C.M., A.N. and V.A.G.; methodology, E.P., C.M. and V.A.G.; software, A.N.; validation, C.M., A.N. and V.A.G.; formal analysis, E.P.; investigation, E.P.; resources, E.P., C.M. and A.N.; data curation, E.P.; writing—original draft preparation, E.P.; writing—review and editing, E.P., C.M., A.N. and V.A.G.; visualization, E.P.; supervision, C.M., A.N. and V.A.G.; project administration, C.M. and A.N.; funding acquisition, E.P., C.M. and A.N. All authors have read and agreed to the published version of the manuscript.

Funding

This research was funded by Agencia Nacional de Investigación y Desarrollo (ANID), Chile, through FONDEF grant number ID19I10145 and FONDECYT grant number 1241756. Ernesto Pillajo acknowledges funding for his PhD studies from the Secretaría de Educación Superior, Ciencia, Tecnología e Innovación (SENESCYT), Ecuador.

Institutional Review Board Statement

The study was conducted in accordance with the Declaration of Helsinki and approved by the Scientific Ethics Committee for Social Sciences, Arts, and Humanities of the Pontificia Universidad Católica de Chile (190318008—22 July 2020).

Informed Consent Statement

Informed consent was obtained from all subjects involved in the study.

Data Availability Statement

The original contributions presented in the study are included in the article and Supplementary Materials, further inquiries can be directed to the corresponding author.

Acknowledgments

The authors are grateful to the practitioners who generously shared their time, experience and support, which made carrying out this study possible. The authors also acknowledge the Centro Interdisciplinario para la Productividad y Construcción Sustentable (CIPYCS) for its valuable support through professionals and infrastructure. Lastly, Ernesto Pillajo thanks his family for their support and encouragement.

Conflicts of Interest

The authors declare no conflicts of interest.

Abbreviations

The following abbreviations are used in this manuscript:
ARaugmented reality
MRmixed reality
SAsituation awareness
IAimmersive analytics
GDTAgoal-directed task analysis

References

  1. Adekunle, P.; Aigbavboa, C.; Akinradewo, O.; Oke, A.; Aghimien, D. Construction Information Management: Benefits to the Construction Industry. Sustainability 2022, 14, 11366. [Google Scholar] [CrossRef]
  2. Marriott, K.; Schreiber, F.; Dwyer, T.; Klein, K.; Henry, N.; Itoh, T.; Stuerzlinger, W.; Thomas, B. (Eds.) Immersive Analytics; Lecture Notes in Computer Science; Springer International Publishing: Cham, Switzerland, 2018; Volume 11190, ISBN 978-3-030-01387-5. [Google Scholar]
  3. Brigham, T.J. Reality Check: Basics of Augmented, Virtual, and Mixed Reality. Med. Ref. Serv. Q. 2017, 36, 171–178. [Google Scholar] [CrossRef] [PubMed]
  4. Speicher, M.; Hall, B.D.; Nebeling, M. What Is Mixed Reality? In Proceedings of the 2019 CHI Conference on Human Factors in Computing Systems, Scotland, UK, 4–9 May 2019; pp. 1–15. [Google Scholar]
  5. Flavián, C.; Ibáñez-Sánchez, S.; Orús, C. The Impact of Virtual, Augmented and Mixed Reality Technologies on the Customer Experience. J. Bus. Res. 2019, 100, 547–560. [Google Scholar] [CrossRef]
  6. Al-Sabbag, Z.A.; Yeum, C.M.; Narasimhan, S. Enabling Human–Machine Collaboration in Infrastructure Inspections through Mixed Reality. Adv. Eng. Inform. 2022, 53, 101709. [Google Scholar] [CrossRef]
  7. Kazemzadeh, D.; Nazari, A.; Rokooei, S. Application of Augmented Reality in the Life Cycle of Construction Projects. In Industry 4.0 Applications for Full Lifecycle Integration of Buildings; Southfield Rd: Middelsbrough, UK, 2021; p. 248. [Google Scholar]
  8. Chen, K.; Xue, F. The Renaissance of Augmented Reality in Construction: History, Present Status and Future Directions. Smart Sustain. Built Environ. 2022, 11, 575–592. [Google Scholar] [CrossRef]
  9. Nguyen, D.-C.; Nguyen, T.-Q.; Jin, R.; Jeon, C.-H.; Shim, C.-S. BIM-Based Mixed-Reality Application for Bridge Inspection and Maintenance. Constr. Innov. 2022, 22, 487–503. [Google Scholar] [CrossRef]
  10. Katika, T.; Konstantinidis, F.K.; Papaioannou, T.; Dadoukis, A.; Bolierakis, S.N.; Tsimiklis, G.; Amditis, A. Exploiting Mixed Reality in a Next-Generation IoT Ecosystem of a Construction Site. In Proceedings of the 2022 IEEE International Conference on Imaging Systems and Techniques (IST), Kaohsiung, Taiwan, 21–23 June 2022; pp. 1–6. [Google Scholar]
  11. Ratajczak, J.; Schweigkofler, A.; Riedl, M.; Matt, D. Augmented Reality Combined with Location-Based Management System to Improve the Construction Process, Quality Control and Information Flow. In Advances in Informatics and Computing in Civil and Construction Engineering; Mutis, I., Hartmann, T., Eds.; Springer: Berlin/Heidelberg, Germany, 2019; pp. 289–296. ISBN 978-3-030-00219-0. [Google Scholar]
  12. Kunic, A.; Naboni, R. Collaborative Design and Construction of Reconfigurable Wood Structures in a Mixed Reality Environment. In Proceedings of the Blucher Design Proceedings, São Paulo, Brazil, 16–20 October 2023; pp. 651–662. [Google Scholar]
  13. Woodward, J.; Ruiz, J. Analytic Review of Using Augmented Reality for Situational Awareness. IEEE Trans. Vis. Comput. Graph. 2022, 29, 2166–2183. [Google Scholar] [CrossRef]
  14. Zhang, X.; Bai, X.; Zhang, S.; He, W.; Wang, S.; Yan, Y.; Wang, P.; Liu, L. A Novel Mixed Reality Remote Collaboration System with Adaptive Generation of Instructions. Comput. Ind. Eng. 2024, 194, 110353. [Google Scholar] [CrossRef]
  15. Endsley, M.R.; Bolté, B.; Jones, D.G. Designing for Situation Awareness: An Approach to User-Centered Design, 1st ed.; CRC Press: Boca Raton, FL, USA, 2003; ISBN 9780429146732. [Google Scholar]
  16. Gheisari, M.; Irizarry, J. Investigating Facility Manager’s Decision Making Process through a Situation Awareness Approach. Int. J. Facil. Manag. 2011, 2, 1–11. [Google Scholar]
  17. Woodward, J.; Smith, J.; Wang, I.; Cuenca, S.; Ruiz, J. Examining the Presentation of Information in Augmented Reality Headsets for Situational Awareness. In Proceedings of the International Conference on Advanced Visual Interfaces, Salerno, Italy, 28 September–2 October 2020; pp. 28–32. [Google Scholar] [CrossRef]
  18. Chandler, T.; Cordeil, M.; Czauderna, T.; Dwyer, T.; Glowacki, J.; Goncu, C.; Klapperstueck, M.; Klein, K.; Marriott, K.; Schreiber, F.; et al. Immersive Analytics. In Proceedings of the 2015 Big Data Visual Analytics (BDVA), Hobart, Australia, 22–25 September 2015; Volume 39, pp. 1–8. [Google Scholar]
  19. Cid Martins, N.; Marques, B.; Dias, P.; Sousa Santos, B. Extending the Egocentric Viewpoint in Situated Visualization Using Augmented Reality. In Proceedings of the 2023 27th International Conference Information Visualisation (IV), Tampere, Finland, 15–28 July 2023; pp. 83–89. [Google Scholar]
  20. Schwajda, D.; Friedl, J.; Pointecker, F.; Jetter, H.-C.; Anthes, C. Transforming Graph Data Visualisations from 2D Displays into Augmented Reality 3D Space: A Quantitative Study. Front. Virtual Real. 2023, 4, 1155628. [Google Scholar] [CrossRef]
  21. Martins, N.C.; Marques, B.; Alves, J.; Araújo, T.; Dias, P.; Santos, B.S. Augmented Reality Situated Visualization in Decision-Making. Multimed. Tools Appl. 2022, 81, 14749–14772. [Google Scholar] [CrossRef]
  22. Wang, X.; Kim, M.J.; Love, P.E.D.; Kang, S.-C. Augmented Reality in Built Environment: Classification and Implications for Future Research. Autom. Constr. 2013, 32, 1–13. [Google Scholar] [CrossRef]
  23. Mondragon Solis, F.A.; O’Brien, W. Cognitive Analysis of Field Managers. In Construction Research Congress 2012: Construction Challenges in a Flat World; American Society of Civil Engineers: Reston, VA, USA, 2012; pp. 643–649. [Google Scholar]
  24. Pillajo, E.; Mourgues, C.; González, V.A. Formalizing the Information Requirements for Decision-Making of Field Managers during Indoor Construction Activities. Eng. Constr. Archit. Manag. 2024, 31, 4125–4145. [Google Scholar] [CrossRef]
  25. Endsley, M.R. Design and Evaluation for Situation Awareness Enhancement. Proc. Hum. Factors Soc. Annu. Meet. 1988, 32, 97–101. [Google Scholar] [CrossRef]
  26. Endsley, M.R.; Bolstad, C.A.; Jones, D.G.; Riley, J.M. Situation Awareness Oriented Design: From User’s Cognitive Requirements to Creating Effective Supporting Technologies. Proc. Hum. Factors Ergon. Soc. Annu. Meet. 2003, 47, 268–272. [Google Scholar] [CrossRef]
  27. Kaber, D.B.; Segall, N.; Green, R.S.; Entzian, K.; Junginger, S. Using Multiple Cognitive Task Analysis Methods for Supervisory Control Interface Design in High-Throughput Biological Screening Processes. Cogn. Technol. Work 2006, 8, 237–252. [Google Scholar] [CrossRef]
  28. Hong, T.C.; Andrew, H.S.Y.; Kenny, C.W.L. Assessing the Situation Awareness of Operators Using Maritime Augmented Reality System (MARS). Proc. Hum. Factors Ergon. Soc. 2015, 2015, 1722–1726. [Google Scholar] [CrossRef]
  29. Czauderna, T.; Haga, J.; Kim, J.; Klapperstück, M.; Klein, K.; Kuhlen, T.; Oeltze-Jafra, S.; Sommer, B.; Schreiber, F. Immersive Analytics Applications in Life and Health Sciences. In Immersive Analytics; Marriott, K., Schreiber, F., Dwyer, T., Klein, K., Riche, N.H., Itoh, T., Stuerzlinger, W., Thomas, B.H., Eds.; Springer International Publishing: Cham, Switzerland, 2018; pp. 289–330. ISBN 978-3-030-01388-2. [Google Scholar]
  30. Sermarini, J.; Michlowitz, R.A.; LaViola, J.J.; Walters, L.C.; Azevedo, R.; Kider, J.T., Jr. BIM Driven Retrofitting Design Evaluation of Building Facades. In Proceedings of the 2022 ACM Symposium on Spatial User Interaction, Online, 1–2 December 2022; pp. 1–10. [Google Scholar]
  31. Sangiorgio, V.; Martiradonna, S.; Fatiguso, F.; Lombillo, I. Augmented Reality Based—Decision Making (AR-DM) to Support Multi-Criteria Analysis in Constructions. Autom. Constr. 2021, 124, 103567. [Google Scholar] [CrossRef]
  32. Irizarry, J.; Gheisari, M. Situation Awareness (SA), a Qualitative User-Centered Information Needs Assessment Approach. Int. J. Constr. Manag. 2013, 13, 35–53. [Google Scholar] [CrossRef]
  33. Dennis, A.; Wixom, B.; Roth, R.M. Systems Analysis and Design, 5th ed.; Wiley Publishing: Hoboken, NJ, USA, 2012; ISBN 1118057627. [Google Scholar]
  34. Thomas, B.H.; Welch, G.F.; Dragicevic, P.; Elmqvist, N.; Irani, P.; Jansen, Y.; Schmalstieg, D.; Tabard, A.; ElSayed, N.A.M.; Smith, R.T.; et al. Situated Analytics. In Immersive Analytics; Marriott, K., Schreiber, F., Dwyer, T., Klein, K., Riche, N.H., Itoh, T., Stuerzlinger, W., Thomas, B.H., Eds.; Springer International Publishing: Cham, Switzerland, 2018; pp. 185–220. ISBN 978-3-030-01388-2. [Google Scholar]
  35. Büschel, W.; Chen, J.; Dachselt, R.; Drucker, S.; Dwyer, T.; Görg, C.; Isenberg, T.; Kerren, A.; North, C.; Stuerzlinger, W. Interaction for Immersive Analytics. In Immersive Analytics; Marriott, K., Schreiber, F., Dwyer, T., Klein, K., Riche, N.H., Itoh, T., Stuerzlinger, W., Thomas, B.H., Eds.; Springer International Publishing: Cham, Switzerland, 2018; pp. 95–138. ISBN 978-3-030-01388-2. [Google Scholar]
  36. Elmqvist, N.; Moere, A.V.; Jetter, H.C.; Cernea, D.; Reiterer, H.; Jankun-Kelly, T.J. Fluid Interaction for Information Visualization. Inf. Vis. 2011, 10, 327–340. [Google Scholar] [CrossRef]
  37. Marriott, K.; Chen, J.; Hlawatsch, M.; Itoh, T.; Nacenta, M.A.; Reina, G.; Stuerzlinger, W. Immersive Analytics: Time to Reconsider the Value of 3D for Information Visualisation. In Immersive Analytics; Marriott, K., Schreiber, F., Dwyer, T., Klein, K., Riche, N.H., Itoh, T., Stuerzlinger, W., Thomas, B.H., Eds.; Springer International Publishing: Cham, Switzerland, 2018; pp. 25–55. ISBN 978-3-030-01388-2. [Google Scholar]
  38. Ries, E. The Lean Startup: How Constant Innovation Creates Radically Successful Businesses, 14th ed.; Crown Publishing Group: New York, NY, USA, 2011; ISBN 978-0-307-88791-7. [Google Scholar]
  39. Núñez, D.; Ferrada, X.; Neyem, A.; Serpell, A.; Sepúlveda, M. A User-Centered Mobile Cloud Computing Platform for Improving Knowledge Management in Small-to-Medium Enterprises in the Chilean Construction Industry. Appl. Sci. 2018, 8, 516. [Google Scholar] [CrossRef]
  40. Inzunza, O.; Neyem, A.; Sanz, M.E.; Valdivia, I.; Villarroel, M.; Farfán, E.; Matte, A.; López-Juri, P. Anatomicis Network: Una Plataforma de Software Educativa Basada En La Nube Para Mejorar La Enseñanza de La Anatomía En La Educación Médica. Int. J. Morphol. 2017, 35, 1168–1177. [Google Scholar] [CrossRef]
  41. Endsley, M.R. Direct Measurement of Situation Awareness: Validity and Use of SAGAT. In Situation Awareness Analysis and Measurement; Endsley, M.R., Garland, D.J., Eds.; CRC Press: New York, NY, USA, 2000; pp. 147–174. ISBN 9781351548564. [Google Scholar]
  42. Hagl, M.; Friedrich, M.; Papenfuss, A.; Scherer-Negenborn, N.; Jakobi, J.; Rambau, T.; Schmidt, M. Augmented Reality in a Remote Tower Environment Based on VS/IR Fusion and Optical Tracking. In Engineering Psychology and Cognitive Ergonomics; Harris, D., Ed.; Springer International Publishing: Cham, Switzerland, 2018; pp. 558–571. ISBN 978-3-319-91122-9. [Google Scholar]
  43. Hasanzadeh, S.; Esmaeili, B.; Dodd, M.D. Examining the Relationship between Construction Workers’ Visual Attention and Situation Awareness under Fall and Tripping Hazard Conditions: Using Mobile Eye Tracking. J. Constr. Eng. Manag. 2018, 144, 04018060. [Google Scholar] [CrossRef]
  44. Endsley, M.R. Measurement of Situation Awareness in Dynamic Systems. Hum. Factors 1995, 37, 65–84. [Google Scholar] [CrossRef]
  45. Heer, J.; Shneiderman, B. Interactive Dynamics for Visual Analysis. Commun. ACM 2012, 55, 45–54. [Google Scholar] [CrossRef]
  46. Apple Developer Augmented Reality Design. Available online: https://developer.apple.com/design/human-interface-guidelines/technologies/augmented-reality/ (accessed on 24 August 2022).
  47. Microsoft Learn Mixed Reality—Design. Available online: https://learn.microsoft.com/en-us/windows/mixed-reality/design/app-patterns-landingpage (accessed on 8 September 2022).
  48. Soegaard, M. The Basics of User Experience Design; Interaction Design Foundation: Aarhus, Denmark, 2018. [Google Scholar]
  49. Lovreglio, R.; Gonzalez, V.; Feng, Z.; Amor, R.; Spearpoint, M.; Thomas, J.; Trotter, M.; Sacks, R. Prototyping Virtual Reality Serious Games for Building Earthquake Preparedness: The Auckland City Hospital Case Study. Adv. Eng. Inform. 2018, 38, 670–682. [Google Scholar] [CrossRef]
  50. Newman, S. Building Microservices, 1st ed.; O’Reilly Media, Inc.: Sebastopol, CA, USA, 2015; ISBN 1491950358. [Google Scholar]
  51. Endsley, M.R.; Mogford, R.; Allendoerfer, K.; Snyder, M.; Stein, E. Effect of Free Flight Conditions on Controller Performance, Workload, and Situation Awareness; FAA William J. Hughes Technical Center: Atlantic City, NJ, USA, 1997. [Google Scholar]
  52. Hogan, M.P.; Pace, D.E.; Hapgood, J.; Boone, D.C. Use of Human Patient Simulation and the Situation Awareness Global Assessment Technique in Practical Trauma Skills Assessment. J. Trauma Inj. Infect. Crit. Care 2006, 61, 1047–1052. [Google Scholar] [CrossRef]
  53. Lee Chang, A.; Dym, A.A.; Venegas-Borsellino, C.; Bangar, M.; Kazzi, M.; Lisenenkov, D.; Qadir, N.; Keene, A.; Eisen, L.A. Comparison between Simulation-Based Training and Lecture-Based Education in Teaching Situation Awareness. A Randomized Controlled Study. Ann. Am. Thorac. Soc. 2017, 14, 529–535. [Google Scholar] [CrossRef]
  54. Vasileiou, K.; Barnett, J.; Thorpe, S.; Young, T. Characterising and Justifying Sample Size Sufficiency in Interview-Based Studies: Systematic Analysis of Qualitative Health Research over a 15-Year Period. BMC Med. Res. Methodol. 2018, 18, 148. [Google Scholar] [CrossRef]
  55. Dokter, G. Exploratory Research and Its Impact on Problem Identification. J. Res. Dev. 2023, 11, 219. [Google Scholar] [CrossRef]
  56. Kuder, G.F.; Richardson, M.W. The Theory of the Estimation of Test Reliability. Psychometrika 1937, 2, 151–160. [Google Scholar] [CrossRef]
  57. Liu, C.; González, V.A.; Lee, G.; Cabrera-Guerrero, G.; Zou, Y.; Davies, R. Integrating the Last Planner System and Immersive Virtual Reality: Exploring the Social Mechanisms Produced by Using LPS in Projects. J. Constr. Eng. Manag. 2024, 150, 1–18. [Google Scholar] [CrossRef]
  58. Brade, J.; Lorenz, M.; Busch, M.; Hammer, N.; Tscheligi, M.; Klimant, P. Being There Again—Presence in Real and Virtual Environments and Its Relation to Usability and User Experience Using a Mobile Navigation Task. Int. J. Hum. Comput. Stud. 2017, 101, 76–87. [Google Scholar] [CrossRef]
  59. Kim, H.-Y. Statistical Notes for Clinical Researchers: Sample Size Calculation 2. Comparison of Two Independent Proportions. Restor. Dent. Endod. 2016, 41, 154. [Google Scholar] [CrossRef]
  60. Nasser-Dine, A. A Systematic Method to Perform Goal Directed Task Analysis with Application to Enterprise Architecture. Ph.D. Thesis, Université du Québec, Québec, QC, Canada, 2021. [Google Scholar]
  61. Wang, J.; Yang, J.; Fu, Q.; Zhang, J.; Zhang, J. A New Dynamic Spatial Information Design Framework for AR-HUD to Evoke Drivers’ Instinctive Responses and Improve Accident Prevention. Int. J. Hum. Comput. Stud. 2024, 183, 103194. [Google Scholar] [CrossRef]
  62. Lee, B.; Sedlmair, M.; Schmalstieg, D. Design Patterns for Situated Visualization in Augmented Reality. IEEE Trans. Vis. Comput. Graph. 2023, 30, 1324–1335. [Google Scholar] [CrossRef]
  63. Kotian, A.L.; Nandipi, R.; Ushag, M.; Varshauk; Veena, G.T. A Systematic Review on Human and Computer Interaction. In Proceedings of the 2024 2nd International Conference on Intelligent Data Communication Technologies and Internet of Things (IDCIoT), Bengaluru, India, 4–6 January 2024; pp. 1214–1218. [Google Scholar]
Figure 1. Research process and methods.
Applsci 15 07820 g001
Figure 2. Defining the SA-enabling AR/MR interface design parameters.
Applsci 15 07820 g002
Figure 3. Interface design matrix structure.
Applsci 15 07820 g003
Figure 4. Proposed method for designing effective SA-enabling AR/MR interfaces.
Applsci 15 07820 g004
Figure 5. Architecture of the proposed decision support solution.
Applsci 15 07820 g005
Figure 6. Screenshots of the developed interfaces: (a) AR; and (b) MR.
Applsci 15 07820 g006
Figure 7. Details on the trial conducted per participant.
Applsci 15 07820 g007
Figure 8. Details on the SAGAT experimental procedure.
Applsci 15 07820 g008
Figure 9. Percentage of SA achieved in each SA requirement’s query per prototype.
Applsci 15 07820 g009
Table 1. SA-enabling AR/MR interface design parameters.
CategoryParameterDetail
ContentDescriptionThis explains the information requirement to be presented in the AR/MR interface, providing designers/developers with a clear idea of it. Additionally, it specifies the level of the SA (1-perception, 2-comprehension, and 3-projection) of the information requirement.
TypeThis denotes the nature of the information requirement according to the data and/or the context in which it is addressed. The information requirement may be explicit (e.g., text, numeric, date, or file, such as attachments or multimedia) or implicit (e.g., mental constructs).
PresentationSpatial
association
This specifies which element(s) in the immersive environment should be associated/linked with the information requirement.
VisualizationThis specifies how to display the information according to its level of SA, type, and context in terms of colors, visibility scope, and position, among other features.
InteractionAR interactionThis specifies the interaction: devices, modes, tasks, and flow for interacting with the information requirements within the AR environment.
MR interactionThis specifies the interaction: devices, modes, tasks, and flow for interacting with the information requirements within the MR environment.
Table 2. Goal, decisions, and SA requirements used in the method application.
Goal1.1.1 Verify Constraint Removal on the Weekly/Immediate Work Plan
Decisions
-
Is everything necessary for task execution present?
-
Are there any unresolved constraints in the weekly/immediate work plan?
-
Will the unresolved constraints be removed in time to meet the plan?
SA requirements
  • Current status of the constraints of the weekly/immediate work plan
    • Planned tasks
    • Constraints removed
    • Constraints not removed
  • Probability of removing constraints in time
    • Constraints not removed
    • Estimated removal date
    • Type/nature of the constraint
    • Observations/status of the constraint removal
    • Reliability in the responsible of the constraint
      • Name of the responsible individual
Note: data from Pillajo et al. [24].
Table 3. System’s operational requirements.
Type of RequirementOperational Requirements
Cognitive requirements
  • The system shall present information to allow the user to easily reach high levels of SA (i.e., level 2 SA—comprehension and level 3 SA—projection).
Physical environment
  • The system shall be used on the construction site without reducing user’s awareness of their surroundings.
  • The system can emphasize visualization over other senses.
Technical environment
  • The system can work sufficiently with lower-level interaction tasks.
System integration
  • The system shall be able to retrieve data from different sources, including Excel spreadsheets, PDF files, and Word documents.
  • The system shall support building information modeling (BIM) models.
  • The system shall require the user to employ BIM models with sufficient granularity to associate required information with specific building elements.
  • The system shall be able to maintain information updated.
Portability
  • The system can run on handset or headset devices on the construction site.
Maintainability
  • The system shall support scalability for goals, information, and data sources.
Table 4. SA and IA design guidelines employed in the method application.
Theoretical FrameworkAreaDesign Guidelines
Situation awareness (SA) [15]Core principles1Organize information around goals
2Present level 2 information directly (support comprehension)
3Provide assistance for level 3 SA projections
4Support trade-offs between goal-driven and data-driven processing: top-down and bottom-up processing
5Make critical cues for schema activation salient
6Use information filtering carefully
To address
uncertainty
7Explicitly identify missing information
8Support sensor reliability assessment
To taming
complexity
9Just say no to feature creep-buck the trend
10Manage rampant featurism through prioritization and flexibility
11Insure logical consistency across modes and features
12Minimize logic branches
13Map system functions to the goals and mental models of users
14Group information based on level 2/3 SA requirements and goals
15Reduce display density, but do not sacrifice coherence
16Provide consistency and standardization on controls across different displays and systems
17Minimize task complexity
To design
automated
systems
18Automate only if necessary
19Use automation for assistance in carrying out routine actions rather than higher level cognitive tasks
20Provide SA support rather than decisions
21Keep the operator in control and in the loop
22Make modes and system states salient
23Use methods of decision support that create human/system symbiosis
Immersive analytics (IA) [2] Situated
analytics [34]
24Consider the size and visibility of the referents and environments with which the system will be used
25Consider how easy is to distinguish, track, and connect physical referents with related data
26Ensure that visual augmentations do not distract user’s attention away from the environment
27Ensure the alignment between virtual presentations and physical referents
28Emphasize the use of real-time data
29Choose visual encodings that ensure the system informs but does not hinder the user’s actions
Embodied data exploration [35,36]30Use smooth animated transitions between states
31Provide immediate visual feedback during interaction
32Minimize indirection in the interface (use direct manipulation)
33Integrate user interface (UI) components into the visual representation (integrate 2D UIs in 3D environments)
34Reward interaction
35Ensure that interaction never “ends”
36Reinforce a clear conceptual model (keep a clear idea of the system’s state)
37Use interaction modes that minimize strain or fatigue on the user
38Harness physical navigation for precise inspection or general overview within the immersive environment
Spatial
immersion [37]
39Choose between 2D and/or 3D representations according to the task to address
40Prefer 3D representations for depth-related tasks (including spatial understanding and spatial manipulation)
41Prefer 2D representations for precise manipulation or accurate data value measurement or comparison
42Prefer 2D billboard-style text display instead of 3D text attached directly on spatial objects
43Harness the unlimited 3D display space for arranging multiple views
Table 5. Excerpt of the SA-enabling design matrix for goal 1.1.1: verify the constraints removal on the weekly/immediate work plan.
SA
Information
Requirements
ContentPresentationInteraction
DescriptionTypeSpatial AssociationVisualizationARMR
Current status of the
constraints of the weekly/immediate work plan
Level 2 SA.
It represents the field manager’s mental picture of the situation regarding whether the tasks to perform have all their constraints removed or not, being most important those not removed as they need to be addressed.
Mental
construct
• The digital building model should be overlaid on the real-world environment to present and access the information.

• Planned tasks and their constraints can be associated/linked with virtual 3D building elements in the immersive environment.
• Only show the virtual 3D building elements that have tasks with constraints not removed.

• Color these elements according to the status of the constraint not removed (e.g., red if the constraint removal is “delayed” or orange when the constraint removal is “in progress”).

• If all the constraints were removed, present a colored message (e.g., in green) in the middle of the field view informing about it.
Interaction device: handset (smartphones).

Interaction mode: tactile gesture.

Interaction tasks (action-purpose):
• Tap for selecting.
• Body-based physical movement for navigating within the immersive environment.

Interaction flow:
• Once the button to address the current goal is selected, two scenarios can occur:
(1) If all the planned task constraints were removed, a colored message will appear in the center of the screen to inform the field manager about it.
(2) If there are tasks with constraints not removed, the immersive environment will present only the colored 3D building elements that have associated tasks with constraints not removed.

• The field manager can move the handset or walk, holding and gazing at the handset, to inspect and recognize the elements and tasks with constraints not removed that need to be addressed.
Interaction device: headset (Trimble XR10).

Interaction modes: multimodal interaction (i.e., eye/head gaze and hand gesture).

Interaction tasks (action-purpose):
• Head gaze and eye gaze for tracking.
• Air-tap, point and commit with hands, eye gaze and pinch for selecting.
• Body-based physical movement for navigating within the immersive environment.

Interaction flow:
• Once the button to address the current goal is selected, two scenarios can occur:
(1) If all the planned task constraints were removed, a colored message will appear in front of the field manager within the immersive environment to inform about it.
(2) If there are tasks with constraints not removed, the immersive environment will present only the colored 3D building elements that have associated tasks with constraints not removed.

• The field manager can move the head or walk within the environment to inspect and recognize the elements and tasks with constraints not removed that need to be addressed.
Planned tasksLevel 1 SA.
Planned tasks are activities that labor has to execute during an established time. Each task has information that varies according to the goal addressed. For goal 1.1.1, that information regards constraints.
Text• Tasks can be associated with the virtual elements they address (e.g., the task “installation of luminaires in sector A” can be associated with the virtual lamps in the immersive environment).• Tasks should denote the status of their constraints within the immersive environment, especially if they have constraints not removed. Use colors for this purpose.

• When the task has more than one type of constraint not removed (e.g., “in progress” and “delayed”), apply the most critical case (i.e., “delayed”).
Constraints
removed
Level 1 SA.
Constraints are the requisites for performing a task (e.g., labor, material, equipment, authorizations, information). Constraints removed stand for the requisites that are ready for task execution.
Text• Constraints can be associated with the virtual elements within the work area through their corresponding task.• If a task has its constraints removed, the associated 3D virtual elements will not appear within the immersive environment.

• If all the tasks have all their constraints removed, a colored message should appear in front of the field manager informing about it.
Constraints not
removed
Level 1 SA.
Constraints are the requisites for performing a task (e.g., labor, material, equipment, authorizations, information). Constraints not removed are the requisites that are not available yet for task execution.
Text• Constraints can be associated with the virtual elements within the work area through their corresponding task.• Constraints not removed can have two statuses: in progress and delayed, being more critical the latter.

• Use different colors to differentiate them (e.g., red for “delayed” and orange for “in progress”).
Table 6. Information on the study participants.
CategoryAttributeParticipants (n = 14) (%)
OccupationUndergraduate civil engineering student4 (28.6%)
Construction manager1 (7.1%)
Field manager1 (7.1%)
Field inspector1 (7.1%)
BIM manager1 (7.1%)
General manager1 (7.1%)
Real estate manager1 (7.1%)
Project engineer1 (7.1%)
Project manager2 (14.3%)
R&D coordinator1 (7.1%)
Work experienceNo experience 4 (28.6%)
5–15 years7 (50.0%)
Over 16 years3 (21.4%)
Table 7. Fisher’s exact test results—students versus practitioners.
QueryARMR
p-Valuep-Value
1. Constraint’s current status1.0000.714
2. Name of the planned task on review1.0001.000
3. Number of constraints removed0.6700.689
4. Number of constraints not removed0.6890.210
5. Name of the constraint not removed0.5460.280
6. Estimated removal date0.4060.720
7. Type/nature of the constraint0.6890.670
8. Comments on the constraint removal0.6890.594
9. Name of the individual responsible0.7200.406
10. Reliability in the responsible of the constraint0.4950.330
11. Probability of removing constraint in time0.6890.506
Note: statistically significant difference when p < 0.05.
Table 8. Percentage of correctness—students versus practitioners.
QueryARMR
StudentPractitionerStudentPractitioner
1. Constraint’s current status100%100%100%90%
2. Name of the planned task on review100%100%100%100%
3. Number of constraints removed75%80%75%70%
4. Number of constraints not removed75%70%100%60%
5. Name of the constraint not removed75%60%75%40%
6. Estimated removal date75%50%50%50%
7. Type/nature of the constraint75%70%75%80%
8. Comments on the constraint removal75%70%50%40%
9. Name of the individual responsible50%50%75%50%
10. Reliability in the responsible of the constraint100%80%100%70%
11. Probability of removing constraint in time75%70%75%90%
Table 9. Fisher’s exact test results—AR versus MR.
Queryp-Value
1. Constraint’s current status0.500
2. Name of the planned task on review1.000
3. Number of constraints removed0.500
4. Number of constraints not removed0.661
5. Name of the constraint not removed0.352
6. Estimated removal date0.500
7. Type/nature of the constraint0.500
8. Comments on the constraint removal0.126
9. Name of the individual responsible0.500
10. Reliability in the responsible of the constraint0.500
11. Probability of removing constraint in time0.324
Note: statistically significant difference when p < 0.05.
Disclaimer/Publisher’s Note: The statements, opinions and data contained in all publications are solely those of the individual author(s) and contributor(s) and not of MDPI and/or the editor(s). MDPI and/or the editor(s) disclaim responsibility for any injury to people or property resulting from any ideas, methods, instructions or products referred to in the content.

