Abstract
Urban tourism has experienced significant growth driven by platforms such as Airbnb, yet the relationship between short-term rental (STR) location and guest mobility remains underexplored. In this study, a structured survey of STR guests in Madrid during 2024 was administered face-to-face through property managers and luggage-storage services to examine factors influencing public transport (PT) use. Responses on bus and metro usage were combined into a three-level ordinal variable and modeled using ordered logistic regression against tourist demographics, trip characteristics, and accommodation attributes, including geocoded location zones. The results indicate that first-time and international visitors are less likely to use PT at high levels, while tourists visiting more points of interest and those who rated PT importance highly when choosing accommodation are significantly more frequent users. Accommodation in the central almond or periphery correlates positively with higher PT use compared to the city center. Distances to transit stops were not significant predictors, reflecting overall network accessibility. These findings suggest that enhancing PT connectivity in peripheral areas could support the spatial dispersion of tourism benefits and improve sustainable mobility for STR guests.
1. Introduction
Urban tourism [1] has undergone significant growth, driven in part by the rise in alternative accommodation models, particularly in European capitals. Among these, Airbnb (founded in 2008) has emerged as the dominant global platform, managing a substantial portfolio of short-term rental (STR) properties. Its success is largely attributed to the seamless digital interface it offers for host–guest interactions. As a result, empirical studies on the supply and demand dynamics of urban tourist accommodation frequently draw upon Airbnb data, often accessed via AirDNA. The growth of Airbnb listings worldwide in recent years is remarkable. In Madrid, there were 14,520 Airbnb listings in October 2018 [2], and this figure reached 25,288 listings in March 2025 [3], a growth of +74%. In this period, however, the hotel room supply experienced a +5% growth, from 44,229 to 46,474 rooms [4].
Specializing in STR market analytics for platforms such as Airbnb and Vrbo, AirDNA provides detailed insights and trend analyses for stakeholders, including property owners, investors, businesses, and policymakers involved in the holiday rental sector. Existing research based on this database has examined various aspects of the sharing-economy tourism model, including its competitive positioning against traditional hotels for specific tourist segments [5], its impact on hotel occupancy rates [6], sustainability issues [7], effects on housing prices [8], and second-home usage patterns [9]. However, some areas remain insufficiently explored, notably the relationship between the spatial distribution of STR properties and the mobility behaviors of their guests.
Although major European tourist capitals are supported by dense and efficient public transport networks, short-term rental (STR) accommodations remain predominantly concentrated in central urban areas, frequently within historic districts. This spatial clustering imposes pressure on local residents and has, in some instances, provoked civic opposition, phenomena commonly associated with ‘touristic gentrification’ and ‘touristification’ [10]. Moreover, the centralization of STRs consolidates economic gains among hosts and businesses located in these core areas. Thus, redistributing accommodation options to peripheral districts may facilitate a more equitable distribution of tourism-related income, thereby promoting greater social and spatial cohesion within a sustainable tourism framework.
Within this context, leveraging public transport to enhance the accessibility of peripheral STRs is vital for shaping regulatory strategies aimed at capping STR licenses in city centers. This decentralization of tourism could create employment in those peripheral areas while guests could re-spend their cost savings in local businesses, which is not an externality of conventional hotel tourism. In fact, an increase in the number of STRs in a census tract proved to increase the number of restaurants and tourist-related employees in that tract [11], which could be related to the idea of re-spending the cost savings on STR accommodation [12]. However, the decentralization should be aided by a sufficient and reliable public transport supply.
Initial investigations into the relationship between short-term rental (STR) properties and access to public transportation have primarily used Madrid as a case study. In 2024, Valenzuela et al. [13] applied a hedonic pricing model, estimated using ordinary least squares (OLS), to examine how both accommodation attributes and location factors influenced tourist housing prices during peak (October 2022) and off-peak (February 2023) seasons. Their findings suggest that proximity to public transportation stations significantly affects guests’ selection of STR properties, alongside intrinsic property characteristics, local environmental conditions, and overall lodging costs. Expanding upon this work, Gálvez-Pérez et al. [14] developed a methodology that correlates occupancy rates of tourist accommodations with the urban public transportation network. Using AirDNA data for Madrid’s STR market from 2022 to 2023, including variables such as the number of listings, nightly rates, occupancy rates, and accommodation types, they applied linear regression models separately for central and peripheral STR areas. Their results show that, while average daily rate and guest ratings are the predominant determinants of occupancy overall, distance to the nearest bus stop is a statistically significant factor for peripheral properties. This underscores the crucial role of public transportation in decentralizing tourist accommodation patterns and promoting sustainability in urban tourism.
1.1. Analysis of the Mobility of Tourists
Research on the mobility patterns of short-term rental (STR) tourists remains largely unexplored. Although previous studies have examined tourist mobility in general, such as hotel guests or day-trippers, these analyses tend to focus on the mode of transport used to access the destination rather than transport modes used within the destination itself [15]. However, the choice of transport mode for reaching a destination has been shown to influence intra-destination mobility decisions [15]. Studies investigating tourists’ use of public transport at the destination often rely on binary distinctions, comparing PT users with non-users, where non-users are typically defined as those who either did not use PT [16,17,18,19] or used private modes of transport [20]. This dichotomous categorization is problematic in large urban contexts, such as the one studied here, because it is highly unlikely that overnight tourists do not use PT at any point during their stay. Other studies have compared the most used mode of transport by tourists through multinomial logistic regressions [15]. Late research has used ordinal data to quantify the use of PT [21], and the ranking of the use of PT in comparison to other transport modes has also been used as the dependent variable [22]. In recent years, interest in sustainable transport has increased, with studies measuring the sustainability/green mobility of the transport used during vacations via binary variables [23], ordinal variables [24], and continuous variables [25].
1.2. Novelty of the Work
STR tourists may exhibit distinct mobility patterns compared to hotel tourists, given that STR accommodations are more widely distributed across the urban area, while hotels are typically concentrated in city centers. The main novelty of this study is that it focuses on STR guests only, which, to the extent of the knowledge of the authors, is the first time this has been accomplished in the literature. Furthermore, an innovative aspect of this research is the inclusion of accommodation location within the city as a factor affecting PT usage, an element often overlooked in existing studies due to the central clustering of conventional accommodations such as hotels. Apart from that, other innovative variables such as the importance given to the location of public transport network points (bus stops and metro stations) when choosing the accommodation and the distance to the nearest bus stop and metro station from the accommodation were introduced in this study. Finally, unlike most previous studies, in this study, a more detailed approach regarding PT use was adopted by collecting data on PT usage through a five-point Likert scale rather than a binary variable. Table 1 highlights these novel aspects in the context of the reviewed literature.

Table 1.
Summary of reviewed literature on visitors’ use of public transportation.
1.3. Research Objective
The objective of this research is to analyze which factors influence the higher use of PT among STR guests, via a 2024 survey conducted in the city of Madrid (Spain), with particular emphasis on accommodation location (city center, central almond, or periphery). A database derived from this survey was used to model levels of public transport usage through an ordered logistic regression. These results serve both to validate and to extend previous findings based solely on AirDNA data.
1.4. Study Structure
The manuscript is organized as follows: Section 1 introduces the research context; Section 2 outlines the materials and methods (survey design, questionnaire structure, definition of independent and dependent variables, and modeling approach); Section 3 presents the results; and Section 4 includes the discussion and conclusions of this research.
2. Materials and Methods
2.1. Methodological Workflow
This study followed a five-step methodological workflow, summarized in Figure 1, combining structured data collection with statistical analysis to examine factors influencing public transport (PT) use among guests staying in short-term rentals in Madrid. The methodological approach consists of the following steps:
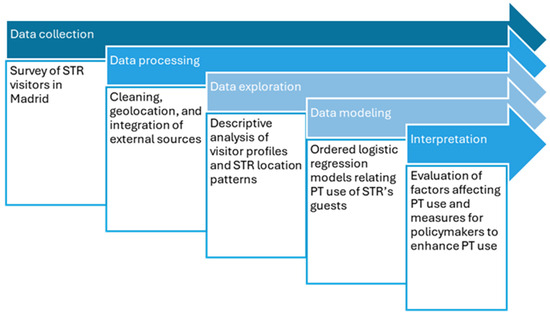
Figure 1.
Methodological workflow.
- Step 1: Data collection. A structured face-to-face survey was administered throughout 2024 to visitors staying in STRs. This step is further explained in Section 2.2.
- Step 2: Data processing. Survey responses were cleaned, standardized, and translated. A detailed geocoding process was applied to postal addresses, allowing the spatial assignment of each STR to one of three city zones (city center, central almond, or periphery). Independent and dependent variables were constructed based on survey responses, including transport usage, demographic profiles, and travel behavior. This step is covered in Section 2.3.
- Step 3: Data exploration. A descriptive analysis of the sample was conducted to identify initial relationships between PT usage and tourist or accommodation characteristics. This step is covered in Section 2.4.
- Step 4: Data modeling. An ordered logistic regression model was used to analyze the ordinal outcome variable representing levels of PT usage (low, medium, and high), as well as separate models for bus and metro usage. Predictor variables included visitor characteristics, travel behavior, and accommodation attributes. Spatial data, including distances to transport nodes, were integrated into the models. This step is further explained in Section 2.5.
This integrative workflow allows for a data-driven analysis of STR guest mobility and contributes to the literature by combining detailed survey data, the spatial location of accommodations, and transport accessibility metrics in a statistical modeling framework.
2.2. Survey
According to the first step of the explained workflow, a structured survey campaign was conducted to characterize the behavior of individuals staying in tourist accommodations in Madrid. To enable direct, face-to-face administration of the questionnaire, management companies overseeing short-term rental properties were engaged with. In contexts where in-person check-ins took place, these companies facilitated immediate guest contact, yielding a high response rate. In parallel, hourly luggage-storage services (“lockers”), commonly utilized by visitors residing in tourist homes, were identified as an additional distribution channel; certain locker operators provided on-site personnel who could approach and invite customers to participate. In total, three short-term rental property management firms (Minty Host S.L., Apolo Homes S.L., and The Key Host S.L.) and one locker service provider (Lock & Be Free S.L.) agreed to participate in the survey campaign.
A structured survey was conducted over an eight-month period, from January to April 2024 and from September 2024 to December 2024. The reference population for sample-size estimation comprised all tourists who stayed in Madrid’s tourist accommodations, an annual total of approximately two million visitors, according to 2019 AirDNA data. Sample-size calculations employed a conventional formula for proportion estimates, with the following parameters: event probability (p = 0.05), complement probability (q = 0.95), significance level (α = 0.05, yielding Z = 1.96 for a 95% confidence interval), and margin of error (d = 0.025). Although this calculation suggests that around 400 completed surveys would be sufficient for estimating proportions with the specified precision, a larger overall sample was targeted. This decision was made to ensure sufficient representation of tourists staying in peripheral areas of the city, who are known to represent a relatively small proportion of the total population. A larger sample improves the reliability of estimates for such subpopulations.
The survey instrument was developed in English and Spanish and comprised three sequential sections. The first section elicited respondents’ socioeconomic and stay-related characteristics, including age cohort, country of origin, party size, the inclusion of elderly or minor travelers, location of the accommodation, primary travel purpose, whether the visit constituted a first-time stay in the city, length of stay in nights, and the principal points of interest (POIs) visited. The second section examined urban accessibility and mobility behaviors by quantifying public transport usage across modes and soliciting overall service-quality ratings; it also asked respondents to rate the importance of proximity to airports, major rail stations, metro stations, and urban bus stops in their choice of accommodation. The final section assessed tourists’ expenditure patterns within short-term rental contexts, requesting an estimate of the total non-accommodation budget and the percentage allocation of these funds to food purchases, souvenir or gift acquisition, and dining at establishments in the immediate vicinity of the rental property.
2.3. Data Processing
The next step of the workflow was extensive data processing and cleaning procedures, which were applied to the survey dataset. First, all survey responses were translated into English, as the questionnaires were administered in both English and Spanish. A total of 712 surveys were processed as stated in the following paragraphs.
2.3.1. Dependent Variable
In this study, the dependent variable is the extent of public transportation use, assessed separately for buses and metros using a five-point Likert scale. Tourists were asked to indicate their frequency of use for each mode of transport, choosing from the following options: never, sometimes, several times, many times, and almost always. To minimize missing data and to capture the overall willingness to PT usage, irrespective of the relative accessibility of buses or metros in different areas of the city, the responses for the two modes were combined. Specifically, the highest reported level of use between bus and metro was taken to represent the overall public transport usage, following Table 2. This decision was also made by other research [21], following the same principle. For example, if a tourist group reported using the metro “many times” but the bus “never”, their public transport usage was categorized as “many times”.
Table 2.
Processing of the dependent variable.
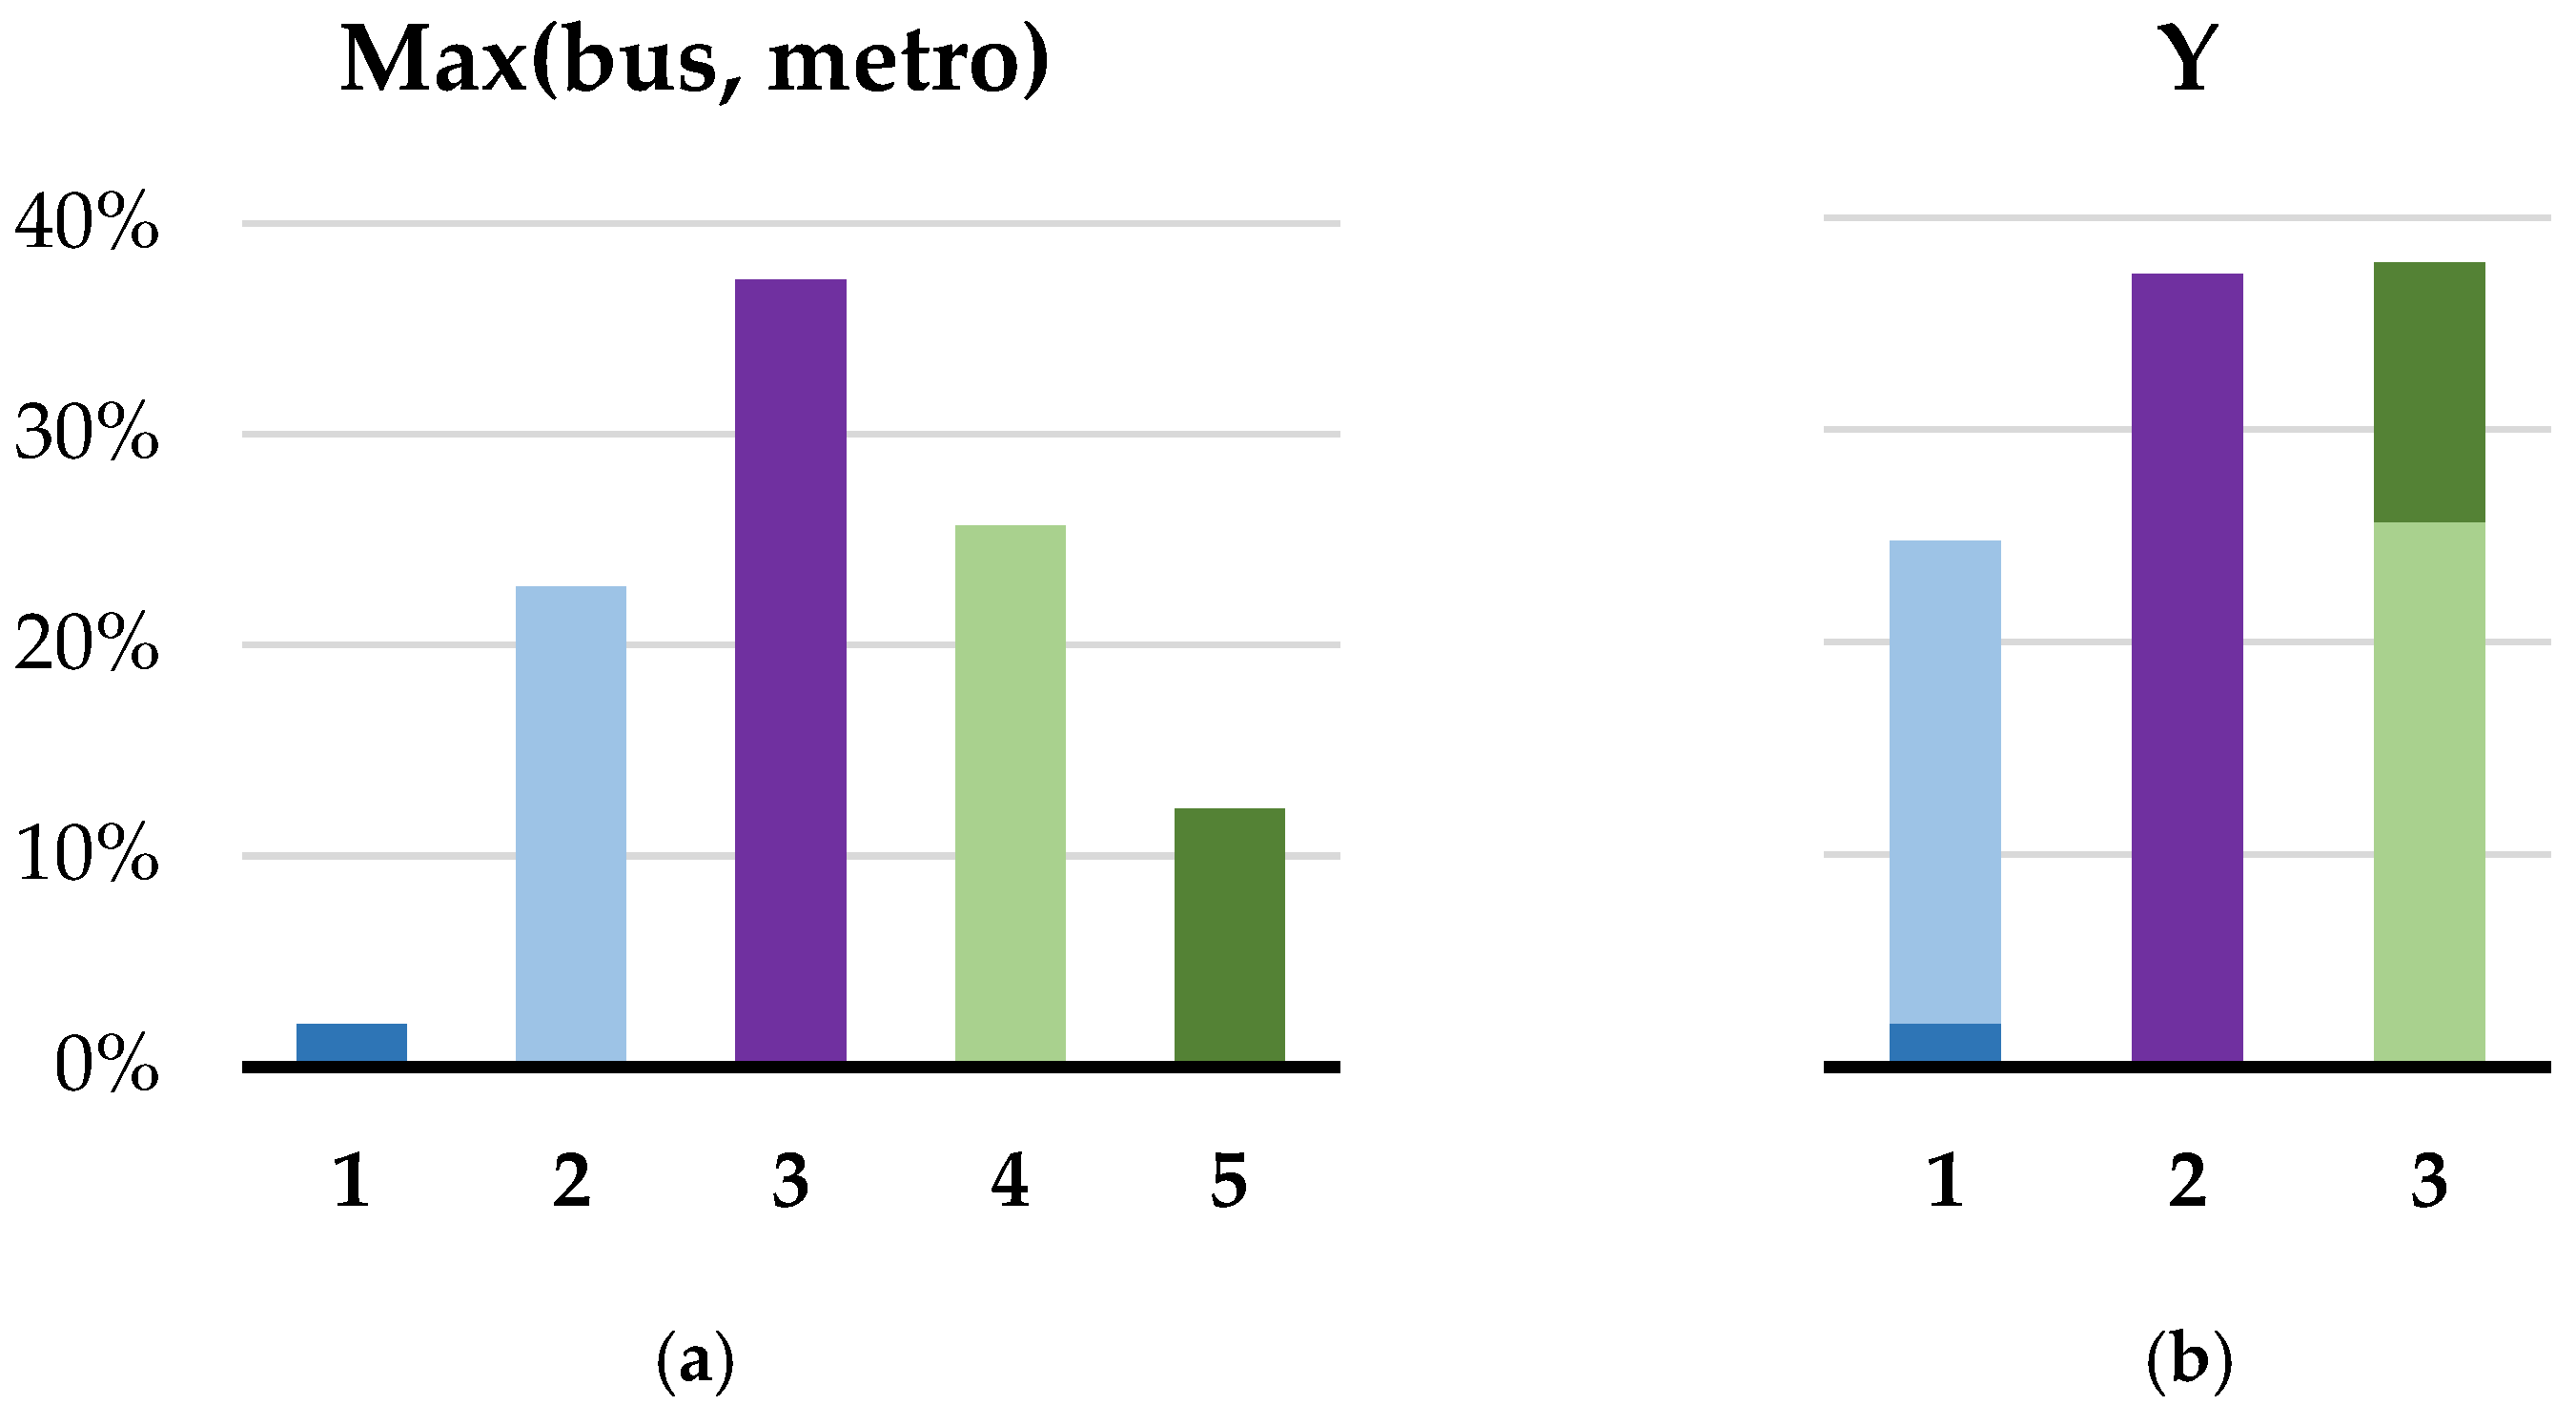
After this process, categories were recategorized into three categories because of the lack of use of some options [28], especially level 1, and to balance the number of surveys in each group. In addition, this approach helps us enhance the interpretability of results, as only three groups of PT usage will be studied, not five. This lack of use and the balance are illustrated in Figure 2. Hence, the 5-level Likert was converted to a 3-level scale following these rules:

Figure 2.
Distributions of (a) the maximum value of the bus and metro uses and (b) the dependent variable.
- Low use of public transport (1–2);
- Medium use of public transport (3);
- High use of public transport (4–5).
It should be noted that this dependent variable is ordinal, meaning that the categories have an order. In addition, the levels of use of both the bus and metro were also treated as dependent variables in the data modeling process to compare the influence of the independent variables on the use of both modes and the overall use of public transport.
2.3.2. Independent Variables
Regarding independent variables, the responses to multiple-choice questions were recategorized to reduce the number of response categories. For instance, the question “With whom else are you sharing the trip?” was recoded into three groups: (1) solo travelers, (2) couples, and (3) groups, including those who answered “with my family,” “with friends,” “with family and friends,” or “with colleagues from work/study”. Third, responses to open-ended questions were grouped into categories. For example, the responses to the question “Country of habitual residence” were classified into six geographic regions: Spain, Europe, America, Asia, Africa, and Oceania.
Regarding the location of the accommodation, tourists were asked to report both the general area (i.e., city center, central almond, or periphery) and the specific postal address of their accommodation. The postal address was deemed more valuable than the reported zone, as tourists are often unaware of the exact city zone in which they are staying, particularly when accommodations are located near the boundaries between zones. Consequently, when available, postal addresses were geocoded using Google Maps to obtain precise geographical coordinates. Geographic Information System (GIS) techniques were then employed to assign each coordinate pair to a corresponding city zone. Discrepancies were observed between the self-declared zone and the zone derived from the geocoded location, confirming that some tourists were unsure of the precise location of their accommodation. Therefore, only surveys with accurately geocoded coordinates were included in subsequent data exploration and modeling. Table 3 shows the complete list of variables included in this study. After removing samples with missing data, a total of 610 samples, or 85.7% of the total sample, were suitable for data modeling. Additionally, for the models on the use of bus and metro, 547 (76.8%) and 604 (84.8%) samples were suitable for data modeling, respectively.
Table 3.
Variables included in this study.
2.4. Tourist Profiles
Prior to modeling the level of use of public transportation by tourists, an exploratory analysis of the processed data was carried out. This analysis covers the values of the independent variables considering the overall sample and the values considering the different levels of the dependent variable (low use, mid use, and high use of public transport). Table 4 provides descriptive statistics for the variables included in the first model, which examines the overall use of public transport (metro and bus combined). The sample consists of 610 tourists, of whom 25.4% were classified as low users, 37.9% as medium users, and 36.7% as high users of public transport.
Table 4.
Descriptive statistics of tourists by level of public transport use.
A slight majority of tourists (56.2%) were return visitors to the city. Among them, 39.1% were high users of public transport, compared to 33.7% of first-time visitors, suggesting that prior familiarity with the city may encourage greater use of local transit. Regarding group type, most tourists traveled in a group (68.5%). Solo travelers, though a small segment (4.8%), had the highest proportion of high public transport users (44.8%), perhaps reflecting greater independence or reliance on transport when traveling alone.
Geographic origin also reveals differences in travel behavior. Tourists from America exhibited the highest share of high users (44.3%), followed by those from Spain (39.0%). In contrast, European visitors had a slightly lower rate of high use (31.0%). Most tourists arrived by plane (72.6%). Among these, 36.3% were high users of public transport. Interestingly, the highest proportion of high users (40.3%) was among those who arrived via land-based transport (e.g., train or bus), possibly indicating a general preference for public modes. Tourists who arrived by private vehicle had the lowest rate of high use (28.9%).
The length of stay averaged 3.94 nights, with high users staying longer on average (4.45 nights) than low or medium users. Likewise, tourists who visited more points of interest also tended to use public transport more: high users visited 7.05 POIs on average, compared to 5.75 among low users.
The importance assigned to public transport when choosing accommodation declared by tourists was strongly related to their usage level. Among those who considered it highly important, nearly half (45.5%) were high users, while those who considered it unimportant were mostly low users (46.7%).
The accommodation location also shows a spatial gradient. Tourists staying in the city center were less likely to be high users (32.6%) compared to those in the central almond (49.3%) or periphery (56.4%). The spatial distribution of the STRs of the tourists interviewed is shown in Figure 3. This suggests that tourists further from the urban core may depend more on public transport to reach attractions. The mean distance to the nearest bus stop was consistent across all groups, with no meaningful variation. However, distance to metro stations showed a slight positive gradient: high users were, on average, located farther from metro stations (202.78 m), perhaps indicating that those further away are more selective in choosing accommodations based on strategic access.
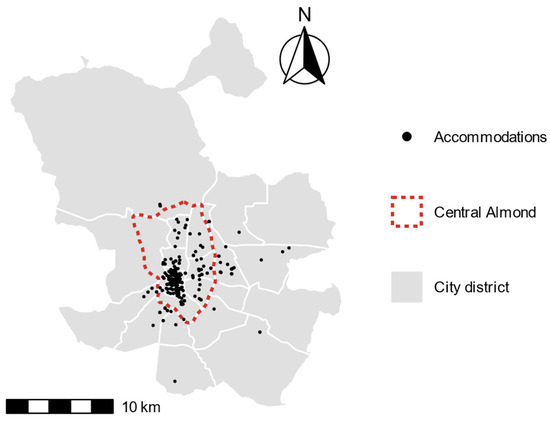
Figure 3.
Location of the accommodations (STRs) of the surveyed tourists.
2.5. Ordered Logistic Regression
When the outcome variable takes on an ordinal set of J categories {1,2, …, j}, ordered logistic regression (also known as the proportional-odds model) provides a way to model the cumulative probabilities of these ordered responses as a function of covariates . A common example is a Likert-scale survey item (e.g., “strongly disagree” to “strongly agree” on a 5-point scale), and this regression has been used previously, for instance, to model the perception of safety and comfort [29]. In such settings, treating the responses as nominal (multinomial) ignores the ordering, while treating them as continuous (linear regression) imposes arbitrary interval assumptions. The ordered logistic model links these cumulative probabilities to a linear predictor via the logit link (Equation (1)). The ordered logistic models were implemented using the ‘MASS’ package (Version 7.3-65) [30] in R (Version 4.4.0) [31].
Here, is the vector of the regression coefficients, common across all thresholds, is the vector of independent variables, and are the ordered intercepts (often called cut points or thresholds).
The ordered logistic model can also be expressed in the form of a latent-variable model, with being an unobserved dependent variable of the ith observation, following Equation (2).
Here, is the error term, which follows a standard logistic regression function. The categories of the response can be associated with the latent variable following Equation (3), which is applied to the 3-level response variable of this study:
In interpreting ordered logistic regression results, each estimated coefficient reflects the change in the underlying propensity toward higher versus lower response categories: a positive coefficient implies that increasing the corresponding predictor shifts the distribution of outcomes upward (i.e., toward higher-valued categories), while a negative coefficient shifts it downward. Because the model is formulated in terms of cumulative odds, exponentiating a coefficient yields an odds-ratio interpretation, a multiplicative change in the odds of being in a higher rather than a lower category for a one-unit increase in the predictor, holding all else constant. Importantly, under the proportional-odds assumption, this effect is assumed to be constant across all threshold splits of the response scale, allowing a single coefficient to summarize the influence of the predictor on the ordering of outcomes.
The interpretation of the marginal effects is also important because they translate these odds-ratio results into changes in predicted probabilities for each outcome category, which are often more directly interpretable. They quantify how a one-unit change in a predictor increases or decreases the probability of each specific category and can be reported at the mean of covariates or averaged over the sample. By showing how probability mass shifts among categories, marginal effects provide a more intuitive view of the substantive impact compared to odds ratios alone.
3. Results
This section presents the interpretation of the results of the data modeling process. First, we interpret the coefficients of three ordered logistic regression models, each corresponding to a different dependent variable: (1) the overall use of public transport (metro and bus combined), (2) the use of the bus, and (3) the use of the metro. These models help identify which tourist and accommodation characteristics are associated with different levels of public transport use. Following this, we provide a detailed interpretation of the marginal effects derived from the first model, which estimates the probability of low, medium, or high public transport use. The interpretation focuses on the direction, magnitude, and statistical significance of the effects, with significance assessed at the 10% level.
3.1. Ordered Logistic Regression Parameters
Table 5 presents the results of three ordered logistic regression models explaining the level of public transport use among tourists, focusing on three dependent variables: (1) the overall use of public transport (metro and bus combined), (2) the use of the bus, and (3) the use of the metro. Below, we discuss the statistically significant results at the 10% level.
Table 5.
Results of the ordered logistic regression.
Tourists visiting the city for the first time are significantly less likely to be frequent users of public transport in all three models. The negative association is strongest for bus use (β = −0.6951, p < 0.00) and remains significant for metro use (β = −0.4607, p = 0.01) and overall public transport use (β = −0.3939, p = 0.02).
Tourists from Europe and the rest of the world exhibit significantly lower metro use compared to Spanish tourists (Europe: β = −0.8799, p < 0.00; rest: β = −1.0634, p = 0.01). In the overall model, both groups are also less likely to use public transport in general (Europe: β = −0.7256, p = 0.01; rest: β = −0.9805, p = 0.02). Notably, visitors from outside Europe also show a marginally significant negative association with bus use (p = 0.099). This pattern may reflect differences in familiarity, expectations, or local transport literacy by region of origin. Access mode to the city shows a limited role overall, and only metro use is significantly lower among those arriving by land-based public transport (β = −0.4558, p = 0.08). The use of private cars is associated with lower use in all models, but the effects fall short of conventional significance thresholds.
The number of touristic points of interest (POIs) visited is positively and significantly associated with all three outcomes. The coefficients are relatively consistent (overall: β = 0.1650; bus: β = 0.2260; metro: β = 0.1923; all p < 0.001), indicating that more active tourists tend to use public transport more frequently, regardless of mode.
The importance of public transport in accommodation choice is one of the strongest predictors in all models. Compared to tourists who do not consider public transport important when choosing accommodation, those who rate it as medium or high importance are significantly more likely to report higher use. The effect is especially strong for metro use (high importance: β = 1.6109, p < 0.00) and remains robust in the overall and bus-specific models.
Tourists staying in the central almond or periphery of the city differ significantly from those in the city center. For metro use, both groups are more likely to use it (central almond: β = 0.7472, p < 0.00; periphery: β = 1.0207, p < 0.00), likely reflecting longer distances and less walkability. For the overall model, the same trend holds (central almond: β = 0.6440, p = 0.01; periphery: β = 1.1320, p < 0.00). Interestingly, for bus use, staying in the central almond is negatively associated with this factor (β = −0.6346, p = 0.04), suggesting that buses may be less relied upon in this area compared to the metro. Finally, the distances to the nearest bus or metro stops do not show significant effects in any model. This may reflect generally good public transport accessibility across accommodation areas in the city.
3.2. Ordered Logistic Regression Marginal Effects
Table 6 presents the marginal effects of the ordered logistic regression model estimating the probability of low, medium, and high levels of public transport use among tourists, extracted from Model 1 (Table 5). The reported marginal effects reflect the discrete change in the predicted probability of each outcome category when the independent variable changes, holding all other variables constant. Bolded values denote statistically significant effects at the 10% level.
Table 6.
Marginal effects of the ordered logistic regression. Significant marginal effects at the 10% level are marked in bold.
First-time visitors to the city are significantly more likely to be in the low-use (+7.0%, p = 0.02) and mid-use (+1.9%, p = 0.04) categories and less likely to be in the high-use category (−8.9%, p = 0.02). Regarding geographic origin, tourists from Europe and the rest of the world show a significantly higher probability of low public transport use (+13.2% and +20.9%, respectively) and a lower probability of high use (−16.1% and −18.6%, respectively) relative to tourists from Spain. For American tourists, only a weakly significant increase in the probability of medium use is observed (+1.5%, p = 0.06), suggesting regional disparities in public transport use among international tourists.
Arriving by private car is associated with a lower likelihood of high public transport use (−12.9%, p = 0.07), although the effect is only marginally significant. The number of POIs visited is strongly associated with greater public transport use. A 1% increase in the visited attraction decreases the probability of low use (−2.9%, p = 0.00) and medium use (−0.9%, p = 0.00) and increases the probability of high use (+3.8%, p = 0.00), indicating that more active tourists are also heavier users of public transport.
The importance given to public transport when choosing accommodation is a strong predictor. Tourists who rated this factor as high show a significantly lower likelihood of low use (−23.3%, p = 0.00) and a higher likelihood of high use (+28.3%, p = 0.00) compared to those who considered it unimportant. Similarly, those who considered it of medium importance are less likely to have low use of public transport (−15.9%, p = 0.00) and a higher likelihood of high use (+23.1%, p = 0.00). Notably, these marginal effects are higher in absolute value for those who reported high importance given to public transport when choosing accommodation than for those who reported medium importance.
Accommodation location also plays a significant role. Staying outside the city center increases the probability of high public transport use: tourists in the central almond or the periphery are, respectively, 15.4% (p = 0.02) and 27.4% (p = 0.00) more likely to be in the high-use category compared to those in the city center. Conversely, the likelihood of falling into the low-use group is 9.8% lower (p < 0.00) for individuals staying in the central almond and 15.1% lower (p < 0.00) for those staying in the periphery. Notably, the absolute values of these marginal effects are greater for tourists staying in the periphery.
4. Discussion and Conclusions
This study examined the level of public transport (PT) usage among short-term rental (STR) tourists using data obtained through surveys and analyzed via an ordered logistic regression model. The study presents a twofold contribution to the existing literature. First, previous research on PT usage has generally not focused on STR tourists, an increasingly significant segment of urban tourism that tends to disperse more widely across cities compared to conventional hotel-based tourists. Second, PT usage was measured on a three-level ordinal scale: low, medium, and high use. In contrast, most studies categorize PT use dichotomously as users versus non-users. However, in the context of a major urban destination such as Madrid, the complete non-use of PT is rare (roughly 2% of tourists in our sample reported not using PT). Therefore, a binary classification may obscure meaningful variation within the group of PT users and hinder the identification of factors that influence the intensity of PT use.
Furthermore, this study introduces an innovative methodological approach in the STR analysis by relying on primary survey data rather than secondary sources such as occupancy rates, listing characteristics, or proximity to transit stops. This allowed for the inclusion of motivational and perceptual variables, such as the importance of PT access when choosing accommodation. The use of an ordinal dependent variable reflects a gradient of PT usage and enables a more nuanced understanding of tourist behavior within the city. Together, these methodological choices not only strengthen the explanatory power of the model but also validate the innovation of the study relative to existing frameworks in the literature.
This research has shown that international tourists, defined as those visiting from outside of Spain, exhibited lower levels of PT usage compared to domestic tourists, who served as the baseline category in the analysis. This difference may be attributed to language or informational barriers that make navigating the city’s PT system more challenging for international visitors. These findings are consistent with the results reported by [19,24]. Additionally, tourists originating from countries with limited walkability may be more inclined to explore the city on foot, thereby reducing their reliance on PT.
First-time visitors were more likely to exhibit low or medium levels of PT usage and less likely to demonstrate high usage when compared to repeat visitors. In other words, repeaters tend to use PT more frequently than those visiting the city for the first time. This pattern may be explained by the greater familiarity of repeat visitors with the city’s PT network and ticketing system, both of which have been identified as potential barriers to PT use [32,33]. Furthermore, first-time visitors may prefer to experience the city in a more immersive and exploratory manner, opting to walk more extensively rather than relying on PT. Given Madrid’s high walkability, first-time tourists might be particularly inclined to explore the urban environment on foot beyond their planned visits. In contrast, repeat visitors may focus on specific destinations and choose more direct modes of travel. Similar results were found by Gutiérrez and Miravet [16].
The mode of transport used to access the city was also found to be a significant factor in explaining the level of PT usage. Tourists who arrived in Madrid by private vehicle were less likely to belong to the high-PT-usage group. Notably, this effect was not statistically significant for the low- and medium-PT-usage categories, suggesting that vehicle ownership does not entirely preclude PT use. This result is in line with those found by [23], who found that arriving in the city by private car leads to less sustainable transport modes once at the destination. This may be due to the location of major tourist attractions in the city center, where parking is both limited and expensive. Additionally, Madrid’s Low-Emission Zone (LEZ) restricts access to certain vehicles in the central area, further discouraging the use of private cars. Therefore, while tourists with private vehicles tend to use PT less, this effect is primarily observed among those in the high-usage category.
The duration of stay, measured by the number of nights, was not found to be statistically significant in the model. This result contrasts with the findings reported by [16,18,27], but is consistent with those of [17,19,25], who observed similar patterns in their studies. One possible explanation for this outcome is that the majority of tourist stays fall within the one to five-night range (87% of the sample), which may not be sufficient for visitors to shift their behavior toward increased PT use due to fatigue from walking. An increased number of visited points of interest (POIs) was associated with higher PT usage among tourists. This may be due to the fact that visiting multiple POIs can lead tourists to favor PT over walking once they feel they have sufficiently explored the city on foot. This variable emerged as a more meaningful indicator of tourist activity than the number of nights spent in Madrid.
A novel variable introduced in this study was the importance attributed to the PT network when selecting accommodation. Conventional tourists who stay in hotels may not prioritize PT access, as hotels are typically located in central areas with generally good connectivity. In contrast, assigning greater importance to the PT network was associated with higher levels of PT usage among tourists. This suggests that travelers who engage in more detailed trip planning are more likely to utilize PT during their stay.
Another novel aspect of this study is the inclusion of the accommodation zone as a predictor of public transport usage, which has been used in limited research [22,24]. Compared to tourists staying in the city center, those with accommodations in the central almond exhibited higher levels of PT use. Furthermore, tourists staying in the city’s periphery demonstrated even greater PT usage than those in the central almond. These results suggest that tourists located out of the city center, where most tourist attractions and restaurants are concentrated, tend to rely more heavily on PT to cover longer distances efficiently. This finding might be related to the fact that the negotiation strategies of those staying outside of the city center do not affect the use of PT, because of the limited transportation options [22], so moving with PT is a necessity for those staying far from the city center. This fact also implies that peripheral urban areas, which may experience growth in short-term rental accommodations in the coming years, should be well connected to both the city center and other key tourist zones. Enhancing connectivity in these peripheral areas, where accommodation is typically more affordable, could increase their attractiveness to tourists and stimulate greater spending in local businesses [11,12]. Although tourists’ satisfaction with public transport and mode choice is primarily influenced by service delivery and travel time, whereas residents’ satisfaction depends more on qualitative factors [34,35,36], enhancing bus service frequency and coverage would not only improve the experience for tourists but also strengthen intra-city connectivity, thereby increasing mobility for residents.
Based on the findings of this research, several policy measures can help enhance public transport use among tourists staying in short-term rentals, a key step toward promoting more decentralized urban tourism. These include incentivizing the use of public transport over private vehicles (e.g., free transport days and better information on parking restrictions), adjusting service frequency on weekends to reflect tourist demand, and improving usability for international visitors through multilingual digital cards, clear instructions, and app recommendations. Although discounts for STR guests might raise equity concerns with respect to residents, they can be a balanced strategy, as price incentives have proven effective in shifting travel behavior [21,37]. Although such measures may imply an initial public cost, STR tourism has been linked to increased local employment [11] and higher visitor spending through the reinvestment of accommodation savings [12], with benefits that tend to reach peripheral districts often overlooked by conventional tourism. Strengthening connections between major transport hubs and outlying tourist attractions could also improve access. Additionally, encouraging STR platforms to highlight public transport options during the booking process and bundling transit passes with discounts to attractions may increase uptake, especially among first-time and international visitors. Together, these strategies can make public transport a more attractive choice, redistribute tourist flows beyond city centers, contribute to more sustainable tourism by lowering carbon emissions [38], and enhance overall travel satisfaction through the greater use of collective transit [39].
The main limitation of this study deals with the form of spreading the surveys, which was accomplished through ‘lockers’ and STR managing companies, as well as guests who self-check-in via key boxes, book entirely online without on-site management, or do not use luggage services (e.g., light travelers or those staying in centrally managed apartments). Such under-coverage could bias our estimates if excluded guests differ systematically in mobility patterns (for example, younger or more tech-savvy tourists rely more on collective transport [26,40]). This can be overcome in future studies by employing direct online surveys or in-app survey invitations to include these guests. Another limitation is that the Euclidean distances from each accommodation to the nearest bus stop and metro stations were calculated. This method may introduce bias, as accommodations that are better connected (i.e., closer to public transport) may be more likely to attract guests, thereby skewing the sample. Further research can include distances or, even better, estimated times, from the accommodations to the main touristic points of interest.
Further research is required to comprehensively assess the role of public transport in decentralizing STR tourism in Madrid. The findings indicate that tourists staying in peripheral areas of the city rely on PT more frequently than those residing in the central districts, including the central almond. Conducting more detailed surveys to capture specific routes and modes of transport used by tourists during their stay could help identify additional factors influencing PT usage, such as proximity to major attractions. Moreover, comparing the occupancy rates and prices of STR units across different city zones in relation to the connectivity in terms of travel time and distance to the most frequently visited tourist sites via PT would shed light on this field. Finally, the use of other modes of transport, such as taxis or micromobility, which was gathered during the survey, will be analyzed to gain insight into STR guests’ urban mobility.
In conclusion, short-term rentals can offer benefits, particularly for peripheral areas, where tourists may contribute economically by spending part of their budget locally. These areas should be adequately served by public transport to ensure efficient connectivity with major tourist attractions, thereby offsetting the greater distance with the advantage of more affordable accommodation. Furthermore, the clarity and accessibility of public transport services should be enhanced to avoid posing a barrier to tourists, especially those from international backgrounds.
Author Contributions
Conceptualization, D.G.-P., B.G. and A.O.; methodology, D.G.-P.; software, D.G.-P.; validation, D.G.-P., B.G. and A.O.; formal analysis, D.G.-P.; investigation, D.G.-P.; resources, D.G.-P.; data curation, D.G.-P.; writing—original draft preparation, D.G.-P., B.G. and A.O.; writing—review and editing, B.G. and A.O.; visualization, D.G.-P.; supervision, B.G. and A.O.; project administration, B.G. and A.O.; funding acquisition, B.G. and A.O. All authors have read and agreed to the published version of the manuscript.
Funding
The publication is part of the project PID2021-124428OB-I00, funded by ‘MCIN/AEI/10.13039/501100011033/ERDF, EU’, where PID2021-124428OB-I00 is the reference that appears in the award resolution; MCIN is the acronym of the Ministry of Science and Innovation; AEI is the acronym of the State Research Agency; 10.13039/501100011033 is the DOI (Digital Object Identifier) of the Agency; and ERDF is the acronym of the European Regional Development Fund.
Institutional Review Board Statement
Ethical review and approval were waived for this study. Conclusion and Declaration of Exemption Because our study involved only 100% anonymous survey responses (no linkage to individuals, no collection of personal identifiers, and no handling of sensitive attributes), it was exempt from ethics-committee review under both Spanish national regulations (GDPR and LOPD-GDD) and UPM’s local guidelines.
Informed Consent Statement
Verbal informed consent was obtained from the participants. Verbal consent was obtained rather than written because the surveys were conducted face-to-face using a digital form, no personal data were collected, and handling paper records was avoided.
Data Availability Statement
The raw data supporting the conclusions of this article will be made available by the authors on request.
Conflicts of Interest
The authors declare no conflicts of interest.
Abbreviations
The following abbreviations are used in this manuscript:
| STR | Short-term rental |
| PT | Public transportation |
References
- Maitland, R. Everyday Life as a Creative Experience in Cities. Int. J. Cult. Tour. Hosp. Res. 2010, 4, 176–185. [Google Scholar] [CrossRef]
- Adamiak, C.; Szyda, B.; Dubownik, A.; García-Álvarez, D. Airbnb Offer in Spain—Spatial Analysis of the Pattern and Determinants of Its Distribution. ISPRS Int. J. Geoinf. 2019, 8, 155. [Google Scholar] [CrossRef]
- Inside Airbnb. Inside Airbnb Madrid. Available online: https://insideairbnb.com/madrid/ (accessed on 25 June 2025).
- INE Hotel Occupancy Survey. Available online: https://www.ine.es/dynt3/inebase/en/index.htm?padre=239 (accessed on 25 June 2025).
- Guttentag, D.; Smith, S.; Potwarka, L.; Havitz, M. Why Tourists Choose Airbnb: A Motivation-Based Segmentation Study. J. Travel Res. 2018, 57, 342–359. [Google Scholar] [CrossRef]
- Zervas, G.; Proserpio, D.; Byers, J.W. The Rise of the Sharing Economy: Estimating the Impact of Airbnb on the Hotel Industry. J. Mark. Res. 2017, 54, 687–705. [Google Scholar] [CrossRef]
- Midgett, C.; Bendickson, J.S.; Muldoon, J.; Solomon, S.J. The Sharing Economy and Sustainability: A Case for AirBnB. Small Bus. Inst. 2017, 13, 51–71. [Google Scholar]
- Sheppard, S.; Udell, A. Do Airbnb Properties Affect House Prices. Williams Coll. Dep. Econ. Work. Pap. 2016, 3, 43. [Google Scholar]
- Valenzuela-Martin, P.; Mendoza de Miguel, S.; Villar-Navascués, R.; Gálvez-Pérez, D.; Guirao Abad, B.; Bañón, L. Explanatory Factors for the Distribution of Short-Term Rentals in Coastal Destinations: The Impact of Second Homes in Alicante. J. Policy Res. Tour. Leis. Events 2025, 1–19. [Google Scholar] [CrossRef]
- Colomb, C.; Novy, J. Protest and Resistance in the Tourist City; Routledge: London, UK, 2016. [Google Scholar]
- Hidalgo, A.; Riccaboni, M.; Velázquez, F.J. The Effect of Short-term Rentals on Local Consumption Amenities: Evidence from Madrid. J. Reg. Sci. 2024, 64, 621–648. [Google Scholar] [CrossRef]
- Kim, M.; Darban, M.; Lim, S. The Impact of Airbnb’s Competitive Pricing on Traveler Spending at Destinations. Int. J. Hosp. Manag. 2025, 124, 103994. [Google Scholar] [CrossRef]
- Valenzuela, P.; Ortuño, A.; Flor, M.; Guirao, B. Analysis of the Location Factors Affecting the Price of Tourist Houses: The Role of Accessibility to Public Transport Stations in Madrid. Sustainability 2024, 16, 4768. [Google Scholar] [CrossRef]
- Gálvez-Pérez, D.; Guirao, B.; Valenzuela, P.; Ortuño, A.; Mohíno, I.; De Mingo, F.; De La Calle, M. Public Transport as an Opportunity to Promote Tourist Homes in Urban Peripheries: The Case of Madrid; Wessex Institute: Sevilla, Spain, 2024; pp. 77–89. [Google Scholar]
- Domènech, A.; Miravet, D.; Gutiérrez, A. Tourists’ Transport Modal Choices in Barcelona. Res. Transp. Bus. Manag. 2023, 48, 100902. [Google Scholar] [CrossRef]
- Gutiérrez, A.; Miravet, D. The Determinants of Tourist Use of Public Transport at the Destination. Sustainability 2016, 8, 908. [Google Scholar] [CrossRef]
- Gross, S.; Grimm, B. Sustainable Mode of Transport Choices at the Destination-Public Transport at German Destinations. Tour. Rev. 2018, 73, 401–420. [Google Scholar] [CrossRef]
- Le-Klähn, D.-T.; Gerike, R.; Michael Hall, C. Visitor Users vs. Non-Users of Public Transport: The Case of Munich, Germany. J. Destin. Mark. Manag. 2014, 3, 152–161. [Google Scholar] [CrossRef]
- Masiero, L.; Zoltan, J. Tourists Intra-Destination Visits and Transport Mode: A Bivariate Probit Model. Ann. Tour. Res. 2013, 43, 529–546. [Google Scholar] [CrossRef]
- Le-Klähn, D.-T.; Roosen, J.; Gerike, R.; Hall, C.M. Factors Affecting Tourists’ Public Transport Use and Areas Visited at Destinations. Tour. Geogr. 2015, 17, 738–757. [Google Scholar] [CrossRef]
- Bausch, T.; Peluso, A.M.; Bursa, B.; Mailer, M.; Amegah, M.L. Determinants Encouraging Tourists to Use Public Transport in Their Vacation Destination. Int. J. Tour. Res. 2024, 26, e2791. [Google Scholar] [CrossRef]
- Zientara, P.; Jażdżewska-Gutta, M.; Bąk, M.; Zamojska, A. Examining the Use of Public Transportation by Tourists in Ten European Capitals Through the Lens of Hierarchical Leisure Constraints Theory. J. Travel Res. 2025, 64, 888–911. [Google Scholar] [CrossRef]
- Zamparini, L.; Domènech, A.; Miravet, D.; Gutiérrez, A. Green Mobility at Home, Green Mobility at Tourism Destinations: A Cross-Country Study of Transport Modal Choices of Educated Young Adults. J. Transp. Geogr. 2022, 103, 103412. [Google Scholar] [CrossRef]
- Zientara, P.; Jażdżewska-Gutta, M.; Bąk, M.; Zamojska, A. What Drives Tourists’ Sustainable Mobility at City Destinations? Insights from Ten European Capital Cities. J. Destin. Mark. Manag. 2024, 33, 100931. [Google Scholar] [CrossRef]
- Maltese, I.; Zamparini, L. Sustainable Mobility Choices at Home and within Destinations: A Survey of Young Italian Tourists. Res. Transp. Bus. Manag. 2023, 48, 100906. [Google Scholar] [CrossRef]
- Bieland, D.; Sommer, C.; Witte, C. Uncommon Leisure Traffic-Analyses of Travel Behaviour of Visitors. Transp. Res. Procedia 2017, 25, 3971–3984. [Google Scholar] [CrossRef]
- Miravet, D.; Domènech, A.; Gutiérrez, A. What Prompts Tourists to Become Public Transportation Users at Their Destination? The Case of a Mediterranean City. Travel Behav. Soc. 2021, 24, 10–21. [Google Scholar] [CrossRef]
- Van Dusen, B.; Nissen, J.M. Criteria for Collapsing Rating Scale Responses: A Case Study of the CLASS. In Proceedings of the 2019 Physics Education Research Conference Proceedings, Provo, UT, USA, 24–25 July 2019; American Association of Physics Teachers, 2020. Available online: https://lassoeducation.org/wp-content/uploads/2024/12/Using2019.3.pdf (accessed on 3 June 2025).
- Akgün-Tanbay, N.; Campisi, T.; Tanbay, T.; Tesoriere, G.; Dissanayake, D. Modelling Road User Perceptions towards Safety, Comfort, and Chaos at Shared Space: The via Maqueda Case Study, Italy. J. Adv. Transp. 2022, 2022, 1–13. [Google Scholar] [CrossRef]
- Venables, W.N.; Ripley, B.D. Modern Applied Statistics with S.; Springer New York: New York, NY, USA, 2002; ISBN 978-1-4419-3008-8. [Google Scholar]
- R Core Team. R: A Language and Environment for Statistical Computing; R Foundation for Statistical Computing: Viena, Austria, 2013; Version 4.4.0. [Google Scholar]
- Edwards, D.; Griffin, T. Understanding Tourists’ Spatial Behaviour: GPS Tracking as an Aid to Sustainable Destination Management. J. Sustain. Tour. 2013, 21, 580–595. [Google Scholar] [CrossRef]
- Le-Klähn, D.-T.; Hall, C.M. Tourist Use of Public Transport at Destinations-a Review. Curr. Issues Tour. 2015, 18, 785–803. [Google Scholar] [CrossRef]
- Antoniou, C.; Tyrinopoulos, Y. Factors Affecting Public Transport Use in Touristic Areas. Int. J. Transp. 2013, 1, 91–112. [Google Scholar] [CrossRef]
- Bursa, B.; Mailer, M.; Axhausen, K.W. Travel Behavior on Vacation: Transport Mode Choice of Tourists at Destinations. Transp. Res. Part A Policy Pract. 2022, 166, 234–261. [Google Scholar] [CrossRef]
- Kinsella, J.; Caulfield, B. An Examination of the Quality and Ease of Use of Public Transport in Dublin from a Newcomer’s Perspective. J. Public Trans. 2011, 14, 69–81. [Google Scholar] [CrossRef]
- Blättler, K.; Wallimann, H.; von Arx, W. Free Public Transport to the Destination: A Causal Analysis of Tourists’ Travel Mode Choice. Transp. Res. Part A Policy Pract. 2024, 187, 104166. [Google Scholar] [CrossRef]
- Bi, H.; Zhang, S.; Lu, F. Analysis of Decoupling Effects and Influence Factors in Transportation: Evidence from Guangdong Province, China. ISPRS Int. J. Geoinf. 2024, 13, 404. [Google Scholar] [CrossRef]
- Romão, J.; Bi, Y. Determinants of Collective Transport Mode Choice and Its Impacts on Trip Satisfaction in Urban Tourism. J. Transp. Geogr. 2021, 94, 103094. [Google Scholar] [CrossRef]
- Bi, Y.; Romão, J. Soft Is Better: Determinants of Preferences for Non-Motorized Forms of Transportation in Urban Tourism Destinations. Sustainability 2021, 13, 11944. [Google Scholar] [CrossRef]


Disclaimer/Publisher’s Note: The statements, opinions and data contained in all publications are solely those of the individual author(s) and contributor(s) and not of MDPI and/or the editor(s). MDPI and/or the editor(s) disclaim responsibility for any injury to people or property resulting from any ideas, methods, instructions or products referred to in the content. |
© 2025 by the authors. Licensee MDPI, Basel, Switzerland. This article is an open access article distributed under the terms and conditions of the Creative Commons Attribution (CC BY) license (https://creativecommons.org/licenses/by/4.0/).