Abstract
This study aimed to examine the relationship between the eccentric utilization ratio (EUR) and sprint, change of direction (COD), change of direction deficit (CODD%), and vertical jump performance, including countermovement jump (CMJ) and squat jump (SJ). A total of 32 elite athletes (16 women and 16 men) participated. Performance was evaluated using force platforms and photocell timing systems during CMJ, SJ, 30 m sprint, and Pro-Agility tests. Pearson correlation and simple linear regression analyses were used to assess the relationships between EUR and performance variables. The results revealed that EUR was significantly associated with CMJ height (r = 0.587, p = 0.017) and 0–10 m sprint performance (r = 0.516, p = 0.041) in female athletes, whereas no significant relationships were found in males (r < 0.20, p > 0.05) for all performance variables. In contrast, strength–power metrics such as eccentric peak power (ECCPP), eccentric mean power (ECCMP), concentric mean power (CONMP), and peak power (PP) showed stronger associations with all performance variables, including COD, sprint segments, and jump tests. In conclusion, although EUR demonstrated limited predictive value particularly in male athletes directly measured strength–power variables appear to be more reliable indicators of athletic performance. These findings highlight the importance of prioritizing eccentric and concentric power outputs in performance assessment and individualized training strategies.
1. Introduction
Athletic performance largely depends on the effective execution of fundamental motor skills such as speed, agility, and jumping ability. These qualities are key determinants of success in various sports, including football, basketball, handball, and rugby [1]. The effective utilization of the stretch-shortening cycle (SSC) is considered a critical determinant of performance in many sports disciplines [1,2]. The concentric contraction that follows an eccentric action forms the foundation of the SSC and, when used optimally, contributes to the development of muscular strength and power [1,3,4]. As the SSC plays a central role in essential motor skills such as running and jumping, it holds particular significance for athletic performance across various sports [5,6]. The contribution of the SSC to performance is commonly assessed by comparing outcomes between the squat jump (SJ) and the countermovement jump (CMJ), making these tests widely used for monitoring performance in strength and conditioning settings [4,7,8,9]. The body’s response to resistance training manifests through neuromuscular adaptations (e.g., motor unit activation, muscle fiber transition) and structural changes within the muscle–tendon complex. Although these changes are difficult to measure directly, they can be indirectly observed through field-based performance tests such as jump height, sprint velocity, and change of direction time [2,3]. Thus, these tests are not only indicators of performance but also useful tools for monitoring physiological adaptations in applied settings.
Although vertical jump tests provide useful information, conventional outcome measures (e.g., jump height, peak power) offer limited insight, thus requiring a more detailed analytical approach [10]. Prior studies have proposed various calculations—such as pre-stretch augmentation percentage (PSAP), eccentric utilization ratio (EUR), and reactive strength index (RSI)—to indirectly assess an athlete’s ability to utilize the SSC to improve jump height (JH) and peak power (PP) during CMJ [1,2,11]. These indices have also been used to reflect dynamic performance capacity [1] or to monitor athletes’ responses to different phases of training throughout the season [2]. Once JH or PP is measured using SJ and CMJ tests, the subtle differences captured by PSAP, EUR, and RSI allow practitioners and sport scientists to evaluate the percentage, ratio, or absolute difference between the two jumps.
On average, CMJ height is slightly greater than SJ height [9,12]. Studies have reported improvements ranging from 18–20% to 20–30%, corresponding to a 2–4 cm difference in maximal JH [13,14,15]. Komi and Bosco [16] attributed this difference to the storage and reutilization of elastic energy during CMJ, suggesting that a greater difference between CMJ and SJ indicates a superior capacity for elastic energy use. However, later studies questioned whether this difference results primarily from elastic energy mechanisms, proposing instead that the eccentric utilization ratio (EUR) more accurately reflects the effective use of the eccentric phase during CMJ. In line with these views, researchers have argued that a larger CMJ–SJ difference, as expressed by a higher EUR, may indicate a better capacity to utilize the eccentric phase [2]. Although EUR has been shown to be sensitive to training adaptations [2,17,18], few studies have directly examined its relationship with athletic performance [19,20]. Therefore, the utility of EUR as a performance indicator or a guide for training design remains uncertain.
In recent years, the eccentric utilization ratio (EUR) has been criticized for its limited and context-dependent relationship with sport-specific performance outputs. Nevertheless, EUR continues to be widely used in the literature and is still considered a monitoring tool by many practitioners. Therefore, systematically estimating the actual relationship between EUR and athletic performance with particular attention to sex-based differences aims to fill an important gap in the literature. Accordingly, two main hypotheses were proposed: (1) to examine the contribution of EUR to sprint, change of direction, and vertical jump performance; (2) to examine the contribution of absolute strength–power outputs to these performance parameters. Therefore, this study aimed to systematically investigate the association between EUR and key performance metrics in both male and female athletes, and to determine whether EUR or directly measured power outputs provide greater insight into sprint, COD, and jump capacities.
2. Materials and Methods
2.1. Study Design
A flowchart has been added to illustrate the sequence in which the tests were administered (Figure 1). Following measurements of body height and weight, a standardized warm-up protocol was implemented, consisting of 10 min of low-intensity running, 5 min of dynamic stretching, and 5 min of bodyweight resistance exercises. Participants then completed the tests in the following fixed order: squat jump (SJ), countermovement jump (CMJ), change of direction (COD) test, change of direction deficit (CODD) test, and 30 m sprint test. This order was intentionally chosen to minimize the effects of fatigue. Jumping tests were scheduled first since they induce less neuromuscular fatigue compared to sprint and COD tests. The sprint test, requiring maximal effort, was placed last to avoid negatively impacting earlier test performances. To mitigate fatigue, a 3 min rest was provided between repeated trials of the same test, and a 10 min rest was provided between different tests. All performance assessments were conducted in a single session.
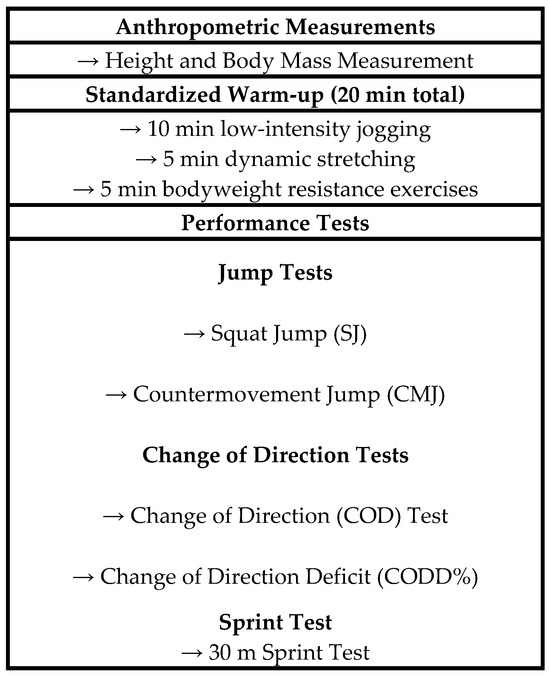
Figure 1.
Flowchart of the test sequence.
2.2. Participants
A total of 32 elite or professional-level athletes (16 females, 16 males) participated in this study. The participants were actively competing in various sports disciplines, including basketball (n = 9), volleyball (n = 8), handball (n = 8), and soccer (n = 7). This diversity allowed for a more generalizable analysis of performance characteristics across multiple sport contexts. To determine the appropriate sample size, the G*Power software 3.1 [21] was used, applying a statistical power of 0.80, an effect size of 0.50, and a margin of error of 0.05. All participants reported no injuries in the six months prior to data collection. Body height was measured using a SECA 213 portable stadiometer (SECA GmbH, Hamburg, Germany) with ±1 mm precision, and body mass was measured using a Tanita BC-418 digital scale (Tanita Corporation, Tokyo, Japan) with ±0.1 kg accuracy. Participants were instructed to refrain from intense physical activity for at least 24 h before each testing session. The study was conducted in the Human Performance Laboratory at Yalova University, located in Yalova, Türkiye. Prior to participation, they were informed about the study procedures and provided written informed consent. This study was approved by the Ethics Committee of Yalova University (Protocol No: 2025/8) and was conducted in full accordance with the Declaration of Helsinki. Descriptive characteristics of the participants are presented in Table 1. Participants were required to be between 18 and 30 years of age, have at least 3 years of continuous training experience in competitive sports, have not sustained any musculoskeletal injuries in the past 6 months, and not be using any medications or supplements that could affect neuromuscular performance. Individuals with a history of lower limb surgery or those who failed to complete all test sessions were excluded from the study.

Table 1.
Descriptive characteristics of male and female participants.
2.3. Vertical Jump Tests
All jump trials were performed with participants maintaining an akimbo position, with hands placed on the hips. A portable dual force platform system sampling at 1000 Hz (FD4000, Vald Performance, Brisbane, QLD, Australia) was used to collect vertical jump data. This system has been previously validated and is widely used in the measurement of vertical jump performance [22]. Participants were shown demonstrations of both jump types (CMJ and SJ) and completed a familiarization period, followed by 2 min of self-practice for each jump. During the countermovement jump (CMJ), participants stood upright, executed a rapid downward movement, and immediately performed a maximal vertical jump. In the squat jump (SJ), participants started from a 90-degree knee flexion position and were instructed to hold the position for 2 s before jumping, without any preparatory countermovement. Maximal effort was encouraged throughout all trials via verbal instructions. A passive rest period of 2 min was provided between each attempt, and a 10 min rest period was given between the SJ and CMJ protocols. Each jump type was performed three times, and the best result (i.e., highest value) was used for analysis. Mechanical strength–power parameters including eccentric mean power (ECCMP), eccentric peak power (ECCPP), concentric mean power (CONMP), and peak power (PP) were derived from the force–time data collected during CMJ. These outputs were calculated using the system’s integrated analysis software based on force–time curves recorded during the CMJ, enabling quantification of eccentric and concentric phase variables including average and peak power.
The following performance indices were also calculated from the jump test data:
- Pre-Stretch Augmentation Percentage (PSAP): PSAP = ((CMJ–SJ)/SJ) × 100 [23];
- Eccentric Utilization Ratio (EUR): EUR = (CMJ/SJ) [2];
- Reactive Strength Index (RSI): RSI = (Jump Height/Ground Contact Time) [24].
2.4. Change of Direction Tests
The Pro-Agility test, which has been reported to have high test–retest reliability [25], was used to assess change of direction ability. The Pro-Agility test was conducted using the methodology described by Harman [26]. Participants began the test 30 cm behind the starting gate, standing with their feet positioned on either side of the line. After hearing the “Start” command, they turned and sprinted 4.57 m (5 yards) to the right, touching a cone with their right hand. They then turned left and sprinted 9.14 m (10 yards) to the far cone, touching it with their left hand, before sprinting 4.57 m (5 yards) to the finish line. Each participant also completed the test in the opposite direction and performed a third trial using their preferred foot. Time was recorded using photoelectric timing gates (Witty, Microgate, Bolzano, Italy), and the fastest recorded time was used for analysis.
2.5. Change of Direction Deficit
The 505 test was used to evaluate change of direction deficit (CODD). Participants were instructed to sprint toward a marked line located 15 m from the starting point, place either their left or right foot on the line, execute a 180° turn, and sprint 5 m back through the timing gates. The timing gates were positioned 10 m from the starting line. Each participant completed three trials for each leg in an alternating fashion, with a 1 min passive rest period between attempts. CODD was calculated using the percentage-based formula proposed by Freitas et al. [27]:
([505 test time − 10 m sprint time]/10 m sprint time) × 100.
The 0–10 m sprint times used in the formula were obtained from the sprint test data (see the following section for details).
2.6. Sprint Test
The 30 m sprint time was recorded, and split times at 10 m, 20 m, and 30 m were used to evaluate sprint performance. Photoelectric timing gates (Witty, Microgate, Bolzano, Italy) were used for time measurement. A standing start was used, and participants were allowed to choose their lead leg, which was kept consistent across trials. The first timing gate was positioned 0.5 m ahead of the starting line. Each participant performed the 30 m sprint twice, with a 3 min passive recovery period between trials. The best time from each split was used for statistical analysis. Average running velocity across the optimal split interval was used to determine peak sprint speed. Sprint performance was calculated based on the recorded time (in seconds), and the resulting values were converted to speed (m/s) according to the distance covered.
2.7. Data Analysis
The data obtained in this study were analyzed using IBM SPSS Statistics version 26.0 (IBM Corp., Armonk, NY, USA). The normality of all variables was first assessed using the Shapiro–Wilk test and visual inspection methods, including histograms and Q–Q plots. For variables that met the assumption of normality, Pearson correlation analysis was performed; for non-normally distributed variables, Spearman’s rank correlation analysis was used. Parametric data were presented as mean ± standard deviation (SD), while nonparametric data were reported as median and interquartile range (IQR). These analyses were employed to examine the relationships between the eccentric utilization ratio (EUR) and sprint velocity (m/s), change of direction (COD) performance, and vertical jump height.
In addition, simple linear regression analyses were conducted to determine the extent to which performance variables could be explained by EUR and other biomechanical parameters, such as peak power (PP), reactive strength index (RSI), stiffness, pre-stretch augmentation percentage (PSAP), concentric mean power (CONMP), eccentric peak power (ECCPP), and eccentric mean power (ECCMP). To determine the associations between performance outcomes and predictor variables, each predictor–outcome pair was analyzed using a separate simple linear regression model. This approach allowed for evaluating the individual predictive value of each biomechanical parameter without combining multiple predictors within the same model. In the regression models, the dependent variables were vertical jump height, sprint velocities, and COD times, while the independent variables consisted of EUR, RSI, PP, and other strength–power metrics. Assumptions of simple linear regression (normality, linearity, and homoscedasticity) were checked using residual plots, and no major violations were observed. Statistical significance was set at p < 0.05 for all analyses.
3. Results
Figure 2 presents a correlation matrix examining the relationships between the eccentric utilization ratio (EUR) and various performance variables. The analysis revealed that EUR was not significantly correlated with SJ (r = −0.055, p > 0.05), CMJ (r = 0.156, p > 0.05), COD (r = −0.159, p > 0.05), or CODD% (r = −0.238, p > 0.05). Additionally, EUR showed low and non-significant correlations with sprint performance at all measured intervals: 0–10 m (r = 0.169, p > 0.05), 10–20 m (r = −0.040, p > 0.05), 20–30 m (r = 0.136, p > 0.05), and 0–30 m (r = 0.133, p > 0.05).
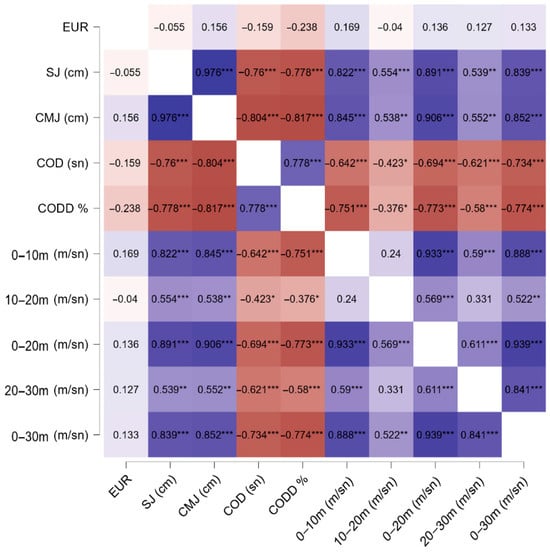
Figure 2.
Correlation analysis results for all participants. (* p < 0.05; ** p < 0.01; *** p < 0.001). Color saturation represents the strength of the correlation coefficients (darker hues indicate stronger correlations).
Figure 3 presents a correlation matrix illustrating the relationships between the eccentric utilization ratio (EUR) and various performance variables in male athletes. The analysis showed that EUR was not significantly correlated with SJ (r = −0.411, p > 0.05), CMJ (r = 0.077, p > 0.05), COD (r = −0.495, p > 0.05), or CODD% (r = −0.098, p > 0.05). Regarding sprint performance, the correlations between EUR and 0–10 m (r = 0.065, p > 0.05), 10–20 m (r = −0.191, p > 0.05), 20–30 m (r = 0.099, p > 0.05), and 0–30 m (r = −0.009, p > 0.05) were also not statistically significant.
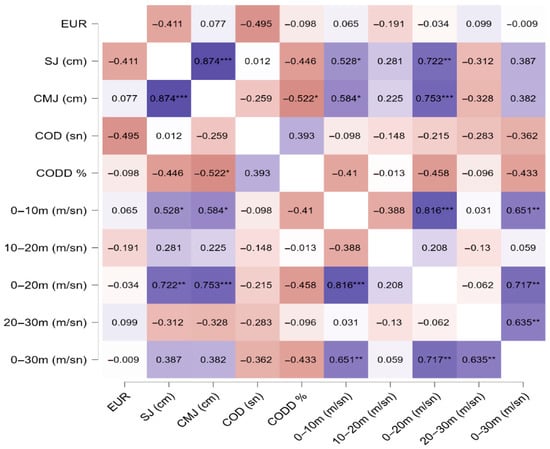
Figure 3.
Correlation analysis results for male athletes. (* p < 0.05; ** p < 0.01; *** p < 0.001). Color saturation represents the strength of the correlation coefficients (darker hues indicate stronger correlations).
Figure 4 presents a correlation matrix illustrating the relationships between the Eccentric, utilization ratio (EUR) and vertical jump, change of direction (COD), change of direction deficit (CODD%), and sprint speed in female athletes. The results show that EUR was significantly and positively correlated with CMJ performance (r = 0.587, p < 0.05) and 0–10 m sprint speed (r = 0.516, p < 0.05). These findings suggest that effective use of the eccentric phase may enhance vertical jump performance and contribute to acceleration capacity during the initial phase of sprinting. In particular, the significant positive correlation between EUR and CMJ indicates that efficient elastic energy reutilization during the eccentric phase may be a key factor in improving jump height.
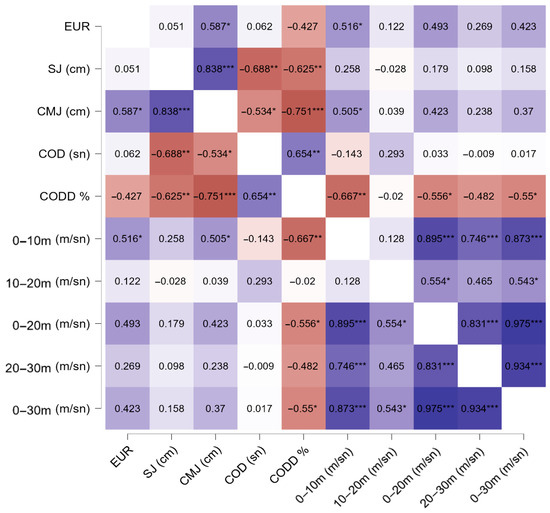
Figure 4.
Correlation analysis results for female athletes. (* p < 0.05; ** p < 0.01; *** p < 0.001). Color saturation represents the strength of the correlation coefficients (darker hues indicate stronger correlations).
In addition, the negative correlations observed between EUR and COD duration (r = −0.427), as well as CODD% (r = −0.516), suggest a potential role of eccentric phase utilization in change of direction performance. Although the negative correlation with CODD% did not reach statistical significance, it may indicate that athletes with higher EUR values are able to change direction more quickly and execute more controlled maneuvers. Specifically, the inverse relationship with CODD% implies that athletes who effectively utilize the eccentric phase may experience less angular velocity loss and perform sharper directional changes. On the other hand, EUR was not significantly correlated with sprint performance over longer distances, including 10–20 m (r = 0.122, p > 0.05), 20–30 m (r = 0.493, p > 0.05), and 0–30 m (r = 0.423, p > 0.05).
Table 2 presents the results of regression analyses conducted for the overall sample. No statistically significant relationships were found between the eccentric utilization ratio (EUR) and any of the performance variables (p > 0.05). In contrast, the CONMP variable was significantly associated with SJ (p = 0.001, R2 = 0.747), CMJ (p = 0.001, R2 = 0.567), COD (p = 0.001, R2 = 0.471), CODD% (p = 0.001, R2 = 0.363), and sprint performance at 0–10 m (p = 0.001, R2 = 0.263), 10–20 m (p = 0.001, R2 = 0.312), 0–20 m (p = 0.001, R2 = 0.328), 20–30 m (p = 0.001, R2 = 0.303), and 0–30 m (p = 0.001, R2 = 0.438).
Table 2.
Simple linear regression analyses for performance variables—total sample (n = 32).
Similarly, ECCMP was significantly associated with SJ (p = 0.001, R2 = 0.425), CMJ (p = 0.001, R2 = 0.495), COD (p = 0.001, R2 = 0.443), CODD% (p = 0.001, R2 = 0.446), 0–10 m sprint (p = 0.001, R2 = 0.332), 0–20 m sprint (p = 0.005, R2 = 0.237), 20–30 m sprint (p = 0.003, R2 = 0.251), and 0–30 m sprint (p = 0.001, R2 = 0.359). Its relationship with 10–20 m sprint, however, was not statistically significant (p = 0.140). Likewise, ECCPP demonstrated significant associations with SJ (p = 0.001, R2 = 0.459), CMJ (p = 0.001, R2 = 0.496), COD (p = 0.001, R2 = 0.490), CODD% (p = 0.001, R2 = 0.465), 0–10 m sprint (p = 0.001, R2 = 0.353), 0–20 m (p = 0.001, R2 = 0.323), 20–30 m (p = 0.001, R2 = 0.253), and 0–30 m (p = 0.001, R2 = 0.412). Its relationship with 10–20 m sprint did not reach statistical significance (p = 0.052). The ECCPF/BM variable showed significant associations with SJ (p = 0.039, R2 = 0.108), CMJ (p = 0.035, R2 = 0.111), and COD (p = 0.041, R2 = 0.108), but not with CODD%, nor with any sprint intervals (p > 0.05). The PP variable demonstrated significant relationships with all performance outcomes: SJ (p = 0.001, R2 = 0.581), CMJ (p = 0.001, R2 = 0.599), COD (p = 0.001, R2 = 0.507), CODD% (p = 0.001, R2 = 0.396), 0–10 m (p = 0.001, R2 = 0.253), 10–20 m (p = 0.001, R2 = 0.363), 0–20 m (p = 0.001, R2 = 0.344), 20–30 m (p = 0.001, R2 = 0.338), and 0–30 m (p = 0.001, R2 = 0.463). In contrast, the stiffness variable showed a significant association only with 0–10 m sprint performance (p = 0.023, R2 = 0.123), RSI was significantly associated only with CODD% (p = 0.019, R2 = 0.076), and CONPF/BM showed a significant relationship solely with 10–20 m sprint (p = 0.015, R2 = 0.158). No statistically significant relationships were observed between ECCPF/BM or PSAP and any of the performance variables (p > 0.05).
Table 3 presents the results of the multiple regression analysis for male athletes. No statistically significant associations were found between the eccentric utilization ratio (EUR) and any of the performance variables (p > 0.05). In contrast, the Reactive Strength Index (RSI) demonstrated significant relationships with SJ (p = 0.012, R2 = 0.170), CMJ (p = 0.013, R2 = 0.295), 10–20 m sprint (p = 0.021, R2 = 0.145), and 0–30 m sprint (p = 0.047, R2 = 0.163). The CONMP variable was significantly associated only with 0–10 m sprint performance (p = 0.034, R2 = 0.106). The stiffness variable showed a significant association solely with COD performance (p = 0.001, R2 = 0.542). Peak power (PP) was significantly related only to 0–10 m sprint (p = 0.008, R2 = 0.405). Other parameters including CONPF/BM, ECCMP, ECCPP, ECCPF/BM, CODD%, and PSAP did not show any statistically significant associations with the performance variables (p > 0.05). Notably, although some associations were statistically significant, several R2 values (e.g., for CONMP and RSI in sprint segments) indicated a relatively low explanatory power, suggesting that these variables account for only a modest portion of performance variance.
Table 3.
Simple linear regression analyses for performance variables—male athletes (n = 16).
Table 4 displays the results of the multiple regression analysis for female athletes. EUR was found to be significantly and positively associated with CMJ height (p = 0.017, R2 = 0.345) and 0–10 m sprint performance (p = 0.041, R2 = 0.267). This finding suggests that effective use of the eccentric phase may positively impact both vertical jump and initial sprint acceleration in female athletes. The ECCMP variable significantly predicted performance in 0–10 m (p = 0.030, R2 = 0.294) and 0–20 m sprints (p = 0.046, R2 = 0.255). ECCPP demonstrated a strong and significant association with CMJ height (p = 0.002, R2 = 0.519). The Reactive Strength Index (RSI) showed significant relationships with CMJ (p = 0.013, R2 = 0.366), 0–10 m sprint (p = 0.007, R2 = 0.403), 0–20 m sprint (p = 0.032, R2 = 0.321), and CODD% (p = 0.007, R2 = 0.398). The stiffness variable was significantly associated with 10–20 m sprint performance (p = 0.048, R2 = 0.191). In addition, PSAP significantly predicted sprint performance at 10–20 m (p = 0.015, R2 = 0.353) and 20–30 m (p = 0.038, R2 = 0.206). Conversely, other parameters—such as CONMP, ECCPF/BM, PP, and CONPF/BM—did not demonstrate statistically significant associations with sprint, vertical jump, COD, or CODD% performance outcomes (p > 0.05). While several variables exhibited statistically significant associations with performance outcomes in female athletes, the relatively modest R2 values in some models (e.g., for stiffness and PSAP) indicate limited explanatory strength, suggesting the need for complementary assessments.
Table 4.
Simple linear regression analyses for performance variables—female athletes (n = 16).
4. Discussion
This study investigated the relationship between the eccentric utilization ratio (EUR) and performance variables including sprint, change of direction (COD), change of direction deficit (CODD%; defined as the difference between sprint and COD times), and vertical jump (VJ). Considering the limited number of studies focusing specifically on female athletes, this research may be regarded as one of the few that explores EUR–performance relationships in women. Overall findings indicated that EUR did not exhibit statistically significant correlations with these performance variables across the entire sample (p > 0.05). This result aligns with the views of Van Hooren and Zolotarjova (2017), who argued that EUR has limited predictive value for performance [9]. Similarly, the findings of Kozinc et al. (2021) also support the limited usefulness of EUR in predicting sport-specific performance parameters [19].
In contrast, absolute and normalized strength–power parameters such as CONMP, ECCMP, ECCPP, and PP demonstrated strong associations with key athletic performance outcomes including sprint velocity, VJ, COD, and CODD% (p < 0.05). Rather than merely noting statistical associations, it is more meaningful to interpret concentric mean power (CONMP) as a shared neuromuscular foundation for both linear sprinting and multidirectional movements. This suggests that athletes with superior concentric power can apply force more rapidly and effectively during explosive tasks, particularly during initial acceleration and re-acceleration phases. In these phases, the ability to generate concentric force in a brief time window is a key determinant of movement efficiency and performance. This becomes particularly relevant when considering the role of eccentric force in optimizing change of direction performance. The predictive power of ECCMP and ECCPP for sprinting, jumping, and change of direction performance likely stems from the crucial role of eccentric strength in neuromuscular control during high-intensity movement transitions. In particular, effective eccentric force production during deceleration phases may enhance mechanical stability and readiness for subsequent re-acceleration, which is essential for sharp directional changes. These findings highlight the significance of eccentric capacity not only in energy storage, but also in regulating movement quality and performance efficiency in multidirectional sports tasks. The relationship between CODD% and eccentric force capacity appears particularly relevant during the transition from braking to re-acceleration, potentially minimizing angular velocity losses and enhancing COD efficiency [28,29,30,31]. This finding is consistent with McBurnie et al. (2022), who emphasized the critical role of eccentric force in change of direction deficit [32].
Similarly, the significant associations between peak power (PP) and all sprint phases, VJ, COD, and CODD% suggest that high power output is a critical determinant of multidirectional athletic performance. In the context of sprinting, PP has been shown in the literature to relate to reduced ground contact time and increased external mechanical work during the acceleration phase [33]. Regarding vertical jump outcomes, PP reflects the capacity of the muscle–tendon unit to contract at high velocity within a short time, making it a primary determinant of jump height [34]. Moreover, the significant explanatory value of PP for COD performance suggests that high power production during the deceleration-to-acceleration cycle offers a performance advantage, indicating that COD ability depends not only on strength but also on the ability to generate high mechanical power rapidly. These findings align with previous studies highlighting PP as a critical performance determinant in short-duration, high-intensity movements such as sprinting, jumping, and COD tasks [35,36,37,38].
The association between EUR and performance in female athletes may reflect their greater reliance on elastic properties and tendon compliance. In women, enhanced utilization of the eccentric phase could improve force transmission during early sprint acceleration and vertical displacement during jumping. This supports the notion that EUR may offer greater predictive value in female populations due to sex-specific neuromuscular and architectural characteristics. The observed links between RSI and performance in female athletes suggest that reactive strength plays a critical role in executing rapid, explosive movements. High RSI values indicate superior ability to generate force in minimal ground contact time, which is especially advantageous during short sprints and rapid directional changes. These findings emphasize the importance of plyometric efficiency and stretch-shortening cycle function in enhancing both linear and multidirectional performance in female athletes. Eccentric strength parameters such as ECCMP, ECCPP, and ECCPF/BM also showed significant associations with early-phase sprint and VJ performance (p < 0.05). The predictive value of PSAP for mid-phase sprint distances (0–20 m and 0–30 m) indicates that elastic pre-tension contributes to sustained acceleration beyond initial propulsion. In this context, PSAP may serve as an indirect marker of stretch-shortening cycle efficiency, highlighting its role not only in vertical displacement but also in optimizing horizontal force application during prolonged sprint efforts. The link between musculo tendinous stiffness and initial sprint acceleration highlights the importance of optimal elastic tension for rapid force transmission. During the first 10 m of sprinting where ground contact time is minimal, adequate stiffness enhances mechanical efficiency by reducing energy dissipation. Conversely, suboptimal stiffness may impair force application, resulting in reduced acceleration capacity. Therefore, stiffness should be considered a key neuromechanical quality in explosive locomotor tasks. Taken together, these findings highlight the significant impact of eccentric-phase characteristics on sprinting, vertical jump, and change of direction performance in female athletes. Therefore, these variables should be integrated into comprehensive performance profiling and individualized training strategies. The inclusion of athletes from various sports disciplines in this study suggests that sport-specific physiological and technical demands may have influenced performance outcomes. For instance, athletes from sports such as football, handball, and basketball are expected to perform better in sprint and change-of-direction tests due to the frequent need for rapid acceleration, deceleration, and re-acceleration in their sports. Conversely, vertical jump performance may be more pronounced in sports like volleyball and basketball, where vertical force production is a core component of performance. These differences highlight the potential influence of sport-specific training backgrounds, neuromuscular adaptations, and technical movement patterns on the measured parameters. Future studies may benefit from subgroup analyses based on sport type to provide more refined and contextually relevant interpretations.
In contrast, no significant relationships were found between EUR and any performance variables in male athletes, indicating that EUR may be inadequate in capturing elastic energy utilization capacity in this group. This may be attributed to sex-based differences in neuromuscular, structural, and elastic characteristics. Female athletes tend to exhibit greater tendon elasticity, more compliant muscle–tendon architecture, and a higher reliance on passive elastic components, which may enhance elastic energy recovery during the eccentric phase [39,40]. Conversely, higher absolute strength, muscle mass, and Type II fiber proportion in males may limit the explanatory capacity of ratio-based metrics like EUR [41]. Additionally, since EUR is calculated as the CMJ/SJ ratio, the typically higher SJ values observed in male athletes may reduce the relative difference between CMJ and SJ, resulting in lower EUR values. Consequently, EUR may not accurately reflect elastic energy efficiency in males. In contrast, the relatively lower SJ scores in female athletes allow for greater improvement in CMJ, which in turn results in higher EUR values and a more pronounced influence of the eccentric phase on performance.
Moreover, high EUR values should not always be interpreted as indicators of superior performance. A recent study [9] reported that a student control group exhibited higher EUR values than all nine elite athlete groups involved in the research. The authors suggested that this outcome may have resulted from lower SJ performance in the control group, potentially reflecting lower rapid force development or greater muscle slack [19]. This implies that high EUR values may sometimes stem from artificially low SJ scores, rather than from high CMJ performance. Therefore, the CMJ/SJ ratio may inflate EUR in contexts where SJ is suppressed, leading to misleading interpretations. These findings highlight the context-dependent nature of EUR and caution against its use as a standalone performance metric without consideration of underlying biomechanical factors.
Furthermore, in male athletes, RSI showed significant associations with CMJ, 10–20 m, and 0–30 m sprint performances (p < 0.05), underscoring the role of reactive strength capacity in sprint performance. While several previous studies support the association between RSI and sprint outcomes [42,43], some have reported conflicting findings [24,44]. The finding that CONMP was only associated with 0–10 m sprint performance further emphasizes the role of concentric strength in early-phase acceleration. Additionally, the observation that stiffness was significantly related only to COD performance suggests that the elastic properties of the muscle–tendon complex may be particularly important in rapid directional changes. Overall, it appears that in male athletes, absolute strength and power output parameters provide stronger explanatory power for performance than ratio-based indicators such as EUR.
This study has several limitations. First, the sample consisted solely of a limited number of elite or professional-level athletes, which restricts the generalizability of the findings. Additionally, EUR and other performance parameters were evaluated exclusively based on mechanical outputs; physiological determinants such as muscle–tendon architecture, muscle fiber type, and neuromuscular control were not assessed. Due to the cross-sectional design of the study, changes in EUR over time or in response to training interventions could not be examined. Therefore, future research should investigate EUR and related variables using longitudinal designs and larger, more diverse samples of athletes at different performance levels. Moreover, participants came from various sports disciplines, including basketball, volleyball, handball, and soccer. Sport-specific physiological and technical demands may have influenced individual responses to the performance tests. Additionally, participants’ familiarity with the test procedures varied; some had previously undergone the tests multiple times, while others had limited exposure. These differences may have affected test outcomes due to varying degrees of neural, metabolic, and structural adaptation.
5. Conclusions
In conclusion, the eccentric utilization ratio (EUR) demonstrated limited predictive value for sprint, change of direction (COD), change of direction deficit (CODD%), and vertical jump (VJ) performance across the overall sample. In contrast, directly measured absolute strength and power parameters—particularly ECCMP, ECCPP, CONMP, and peak power—showed strong associations with various athletic performance outcomes. Additionally, biomechanical characteristics such as reactive strength and leg stiffness emerged as critical determinants in tasks requiring rapid acceleration and change of direction. These findings indicate that relying solely on ratio-based metrics like EUR may not provide a comprehensive understanding of athletic capacity. From both a research and practical perspective, a more integrative performance profiling approach is recommended—one that includes eccentric and concentric force outputs as well as reactive and stiffness-related neuromuscular traits. Furthermore, the observed sex-specific differences in force–power relationships underscore the importance of individualized training strategies for male and female athletes. Such a multidimensional monitoring system may enhance both the accuracy and effectiveness of performance development practices.
6. Practical Applications
These findings suggest that focusing on directly measured force and power parameters may be more effective for performance development than relying on ratio-based indicators. Practical training strategies that can be applied in the field have also been outlined. In particular, the strong associations between absolute power variables such as ECCMP, ECCPP, and CONMP with sprint and change of direction performance indicate the need to prioritize training modalities targeting these outputs. Since peak power supports multidirectional performance, explosive power-oriented exercises such as resisted sprints or Olympic lifts should be regularly incorporated into training programs. Moreover, the observed associations between RSI and both short sprint segments and change of direction performance underscore the importance of plyometric training. Exercises such as drop jumps, bounding, and hurdle hops may be beneficial in this context. Finally, given the sex-specific differences observed in force–power profiles, individualized programming should be designed separately for male and female athletes to optimize performance outcomes. For instance, eccentric-focused plyometric exercises may be more suitable for female athletes, whereas high-resistance strength training aimed at enhancing maximal force production may be more appropriate for male athletes.
Author Contributions
Conceptualization, S.K. and M.E.; methodology, S.K. and M.E.; software, S.K. and M.E.; validation, S.K. and M.E.; formal analysis, S.K. and M.E.; investigation, S.K. and M.E.; resources, S.K. and M.E.; data curation, S.K. and M.E.; writing—original draft preparation, S.K. and M.E.; writing—review and editing, S.K. and M.E.; visualization, S.K. and M.E.; supervision, S.K.; project administration, S.K. and M.E. All authors have read and agreed to the published version of the manuscript.
Funding
This research received no external funding.
Institutional Review Board Statement
The study was conducted in accordance with the Declaration of Helsinki and approved by the Ethics Committee of Yalova University (Protocol No: 2025/8) (28 January 2025).
Informed Consent Statement
Informed consent was obtained from all subjects involved in the study.
Data Availability Statement
The raw data supporting the conclusions of this article will be made available by the authors on request.
Acknowledgments
We would like to express our sincere gratitude to all participants who took part in this study and to BRAVOMED Medical Health Products Company for their valuable support.
Conflicts of Interest
The authors declare no conflicts of interest.
References
- Haff, G.; Ruben, R.; Molinari, M.; Painter, K.; Ramsey, M.W.; Stone, M.E.; Stone, M.H. The Relationship Between The Eccentric Utilization Ratio, Reactive Strength, and Pre-Stretch Augmentation and Selected Dynamic and Isometric Muscle Actions. J. Strength Cond. Res. 2010, 24, 1. [Google Scholar] [CrossRef]
- McGuigan, M.R.; Doyle, T.L.; Newton, M.; Edwards, D.J.; Nimphius, S.; Newton, R.U. Eccentric utilization ratio: Effect of sport and phase of training. J. Strength Cond. Res. 2006, 20, 992–995. [Google Scholar] [CrossRef] [PubMed]
- Diallo, O.; Dore, E.; Duche, P.; Van Praagh, E. Effects of plyometric training followed by a reduced training programme on physical performance in prepubescent soccer players. J. Sports Med. Phys. Fit. 2001, 41, 342. [Google Scholar]
- Komi, P.V. Stretch-shortening cycle: A powerful model to study normal and fatigued muscle. J. Biomech. 2000, 33, 1197–1206. [Google Scholar] [CrossRef]
- Turner, A.N.; Jeffreys, I. The stretch-shortening cycle: Proposed mechanisms and methods for enhancement. Strength Cond. J. 2010, 32, 87–99. [Google Scholar] [CrossRef]
- Massidda, M.; Scorcu, M.; Calò, C.M. New genetic model for predicting phenotype traits in sports. Int. J. Sports Physiol. Perform. 2014, 9, 554–560. [Google Scholar] [CrossRef]
- Suchomel, T.J.; Sole, C.J.; Stone, M.H. Comparison of methods that assess lower-body stretch-shortening cycle utilization. J. Strength Cond. Res. 2016, 30, 547–554. [Google Scholar] [CrossRef]
- Zikica, T.; Serjoza, G.; Markovski, N.; Kalach, R.; Vuksanovikj, V. The influence of a specially programmed functional training in improving the vertical jump of senior soccer players. Res. Phys. Educ. Sport Health 2019, 8, 3–8. [Google Scholar]
- Van Hooren, B.; Zolotarjova, J. The difference between countermovement and squat jump performances: A review of underlying mechanisms with practical applications. J. Strength Cond. Res. 2017, 31, 2011–2020. [Google Scholar] [CrossRef]
- Jiménez-Reyes, P.; Samozino, P.; Brughelli, M.; Morin, J.-B. Effectiveness of an individualized training based on force-velocity profiling during jumping. Front. Physiol. 2017, 7, 677. [Google Scholar] [CrossRef]
- Young, W. Laboratory strength assessment of athletes. New Stud. Athl. 1995, 10, 89–95. [Google Scholar]
- Petrigna, L.; Karsten, B.; Marcolin, G.; Paoli, A.; D’Antona, G.; Palma, A.; Bianco, A. A review of countermovement and squat jump testing methods in the context of public health examination in adolescence: Reliability and feasibility of current testing procedures. Front. Physiol. 2019, 10, 1384. [Google Scholar] [CrossRef] [PubMed]
- Bosco, C.; Viitasalo, J.T.; Komi, P.V.; Luhtanen, P. Combined effect of elastic energy and myoelectrical potentiation during stretch-shortening cycle exercise. Acta Physiol. Scand. 1982, 114, 557–565. [Google Scholar] [CrossRef] [PubMed]
- Bosco, C.; Montanari, G.; Ribacchi, R.; Giovenali, P.; Latteri, F.; Iachelli, G.; Faina, M.; Colli, R.; Dal Monte, A.; La Rosa, M.; et al. Relationship between the efficiency of muscular work during jumping and the energetics of running. Eur. J. Appl. Physiol. Occup. Physiol. 1987, 56, 138–143. [Google Scholar] [CrossRef] [PubMed]
- Bobbert, M.F.; Casius, L.J. Is the effect of a countermovement on jump height due to active state development? Med. Sci. Sports Exerc. 2005, 37, 440–446. [Google Scholar] [CrossRef]
- Komi, P.V.; Bosco, C. Utilization of stored elastic energy in leg extensor muscles by men and women. Med. Sci. Sports 1978, 10, 261–265. [Google Scholar]
- Hawkins, S.B.; Doyle, T.L.; McGuigan, M.R. The effect of different training programs on eccentric energy utilization in college-aged males. J. Strength Cond. Res. 2009, 23, 1996–2002. [Google Scholar] [CrossRef]
- Gehri, D.J.; Ricard, M.D.; Kleiner, D.M.; Kirkendall, D.T. A comparison of plyometric training techniques for improving vertical jump ability and energy production. J. Strength Cond. Res. 1998, 12, 85–89. [Google Scholar][Green Version]
- Kozinc, Ž.; Pleša, J.; Šarabon, N. Questionable utility of the eccentric utilization ratio in relation to the performance of volleyball players. Int. J. Environ. Res. Public Health 2021, 18, 11754. [Google Scholar] [CrossRef]
- Kozinc, Ž.; Žitnik, J.; Smajla, D.; Šarabon, N. The difference between squat jump and countermovement jump in 770 male and female participants from different sports. Eur. J. Sport Sci. 2022, 22, 985–993. [Google Scholar] [CrossRef]
- Faul, F.; Erdfelder, E.; Buchner, A.; Lang, A.-G. Statistical power analyses using G* Power 3.1: Tests for correlation and regression analyses. Behav. Res. Methods 2009, 41, 1149–1160. [Google Scholar] [CrossRef] [PubMed]
- Collings, T.J.; Lima, Y.L.; Dutaillis, B.; Bourne, M.N. Concurrent validity and test–retest reliability of VALD ForceDecks’ strength, balance, and movement assessment tests. J. Sci. Med. Sport 2024, 27, 572–580. [Google Scholar] [CrossRef]
- Walshe, A.D.; Wilson, G.; Murphy, A. The validity and reliability of a test of lower body musculotendinous stiffness. Eur. J. Appl. Physiol. Occup. Physiol. 1996, 73, 332–339. [Google Scholar] [CrossRef]
- Young, W.; Mc Lean, B.; Ardagna, J. Relationship between strength qualities and sprinting performance. J. Sports Med. Phys. Fit. 1995, 35, 13–19. [Google Scholar]
- Stewart, P.; Turner, A.; Miller, S. Reliability, factorial validity, and interrelationships of five commonly used change of direction speed tests. Scand. J. Med. Sci. Sports 2014, 24, 500–506. [Google Scholar] [CrossRef] [PubMed]
- Harman, E. Essentials of Strength Training and Conditioning; Human Kinetics: Champaign, IL, USA, 2000. [Google Scholar]
- Freitas, T.T.; Pereira, L.A.; Alcaraz, P.E.; Azevedo, P.H.S.M.; Bishop, C.; Loturco, I. Percentage-Based Change of Direction Deficit: A New Approach to Standardize Time and Velocity-Derived Calculations. J. Strength Cond. Res. 2022, 36, 3521–3526. [Google Scholar] [CrossRef] [PubMed]
- Katz, B. The relation between force and speed in muscular contraction. J. Physiol. 1939, 96, 45. [Google Scholar] [CrossRef]
- Graham-Smith, P.; Jones, P.; Read, P. Taking a step back to reconsider change of direction and its application following ACL injury. Aspetar Sport Med. J. 2020, 9, 42–47. [Google Scholar]
- Dos’Santos, T.; Bishop, C.; Thomas, C.; Comfort, P.; Jones, P.A. The effect of limb dominance on change of direction biomechanics: A systematic review of its importance for injury risk. Phys. Ther. Sport 2019, 37, 179–189. [Google Scholar] [CrossRef]
- Donelon, T.A.; Dos’ Santos, T.; Pitchers, G.; Brown, M.; Jones, P.A. Biomechanical determinants of knee joint loads associated with increased anterior cruciate ligament loading during cutting: A systematic review and technical framework. Sports Med.-Open 2020, 6, 1–21. [Google Scholar] [CrossRef]
- McBurnie, A.J.; Harper, D.J.; Jones, P.A.; Dos’ Santos, T. Deceleration training in team sports: Another potential ‘vaccine’ for sports-related injury? Sports Med. 2022, 52, 1–12. [Google Scholar] [CrossRef] [PubMed]
- Cormie, P.; McGuigan, M.R.; Newton, R.U. Developing maximal neuromuscular power: Part 1—Biological basis of maximal power production. Sports Med. 2011, 41, 17–38. [Google Scholar] [CrossRef]
- Pupo, J.; Ache-Dias, J.; Kons, R.L.; Detanico, D. Are vertical jump height and power output correlated to physical performance in different sports? An allometric approach. Hum. Mov. 2020, 22, 60–67. [Google Scholar] [CrossRef]
- Rumpf, M.C.; Lockie, R.G.; Cronin, J.B.; Jalilvand, F. Effect of different sprint training methods on sprint performance over various distances: A brief review. J. Strength Cond. Res. 2016, 30, 1767–1785. [Google Scholar] [CrossRef] [PubMed]
- Haugen, T.; McGhie, D.; Ettema, G. Sprint running: From fundamental mechanics to practice—A review. Eur. J. Appl. Physiol. 2019, 119, 1273–1287. [Google Scholar] [CrossRef] [PubMed]
- Morin, J.-B.; Edouard, P.; Samozino, P. Technical ability of force application as a determinant factor of sprint performance. Med. Sci. Sports Exerc. 2011, 43, 1680–1688. [Google Scholar] [CrossRef]
- Cabarkapa, D.V.; Cabarkapa, D.; Aleksic, J.; Fry, A.C. Sport-Specific Differences in Vertical Jump Force-Time Metrics Between Professional Female Volleyball, Basketball, and Handball Players. J. Strength Cond. Res. 2025, 39, 587–592. [Google Scholar] [CrossRef]
- Kubo, K.; Kanehisa, H.; Fukunaga, T. Gender differences in the viscoelastic properties of tendon structures. Eur. J. Appl. Physiol. 2003, 88, 520–526. [Google Scholar] [CrossRef]
- Waugh, C.M.; Korff, T.; Fath, F.; Blazevich, A.J. Rapid force production in children and adults: Mechanical and neural contributions. Med. Sci. Sports Exerc. 2013, 45, 762–771. [Google Scholar] [CrossRef]
- Miller, A.E.J.; MacDougall, J.; Tarnopolsky, M.; Sale, D. Gender differences in strength and muscle fiber characteristics. Eur. J. Appl. Physiol. Occup. Physiol. 1993, 66, 254–262. [Google Scholar] [CrossRef]
- Smirniotou, A.; Katsikas, C.; Paradisis, G.; Argeitaki, P.; Zacharogiannis, E.; Tziortzis, S. Strength-power parameters as predictors of sprinting performance. J. Sports Med. Phys. Fit. 2008, 48, 447. [Google Scholar]
- Nagahara, R.; Naito, H.; Miyashiro, K.; Morin, J.; Zushi, K. Traditional and ankle-specific vertical jumps as strength-power indicators for maximal sprint acceleration. J. Sports Med. Phys. Fit. 2014, 54, 691–699. [Google Scholar]
- Healy, R.; Smyth, C.; Kenny, I.C.; Harrison, A.J. Influence of Reactive and Maximum Strength Indicators on Sprint Performance. J. Strength Cond. Res. 2019, 33, 3039–3048. [Google Scholar] [CrossRef] [PubMed]
Disclaimer/Publisher’s Note: The statements, opinions and data contained in all publications are solely those of the individual author(s) and contributor(s) and not of MDPI and/or the editor(s). MDPI and/or the editor(s) disclaim responsibility for any injury to people or property resulting from any ideas, methods, instructions or products referred to in the content. |
© 2025 by the authors. Licensee MDPI, Basel, Switzerland. This article is an open access article distributed under the terms and conditions of the Creative Commons Attribution (CC BY) license (https://creativecommons.org/licenses/by/4.0/).