Next Issue
Volume 10, August
Previous Issue
Volume 10, June


Atmosphere, Volume 10, Issue 7 (July 2019) – 75 articles

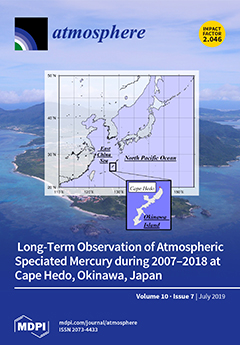
Cover Story (view full-size image): Atmospheric types of speciated mercury, including gaseous elemental mercury (GEM), gaseous oxidized mercury (GOM), and particle-bound mercury (PBM2.5), were observed over 10 years at the background site in Okinawa, Japan. Their concentrations increased due to the influence of the Asian outflows more frequently in the cold season. GOM concentrations were also moderately controlled by photochemical production in the summer. An annual decreasing trend for GEM concentrations was observed between 2008 and 2018 at a rate of −2.1% ± 0.36% year−1 that was the same as those in Europe and North America. This is believed to be linked to the influence of the global decreasing GEM trend. However, the decreasing rates during the cold season were restrained by regional Asian outflows. View this paper.
  • Issues are regarded as officially published after their release is announced to the table of contents alert mailing list.
  • You may sign up for e-mail alerts to receive table of contents of newly released issues.
  • PDF is the official format for papers published in both, html and pdf forms. To view the papers in pdf format, click on the "PDF Full-text" link, and use the free Adobe Reader to open them.
Order results
Result details
Section
Select all
Export citation of selected articles as:
12 pages, 1337 KiB  
Article
Perceived Climate Variability and Farm Level Adaptation in the Central River Region of The Gambia
by Abdoul Rasmane Bagagnan, Issa Ouedraogo and William M. Fonta
Atmosphere 2019, 10(7), 423; https://doi.org/10.3390/atmos10070423 - 23 Jul 2019
Cited by 10 | Viewed by 3523
Abstract
In Sub-Saharan Africa, the recurring erratic and uneven rainfall distribution has resulted in low crop yields, income losses, and low food stock. In response to these climate change challenges, farmers have recourse to several coping strategies to survive. This present paper explores farmers’ [...] Read more.
In Sub-Saharan Africa, the recurring erratic and uneven rainfall distribution has resulted in low crop yields, income losses, and low food stock. In response to these climate change challenges, farmers have recourse to several coping strategies to survive. This present paper explores farmers’ perception of climate variability and the coping strategies in use in the Central River Region of The Gambia. The main purpose of this paper is to analyze perceived climate variability and farm level adaptation options in the region. Data were collected from 283 farmhouses through transect walks, quantitative surveys including the use focus group discussions. Data were analyzed using descriptive and inferential statistics. Results revealed that farmers generally perceive an increase in the frequency of extreme weather events and a decrease in the duration of the growing season. With regards to vulnerability and severity, nearly 95% of the respondents considered the dryness as the main threat to their farming activities and perceived its consequences as the most severe. The results equally showed that the perception of changes is linked to the adoption of some adaptation measures among which the preferred were the use of chemical fertilizers (66%), though it is stated to be the most expensive. The Spearman correlation test showed that the use of water conservation techniques is highly correlated with the quality of soil surface structure (p ≤ 0.01) and soil storage capacity (p ≤ 0.01). Findings of this study are of paramount importance in planning and implementing adaptation policies in The Gambia and beyond. To improve farmers’ resilience, drought tolerant crops should be promoted along with climate change and variability awareness campaigns. Full article
Show Figures

Figure 1

9 pages, 205 KiB  
Communication
The Establishment of the Household Air Pollution Consortium (HAPCO)
by H. Dean Hosgood III, Madelyn Klugman, Keitaro Matsuo, Alexandra J. White, Atsuko Sadakane, Xiao-Ou Shu, Ruy Lopez-Ridaura, Aesun Shin, Ichiro Tsuji, Reza Malekzadeh, Nolwenn Noisel, Parveen Bhatti, Gong Yang, Eiko Saito, Shafiur Rahman, Wei Hu, Bryan Bassig, George Downward, Roel Vermeulen, Xiaonan Xue, Thomas Rohan, Sarah K. Abe, Philippe Broët, Eric J. Grant, Trevor J. B. Dummer, Nat Rothman, Manami Inoue, Martin Lajous, Keun-Young Yoo, Hidemi Ito, Dale P. Sandler, Habib Ashan, Wei Zheng, Paolo Boffetta and Qing Lanadd Show full author list remove Hide full author list
Atmosphere 2019, 10(7), 422; https://doi.org/10.3390/atmos10070422 - 23 Jul 2019
Viewed by 5247
Abstract
Household air pollution (HAP) is of public health concern, with ~3 billion people worldwide (including >15 million in the US) exposed. HAP from coal use is a human lung carcinogen, yet the epidemiological evidence on carcinogenicity of HAP from biomass use, primarily wood, [...] Read more.
Household air pollution (HAP) is of public health concern, with ~3 billion people worldwide (including >15 million in the US) exposed. HAP from coal use is a human lung carcinogen, yet the epidemiological evidence on carcinogenicity of HAP from biomass use, primarily wood, is not conclusive. To robustly assess biomass’s carcinogenic potential, prospective studies of individuals experiencing a variety of HAP exposures are needed. We have built a global consortium of 13 prospective cohorts (HAPCO: Household Air Pollution Consortium) that have site- and disease-specific mortality and solid fuel use data, for a combined sample size of 587,257 participants and 57,483 deaths. HAPCO provides a novel opportunity to assess the association of HAP with lung cancer death while controlling for important confounders such as tobacco and outdoor air pollution exposures. HAPCO is also uniquely positioned to determine the risks associated with cancers other than lung as well as nonmalignant respiratory and cardiometabolic outcomes, for which prospective epidemiologic research is limited. HAPCO will facilitate research to address public health concerns associated with HAP-attributed exposures by enabling investigators to evaluate sex-specific and smoking status-specific effects under various exposure scenarios. Full article
17 pages, 4475 KiB  
Article
Particulate Emissions of Euro 4 Motorcycles and Sampling Considerations
by Barouch Giechaskiel, Alessandro A. Zardini, Tero Lähde, Adolfo Perujo, Anastasios Kontses and Leonidas Ntziachristos
Atmosphere 2019, 10(7), 421; https://doi.org/10.3390/atmos10070421 - 21 Jul 2019
Cited by 15 | Viewed by 4856
Abstract
The scientific literature indicates that solid particle number (SPN) emissions of motorcycles are usually higher than that of passenger cars. The L-category (e.g., mopeds, motorcycles) Euro 4 and 5 environmental steps were designed to reduce the emissions of particulate matter and ozone precursors [...] Read more.
The scientific literature indicates that solid particle number (SPN) emissions of motorcycles are usually higher than that of passenger cars. The L-category (e.g., mopeds, motorcycles) Euro 4 and 5 environmental steps were designed to reduce the emissions of particulate matter and ozone precursors such as nitrogen oxides and hydrocarbons. In this study the SPN emissions of one moped and eight motorcycles, all fulfilling the Euro 4 standards, were measured with a SPN measurement system employing a catalytic stripper to minimize volatile artefacts. Although the particulate matter mass emissions were <1.5 mg/km for all vehicles tested, two motorcycles and the moped were close to the SPN limit for passenger cars (6 × 10¹¹ particles/km with sizes larger than 23 nm) and four motorcycles exceeded the limit by a factor of up to four. The measurement repeatability was satisfactory (deviation from the mean 10%) and concentration differences between tailpipe and dilution tunnel were small, indicating that performing robust SPN measurements for regulatory control purposes is feasible. However, steady state tests with the moped showed major differences between the tailpipe and the dilution tunnel sampling points for sub-23 nm particles. Thus, the measurement procedures of particles for small displacement engine mopeds and motorcycles need to be better defined for a possible future introduction in regulations. Full article
(This article belongs to the Special Issue Transport Emissions and the Atmosphere)
Show Figures

Figure 1

18 pages, 8111 KiB  
Article
Seasonal Analysis of the 2011–2017 North American Monsoon near its Northwest Boundary
by Charles Truettner, Michael D. Dettinger, Emanuele Ziaco and Franco Biondi
Atmosphere 2019, 10(7), 420; https://doi.org/10.3390/atmos10070420 - 21 Jul 2019
Cited by 5 | Viewed by 5021
Abstract
The seasonal extent of the North American Monsoon (NAM) is highly variable and potentially sensitive to future climate change. Our objective was to determine how regional monsoonal patterns influence mountain precipitation near the NAM northwest boundary. Among the data we analyzed, a unique [...] Read more.
The seasonal extent of the North American Monsoon (NAM) is highly variable and potentially sensitive to future climate change. Our objective was to determine how regional monsoonal patterns influence mountain precipitation near the NAM northwest boundary. Among the data we analyzed, a unique opportunity was provided by hourly observations collected on the Sheep Range (2300 m asl), in the Mojave Desert of southern Nevada, during 2011–2017. Long-term 800-m Parameter-elevation Relationships on Independent Slopes Model (PRISM) precipitation time series showed that the site is representative of mountain areas in the NAM northwest region. Based on in situ observations, we divided the water year into three seasons: cool (1 October through 31 March), early warm (1 April through last day with dewpoint <9.4 °C), and late warm (first day with dewpoint ≥9.4 °C through 30 September). Dewpoint temperature differed by about 8 °C between early warm season (mean of −6.3 °C) and late warm season (mean of 2.3 °C). According to ANCOVA model results, increasing hourly dewpoint associated with afternoon thunderstorms in the late warm season had the greatest relationship with hourly precipitation (F-value = 237.8, p-value < 0.01). Except for 2016, more precipitation fell at our study site during the late than the early warm season. Late warm season precipitation contributed the most (43–56%) to total water-year precipitation during the 2012–2015 extended drought. Southwestern USA regional composites of vertically integrated water vapor transport (IVT) suggested that water vapor in the cool and early warm season originated from the Pacific Ocean to the west, while a transition to a NAM-like pattern of northward IVT coincided with the late warm season. Full article
(This article belongs to the Special Issue 10th Anniversary of Atmosphere: Climatology and Meteorology)
Show Figures

Figure 1

12 pages, 3451 KiB  
Article
Seasonal Levels, Sources, and Health Risks of Heavy Metals in Atmospheric PM2.5 from Four Functional Areas of Nanjing City, Eastern China
by Lichun Wu, Xiao-San Luo, Hongbo Li, Long Cang, Jie Yang, Jiangli Yang, Zhen Zhao and Mingwei Tang
Atmosphere 2019, 10(7), 419; https://doi.org/10.3390/atmos10070419 - 21 Jul 2019
Cited by 40 | Viewed by 5235
Abstract
Aerosol pollution is a serious environmental issue, especially in China where there has been rapid urbanization. To identify the intra-annual and regional distributions of health risks and potential sources of heavy metals in atmospheric particles with an aerodynamic diameter less than or equal [...] Read more.
Aerosol pollution is a serious environmental issue, especially in China where there has been rapid urbanization. To identify the intra-annual and regional distributions of health risks and potential sources of heavy metals in atmospheric particles with an aerodynamic diameter less than or equal to 2.5 μm (PM2.5), this work collected monthly PM2.5 samples from urban, industrial, suburban, and rural areas in Nanjing city during 2016 and analyzed the heavy metal compositions (Cu, Pb, Cd, Co, V, Sr, Mn, Ti, and Sb). Enrichment factors (EFs) and principal component analysis (PCA) were applied to investigate the sources. The atmospheric PM2.5 pollution level was highest in the industrial area, followed by the urban and suburban areas, and was the lowest in the rural area. Seasonally, the concentrations of PM2.5 and associated heavy metals in spring and winter were higher than those in summer and autumn. Besides natural sources, heavy metal pollution in PM2.5 might come from metallurgical dust in the industrial area, while it mainly comes from automobile exhaust in urban and suburban areas. Health risk assessments revealed that noncancerous hazards of heavy metals in PM2.5 were low, while the lifetime cancer risks obviously exceeded the threshold. The airborne metal pollution in various functional areas of the city impacted human health differently. Full article
(This article belongs to the Special Issue Air Quality Control and Planning)
Show Figures

Figure 1

21 pages, 5639 KiB  
Article
Thirty Years of Atmospheric CO2 Observations at the Plateau Rosa Station, Italy
by Francesco Apadula, Claudio Cassardo, Silvia Ferrarese, Daniela Heltai and Andrea Lanza
Atmosphere 2019, 10(7), 418; https://doi.org/10.3390/atmos10070418 - 20 Jul 2019
Cited by 16 | Viewed by 5622
Abstract
The atmospheric background CO2 concentration is a key quantity for the analysis and evaluation of the ongoing climate change. Long-term CO2 observations have been carried out at the high Plateau Rosa mountain station, in the north-western Alps since 1989. The complete [...] Read more.
The atmospheric background CO2 concentration is a key quantity for the analysis and evaluation of the ongoing climate change. Long-term CO2 observations have been carried out at the high Plateau Rosa mountain station, in the north-western Alps since 1989. The complete time series covers thirty years, and it is suitable for climatological analysis. The continuous CO2 measurements, collected since 1993, were selected, by means of a BaDS (Background Data Selection) filter, to obtain the hourly background data. The monthly background data series was analysed in order to individuate the parameters that characterise the seasonal cycle and the long-term trend. The growth rate was found to be 2.05 ± 0.03 ppm/year, which is in agreement with the global trend. The increased background CO2 concentration at the Plateau Rosa site is the consequence of global anthropic emissions, whereas the natural variability of the climatic system taken from the SOI (South Oscillation Index) and MEI (Multivariate ENSO Index) signals was detected in the inter-annual changes of the Plateau Rosa growth rate. Full article
Show Figures

Figure 1

12 pages, 513 KiB  
Article
Virus-Like Particle Production in Atmospheric Eubacteria Isolates
by Nuria Teigell-Perez, Cristina Gonzalez-Martin, Basilio Valladares, David J. Smith and Dale W. Griffin
Atmosphere 2019, 10(7), 417; https://doi.org/10.3390/atmos10070417 - 19 Jul 2019
Cited by 3 | Viewed by 4077
Abstract
Culturable eubacterial isolates were collected at various altitudes in Earth’s atmosphere, including ~1.5 m above ground in Tallahassee, FL, USA; ~10.0 m above sea level over the mid-Atlantic ridge (~15° N); ~20 km above ground over the continental United States; ~20 km above [...] Read more.
Culturable eubacterial isolates were collected at various altitudes in Earth’s atmosphere, including ~1.5 m above ground in Tallahassee, FL, USA; ~10.0 m above sea level over the mid-Atlantic ridge (~15° N); ~20 km above ground over the continental United States; ~20 km above sea level over the Pacific Ocean near southern California; and from the atmosphere of Carlsbad Cavern, Carlsbad Cavern National Park, NM, USA. Isolates were screened for the presence of inducible virus-like particles (VLP) through the use of mitomycin C and epifluorescent direct counts. We determined that 92.7% of the isolates carried inducible VLP counts in exposed versus non-exposed culture controls and that the relationship was statistically significant. Further statistical analyses revealed that the number of isolates that demonstrated VLP production did not vary among collection sites. These data demonstrate a high prevalence of VLP generation in isolates collected in the lower atmosphere and at extreme altitudes. They also show that species of eubacteria that are resistant to the rigors of atmospheric transport play a significant role in long-range atmospheric inter- and intra-continental dispersion of VLP and that long-range atmospheric transport of VLP may enhance rates of evolution at the microbial scale in receiving environments. Full article
(This article belongs to the Special Issue Emissions, Transport and Fate of Pollutants in the Atmosphere)
Show Figures

Graphical abstract

13 pages, 7261 KiB  
Article
No Significant Shift of Warming Trend over the Last Two Decades on the Mid-South of Tibetan Plateau
by Lanhui Li, Yili Zhang, Wei Qi, Zhaofeng Wang, Yaojie Liu and Mingjun Ding
Atmosphere 2019, 10(7), 416; https://doi.org/10.3390/atmos10070416 - 19 Jul 2019
Cited by 6 | Viewed by 3217
Abstract
Climate warming on the Tibetan Plateau has been regarded as an important driving force of regional environmental change. Although several studies have analyzed the shift of warming trends on this plateau within the context of a recent global warming “hiatus” since 1998, their [...] Read more.
Climate warming on the Tibetan Plateau has been regarded as an important driving force of regional environmental change. Although several studies have analyzed the shift of warming trends on this plateau within the context of a recent global warming “hiatus” since 1998, their disparate findings have hindered a comprehensive and regional understanding. Based on the daily mean temperature (Tmean), maximum temperature (Tmax), and minimum temperature (Tmin) collected from meteorological stations on the period of 1961–2017, we re-examined the timing and magnitude of temperature phase change using piecewise linear regression on the mid-south of Tibetan Plateau. The results show that among the trends in regional annual Tmean, Tmax and Tmin, the statistically significant change-point was observed only in annual Tmax (p < 0.01). The warming trend of annual Tmax has accelerated significantly since 1992 and has exceeded that of annual Tmin after 2000, causing a remarkable reversal from decline to increase in diurnal temperature range (DTR) (p < 0.01). Spatially, the occurrence time of change-points in Tmean, Tmax, and Tmin varied among stations, but most of them occurred before the mid-1990s. Besides, the trend shifts in Tmax/DTR during the cold season played a primary role in the significant trend shifts in annual Tmax/DTR. This study underscores that there is no significant shift of warming trends over the last two decades on the mid-south of Tibetan Plateau. Full article
Show Figures

Graphical abstract

15 pages, 4606 KiB  
Article
Effect of Adding Hydrometeor Mixing Ratios Control Variables on Assimilating Radar Observations for the Analysis and Forecast of a Typhoon
by Dongmei Xu, Feifei Shen and Jinzhong Min
Atmosphere 2019, 10(7), 415; https://doi.org/10.3390/atmos10070415 - 19 Jul 2019
Cited by 12 | Viewed by 2993
Abstract
The variational data assimilation (DA) method seeks the optimal analyses by minimizing a cost function with respect to control variables (CVs). CVs are extended in this study to include hydrometeor mixing ratios related variables besides the widely used sets of CVs (momentum fields, [...] Read more.
The variational data assimilation (DA) method seeks the optimal analyses by minimizing a cost function with respect to control variables (CVs). CVs are extended in this study to include hydrometeor mixing ratios related variables besides the widely used sets of CVs (momentum fields, surface pressure, temperature, and pseudo-relative humidity). The impacts of the extra CVs are investigated in terms of hydrometeor mixing ratios to the assimilation of radar radial velocity (Vr) and reflectivity (RF) for the analysis and prediction of Typhoon Chanthu (2010). It is found that the background error statistics of the extended CVs from the National Meteorological Center (NMC) method is reliable. The track forecast is improved significantly by including hydrometeor mixing ratios as CVs to assimilate radar Vr and RF. The DA experiments using the hydrometer CVs show much improved intensity analysis and forecast. It also improves the precipitation forecast skills to some extent. The positive impact is significant using a direct RF assimilation scheme, when Vr and RF data are applied together. It suggests that when we applying an indirect RF assimilation scheme, the fitting of more hydrometers in the cost function will tend to cause a slight degradation for other variables such as the wind and temperature. Full article
(This article belongs to the Special Issue Advances in Applications of Weather Radar Data)
Show Figures

Figure 1

21 pages, 2528 KiB  
Review
Impacts of Aerosol Copper on Marine Phytoplankton: A Review
by Tianjiao Yang, Ying Chen, Shengqian Zhou and Haowen Li
Atmosphere 2019, 10(7), 414; https://doi.org/10.3390/atmos10070414 - 18 Jul 2019
Cited by 23 | Viewed by 7731
Abstract
Atmospheric deposition brings both nutrients and toxic components to the surface ocean, resulting in important impacts on phytoplankton. Field and lab studies have been done on the iron (Fe) fertilization on marine phytoplankton. However, studies on other trace metals are limited. Both bioassay [...] Read more.
Atmospheric deposition brings both nutrients and toxic components to the surface ocean, resulting in important impacts on phytoplankton. Field and lab studies have been done on the iron (Fe) fertilization on marine phytoplankton. However, studies on other trace metals are limited. Both bioassay experiments and field observations have suggested that aerosols with high copper (Cu) concentrations can negatively affect the primary productivity and change phytoplankton community structure. Note that with increasing human activities and global environmental changes (e.g., ocean acidification, warming, deoxygenation, etc.), the input of aerosol Cu could exceed toxicity thresholds at certain times or in some sensitive oceanic regions. Here, we provide a comprehensive review on aerosol Cu and marine phytoplankton studies by summarizing (1) physiological effects and toxicity thresholds of Cu to various phytoplankton taxa, (2) interactions between Cu and other metals and major nutrients, and (3) global distribution of surface seawater Cu and atmospheric Cu. We suggest that studies on aerosols, seawater chemistry, and phytoplankton should be integrated for understanding the impacts of aerosol Cu on marine phytoplankton, and thereafter the air–sea interaction via biogeochemical processes. Full article
Show Figures

Graphical abstract

8 pages, 1583 KiB  
Article
Methods for the Evaluation of the Stochastic Properties of the Ionosphere for Earthquake Prediction—Random Matrix Theory
by Leontýna Břizová, Jan Kříž, Filip Studnička and Jan Šlégr
Atmosphere 2019, 10(7), 413; https://doi.org/10.3390/atmos10070413 - 18 Jul 2019
Cited by 2 | Viewed by 2995
Abstract
Seismo-ionospheric coupling is a field of great interest and is currently subject to rigorous study; using both ground and satellite data and many phenomenological features, the ionospheric precursors of earthquakes were identified. In this work, we present methods to study the stochastic properties [...] Read more.
Seismo-ionospheric coupling is a field of great interest and is currently subject to rigorous study; using both ground and satellite data and many phenomenological features, the ionospheric precursors of earthquakes were identified. In this work, we present methods to study the stochastic properties of the lower ionosphere, derived from the data obtained with very low frequency (VLF) receivers at frequencies in the range of 19.6 to 37.5 kHz. Two main approaches are described: auto-correlation and random matrix theory treatments of amplitude time series data. It is shown that before shallow earthquakes with magnitudes greater than four, there are measurable changes that can be used in earthquake prediction. Although the exact form of the causal chain that leads to these changes are currently subject to diligent study, we believe that the investigations described herein are worth adding to the repertoire of ionospheric precursors. Full article
(This article belongs to the Special Issue Lithosphere–Atmosphere–Ionosphere Coupling (LAIC) Models)
Show Figures

Figure 1

21 pages, 1662 KiB  
Article
Analysis of the Air Quality and the Effect of Governance Policies in China’s Pearl River Delta, 2015–2018
by Hao Gao, Weixin Yang, Yunpeng Yang and Guanghui Yuan
Atmosphere 2019, 10(7), 412; https://doi.org/10.3390/atmos10070412 - 18 Jul 2019
Cited by 39 | Viewed by 5492
Abstract
The evaluation of China’s air pollution and the effectiveness of its governance policies is currently a topic of general concern in the academic community. We have improved the traditional evaluation method to construct a comprehensive air quality assessment model based on China’s major [...] Read more.
The evaluation of China’s air pollution and the effectiveness of its governance policies is currently a topic of general concern in the academic community. We have improved the traditional evaluation method to construct a comprehensive air quality assessment model based on China’s major air pollutants. Using the daily air pollutant data of 2015–2018, we calculated and analyzed the monthly air quality of nine cities in the Pearl River Delta of China, and conducted a comparative study on the effect of the air pollution control policies of the cities in the Pearl River Delta. We found that the air quality control policies in those nine cities were not consistent. Specifically, the pollution control policies of Guangzhou and Foshan have achieved more than 20% improvement. The pollution control policies of Dongguan and Zhaoqing have also achieved more than 10% improvement. However, due to the relative lag of the formulation and implementation of air pollution control policies, the air quality of Jiangmen, Zhuhai and Zhongshan has declined. Based on the analysis of the air quality assessment results and the effects of governance policies in each city during the study period, we propose suggestions for further improvement of the effectiveness of air pollution control policies in the region. Full article
Show Figures

Figure 1

11 pages, 1089 KiB  
Article
Characterization of Volatile Organic Compound (VOC) Emissions from Swine Manure Biogas Digestate Storage
by Yu Zhang, Zhiping Zhu, Yunhao Zheng, Yongxing Chen, Fubin Yin, Wanqin Zhang, Hongmin Dong and Hongwei Xin
Atmosphere 2019, 10(7), 411; https://doi.org/10.3390/atmos10070411 - 18 Jul 2019
Cited by 16 | Viewed by 5309
Abstract
Livestock manure is one of the major sources of volatile organic compound (VOC) emissions; however, characteristics of VOCs emitted from biogas digestate (BD) storage, which is a common manure practice, remain unclear. The objective of this study was to characterize VOC emissions during [...] Read more.
Livestock manure is one of the major sources of volatile organic compound (VOC) emissions; however, characteristics of VOCs emitted from biogas digestate (BD) storage, which is a common manure practice, remain unclear. The objective of this study was to characterize VOC emissions during BD storage through the dynamic emission vessel method, to identify the VOC emissions that have potential odor and/or toxic effects. The results revealed the detection of 49 VOCs with seven classes, whose total concentration varied from 171.35 to 523.71 μg m−3. The key classes of the 49 VOCs included Oxygenated VOCs (OVOCs), olefins and halogenated hydrocarbons. The top four compositions, accounting for 74.38% of total VOCs (TVOCs), included ethanol, propylene, acetone and 2-butanone. The top four odorous VOCs, accounting for only 5.15% of the TVOCs, were toluene, carbon disulfide, ethyl acetate and methyl sulfide, with the concentration ranging from 13.25 to 18.06 μg m−3. Finally, 11 main hazardous air pollutant VOCs, accounting for 32.77% of the TVOCs, were propylene, 2-butanone, toluene, methyl methacrylate, etc., with the concentration ranging from 81.05 to 116.96 μg m−3. Results could contribute to filling the knowledge gaps in the characteristics of VOC emissions from biogas digestate (BD), and provide a basis for exploring mitigation strategies on odor and hazardous air pollutions. Full article
(This article belongs to the Special Issue Livestock Odor and Air Quality)
Show Figures

Graphical abstract

15 pages, 5197 KiB  
Article
The Effects of Spring and Winter Blocking on PM10 Concentration in Korea
by Sug-gyeong Yun and Changhyun Yoo
Atmosphere 2019, 10(7), 410; https://doi.org/10.3390/atmos10070410 - 18 Jul 2019
Cited by 22 | Viewed by 3574
Abstract
Atmospheric blocking is known to be related to locally developed abnormal climate of the Korean Peninsula, such as heat and cold waves. However, little attention has been devoted to the effects of blocking on the fine dust concentration over Korea. In this study, [...] Read more.
Atmospheric blocking is known to be related to locally developed abnormal climate of the Korean Peninsula, such as heat and cold waves. However, little attention has been devoted to the effects of blocking on the fine dust concentration over Korea. In this study, we analyze the connection between the monthly frequency of blocking occurrence and high particulate matter smaller than 10 μm in diameter (PM10) concentration events in Korea. Our analyses are limited to winter (DJF) and spring (MAM) when both the blocking and high PM10 events tend to take place most frequently. During winter, significant and positive correlations are found in the North Pacific, while significantly negative values are seen over Ural-Siberia. A high PM10 concentration tends to be accompanied by negative (positive) pressure anomalies over Siberia (North Pacific). However, while examining atmospheric fields associated with the high PM10 events, we find that the high PM10 events show two different types of atmospheric fields depending on the strength of wind speed over Korea. When the local wind speed over Korea is weaker than normal, the connection with the North Pacific blocking is strengthened, whereas, the connection with the Ural-Siberia blocking is enhanced when the wind speed is stronger than normal. However, to increase the occurrence of the high PM10 events, both types feature a strong meridional pressure gradient caused by a high pressure system forming over Siberia. This is accompanied by a strong upper tropospheric zonal wind from China and Mongolia to Korea. Full article
(This article belongs to the Section Air Quality)
Show Figures

Figure 1

17 pages, 715 KiB  
Article
Impacts of In-Cabin Exposure to Size-Fractionated Particulate Matters and Carbon Monoxide on Changes in Heart Rate Variability for Healthy Public Transit Commuters
by Chin-Sheng Tang, Tzu-Yi Wu, Kai-Jen Chuang, Ta-Yuan Chang, Hsiao-Chi Chuang, Shih-Chun Candice Lung and Li-Te Chang
Atmosphere 2019, 10(7), 409; https://doi.org/10.3390/atmos10070409 - 17 Jul 2019
Cited by 17 | Viewed by 3276
Abstract
To evaluate the cardiovascular impact of traffic-related pollutant exposure on healthy young adults, the research team has collected the primary data of in-cabin exposure to air pollutants and heart rate variability (HRV). Twenty young healthy college students were recruited in Taipei metropolitan area. [...] Read more.
To evaluate the cardiovascular impact of traffic-related pollutant exposure on healthy young adults, the research team has collected the primary data of in-cabin exposure to air pollutants and heart rate variability (HRV). Twenty young healthy college students were recruited in Taipei metropolitan area. In addition to electrocardiogram, personal exposure to air pollutants, i.e., particulate matter (PM) and carbon monoxide (CO), and weather conditions, including temperature and relative humidity (RH), on campus, bus, and mass rapid transit were monitored continuously. The following HRV parameters were evaluated using generalized additive mixed model to adjust for personal and meteorological variables: heart rate (HR), the square root of the mean of the sum of the squares of differences between adjacent normal-to-normal (NN) intervals (r-MSSD), the standard deviation of all NN intervals (SDNN), the percentage of successive NN interval differences greater than 50 ms (pNN50), low-frequency power (LF), high-frequency power (HF), total power (TP), and LF/HF. They were assessed to find out the association between in-cabin exposure and HRV parameters. Compared with the HRV parameters measured on campus, the percent changes in r-MSSD, SDNN, pNN50+1, LF, HF, and TP decreased when the participants were in public transits. After adjusting for all locations, 5 min moving averages of PM2.5–10 and PM1 were significantly associated with the increase in the percent changes in HR and SDNN. Additionally, 5 min moving averages of PM2.5–10 exposure were significantly associated with the decrease in the percent change in HF, while it was significantly associated with the increase of the percent change in LF/HF. The reduction of the percent change in HR was also found to be significantly associated with 5 min CO moving averages. To conclude, current analyses have shown that size-fractionated PMs and CO exposure in public transits might lead to significant changes of HRV parameters for healthy young adults. Full article
(This article belongs to the Special Issue Impacts of Indoor Air Pollution on Cardiopulmonary System)
Show Figures

Figure 1

11 pages, 1907 KiB  
Article
No Particle Mass Enhancement from Induced Atmospheric Ageing at a Rural Site in Northern Europe
by Erik Ahlberg, Stina Ausmeel, Axel Eriksson, Thomas Holst, Tomas Karlsson, William H. Brune, Göran Frank, Pontus Roldin, Adam Kristensson and Birgitta Svenningsson
Atmosphere 2019, 10(7), 408; https://doi.org/10.3390/atmos10070408 - 17 Jul 2019
Cited by 7 | Viewed by 3240
Abstract
A large portion of atmospheric aerosol particles consists of secondary material produced by oxidation reactions. The relative importance of secondary organic aerosol (SOA) can increase with improved emission regulations. A relatively simple way to study potential particle formation in the atmosphere is by [...] Read more.
A large portion of atmospheric aerosol particles consists of secondary material produced by oxidation reactions. The relative importance of secondary organic aerosol (SOA) can increase with improved emission regulations. A relatively simple way to study potential particle formation in the atmosphere is by using oxidation flow reactors (OFRs) which simulate atmospheric ageing. Here we report on the first ambient OFR ageing experiment in Europe, coupled with scanning mobility particle sizer (SMPS), aerosol mass spectrometer (AMS) and proton transfer reaction (PTR)-MS measurements. We found that the simulated ageing did not produce any measurable increases in particle mass or number concentrations during the two months of the campaign due to low concentrations of precursors. Losses in the reactor increased with hydroxyl radical (OH) exposure and with increasing difference between ambient and reactor temperatures, indicating fragmentation and evaporation of semivolatile material. Full article
(This article belongs to the Special Issue Ambient Aerosol Measurements in Different Environments)
Show Figures

Figure 1

20 pages, 9794 KiB  
Article
River-Induced Anomalies in Seasonal Variation of Traffic-Emitted CO Distribution over the City of Krasnoyarsk
by Michael Hrebtov and Kemal Hanjalić
Atmosphere 2019, 10(7), 407; https://doi.org/10.3390/atmos10070407 - 17 Jul 2019
Cited by 7 | Viewed by 2372
Abstract
Seasonal variation of air quality in a city with a large river was investigated by means of numerical simulations of air movement and pollutant dispersion over inversion-capped diurnal cycles using a Reynolds-averaged Navier–Stokes (RANS) approach with algebraic turbulent flux model. The study accounts [...] Read more.
Seasonal variation of air quality in a city with a large river was investigated by means of numerical simulations of air movement and pollutant dispersion over inversion-capped diurnal cycles using a Reynolds-averaged Navier–Stokes (RANS) approach with algebraic turbulent flux model. The study accounts for the effects of urban heat island (UHI), terrain orography and high thermal inertia of the river body. The case mimics the real environment of the Krasnoyarsk region with the river Yenisei (Russia). Two scenarios were considered typical of the winter and summer seasons. The study is focused on the dynamics of dispersion of CO emanating mainly from road traffic, which remains fairly uniform throughout the year. The simulation starts from a mild low-altitude inversion with penetrative convection gradually developing over the daytime and attenuating during the night. The main difference between the two cases is in the temperature of the river surface relative to the ambient air. In winter, the non-freezing river acts as a source of positive thermal buoyancy, while in summer the cool river at the daytime acts in the opposite way, as a heat sink. The effect of the river-induced air circulation appears significant enough to account for the observed winter accumulation of the pollutant in the city center. Full article
(This article belongs to the Section Air Quality)
Show Figures

Figure 1

12 pages, 589 KiB  
Article
Non-Energy Use of Fuels in the Greenhouse Gas Emission Reporting
by Eva Krtková, Vladimir Danielik, Janka Szemesová, Klára Tarczay, Gábor Kis-Kovács and Vladimir Neuzil
Atmosphere 2019, 10(7), 406; https://doi.org/10.3390/atmos10070406 - 17 Jul 2019
Cited by 3 | Viewed by 4647
Abstract
In the context of greenhouse gas emissions, CO2 emissions from fuels are not arising only from combustion of the fuels, but also from non-energy use of fuels. In order to keep the inventory transparent, comparable, accurate, consistent, and complete, it is necessary [...] Read more.
In the context of greenhouse gas emissions, CO2 emissions from fuels are not arising only from combustion of the fuels, but also from non-energy use of fuels. In order to keep the inventory transparent, comparable, accurate, consistent, and complete, it is necessary to carefully assess such emissions in order to neither not omit nor double count them. The paper presents the methodological guidance of non-energy use of fuels given by Intergovernmental Panel on Climate Change (IPCC) 2006 Guidelines. Further, approaches of the Czech Republic, Slovak Republic, and Hungary, three neighboring countries, for reporting CO2 emissions from non-energy use of fuels are presented and discussed. Full article
Show Figures

Figure 1

11 pages, 1570 KiB  
Article
On the Spectra of Gravity Waves Generated by Two Typical Convective Systems
by Yuan Wang, Lifeng Zhang, Jun Peng, Yun Zhang and Tongfeng Wei
Atmosphere 2019, 10(7), 405; https://doi.org/10.3390/atmos10070405 - 17 Jul 2019
Cited by 1 | Viewed by 2716
Abstract
Spectral characteristics of lower-stratospheric gravity waves generated in idealized mei-yu front and tropical cyclone (TC) are compared by performing high-resolution simulations. The results suggest that the systems which organize convection in different forms can generate waves with distinctly different presentation. The mei-yu front [...] Read more.
Spectral characteristics of lower-stratospheric gravity waves generated in idealized mei-yu front and tropical cyclone (TC) are compared by performing high-resolution simulations. The results suggest that the systems which organize convection in different forms can generate waves with distinctly different presentation. The mei-yu front appears as a linear zonal wave source and gravity waves are dominated by cross-frontal (meridional) propagating components. The northward (southward) components have dominant meridional wavelengths of 125–333 km (>250 km), periods of 100–200 min (83–143 min), and phase speeds of 0–15 m s−1 (15–20 m s−1). The TC appears as a point wave source and gravity waves propagate equally in various horizontal directions. The waves exhibit greater power and broader spectral distributions compared with those in the mei-yu front, with dominant horizontal wavelengths longer than 62.5 km, periods of 33–600 min, and phase speeds slower than ~40 m s−1. Full article
(This article belongs to the Section Meteorology)
Show Figures

Figure 1

17 pages, 8901 KiB  
Article
Parallelization Performances of PMSS Flow and Dispersion Modeling System over a Huge Urban Area
by Oliver Oldrini, Patrick Armand, Christophe Duchenne and Sylvie Perdriel
Atmosphere 2019, 10(7), 404; https://doi.org/10.3390/atmos10070404 - 16 Jul 2019
Cited by 18 | Viewed by 2552
Abstract
The use of modeling as a support tool for crisis management and decision planning requires fast simulations in complex built-up areas. The Parallel Micro SWIFT SPRAY (PMSS) modeling system offers a tradeoff between accuracy and fast calculations, while retaining the capability to model [...] Read more.
The use of modeling as a support tool for crisis management and decision planning requires fast simulations in complex built-up areas. The Parallel Micro SWIFT SPRAY (PMSS) modeling system offers a tradeoff between accuracy and fast calculations, while retaining the capability to model buildings at high resolution in three dimensions. PMSS has been applied to actual areas of responsibilities of emergency teams during the EMERGENCIES (very high rEsolution eMERGEncy simulatioN for citIES) and EMED (Emergencies for the MEDiterranean sea) projects: these areas cover several thousands of square kilometers. Usage of metric meshes on such large areas requires domain decomposition parallel algorithms within PMSS. Sensitivity and performance of the domain decomposition has been evaluated both for the flow and dispersion models, using from 341 up to 8052 computing cores. Efficiency of the Parallel SWIFT (PSWIFT) flow model on the EMED domain remains above 50% for up to 4700 cores. Influence of domain decomposition on the Parallel SPRAY (PSPRAY) Lagrangian dispersion model is less straightforward to evaluate due to the complex load balancing process. Due to load balancing, better performance is achieved with the finest domain decomposition. PMSS is able to simulate accidental or malevolent airborne release at high resolution on very large areas, consistent with emergency team responsibility constrains, and with computation time compatible with operational use. This demonstrates that PMSS is an important asset for emergency response applications. Full article
(This article belongs to the Special Issue Atmospheric Dispersion of Pollutants in Urban Environments)
Show Figures

Graphical abstract

19 pages, 3423 KiB  
Article
Modeling Investigation of Diurnal Variations in Water Flux and Its Components with Stable Isotopic Tracers
by Pei Wang, Yujing Deng and Zhongwang Wei
Atmosphere 2019, 10(7), 403; https://doi.org/10.3390/atmos10070403 - 16 Jul 2019
Cited by 1 | Viewed by 3030
Abstract
The isotopic compositions of water fluxes provide valuable insights into the hydrological cycle and are widely used to quantify biosphere–atmosphere exchange processes. However, the combination of water isotope approaches with water flux components remains challenging. The Iso-SPAC (coupled heat, water with isotopic tracer [...] Read more.
The isotopic compositions of water fluxes provide valuable insights into the hydrological cycle and are widely used to quantify biosphere–atmosphere exchange processes. However, the combination of water isotope approaches with water flux components remains challenging. The Iso-SPAC (coupled heat, water with isotopic tracer in soil–plant–atmosphere-continuum) model is a useful framework for simulating the dynamics of water flux and its components, and for coupling with isotopic fractionation and mixing processes. Here, we traced the isotopic fractionation processes with separate soil evaporation (Ev) and transpiration (Tr), as well as their mixing in evapotranspiration (E) for simulating diurnal variations of isotope compositions in E flux (δE). Three sub modules, namely isotopic steady state (ISS), non-steady-state (NSS), and NSS Péclet, were tested to determine the true value for the isotope compositions of plant transpiration (δTr) and δE. In situ measurements of isotopic water vapor with the Keeling-plot approach for δE and robust eddy covariance data for E agreed with the model output (R2 = 0.52 and 0.98, RMSD = 2.72‰, and 39 W m−2), illustrating the robustness of the Iso-SPAC model. The results illustrate that NSS is a better approximation for estimating diurnal variations in δTr and δE, specifically during the alternating periods of day and night. Leaf stomata conductance regulated by solar radiation controlled the diurnal variations in transpiration fraction (Tr/E). The study emphasized that transpiration and evaporation, respectively, acted to increase and decrease the δ18O of water vapor that was affected by the diurnal trade-off between them. Full article
(This article belongs to the Special Issue Stable Isotopes in Atmospheric Research)
Show Figures

Graphical abstract

13 pages, 2052 KiB  
Article
Exposures to Carbon Monoxide in a Cookstove Intervention in Northern Ghana
by Ricardo Piedrahita, Evan R. Coffey, Yolanda Hagar, Ernest Kanyomse, Christine Wiedinmyer, Katherine L. Dickinson, Abraham Oduro and Michael P. Hannigan
Atmosphere 2019, 10(7), 402; https://doi.org/10.3390/atmos10070402 - 16 Jul 2019
Cited by 8 | Viewed by 3621
Abstract
Biomass burning for home energy use is a major environmental health concern. Improved cooking technologies could generate environmental health benefits, yet prior results regarding reduced personal exposure to air pollution are mixed. In this study, two improved stove types were distributed over four [...] Read more.
Biomass burning for home energy use is a major environmental health concern. Improved cooking technologies could generate environmental health benefits, yet prior results regarding reduced personal exposure to air pollution are mixed. In this study, two improved stove types were distributed over four study groups in Northern Ghana. Participants wore real-time carbon monoxide (CO) monitors to measure the effect of the intervention on personal exposures. Relative to the control group (those using traditional stoves), there was a 30.3% reduction in CO exposures in the group given two Philips forced draft stoves (p = 0.08), 10.5% reduction in the group given two Gyapa stoves (locally made rocket stoves) (p = 0.62), and 10.2% reduction in the group given one of each (p = 0.61). Overall, CO exposure for participants was low given the prevalence of cooking over traditional three-stone fires, with 8.2% of daily samples exceeding WHO Tier-1 standards. We present quantification methods and performance of duplicate monitors. We analyzed the relationship between personal carbonaceous particulate matter less than 2.5 microns (PM2.5) and CO exposure for the dataset that included both measurements, finding a weak relationship likely due to the diversity of identified air pollution sources in the region and behavior variability. Full article
Show Figures

Figure 1

36 pages, 4263 KiB  
Review
Atmospheric Chemistry in a Box or a Bag
by G. M. Hidy
Atmosphere 2019, 10(7), 401; https://doi.org/10.3390/atmos10070401 - 16 Jul 2019
Cited by 19 | Viewed by 6453
Abstract
Environmental chambers have proven to be essential for atmospheric photochemistry research. This historical perspective summarizes chamber research characterizing smog. Experiments with volatile organic compounds (VOCs)-nitrogen oxides (NOx) have characterized O3 and aerosol chemistry. These led to the creation and evaluation [...] Read more.
Environmental chambers have proven to be essential for atmospheric photochemistry research. This historical perspective summarizes chamber research characterizing smog. Experiments with volatile organic compounds (VOCs)-nitrogen oxides (NOx) have characterized O3 and aerosol chemistry. These led to the creation and evaluation of complex reaction mechanisms adopted for various applications. Gas-phase photochemistry was initiated and developed using chamber studies. Post-1950s study of photochemical aerosols began using smog chambers. Much of the knowledge about the chemistry of secondary organic aerosols (SOA) derives from chamber studies complemented with specially designed atmospheric studies. Two major findings emerge from post-1990s SOA experiments: (1) photochemical SOAs hypothetically involve hydrocarbons and oxygenates with carbon numbers of 2, and (2) SOA evolves via more than one generation of reactions as condensed material exchanges with the vapor phase during “aging”. These elements combine with multiphase chemistry to yield mechanisms for aerosols. Smog chambers, like all simulators, are limited representations of the atmosphere. Translation to the atmosphere is complicated by constraints in reaction times, container interactions, influence of precursor injections, and background species. Interpretation of kinetics requires integration into atmospheric models addressing the combined effects of precursor emissions, surface exchange, hydrometeor interactions, air motion and sunlight. Full article
(This article belongs to the Special Issue Chamber Studies of Atmospheric Chemistry)
Show Figures

Figure 1

27 pages, 12028 KiB  
Article
Kitchen Area Air Quality Measurements in Northern Ghana: Evaluating the Performance of a Low-Cost Particulate Sensor within a Household Energy Study
by Evan R. Coffey, David Pfotenhauer, Anondo Mukherjee, Desmond Agao, Ali Moro, Maxwell Dalaba, Taylor Begay, Natalie Banacos, Abraham Oduro, Katherine L. Dickinson and Michael P. Hannigan
Atmosphere 2019, 10(7), 400; https://doi.org/10.3390/atmos10070400 - 16 Jul 2019
Cited by 12 | Viewed by 5081
Abstract
Household air pollution from the combustion of solid fuels is a leading global health and human rights concern, affecting billions every day. Instrumentation to assess potential solutions to this problem faces challenges—especially related to cost. A low-cost ($159) particulate matter tool called the [...] Read more.
Household air pollution from the combustion of solid fuels is a leading global health and human rights concern, affecting billions every day. Instrumentation to assess potential solutions to this problem faces challenges—especially related to cost. A low-cost ($159) particulate matter tool called the Household Air Pollution Exposure (HAPEx) Nano was evaluated in the field as part of the Prices, Peers, and Perceptions cookstove study in northern Ghana. Measurements of temperature, relative humidity, absolute humidity, and carbon dioxide and carbon monoxide concentrations made at 1-min temporal resolution were integrated with 1-min particulate matter less than 2.5 microns in diameter (PM2.5) measurements from the HAPEx, within 62 kitchens, across urban and rural households and four seasons totaling 71 48-h deployments. Gravimetric filter sampling was undertaken to ground-truth and evaluate the low-cost measurements. HAPEx baseline drift and relative humidity corrections were investigated and evaluated using signals from paired HAPEx, finding significant improvements. Resulting particle coefficients and integrated gravimetric PM2.5 concentrations were modeled to explore drivers of variability; urban/rural, season, kitchen characteristics, and dust (a major PM2.5 mass constituent) were significant predictors. The high correlation (R2 = 0.79) between 48-h mean HAPEx readings and gravimetric PM2.5 mass (including other covariates) indicates that the HAPEx can be a useful tool in household energy studies. Full article
Show Figures

Figure 1

14 pages, 12977 KiB  
Article
How Can the International Monitoring System Infrasound Network Contribute to Gravity Wave Measurements?
by Patrick Hupe, Lars Ceranna and Alexis Le Pichon
Atmosphere 2019, 10(7), 399; https://doi.org/10.3390/atmos10070399 - 16 Jul 2019
Cited by 4 | Viewed by 3868
Abstract
Gravity waves (GWs) propagate horizontally and vertically in the atmosphere. They transport energy and momentum, and therefore GWs can affect the atmospheric circulation at different altitude layers when dissipating. Thus knowledge about the occurrence of GWs is essential for Numerical Weather Prediction (NWP). [...] Read more.
Gravity waves (GWs) propagate horizontally and vertically in the atmosphere. They transport energy and momentum, and therefore GWs can affect the atmospheric circulation at different altitude layers when dissipating. Thus knowledge about the occurrence of GWs is essential for Numerical Weather Prediction (NWP). However, uniform networks for covering GW measurements globally are rare, especially in the troposphere. It has been shown that an infrasound station of the International Monitoring System (IMS) infrasound network is capable of measuring GWs at the Earth’s surface. The IMS was deployed for monitoring the atmosphere to verify compliance with the Comprehensive Nuclear-Test-Ban-Treaty. In this study, the Progressive Multi-Channel Correlation Method (PMCC) is used for re-processing up to 20 years of IMS infrasound recordings in order to derive GW detections. For this purpose, two alternative PMCC configurations are discussed, covering GW frequencies equivalent to periods of between 5 min and 150 min. These detections mainly reflect sources of deep convection, particularly in the tropics. At mid-latitudes, coherent wind noise more often produces spurious detections. Combining the results of both configurations provides a global dataset of ground-based GW measurements, which enables the calculation of GW parameters. These can be used for improving NWP models. Full article
(This article belongs to the Special Issue Atmospheric Acoustic-Gravity Waves)
Show Figures

Graphical abstract

27 pages, 1942 KiB  
Article
Environmental Life Cycle Assessment of Alternative Fuels for Western Australia’s Transport Sector
by Najmul Hoque, Wahidul Biswas, Ilyas Mazhar and Ian Howard
Atmosphere 2019, 10(7), 398; https://doi.org/10.3390/atmos10070398 - 15 Jul 2019
Cited by 13 | Viewed by 8443
Abstract
Alternative fuels for the transport sector are being emphasized due to energy security and environmental issues. Possible alternative fuel options need to be assessed to realize their potential to alleviate environmental burdens before policy formulations. Western Australia (WA) is dominated by private cars, [...] Read more.
Alternative fuels for the transport sector are being emphasized due to energy security and environmental issues. Possible alternative fuel options need to be assessed to realize their potential to alleviate environmental burdens before policy formulations. Western Australia (WA) is dominated by private cars, accounting for around 72% vehicles with 87% of those using imported gasoline, and resulting in approximately 14% of greenhouse gas (GHG) emissions from the transport sector. There is an urgent need for WA to consider alternative transport fuels not only to reduce the environmental burden but also to avoid future energy security consequences. This study assesses the environmental life cycle assessment (ELCA) of transport fuel options suitable for WA. The study revealed that ethanol (E65), electric (EV) and plug-in electric vehicle (PHEV) options can decrease global warming potential (GWP) by 40%, 29% and 14%, respectively, when compared to gasoline. The EV and PHEV also performed better than gasoline in the fossil fuel depletion (FFD) and water consumption (WC) impact categories. Gasoline, however, demonstrated better environmental performance in all the impact categories compared to hydrogen and that was mainly due to the high electricity requirement during the production of hydrogen. The use of platinum in hydrogen fuel cells and carbon fibre in the hydrogen tank for hydrogen fuel cell vehicles (HFCV) and Li-ion battery for EVs are the most important sources of environmental impacts. The findings of the study would aid the energy planners and decision makers in carrying out a comparative environmental assessment of the locally-sourced alternative fuels for WA. Full article
(This article belongs to the Special Issue Transport Emissions and the Atmosphere)
Show Figures

Figure 1

19 pages, 6603 KiB  
Article
Observation and Source Apportionment of Trace Gases, Water-Soluble Ions and Carbonaceous Aerosol During a Haze Episode in Wuhan
by Zhengxu Gao, Xiaoling Wang, Lijuan Shen, Hua Xiang and Honglei Wang
Atmosphere 2019, 10(7), 397; https://doi.org/10.3390/atmos10070397 - 15 Jul 2019
Cited by 4 | Viewed by 2631
Abstract
As the new core region of the haze pollution, the terrain effect of sub-basin and water networks over the Twin-Hu Basin (THB) in the Yangtze River Middle-Reach (YRMR) had great impacts on the variations and distributions of air pollutants. In this study, trace [...] Read more.
As the new core region of the haze pollution, the terrain effect of sub-basin and water networks over the Twin-Hu Basin (THB) in the Yangtze River Middle-Reach (YRMR) had great impacts on the variations and distributions of air pollutants. In this study, trace gases (NH3, HNO3, and HCl), water-soluble ions (WSIs), organic carbon (OC), and elemental carbon (EC) were measured in PM2.5 from 9 January to 27 January 2018, in Wuhan using monitoring for aerosols and gases (MARGA) and a semi-continuous OC/EC analyzer (Model RT-4). The characteristics of air pollutants during a haze episode were discussed, and the PM2.5 sources were quantitatively analyzed on haze and non-haze days using the principal component analysis/absolute principal component scores (PCA/APCS) model. The average PM2.5 concentration was 122.61 μg·m−3 on haze days, which was 2.20 times greater than it was on non-haze days. The concentrations of secondary water soluble ions (WSIs) including NO3, SO42−, and NH4+ increased sharply on haze days, which accounted for 91.61% of the total WSIs and were 2.43 times larger than the values on non-haze days. The heterogeneous oxidation reactions of NO2 and SO2 during haze episodes were proven to be the major sources of sulfate and nitrate in PM2.5. On haze days, the concentrations of EC, primary organic carbon (POC), and secondary organic carbon (SOC) were 1.68, 1.69, and 1.34 times larger than those on non-haze days, the CO, HNO3, and NH3 concentrations enhanced and relatively low SO2, O3, and HNO2 levels were observed on haze days. The diurnal variations of different pollutants distinctly varied on haze days. The PM2.5 in Wuhan primarily originated from the secondary formation, combustion, dust, industry, and vehicle exhaust sources. The source contributions of the secondary formation + combustion sources to PM2.5 on haze days were 2.79 times larger than the level on non-haze days. The contribution of the vehicle exhaust + combustion source on haze days were 0.59 times the value on non-haze days. This description is supported by a summary of how pollutant concentrations and patterns vary in the THB compared to the variations in other pollution regions in China, which have been more completely described. Full article
Show Figures

Figure 1

25 pages, 3832 KiB  
Article
A Near-Field Gaussian Plume Inversion Flux Quantification Method, Applied to Unmanned Aerial Vehicle Sampling
by Adil Shah, Grant Allen, Joseph R. Pitt, Hugo Ricketts, Paul I. Williams, Jonathan Helmore, Andrew Finlayson, Rod Robinson, Khristopher Kabbabe, Peter Hollingsworth, Tristan C. Rees-White, Richard Beaven, Charlotte Scheutz and Mark Bourn
Atmosphere 2019, 10(7), 396; https://doi.org/10.3390/atmos10070396 - 15 Jul 2019
Cited by 31 | Viewed by 6207
Abstract
The accurate quantification of methane emissions from point sources is required to better quantify emissions for sector-specific reporting and inventory validation. An unmanned aerial vehicle (UAV) serves as a platform to sample plumes near to source. This paper describes a near-field Gaussian plume [...] Read more.
The accurate quantification of methane emissions from point sources is required to better quantify emissions for sector-specific reporting and inventory validation. An unmanned aerial vehicle (UAV) serves as a platform to sample plumes near to source. This paper describes a near-field Gaussian plume inversion (NGI) flux technique, adapted for downwind sampling of turbulent plumes, by fitting a plume model to measured flux density in three spatial dimensions. The method was refined and tested using sample data acquired from eight UAV flights, which measured a controlled release of methane gas. Sampling was conducted to a maximum height of 31 m (i.e. above the maximum height of the emission plumes). The method applies a flux inversion to plumes sampled near point sources. To test the method, a series of random walk sampling simulations were used to derive an NGI upper uncertainty bound by quantifying systematic flux bias due to a limited spatial sampling extent typical for short-duration small UAV flights (less than 30 min). The development of the NGI method enables its future use to quantify methane emissions for point sources, facilitating future assessments of emissions from specific source-types and source areas. This allows for atmospheric measurement-based fluxes to be derived using downwind UAV sampling for relatively rapid flux analysis, without the need for access to difficult-to-reach areas. Full article
(This article belongs to the Special Issue Measurement of Atmospheric Composition by Unmanned Aerial Systems)
Show Figures

Figure 1

17 pages, 1627 KiB  
Article
Attributing Air Pollutant Exposure to Emission Sources with Proximity Sensing
by Ricardo Piedrahita, Evan R. Coffey, Yolanda Hagar, Ernest Kanyomse, Katelin Verploeg, Christine Wiedinmyer, Katherine L. Dickinson, Abraham Oduro and Michael P. Hannigan
Atmosphere 2019, 10(7), 395; https://doi.org/10.3390/atmos10070395 - 13 Jul 2019
Cited by 11 | Viewed by 3982
Abstract
Biomass burning for home energy use contributes to negative health outcomes and environmental degradation. As part of the REACCTING study (Research on Emissions, Air quality, Climate, and Cooking Technologies in Northern Ghana), personal exposure to carbon monoxide (CO) was measured to gauge the [...] Read more.
Biomass burning for home energy use contributes to negative health outcomes and environmental degradation. As part of the REACCTING study (Research on Emissions, Air quality, Climate, and Cooking Technologies in Northern Ghana), personal exposure to carbon monoxide (CO) was measured to gauge the effects of introducing two different cookstove types over four intervention groups. A novel Bluetooth Low-Energy (BLE) Beacon system was deployed on a subset of those CO measurement periods to estimate participants’ distances to their most-used cooking areas during the sampling periods. In addition to presenting methods and validation for the BLE Beacon system, here we present pollution exposure assessment modeling results using two different approaches, in which time-activity (proximity) data is used to: (1) better understand exposure and behaviors within and away from homes; and (2) predict personal exposure via microenvironment air quality measurements. Model fits were improved in both cases, demonstrating the benefits of the proximity measurements. Full article
Show Figures

Figure 1

13 pages, 4852 KiB  
Article
An Assessment of the Temperature and Humidity of Atmospheric Infrared Sounder (AIRS) v6 Profiles Using Radiosonde Data in the Lee of the Tibetan Plateau
by Zhiwei Heng and Xingwen Jiang
Atmosphere 2019, 10(7), 394; https://doi.org/10.3390/atmos10070394 - 13 Jul 2019
Cited by 6 | Viewed by 2801
Abstract
Atmospheric Infrared Sounder (AIRS) products are important for weather prediction and climate monitoring in the lee of the Tibetan Plateau (TP), where the terrain is complex. However, the quality of the AIRS products in this region remains unclear due to the unavailability of [...] Read more.
Atmospheric Infrared Sounder (AIRS) products are important for weather prediction and climate monitoring in the lee of the Tibetan Plateau (TP), where the terrain is complex. However, the quality of the AIRS products in this region remains unclear due to the unavailability of upper-air observation. In this study, for the first time, we use an 8-year intensive radiosonde observation dataset from 11 sites to assess the quality of the AIRS version 6 products in the lee of the TP at both daytime and nighttime. The results indicate that, overall, the AIRS products have a dry and cold bias in the lee of the TP, and larger biases over the sites of higher altitude. AIRS temperature retrieval has a larger deficiency in low levels at nighttime, while a better representation of moisture is found below 600 hPa over the low-altitude sites. In the lee of the TP, the quality control flags for temperature and moisture should be considered individually. The AIRS profile products could be useful for synoptic analysis of air temperature, moisture, and climate monitoring in this region, and further improvements are needed in the near-surface and nighttime retrieval processes. Full article
(This article belongs to the Section Meteorology)
Show Figures

Figure 1

Previous Issue
Next Issue
Back to TopTop