Abstract
As the new core region of the haze pollution, the terrain effect of sub-basin and water networks over the Twin-Hu Basin (THB) in the Yangtze River Middle-Reach (YRMR) had great impacts on the variations and distributions of air pollutants. In this study, trace gases (NH3, HNO3, and HCl), water-soluble ions (WSIs), organic carbon (OC), and elemental carbon (EC) were measured in PM2.5 from 9 January to 27 January 2018, in Wuhan using monitoring for aerosols and gases (MARGA) and a semi-continuous OC/EC analyzer (Model RT-4). The characteristics of air pollutants during a haze episode were discussed, and the PM2.5 sources were quantitatively analyzed on haze and non-haze days using the principal component analysis/absolute principal component scores (PCA/APCS) model. The average PM2.5 concentration was 122.61 μg·m−3 on haze days, which was 2.20 times greater than it was on non-haze days. The concentrations of secondary water soluble ions (WSIs) including NO3−, SO42−, and NH4+ increased sharply on haze days, which accounted for 91.61% of the total WSIs and were 2.43 times larger than the values on non-haze days. The heterogeneous oxidation reactions of NO2 and SO2 during haze episodes were proven to be the major sources of sulfate and nitrate in PM2.5. On haze days, the concentrations of EC, primary organic carbon (POC), and secondary organic carbon (SOC) were 1.68, 1.69, and 1.34 times larger than those on non-haze days, the CO, HNO3, and NH3 concentrations enhanced and relatively low SO2, O3, and HNO2 levels were observed on haze days. The diurnal variations of different pollutants distinctly varied on haze days. The PM2.5 in Wuhan primarily originated from the secondary formation, combustion, dust, industry, and vehicle exhaust sources. The source contributions of the secondary formation + combustion sources to PM2.5 on haze days were 2.79 times larger than the level on non-haze days. The contribution of the vehicle exhaust + combustion source on haze days were 0.59 times the value on non-haze days. This description is supported by a summary of how pollutant concentrations and patterns vary in the THB compared to the variations in other pollution regions in China, which have been more completely described.
1. Introduction
Over the past several decades, rapid industrialization and urbanization, as well as a continuous increase of vehicle holdings, have caused unceasing deterioration of the air quality in China, which can reduce the visibility and impair human health, thus damaging the sustainable development of the economy and society [1,2,3,4,5]. In China, heavy pollution events are traditionally centralized in four regions including the North China Plain (NCP), Yangtze River Delta (YRD), Pearl River Delta (PRD), and Sichuan Basin (SB) [6,7,8]. However, the spatiotemporal variations of air pollutants have changed in recent years. For example, the PM2.5 concentration in the PRD has declined in recent years and was down to 32 μg·m−3 in 2016, meeting the Grade I National Ambient Air Quality Standard (<35 μg·m−3; http://www.mee.gov.cn/hjzl/zghjzkgb/lnzghjzkgb/). However, the extent of haze pollution has increased yearly over the Yangtze River Middle-Reach (YRMR) [9,10,11,12,13]. The Twin-Hu Basin (THB) has a special geographic location (based on the terrain effect of the sub-basin and the THB water networks) that has consequently resulted in a significant contribution from transported foreign pollutants [14,15,16]. Lu et al. [11] considered that regional transport acted as a crucial driver of haze pollution over Wuhan and that long-range transport contributed 60.6% of the PM2.5 concentration during a haze episode in 2014. Additionally, the YRMR includes a pivotal geographic location (Figure 1) that connects the major air pollution regions (NCP, YRD, PRD, SB, and Guangzhong Basin (GB)) in China through distinct transport channels. The regional transport of aerosols over the THB may have a vital impact on the atmospheric environment. Compared to the scale of investigations conducted in the other four pollution regions, the spatiotemporal variations of air pollutants, the formation mechanism of heavy pollution, and meteorological impact factors over the THB have scarcely been discussed.
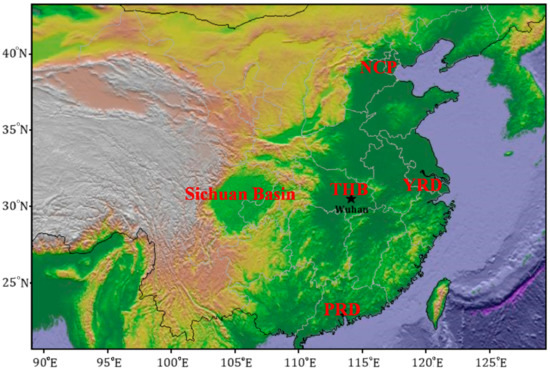
Figure 1.
The geography map, NCP: North China Plain, THB: Twin-Hu Basin, YRD: Yangtze River Delta, PRD: Pearl River Delta.
The urban agglomeration in the YRMR, with Wuhan as the core, is not only a growth pole for the development of the Yangtze River Economic Belt but also an important strategic pivot for the rise of the YRMR economy. In recent years, the air pollution in Wuhan has been increasingly serious, resulting in a mean visibility of less than 10 km in all seasons [17,18,19]. High fine particulate concentrations and relative humidity (RH) in the YRMR jointly cause the significant deterioration of regional visibility [10,11,20,21]. Hence, the pollution situation of the air environment in the YRMR is becoming increasingly serious [22,23,24]. As we know, regional haze pollution is closely related to the meteorological conditions, geographical location (e.g., the proximity to a sea or lake), terrain, economic development, and human population [1,25,26,27]. The sources of aerosol over the THB, are comprised of primary and secondary aerosols from local and surrounding areas and are intricate due to the dense emission sources of ships, traffic, and agriculture, and complex meteorological conditions [24]. Haze pollution is characterized by frequent occurrence in both urban cities and basins [12,28,29,30,31] and is comprised greatly of PM2.5 that originates mainly from industry and vehicle exhausts [1,32,33,34,35].
Water soluble ions (WSIs) generally account for one-third of particulate matter mass in the urban atmosphere and play a significant role in the Earth’s radiation balance, acting directly by scattering incoming solar radiation and indirectly by altering cloud properties because of the uptake of water vapor [36,37,38,39]. WSIs are also usually related to particle formation, growth, and evolution processes and can serve as a good indicator of the surface chemical reactions of particles [40]. Carbonaceous aerosols are one of the important components of atmospheric aerosols and account for approximately 20–50% of the total urban aerosols in China [41,42]. As the vital light-absorbing component in the air, black carbon (BC) can sharply reduce visibility [39,43]. Additionally, organic carbon (OC) has an equivalent or higher contribution relative to that of sulfate due to its scattering property [39]. OC normally comprises toxic and harmful substances such as polycyclic aromatic hydrocarbons, phthalate esters, and aldehyde and ketone carboxyl compounds, which can greatly damage human health [44].
Haze formation is usually accompanied by a sharp increase of air pollutants, especially aerosol concentrations. Li et al. [3] discovered that the average PM2.5 concentration was up to 281 μg·m−3 (range: 77–431 μg·m–3) during a haze-fog episode in Nanjing, which was 3.6 times greater than values during non-haze-fog episodes. Meanwhile, Zhang et al. [5] found that the average PM2.5 mass concentrations ranged from 113.0 μg·m–3 to 182.6 μg·m–3 during six haze episodes, which were more than eight times higher than those observed during clean periods. Regional haze pollution events have occurred in recent years due to the existence of an urban agglomeration economy in China [1,9]. Researchers have shown that great changes have been made concerning the chemical components of aerosol during haze pollution processes. Xiong et al. [22] found that the concentration of levoglucosan, K+, and OC increased by factors of 6.2, 2.3, and 2.0, respectively, during a haze pollution episode, which was induced by the biomass burning process in Wuhan. Cheng et al. [24] calculated that the concentrations of PM1.0 and WSIs on haze days were approximately two times higher than those on normal days during a continuous haze period in January 2013, and the WSI concentration accounted for 48.4% of the PM1.0 mass concentration. Guo et al. [28] considered that gaseous emissions of volatile organic compounds and nitrogen oxides from urban transportation and sulfur dioxide from regional industry are responsible for the high secondary PM formation during haze pollution processes in China. Hu et al. [29] found that carbonaceous particles and Na-K particles (0.6–1.2 μm) were more acidic. Ding et al. [43] deemed that black carbon could modify the planetary boundary layer meteorology and, hence, enhance haze pollution.
As a region with a high incidence of haze pollution, the characterization and identification of the causes of aerosol anomalies and heavy haze formation processes over the THB in the YRMR are challenging issues for an in-depth study in the atmospheric environment. Currently, few environmental observation results have been completely and systematically obtained and studied in the YRMR. Wuhan is the center city in central China (Figure 1), a core city in the Yangtze River economic belt, an important industrial base, a scientific and educational base, and a comprehensive transportation hub in China. Due to rapid economic development and urbanization, Wuhan faces serious particulate pollution, and haze days have occurred frequently in recent years because of rapid increases in vehicular traffic, high coal consumption, and intensive steel manufacturing [24]. However, synthetic studies concerning the variations of trace gases (HCl, HNO2, HNO3, and NH3), water-soluble ions (WSIs), and carbonaceous aerosols and their source apportionment are scarce. In this study, the trace gases (HCl, HNO2, HNO3, and NH3), water-soluble ions (WSIs), organic carbon (OC), and elemental carbon (EC) in PM2.5 were observed using a model ADI 2080 monitor for aerosols and gases in ambient air (MARGA) and a semi-continuous OC/EC analyzer (Model RT-4) from 9 January to 27 January 2018, in Wuhan. The characteristics of air pollutants during the haze episode were discussed, and the diurnal variations of air pollutants on haze and non-haze days were comparatively investigated; meanwhile, the PM2.5 sources were quantitatively analyzed on haze and non-haze days using the PCA/APCS model. It is hard to capture the comprehensive pollution features of aerosols in Wuhan throughout one pollution episode due to the complexity and uncertainty of aerosol sources and sinks. In this study, the time variations and source apportionment of air pollutants during a continuous haze episode were observed and analyzed in Wuhan. The resulting description is supported by a summary of how pollutant concentrations and patterns vary in the THB compared to variations in other pollution regions in China that have been more completely described. This study can deepen our understanding of the causes and mechanisms of atmospheric aerosol variations in the YRMR and enrich our scientific knowledge of the differences between heavy pollution mechanisms in distinct regions of China.
2. Materials and Methods
2.1. Site Description
Located in the YRMR plain, Wuhan features a plain terrain that is low in the middle (Figure 1), high in the east and south and at low latitudes in the west and north. It is Y-shaped and cut into three pieces by Yangtze River and Han River. According to the statistical bulletin of Wuhan national economic and social development in 2017, the permanent resident population was 10.90 million, the number of civilian cars was 2.61 million, and the GDP was 134.03 billion yuan in 2017. As shown in Figure 1, Wuhan is covered by rivers, lakes, and harbors, and the water area accounts for a quarter of the total area of the city. With the rapid economic development, the sources of atmospheric pollutants in Wuhan have become complicated. The city is very hot in the summer and is cold in the winter [24]. The spatiotemporal variations of air pollutants are complex due to the humid terrain of water networks.
2.2. Data Origins
Hourly PM2.5 and trace gas (O3, SO2, NO2, and CO) concentrations were downloaded from the Ministry of Ecology and Environment (MEE) of China website (http://106.37.208.233:20035/), Zhuankou district station (114°15′ E, 30°47′ N). WSIs, trace gases (HCl, HNO2, HNO3, and NH3), and carbonaceous aerosols were monitored in the air pollution complex laboratory of Wuhan (114°16′ E, 30°36′ N). The laboratory is located in the center urban of Wuhan, with an altitude of 25 m and is surrounded by residential areas with no blocking buildings or obvious industrial pollution sources. The monitoring data can reflect the air pollution level of the central city of Wuhan. The meteorological data were from the Wuhan meteorological station (114°03′ E, 30°36′ N). The observation time was from 9 January to 27 January 2018.
2.3. Instruments
A model ADI 2080 monitor for aerosols and gases in ambient air (MARGA, Applikon Analytical B.V., the Netherlands) with a Teflon-coated PM2.5 sampling inlet was used to measure the inorganic composition of gases (HCl, HNO2, HNO3, SO2, and NH3) and aerosols (Cl−, NO3−, SO42−, NH4+, Na+, K+, Mg2+, and Ca2+) in the air at an hourly temporal resolution. The MARGA instrument, which was developed and affirmed by the Energy Research Centre of the Netherlands, consists of sampling and analytical boxes [45]. The sampling box is comprised of a wet rotating denuder (WRD) and steam jet aerosol collector (SJAC), which are acceptable as effective and sound tools for absorbing gases and collecting aerosol (more than 99.7%), compared with traditional sampling means such as filter methods [46,47,48]. The detailed principles of the instrument can be found in related articles [37,49].
Hourly PM2.5, OC, and EC concentrations were measured by a semi-continuous thermal-optical transmittance (TOT) carbon analyzer (Model RT-4, Sunset Laboratory Inc., Tigard, OR, USA). The validation of the Sunset field carbon analyzer can be found in related references [50,51]. Each measurement cycle was comprised of 45 min of sampling and 15 min of OC/EC analysis. The detailed principles of the instrument can be found elsewhere [52].
2.4. Ion Balance
The equivalent concentrations of cations and anions can be calculated according to the following formula:
Figure 2 shows a high correlation between the equivalent concentrations of cations and anions, with a correlation coefficient of 0.992, which suggests that these ions can well represent the major WSIs in PM2.5. The slope of the linear dispersion is greater than 1, illustrating an alkaline nature of these WSIs, which was probably due to the undetected anions of NO2− and CO32−.
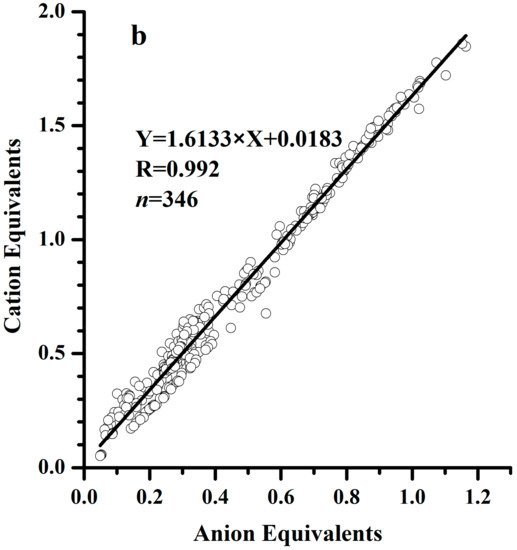
Figure 2.
The equivalent concentrations of cations and anions.
2.5. Calculation of Secondary Organic Carbon (SOC)
Chow et al. [53] considered that secondary organic carbon (SOC) could be formed when the ratio of OC/EC was larger than 2. In this study, the SOC was calculated by the method proposed by Turpin et al. [54]:
where OCpri is the concentration of primary organic carbon (unit: μg·m−3) and (OC/EC)pri is the ratio of primary OC to primary EC. However, the value of (OC/EC)pri is difficult to confirm due to the complexity of OC sources. Hence, the lowest ratio of OC/EC is used to replace the value of (OC/EC)pri [55]:
where (OC/EC)min is the lowest ratio of OC/EC observed.
where SOC is the concentration of secondary organic carbon (unit: μg·m−3) and TOC is the concentration of total organic carbon (unit: μg·m−3).
2.6. NOR and SOR
The nitrate oxidation rate (NOR) and sulfate oxidation rate (SOR) are usually used to reflect the secondary formation of gaseous NO2 and SO2. The larger the NOR and SOR, the more secondary WSIs are produced by the heterogeneous oxidation reaction of NO2 and SO2 in the air. The calculation formulas of NOR and SOR are listed as followed:
where [SO42−], [SO2], [NO3−], and [NO2] represent the molar concentrations of the corresponding constituents.
2.7. PCA/APCS Receptor Model
Principal component analysis (PCA) is a multivariate analysis model for dimensionality reduction. The advantage of this model is using unrelated major components to replace numerous internally related variables in the context of minimizing the formation loss as much as possible. The procedure of the model contains three steps: (1) Singular value decomposition (SDV), (2) selection of the dimension, and (3) rotations.
The absolute principal component scores (APCS) method was proposed by Thurston and Spengler [56] and was used to estimate the quantitative contribution of each factor to each compound. The calculation formulas for the APCS are listed below:
where is the standardized value, assuming that the concentration of the observed compound is 0, and is the factor score, assuming that the concentration is 0 on the sampling day. is the factor fraction of each compound calculated by the PCA method for real samples.
refers to the score coefficient of the rotation factors, and m, p, and n refer to the number of chemical species, principal component factors and samples. (b0)i is the regression coefficient of each factor. bji × APCSjk is the average contribution of compound from source . The detailed principles of the PCA/APCS model can be found elsewhere [56,57,58].
3. Results and Discussion
3.1. Summary of the Haze Episode
The temperature fluctuated during 9–12 January due to the impact of cold air (Figure 3), which caused the RH to fluctuate sharply as a result of the dense water network in Wuhan. For example, the temperature was as low as −5 °C and the RH was up to 95% at 23:00 on 10 January. On 11 January, the values of 10.1 °C and 35% for the temperature and RH, respectively, were observed. It can be seen that the O3 concentration and visibility were both high during the daytime during the period of 9–14 January, and the high temperatures and low RH levels were responsible for the daytime O3 formation. At night, the visibility was low owing to the formation of fog under low temperatures and high RH values (e.g., the visibility, temperature and RH were 2.8 km, −4.7 °C and 92%, respectively, on 11 January and 1.5 km, −3.4 °C and 94% on 12 January). The PM2.5 concentrations fluctuated greatly during 9–14 January, with an average value of 58.9 μg·m−3. Consequently, the fog process dominated instead of the haze pollution episode, which led to the low visibility, with an average of 7.35 km.
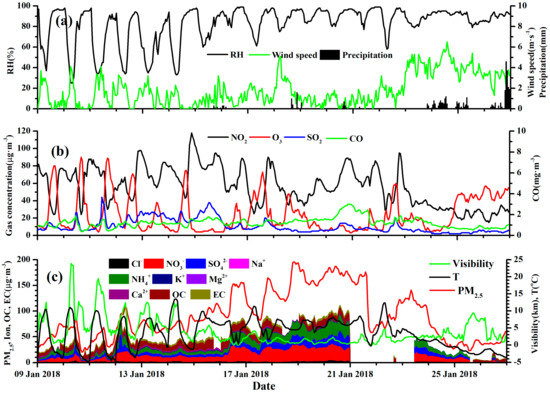
Figure 3.
Time series of major meteorological elements (a), trace gases (b) and major air pollutants (c) during the observation period.
After 14 January, the mideastern part of China was dominated by latitude circulation with no significant trough ridge activity and was little impacted by cold air because the ground high pressure was located west of Baikal. Wuhan was under the control of the equalizing pressure field of the cold front, with a weak horizontal pressure gradient and low wind speed near the ground, which was unfavorable for pollutant diffusion. Hence, the PM2.5 concentrations gradually accumulated and mostly exceeded 75 μg·m−3, with a mean value of 124.7 μg·m−3 from 08:00 on 14 January to 00:00 on 24 January. Meanwhile, the average visibility and RH were 1.87 km and 87.8%, respectively, during the above period, which was attributed to the continuous fog-haze process.
During 22–25 January, the polar vortex unceasingly moved eastward and southward, and the horizontal trough located in eastern Mongolia became vertical, which induced the southward movement of cold air. Wuhan was impacted by the cold air periphery on the night of 21 January. The temperature and RH were −0.3 °C and 98% at 19:00 on that day when a strong fog process occurred, which resulted in a low visibility of less than 100 m and a sharp decrease of the PM2.5 concentration. The temperature reached a maximum of 12.3 °C at 07:00 on 22 January, after which the temperature declined rapidly due to the impact of cold air. The wind speed was high, mostly exceeding 4 m·s−1 (Figure 3). Additionally, a persistent precipitation process occurred, leading to a quick scavenging effect of air pollutants. The haze pollution episode consequently terminated.
3.2. Chemical Component Variations on Haze and non-Haze Days
In this study haze days were defined as those with a visibility of less than 10 km, no precipitation, and a PM2.5 concentration of more than 75 μg·m−3. Non-haze days were considered to occur when the visibility exceeded 10 km and the PM2.5 concentration was less than 75 μg·m−3. As shown in Figure 3, the haze episode occurred from 08:00 on 14 January to 02:00 on 24 January. The PM2.5 concentrations normally exceeded 75 μg·m−3, despite the low PM2.5 values caused by the precipitation process, and the visibility was uniformly lower than 10 km. This can be defined as a continuous haze episode. Table 1 shows that the different trace gases varied distinctly, with high CO (1.48 mg·m−3), HNO3 (0.67 μg·m−3), and NH3 (6.23 μg·m−3) concentrations and low SO2 (10.56 μg·m−3), O3 (18.60 μg·m−3), and HNO2 (0.55 μg·m−3) concentrations on haze days, which were 1.49, 1.34, and 2.19 times higher and 0.77, 0.61, and 0.60 times lower than those on non-haze days. NO2 and HCl concentrations showed little discrepancy on haze and non-haze days, with average concentrations of 61.85 μg·m−3 and 0.25 μg·m−3 on haze days, which were 1.04 and 0.93 times the levels on non-haze days.

Table 1.
Chemical components on haze and non-haze days.
The average concentration of PM2.5 was 122.61 μg·m−3 on haze days and was 2.20 times higher than that on non-haze days. The total WSI concentration in PM2.5 was 52.55 μg·m−3 and 23.85 μg·m−3 on haze and non-haze days, respectively, which accounted for 42.86% and 42.76% of the PM2.5. The WSI concentrations in PM2.5 were ranked in the order of NO3− > NH4+ > SO42− > Cl− > Ca2+ > K+ > Mg2+ > Na+ on haze days and NO3− > NH4+ > SO42− > Ca2+ > Cl− > K+ > Na+ > Mg2+ on non-haze days. NO3−, NH4+, and SO42− ions were dominant and occupied 91.61% and 83.10% of the total WSIs and 39.27% and 35.53% of the PM2.5 on haze and non-haze days. Table 1 shows that the concentrations of NO3−, NH4+, and SO42− on haze days were 2.54, 2.48, and 2.18 times larger than those on non-haze days. The increasing range of SO42− was in accordance with that of the PM2.5 during the haze episode, while NO3- and NH4+ had more highly increasing ranges than did PM2.5, which indicated that the latter two ions contributed more to the PM2.5 concentration. Similarly, the precursor gases of HNO3 and NH3 had higher concentrations on haze days than on non-haze days. However, SO2 followed a contrary pattern, which suggested that the heterogeneous reactions of HNO3 and NH3 contributed greatly to the PM2.5 mass concentration.
Carbonaceous aerosol had higher concentrations on haze days, according to Table 1. The concentrations were 16.93 μg·m−3 and 10.72 μg·m−3 on haze and non-haze days, respectively, and these accounted for 13.81% and 19.22% of the PM2.5. Although the concentrations of carbonaceous aerosol increased on haze days, the percentage in the PM2.5 decreased, revealing a relatively small contribution of carbonaceous aerosol to the haze pollution. However, the average EC concentration on haze days was 4.27 μg·m−3 and was 1.68 times larger than that on non-haze days. As a vital absorbing aerosol component, the enhancement of EC can accelerate the aerosol extinction coefficient, thus reducing the visibility. The primary organic carbon (POC) and SOC values were 8.25 μg·m−3 and 4.42 μg·m−3, which were 1.69 and 1.34 times higher than those on non-haze days.
3.3. Diurnal Variations of Pollutants
3.3.1. Diurnal Variations of PM2.5 and Trace Gases
According to Figure 4, the PM2.5 concentrations on haze days were far higher than those on non-haze days, and the diurnal variations of the concentrations changed evidently as well. PM2.5 presented a bimodal distribution on non-haze days, peaking at 07:00–10:00 and 20:00–22:00, which was caused by diurnal variations of the boundary layer and human activities. In a diurnal cycle, the atmosphere is unstable during daytime due to strong convection driven by thermals rising from the land surface as well as the turbulent shear production generated by synoptic scale motion, while it is stabilized at nighttime since the land surface is sufficiently cooled [59]. The land surface is least heated in winter, with the weakest solar radiation and the shortest daytime duration, resulting in the most stable UBL in winter on average [60]. However, a trimodal distribution of PM2.5 occurred, peaking at 03:00–04:00, 11:00–14:00, and 20:00–22:00, on haze days. The PM2.5 peak time corresponded to low wind speeds and high RH values, based on Figure 5, and these conditions favored pollutant accumulation.
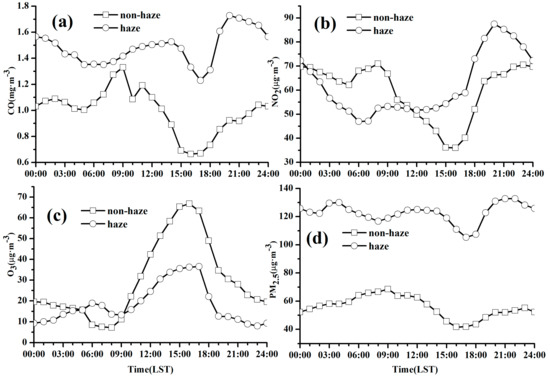
Figure 4.
Diurnal variations of CO (a), NO2 (b), O3 (c) and PM2.5 (d).
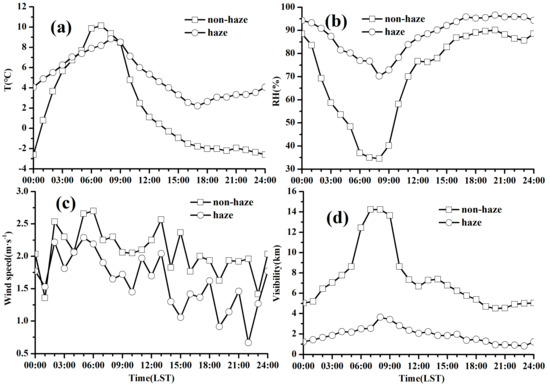
Figure 5.
Diurnal variation of T (a), RH (b), wind speed (c) and visibility(d)
O3 exhibited a unimodal distribution on both haze and non-haze days, while the peak on haze days was much lower. A bimodal distribution of CO occurred on both haze and non-haze days. The first CO peak occurred at 13:00 on haze days and lagged by 5 h compared to that on non-haze days. The second CO peak on haze days was 3 h earlier than that on non-haze days, appearing at 20:00. The diurnal variation of NO2 was similar to that of CO, with the first peak lagging by 1–2 h and the second peak 3 h ahead of time. Contrary to NO2, the first CO peak on haze days was larger than that on non-haze days. The second peaks of CO and NO2 were more closely related to vehicle exhausts. The pollutant impact of the vehicle exhausts was enhanced by the stable conditions of the boundary layer, the peak concentrations of CO and NO2 can reach up to 1.73 mg·m−3 and 87.4 μg·m−3, respectively, at 20:00, which were 1.88 and 1.32 times greater than those on non-haze days.
3.3.2. Diurnal Variations of Chemical Components
The diurnal variations of NH4+, NO3−, and SO42− were similar on haze days, with low concentrations in the daytime and high concentrations at night, the peaks of which occurred at 03:00–04:00, 14:00, and 20:00–22:00, respectively. The three ions had positive correlations with the RH, as shown in Figure 5. The heterogeneous reactions of gaseous NH3, NO2, and SO2 on the surfaces of aerosols may generate ammonium, nitrate, and sulfate under relatively high RH levels. As shown in Figure 5, the diurnal variations of RH were slighter on haze days, revealing a small difference between diurnal and nocturnal RH values. Moreover, the diurnal variations of NH3, NO2, and SO2 on haze days were smaller than those on non-haze days according to Figure 6, i.e., the high RH on haze days favored the liquid-phase reactions of trace gases that diminished the concentration difference between day and night. As a result, the concentrations of NH4+, NO3−, and SO42− on haze days were much higher than those on non-haze days, and the levels during the daytime were larger than those during the nighttime on haze days, as well. These secondary WSIs can accelerate the aerosol hygroscopicity, thus increasing the aerosol extinction properties and exacerbating haze pollution.
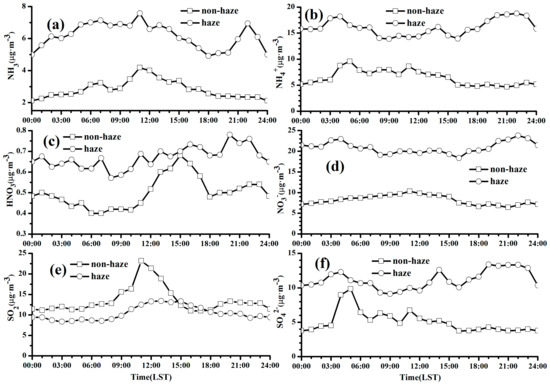
Figure 6.
Diurnal variations of NH3 (a), NH4+ (b), HNO3 (c), NO3− (d), SO2 (e), and SO42− (f).
NH3 had a bimodal distribution, peaking at 06:00–07:00 and 11:00–12:00 on non-haze days. The first peak time corresponded to high temperatures and low RH values (Figure 5), which favored NH3 formation and inhibited the heterogeneous reaction of NH3. The second NH3 peak occurred under conditions of high wind speed and may be partly from transport processes. Figure 6 shows that the NH4+ concentration was high during the period of 03:00–12:00 on non-haze days, despite the low RH at 06:00–08:00, which illustrated the contribution of foreign transport to the local NH4+ level, as well. The NH3 concentration was high on haze days, and its diurnal variation was identical to that of the temperature, with a trough at 17:00–19:00, when the low temperature inhibited NH3 volatilization.
The diurnal variation of HNO3 exhibited a unimodal distribution on non-haze days, peaking at 15:00. As a photochemical reaction product, the HNO3 concentration increased after sunrise and gradually decreased along with the weakening of solar radiation. On haze days, HNO3 had a disorderly diurnal variation that was mainly impacted by the wind speed. SO2 presented a unimodal distribution on haze and non-haze days, peaking at 12:00–15:00, while the SO2 concentration was much lower on haze days.
Figure 7 shows that the diurnal variation of Cl− had a bimodal distribution, peaking at 03:00–05:00 and 20:00–22:00 on haze days. However, the distribution of Cl− was disorderly on non-haze days, with multiple peaks, the peak times of which were in accordance with those of Na+. The Na+, Mg2+, and Ca2+ ions had similar diurnal variations on non-haze days, with multiple peaks. Figure 5 illustrates that these three ions had analogous variations with that of wind speed on non-haze days and that soil dust was responsible for their sources. The diurnal variation of Na+ on haze days was similar to that on non-haze days, suggesting an identical Na+ source. The Ca2+ and Mg2+ ions had comparable diurnal variations on haze days, with an ascending concentration after 06:00. According to Figure 5, haze days featured a low wind speed, at mostly less than 2 m·s−1, during the daytime and high RH levels exceeding 70%. The stable synoptic weather was attributed to the increasing concentrations of Ca2+ and Mg2+ on haze days. K+ had a trimodal distribution, peaking at 05:00–07:00, 11:00, and 23:00 on haze days and at 02:00, 09:00, and 23:00 on non-haze days. The HNO2 concentration changed slightly throughout the entire day on haze days and exhibited a bimodal distribution, peaking at 08:00–09:00 and 15:00–16:00 on non-haze days, mainly originating from vehicle exhausts.
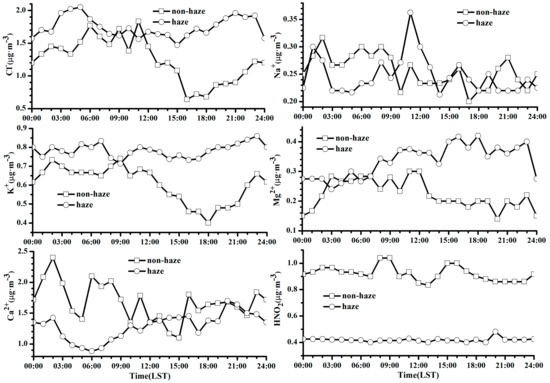
Figure 7.
Diurnal variations of major WSIs.
3.3.3. Diurnal Variation of Carbonaceous Aerosol
According to Figure 8, EC shows a bimodal distribution on non-haze days, peaking at 07:00–09:00 and 20:00–23:00, mainly originating from vehicle exhausts. On haze days, EC sources may be from the foreign transport from surrounding areas in addition to the local emissions, and the diurnal variation of EC had multiple peaks accordingly. A trimodal distribution occurred for OC on both haze and non-haze days, peaking at 06:00–08:00, 14:00–16:00, 20:00–21:00, and 01:00, 11:00, and 20:00. POC had an identical variation to that of EC on haze and non-haze days, suggesting a similar source of both POC and EC. The SOC had a trimodal distribution on haze and non-haze days, peaking at 5:00–7:00, 12:00–14:00, and 20:00–22:00; however, the sustained time of SOC peaks was much longer on haze days, which indicated an intensive SOC reaction during the haze episode.
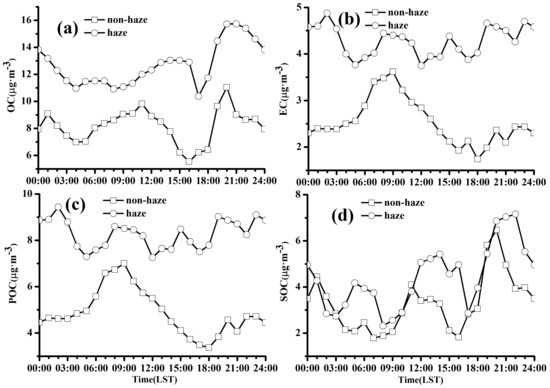
Figure 8.
Diurnal variation of OC (a), EC (b), POC (c) and SOC (d).
3.4. NOR and SOR
The NOR values were calculated to be 0.15 and 0.09 while the SOR values were 0.30 and 0.19 on haze and non-haze days. The values of NOR and SOR were larger on haze days, all exceeding 0.1. The heterogeneous oxidation reactions of NO2 and SO2 during the haze episode were the major formation sources of sulfate and nitrate in PM2.5. Figure 9 shows that the NOR exhibited a bimodal distribution on haze days, peaking at 03:00–07:00 and 12:00–15:00, while it exhibited a unimodal distribution on non-haze days, peaking at 15:00. The photochemical reaction of NO2 may generate nitrate on non-haze days; hence, NOR began to increase at 09:00 and peaked at 15:00. However, more nitrate may be produced from heterogeneous reactions on haze days, and as a result, the NOR value during the night was larger. A trimodal distribution occurred for SOR on haze days, peaking at 03:00–04:00, 14:00-15:00, and 19:00–22:00, and a bimodal distribution occurred on non-haze days, peaking at 04:00–05:00 and 13:00–15:00. The nighttime peak of SOR was larger than the daytime peak.
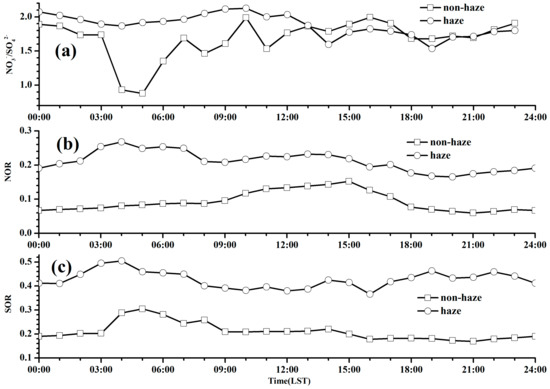
Figure 9.
Diurnal variations of NO3−/SO42− (a), nitrate oxidation rate (NOR) (b) and sulfate oxidation rate (SOR) (c).
A related study demonstrated that the ratio of NO3−/SO42− could be used to reflect whether the nitrogen and sulfur in the air are from stationary or mobile sources [34]. These compounds are from a predominantly stationary source if the ratio of NO3−/SO42− is less than 1 and from a mobile source otherwise [34]. The ratio of NO3−/SO42− was 1.88 and 1.68 on haze and non-haze, respectively, days in our study, which indicated that a mobile source contributed greatly to the PM2.5 in Wuhan. Figure 9 shows that the ratio of NO3−/SO42− had a trimodal distribution, peaking at 07:00, 10:00, and 16:00, and fluctuated throughout the day on non-haze days. A bimodal distribution was presented for the ratio of NO3−/SO42−, peaking at 08:00–09:00 and 15:00–17:00, but these peaks changed slightly on haze days.
3.5. Source Apportionment of Pollutants
Table 2 shows that three factors were resolved on non-haze days. Factor 1 was characterized by high loads of NO3−, SO42−, NH3, and NH4+, which are typical secondary source components. Additionally, Cl−, K+, and EC ions that originated from coal burning or biomass burning processes [61,62] were present in high loads in factor 1. Therefore, factor 1 represented secondary formation and combustion sources, which accounted for ~28.46% of the total variance. Factor 2 was strongly loaded with SO2, NH3, Na+, Mg2+, and Ca2+. Mg2+ and Ca2+ are typically associated with fugitive dust components [63], and SO2 is mainly from industrial coal burning processes [64]. Urban NH3 may be from industrial emissions or vehicle exhaust [65]. Hence, factor 2 was attributed to fugitive dust and industrial sources. Factor 3 was dominated by CO, NO2, OC, and EC, suggesting that their concentrations were impacted by vehicle exhaust and coal burning [62,63].

Table 2.
Results of the principal component analysis (PCA).
There were three primary source types on haze days: Factor 1, which was secondary formation + combustion sources, accounted for 37.52% of the total variance; Factor 2, which was fugitive dust + industry sources, comprised 22.77% of the total variance; and Factor 3, which was vehicle exhaust + coal burning sources, comprised 12.66% of the total variance.
Factor 1, representing the secondary formation and combustion sources, had a source contribution ratio of 13.1% on non-haze days and up to 36.58% on haze days, as seen in Figure 10. High (low) RH values and low (high) wind speed (1.6 m·s−1) were dominant, with average values of 88.1% (71.3%) and 1.6 m·s−1 (2.1 m·s−1) on haze (non-haze) days. Stable synoptic weather promoted pollutant accumulation near the ground, and high RH values favored the heterogeneous reaction of precursor gases; consequently, the contribution ratio of factor 1 increased sharply during the haze episode.
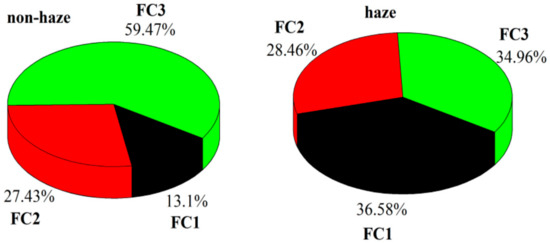
Figure 10.
Contribution ratios of distinct sources on haze and non-haze days.
The contribution ratio of factor 2, representing fugitive dust + industry sources, changed slightly, with values of 28.46% and 27.43% on haze and non-haze days. Fugitive dust had a higher contribution ratio compared to that of industrial sources. In urban areas, fugitive dust is largely from road dust with a relatively stable source. Furthermore, the coarse particles generated from fugitive dust have a short residence time in the air, which led to the small discrepancy between haze and non-haze days. Factor 3 had a contribution ratio of 59.47% on non-haze days, which demonstrated that vehicle exhaust and coal burning were the major PM2.5 sources in Wuhan. On haze days, factor 3 had a contribution ratio of 34.96%, which was only 1.62% lower than that of factor 1, illustrating the significant pollution contributions from vehicle exhaust and coal burning during the haze episode, the sources of which can also release amounts of precursor gases that are capable of generating secondary aerosols.
4. Conclusions
The “sub-basin” terrain in the Twin-Hu region of the YRMR favors the accumulation of atmospheric pollutants. Additionally, the dense rivers and numerous lakes over the THB constitute a unique regional “water network”, which makes the area abundant with moisture. As a result, haze pollution frequently occurs in this region. In this paper, the trace gases of NH3, HNO3, and HCl; water-soluble ions (WSIs); organic carbon (OC); and elemental carbon (EC) in PM2.5 were observed using MARGA and a carbon analyzer during a continuous fog-haze pollution episode from 7 January to 27 January 2018, in Wuhan. The average PM2.5 concentration was 122.61 μg·m−3 on haze days, which was 2.20 times larger than that on non-haze days. The concentrations of NO3−, NH4+, and SO42− were 20.87, 16.07, and 11.2 μg·m−3 on haze days, which were 2.54, 2.48, and 2.18 times higher than those on non-haze days respectively. These three types of WSIs occupied 91.61% and 83.10% of the total WSIs and 39.27% and 35.53% of the PM2.5 on haze and non-haze days, respectively. The heterogeneous oxidation reactions of NO2 and SO2 were the major nitrate and sulfate sources in PM2.5. The mean concentrations of EC, POC, and SOC were 4.27 μg·m−3, 8.25 μg·m−3, and 4.42 μg·m−3, respectively, on haze days and were 1.68, 1.69, and 1.34 times larger than those on non-haze days. Trace gases distinctly varied, with high CO, HNO3, and NH3 concentrations and relatively low SO2, O3, and HNO2 concentrations during the haze episode. The increment of secondary WSIs under high RH was the major reason for the haze pollution.
The diurnal variations of different pollutants were distinct on haze days. They exhibited unimodal distributions of O3 and SO2; bimodal distributions of CO, NO2, NH3, Cl−, and OC; trimodal distributions of PM2.5, NH4+, NO3−, SO42−, K+, and SOC; and multipeak distributions of HNO3, EC, Na+, and Mg2+. Bimodal and unimodal distributions occurred for NOR on haze and non-haze days, respectively. Meanwhile, SOR exhibited a trimodal and bimodal distribution on haze and non-haze days, respectively.
The source apportionment of PM2.5 was quantitatively analyzed using the PCA/APCS model in Wuhan. PM2.5 mainly originated from secondary formation, combustion sources, fugitive dust, and industry and vehicle exhaust sources on haze and non-haze days. Factor 1, representing the secondary formation and combustion sources, had a source contribution ratio of 13.1% on non-haze days and of up to 36.58% on haze days. The contribution ratio of factor 2, representing fugitive dust + industry sources slightly changed, with values of 28.46% and 27.43% on haze and non-haze days, respectively. Factor 3, comprising vehicle exhaust and combustion sources, had a contribution ratio of 34.96% and 59.47% on haze and non-haze days, respectively.
Author Contributions
Conceptualization, H.W.; Methodology, X.W., L.S. and Z.G.; Visualization, L.S. and Z.G.; Investigation, Z.G. and H.X.; Writing—Original Draft Preparation, Z.G. and L.S.; and Writing—Review and Editing, L.S., Z.G., X.W. and H.W.
Funding
This work was supported by the National Key Research and Development Program of China (2017YFC0212603), the National Natural Science Foundation of China (41805096 and 41830965), the Natural Science Foundation of Jiangsu Province (BK20180801), the Natural Science Research Project for Universities of Jiangsu Province, China (18KJB170011), the Opening Project of Shanghai Key Laboratory of Atmospheric Particle Pollution and Prevention (LAP3) (FDLAP18006) and the Startup Foundation for Introducing Talent of NUIST (2016r040).
Acknowledgments
The authors acknowledge the support from Bo Zhu for the generation of this manuscript.
Conflicts of Interest
The authors declare no conflict of interest.
References
- Huang, R.J.; Zhang, Y.; Bozzetti, C.; Ho, K.F.; Cao, J.J.; Han, Y.; Daellenbach, K.R.; Slowik, J.G.; Platt, S.M.; Canonaco, F.; et al. High secondary aerosol contribution to particulate pollution during haze events in China. Nature 2014, 514, 218–222. [Google Scholar] [CrossRef] [PubMed]
- Gao, J.; Woodward, A.; Vardoulakis, S.; Kovats, S.; Wilkinson, P.; Li, L.; Xu, L.; Li, J.; Yang, J.; Li, J.; et al. Haze, public health and mitigation measures in China: A review of the current evidence for further policy response. Sci. Total Environ. 2017, 578, 148–157. [Google Scholar] [CrossRef] [PubMed]
- Li, H.; Wu, H.; Wang, Q.; Yang, M.; Li, F.; Sun, Y.; Qian, X.; Wang, J.; Wang, C. Chemical partitioning of fine particle-bound metals on haze-fog and non-haze-fog days in Nanjing, China and its contribution to human health risks. Atmos. Res. 2017, 183, 142–150. [Google Scholar] [CrossRef]
- Shen, L.; Wang, H.; Lü, S.; Zhang, X.; Yuan, J.; Tao, S.; Zhang, G.; Wang, F.; Li, L. Influence of pollution control on air pollutants and the mixing state of aerosol particles during the 2nd world internet conference in Jiaxing, China. J. Clean. Prod. 2017, 149, 436–447. [Google Scholar] [CrossRef]
- Zhang, R.; Sun, X.; Shi, A.; Huang, Y.; Yan, J.; Nie, T.; Yan, X.; Li, X. Secondary inorganic aerosols formation during haze episodes at an urban site in Beijing, China. Atmos. Environ. 2018, 177, 275–282. [Google Scholar] [CrossRef]
- Xu, X.; Zhao, T.; Liu, F.; Gong, S.L.; Kristovich, D.; Lu, C.; Guo, Y.; Cheng, X.; Wang, Y.; Ding, G. Climate modulation of the Tibetan Plateau on haze in China. Atmos. Chem. Phys. 2016, 16, 1365–1375. [Google Scholar] [CrossRef]
- Zhao, H.; Zhang, X.; Zhang, S.; Chen, W.; Tong, D.; Xiu, A. Effects of agricultural biomass burning on regional haze in China: A review. Atmosphere 2017, 8, 88. [Google Scholar] [CrossRef]
- Che, H.; Zhang, X.; Li, Y.; Zhou, Z.; Qu, J.J. Horizontal visibility trends in China 1981–2005. Geophys. Res. Lett. 2007, 34, L24706. [Google Scholar] [CrossRef]
- Qin, K.; Wu, L.; Wong, M.; Letu, H.; Hu, M.; Lang, H.; Sheng, S.; Teng, J.; Xiao, X.; Yuan, L. Trans-boundary aerosol transport during a winter haze episode in China revealed by ground-based Lidar and CALIPSO satellite. Atmos. Environ. 2016, 141, 20–29. [Google Scholar] [CrossRef]
- Liao, Y.; Wu, X.; Pan, Z.; Zhao, F.; Zhu, Y.; Duan, L.; Li, C.; Li, Y.; Cui, W.; Li, Q. Climatic characteristics of haze in Hunan province during 1961–2006. Adv. Climate Change Res. 2007, 5, 260–265. [Google Scholar]
- Lu, M.; Tang, X.; Wang, Z.; Gbaguidi, A.; Liang, S.; Hu, K.; Wu, L.; Wu, H.; Huang, Z.; Shen, L. Source tagging modeling study of heavy haze episodes under complex regional transport processes over Wuhan megacity, central China. Environ. Poll. 2017, 231, 612–621. [Google Scholar] [CrossRef] [PubMed]
- Che, H.; Zhang, X.; Li, Y.; Zhou, Z.; Qu, J.J.; Hao, X. Haze trends over the capital cities of 31 provinces in China, 1981–2005. Theor. App. Climatol. 2009, 97, 235–242. [Google Scholar] [CrossRef]
- Sun, E.; Xu, X.; Che, H.; Tang, Z.; Gui, K.; An, L.; Lu, C.; Shi, G. Variation in MERRA-2 aerosol optical depth and absorption aerosol optical depth over China from 1980 to 2017. J. Atmos. Sol. Terr. Phy. 2019, 186, 8–19. [Google Scholar] [CrossRef]
- Zhao, T.; Liu, D.; Zheng, X.; Yang, L.; Gu, X.; Hu, J.; Shu, Z.; Chang, J.; Wu, X. Revealed variations of air quality in industrial development over a remote plateau of Southwest China: An application of atmospheric visibility data. Meteorol. Atmos. Phys. 2017, 129, 1–9. [Google Scholar] [CrossRef]
- Zhao, S.; Yu, Y.; Yin, D.; He, J.; Liu, N.; Qu, J.; Xiao, J. Annual and diurnal variations of gaseous and particulate pollutants in 31 provincial capital cities based on in situ air quality monitoring data from China national environmental monitoring center. Environ. Int. 2016, 86, 92–106. [Google Scholar] [CrossRef]
- Xu, X.; Wang, Y.; Zhao, T.; Cheng, X.; Meng, Y.; Ding, G. “Harbor” effect of large topography on haze distribution in eastern China and its climate modulation on decadal variations in haze. Chin. Sci. Bull. 2015, 60, 1132–1143. [Google Scholar] [CrossRef]
- Chen, Y.; Xie, S. Spatiotemporal pattern and regional characteristics of visibility in China during 1976–2010. Chin. Sci. Bull. 2014, 59, 3054–3065. [Google Scholar] [CrossRef]
- Su, T.; Xu, M.; Zhou, X.; Yang, Z.; Yuan, J.; Zhang, H. Study on the variation characteristics of haze weather in Hubei province during 1980–2012. Agr. Sci. Technol. 2015, 16, 176. [Google Scholar]
- Ma, D.; Li, L.; Ju, Y. Climate characteristics of haze days and analysis of summer haze weather event in Hubei province. Environ. Sci. Technol. 2015, 38, 148–153. [Google Scholar]
- Zhang, F.; Wang, Z.W.; Cheng, H.R.; Lv, X.P.; Gong, W.; Wang, X.M.; Zhang, G. Seasonal variations and chemical characteristics of PM2.5 in Wuhan, central China. Sci. Total Environ. 2015, 518, 97–105. [Google Scholar] [CrossRef]
- Chen, N.; Xu, K.; Cao, Z.; Liu, D.; Hu, H.; Quan, J.; Tian, Y.; Shen, F. Analysis on the pollution levels of atmospheric particles and the correlation of pollutants in Hubei province. Environ. Sci. Technol. 2016, 39, 194–198. [Google Scholar]
- Xiong, Y.; Zhou, J.; Schauer, J.J.; Yu, W.; Hu, Y. Seasonal and spatial differences in source contributions to PM2.5 in Wuhan, China. Sci. Total Environ. 2017, 577, 155–165. [Google Scholar] [CrossRef] [PubMed]
- Zhang, M.; Ma, Y.; Gong, W.; Zhu, Z. Aerosol optical properties of a haze episode in Wuhan based on ground-based and satellite observations. Atmosphere 2014, 5, 699–719. [Google Scholar] [CrossRef]
- Cheng, H.; Gong, W.; Wang, Z.; Zhang, F.; Wang, X.; Lv, X.; Liu, J.; Fu, X.; Zhang, G. Ionic composition of submicron particles (PM1.0) during the long-lasting haze period in January 2013 in Wuhan, central China. J. Environ. Sci. 2014, 26, 810–817. [Google Scholar] [CrossRef]
- Wang, H.; Shen, L.; Zhu, B.; Kang, H.; Hou, X.; Miao, Q.; Yang, Y.; Shi, S. Spatial and temporal distributions of air pollutants and size distribution of aerosols over central and Eastern China. Arch. Environ. Con. Tox. 2017, 72, 481–495. [Google Scholar] [CrossRef] [PubMed]
- Wu, J.; Zhang, P.; Yi, H.; Qin, Z. What causes haze pollution? An empirical study of PM2.5 concentrations in Chinese cities. Sustainability 2016, 8, 132. [Google Scholar] [CrossRef]
- Wang, C.; Wang, C.; Myint, S.W.; Wang, Z.H. Landscape determinants of spatio-temporal patterns of aerosol optical depth in the two most polluted metropolitans in the United States. Sci. Total Environ. 2017, 609, 1556–1565. [Google Scholar] [CrossRef] [PubMed]
- Guo, S.; Hu, M.; Zamora, M.; Peng, J.; Shang, D.; Zheng, J.; Du, Z.; Wu, Z.; Shao, M.; Zeng, L.; et al. Elucidating severe urban haze formation in China. Proc. Natl. Acad. Sci. USA 2014, 111, 17373–17378. [Google Scholar] [CrossRef] [PubMed]
- Hu, R.; Wang, H.; Yin, Y.; Chen, K.; Zhu, B.; Zhang, Z.; Kang, H.; Shen, L. Mixing state of ambient aerosols during different fog-haze pollution episodes in the Yangtze River Delta, China. Atmos. Environ. 2018, 178, 1–10. [Google Scholar] [CrossRef]
- Hu, R.; Wang, H.; Yin, Y.; Zhu, B.; Xia, L.; Zhang, Z.; Chen, K. Measurement of ambient aerosols by single particle mass spectrometry in the Yangtze River Delta, China: Seasonal variations, mixing state and meteorological effects. Atmos. Res. 2018, 213, 562–575. [Google Scholar] [CrossRef]
- Qiao, X.; Jaffe, D.; Tang, Y.; Bresnahan, M.; Song, J. Evaluation of air quality in Chengdu, Sichuan Basin, China: Are China’s air quality standards sufficient yet? Environ. Monit. Assess. 2015, 187, 250. [Google Scholar] [CrossRef] [PubMed]
- Wang, H.; Zhu, B.; Shen, L.; Xu, H.; An, J.; Pan, C.; Li, Y.; Liu, D. Regional characteristics of air pollutants during heavy haze events in the Yangtze River Delta, China. Aerosol Air Qual. Res. 2016, 16, 2159–2171. [Google Scholar] [CrossRef]
- Wang, Y.; Yao, L.; Wang, L.; Liu, Z.; Ji, D.; Tang, G.; Zhang, J.; Sun, Y.; Hu, B.; Xin, J. Mechanism for the formation of the January 2013 heavy haze pollution episode over central and eastern China. Sci. China Earth Sci. 2014, 57, 14–25. [Google Scholar] [CrossRef]
- He, K.; Zhao, Q.; Ma, Y.; Duan, F.; Yang, F.; Shi, Z.; Chen, G. Spatial and seasonal variability of PM2.5 acidity at two Chinese megacities: Insights into the formation of secondary inorganic aerosols. Atmos. Chem. Phys. 2012, 12, 25557–25603. [Google Scholar] [CrossRef]
- Wang, S.; Nan, J.; Shi, C.; Fu, Q.; Gao, S.; Wang, D.; Cui, H.; Saiz-Lopez, A.; Zhou, B. Atmospheric ammonia and its impacts on regional air quality over the megacity of Shanghai, China. Sci. Rep. 2015, 5, 15842. [Google Scholar] [CrossRef] [PubMed]
- Andrews, E.; Saxena, P.; Musarra, S.; Hildemann, L.M.; Koutrakis, P.; McMurry, P.H.; Olmez, I.; White, W.H. Concentration and composition of atmospheric aerosols from the 1995 SEAVS experiment and a review of the closure between chemical and gravimetric measurements. J. Air Waste Manage. 2000, 50, 648–664. [Google Scholar] [CrossRef]
- Du, H.; Kong, L.; Cheng, T.; Chen, J.; Du, J.; Li, L.; Xia, X.; Leng, C.; Huang, G. Insights into summertime haze pollution events over Shanghai based on online water-soluble ionic composition of aerosols. Atmos. Environ. 2011, 45, 5131–5137. [Google Scholar] [CrossRef]
- Chow, J.C.; Chen, L.W.A.; Watson, J.G.; Lowenthal, D.H.; Magliano, K.A.; Turkiewicz, K.; Lehrman, D.E. PM2.5 chemical composition and spatiotemporal variability during the California regional PM10/PM2.5 air quality study (CRPAQS). J. Geophys. Res. 2006, 111, D10S04. [Google Scholar] [CrossRef]
- Seinfeld, J.H.; Pandis, S.N. Atmospheric Chemistry and Physics: From Air Pollution to Climate Change, 2nd ed.; John Wiley & Sons: New York, NY, USA, 2006. [Google Scholar]
- Wang, Y.; Zhuang, G.S.; Zhang, X.Y.; Huang, K.; Xu, C.; Tang, A.H.; Chen, J.M.; An, Z.S. The ion chemistry, seasonal cycle, and sources of PM2.5 and TSP aerosol in Shanghai. Atmos. Environ. 2006, 40, 2935–2952. [Google Scholar] [CrossRef]
- Chen, S.J.; Liao, S.H.; Jian, W.J.; Lin, C.C. Particle size distribution of aerosol carbons in ambient air. Environ. Int. 1997, 23, 475–488. [Google Scholar] [CrossRef]
- Ji, D.; Zhang, J.; He, J.; Wang, X.; Pang, B.; Liu, Z.; Wang, L.; Wang, Y. Characteristics of atmospheric organic and elemental carbon aerosols in urban Beijing, China. Atmos. Environ. 2016, 125, 293–306. [Google Scholar] [CrossRef]
- Ding, A.J.; Huang, X.; Nie, W.; Sun, J.N.; Kerminen, V.-M.; Petäjä, T.; Su, H.; Cheng, Y.F.; Yang, X.-Q.; Wang, M.H.; et al. Enhanced haze pollution by black carbon in megacities in China. Geophys. Res. Lett. 2016, 43, 2873–2879. [Google Scholar] [CrossRef]
- Mauderly, J.L.; Chow, J.C. Health effects of organic aerosols. Inhal. Toxicol. 2008, 20, 257–288. [Google Scholar] [CrossRef]
- Jongejan, P.A.C.; Bai, Y.; Veltkamp, A.C.; Wyers, G.P.; Slanina, J. An automated field instrument for the determination of acidic gases in air. Int. Environ. An. Chem. 1997, 66, 241–251. [Google Scholar] [CrossRef]
- Chow, J.C.; Watson, J.G. Guideline on Speciated Particulate Monitoring; US Environmental Protection Agency: Reno, NV, USA, 1998; Volume 3–7, pp. 4–37. [Google Scholar]
- Khlystov, A.; Wyers, G.P.; Slanina, J. The steam-jet aerosol collector. Atmos. Environ. 1995, 29, 2229–2234. [Google Scholar] [CrossRef]
- Khezri, B.; Mo, H.; Yan, Z.; Chong, S.L.; Heng, A.K.; Webster, R.D. Simultaneous online monitoring of inorganic compounds in aerosols and gases in an industrialized area. Atmos. Environ. 2013, 80, 352–360. [Google Scholar] [CrossRef]
- Rumsey, I.C.; Cowen, K.A.; Walker, J.T.; Kelly, T.J.; Hanft, E.A.; Mishoe, K.; Rogers, C.; Proost, R.; Beachley, G.M.; Lear, G.; et al. An assessment of the performance of the monitor for AeRosols and GAses in ambient air (MARGA): A semi-continuous method for soluble compounds. Atmos. Chem. Phys. 2104, 14, 5639–5658. [Google Scholar] [CrossRef]
- Bae, M.S.; Schauer, J.J.; DeMinter, J.T.; Turner, J.R.; Smith, D.; Cary, R.A. Validation of a semi-continuous instrument for elemental carbon and organic carbon using a thermal-optical method. Atmos. Environ. 2004, 38, 2885–2893. [Google Scholar] [CrossRef]
- Bauer, J.J.; Yu, X.Y.; Cary, R.; Laulainen, N.; Berkowitz, C. Characterization of the sunset semi-continuous carbon aerosol analyzer. J. Air Waste Manage. Assoc. 2009, 59, 826–833. [Google Scholar] [CrossRef]
- Jiang, R.; Tan, H.; Tang, L.; Cai, M.; Yin, Y.; Li, F.; Liu, L.; Xu, H.; Chan, P.W.; Deng, X.; et al. Comparison of aerosol hygroscopicity and mixing state between winter and summer seasons in Pearl River Delta region, China. Atmos. Res. 2016, 169, 160–170. [Google Scholar] [CrossRef]
- Chow, J.C.; Watson, J.G.; Lu, Z.; Lowenthal, D.H.; Frazier, C.A.; Solomon, P.A.; Thuillier, R.H.; Magliano, K. Descriptive analysis of PM2.5 and PM10 at regionally representative locations during SJVAQS/AUSPEX. Atmos. Environ. 1996, 30, 2079–2112. [Google Scholar] [CrossRef]
- Turpin, B.J.; Huntzicker, J.J. Identification of secondary organic aerosol episodes and quantification of primary and secondary organic aerosol concentrations during SCAQS. Atmos. Environ. 1995, 29, 3527–3544. [Google Scholar] [CrossRef]
- Castro, L.M.; Harrison, R.M.; Smith, D.J.T. Carbonaceous aerosol in urban and rural European atmospheres: Estimation of secondary organic carbon concentrations. Atmos. Environ. 1999, 33, 2771–2781. [Google Scholar] [CrossRef]
- Thurston, G.D.; Spengler, J.D. A quantitative assessment of source contributions to inhalable particulate matter pollution in metropolitan Boston. Atmos. Environ. 1985, 19, 9–25. [Google Scholar] [CrossRef]
- Miller, S.L.; Anderson, M.J.; Daly, E.P.; Milford, J.B. Source apportionment of exposures to volatile organic compounds. I. Evaluation of receptor models using simulated exposure data. Atmos. Environ. 2002, 36, 3629–3641. [Google Scholar] [CrossRef]
- Guo, H.; Wang, T.; Simpson, I.J.; Blake, D.R.; Yu, X.M.; Kwok, Y.H.; Li, Y.S. Source contributions to ambient VOCs and CO at a rural site in eastern China. Atmos. Environ. 2004, 38, 4551–4560. [Google Scholar] [CrossRef]
- Stull, R.B. An Introduction to Boundary Layer Meteorology; Kluwer Acad.: Dordrecht, The Netherlands, 1988; pp. 665–670. [Google Scholar]
- Song, J.; Wang, Z.H.; Wang, C. Biospheric and anthropogenic contributors to atmospheric CO2 variability in a residential neighborhood of Phoenix, Arizona. J. Geophys. Res. 2017, 122, 3317–3329. [Google Scholar] [CrossRef]
- Wang, H.; Zhu, B.; Shen, L.; Kang, H. Size distributions of aerosol and water-soluble ions in Nanjing during a crop residual burning event. J. Environ. Sci. 2012, 24, 1457–1465. [Google Scholar] [CrossRef]
- Tao, J.; Gao, J.; Zhang, L.; Zhang, R.; Che, H.; Zhang, Z.; Lin, Z.; Jing, J.; Cao, J.; Hsu, S.C. PM2.5 pollution in a megacity of southwest China: Source apportionment and implication. Atmos. Chem. Phys. 2014, 14, 8679–8699. [Google Scholar] [CrossRef]
- Liu, B.; Song, N.; Dai, Q.; Mei, R.; Sui, B.; Bi, X.; Feng, Y. Chemical composition and source apportionment of ambient PM2. 5 during the non-heating period in Taian, China. Atmos. Res. 2016, 170, 23–33. [Google Scholar] [CrossRef]
- Swietlicki, E.; Puri, S.; Hansson, H.C.; Edner, H. Urban air pollution source apportionment using a combination of aerosol and gas monitoring techniques. Atmos. Environ. 1996, 30, 2795–2809. [Google Scholar] [CrossRef]
- Chang, Y.; Liu, X.; Deng, C.; Dore, A.J.; Zhuang, G. Source apportionment of atmospheric ammonia before, during, and after the 2014 APEC summit in Beijing using stable nitrogen isotope signatures. Atmos. Chem. Phys. 2016, 16, 11635–11647. [Google Scholar] [CrossRef]
© 2019 by the authors. Licensee MDPI, Basel, Switzerland. This article is an open access article distributed under the terms and conditions of the Creative Commons Attribution (CC BY) license (http://creativecommons.org/licenses/by/4.0/).