Article

An Assessment of the Temperature and Humidity of Atmospheric Infrared Sounder (AIRS) v6 Profiles Using Radiosonde Data in the Lee of the Tibetan Plateau

1
Institute of Plateau Meteorology, China Meteorological Administration, Chengdu 610072, China
2
Heavy Rain and Drought-Flood Disasters in Plateau and Basin Key Laboratory of Sichuan Province, Chengdu 610072, China
*
Author to whom correspondence should be addressed.
Atmosphere 2019, 10(7), 394; https://doi.org/10.3390/atmos10070394
Submission received: 11 June 2019 / Revised: 8 July 2019 / Accepted: 11 July 2019 / Published: 13 July 2019
(This article belongs to the Section Meteorology)

Abstract

:
Atmospheric Infrared Sounder (AIRS) products are important for weather prediction and climate monitoring in the lee of the Tibetan Plateau (TP), where the terrain is complex. However, the quality of the AIRS products in this region remains unclear due to the unavailability of upper-air observation. In this study, for the first time, we use an 8-year intensive radiosonde observation dataset from 11 sites to assess the quality of the AIRS version 6 products in the lee of the TP at both daytime and nighttime. The results indicate that, overall, the AIRS products have a dry and cold bias in the lee of the TP, and larger biases over the sites of higher altitude. AIRS temperature retrieval has a larger deficiency in low levels at nighttime, while a better representation of moisture is found below 600 hPa over the low-altitude sites. In the lee of the TP, the quality control flags for temperature and moisture should be considered individually. The AIRS profile products could be useful for synoptic analysis of air temperature, moisture, and climate monitoring in this region, and further improvements are needed in the near-surface and nighttime retrieval processes.

1. Introduction

The Tibetan Plateau (TP), with an average altitude of over 4000 m, is an important topography that affects the distribution and variation of air temperature and water vapor, and also exerts impacts on regional and global atmospheric circulation and energy budgets [1,2,3]. The Sichuan Basin (SCB) is located to the east of TP, forming a sharp decrease in the surface elevation from about 6000 m to 200 m in the lee of the TP. The unique terrain has profound effects on the distribution of temperature and water vapor over this region [4,5].
Water vapor in the lower troposphere is transported by southerly air flow to Northern China along the eastern side of the TP, which is often blocked by the terrain, resulting in the convergence of water vapor and frequent rainfall [6]. Under the unique dynamic and thermodynamic conditions, vortices are often generated in the lee of the TP and produce rainstorms both locally and remotely [7,8,9,10]. However, the lack of high-quality observation in this region poses a big challenge for accurate weather forecasting and climate monitoring.
Space-borne remote sensing technology provides more options for probe of meteorological parameters and benefits weather forecast and climate monitoring in regions such as the lee of the TP, where both surface and upper-air observation coverages are insufficient to monitor a large spatial variation of meteorological parameters over complex terrain. The Atmospheric Infrared Sounder (AIRS) is one of six instruments onboard the Earth Observing System (EOS) Aqua satellite that monitors the atmosphere and surface. Launched in May 2002, Aqua flies in a sun-synchronous orbit. Accompanied by the Advanced Microwave Sounding Unit (AMSU), to date, AIRS has recorded more than 10-years’ worth of data with a global coverage. AIRS/AMSU data are widely used in weather and climate research due to their high quality. The assimilation of AIRS data in a numerical weather prediction model could improve the quality of weather forecasts [11,12,13]. AIRS are also used to detect decadal changes in the stratospheric temperature and carbon dioxide levels [14] and tropical cyclone warm-core structures [15], among others. Therefore, AIRS data could be used to monitor weather and climate in the lee of the TP.
The quality of retrieved AIRS data is affected by surface conditions and clouds. Fetzer and Lambrigtsen [16] reported that the AIRS data shows high similarity to an Advanced Microwave Sounding Radiometer for EOS (AMSR-E) data over the ocean. Comparison between AIRS and the European Centre for Medium-Range Weather Forecasts analysis shows that deviations are smaller in tropical and oceanic regions compared to the midlatitudes and land [17]. Large biases in the AIRS temperature are found over Antarctica because of varied terrain [18]. The retrieval accuracy of AIRS/AMSU meets the design requirements for cloud-free cases [19]. However, evaluation of AIRS water vapor against one month of radiosonde measurements across China shows that bias in Southeastern and Northwestern China depends on the presence or absence of cloud [20]. Therefore, it is necessary to assess the data quality of AIRS in the lee of the TP, with regard to its complex terrain and unique diurnal cycle of clouds and rainfall [21].
In this study, we aim to assess AIRS data in the lee of the TP by using 8-year intensive radiosonde observations (RAOB) from 11 sites, with a focus on the influence of terrain height and difference in the observational time on AIRS data quality. In the rest of this paper, descriptions of the data and methods are provided in Section 2. The results are reported in Section 3. Finally, the conclusions and discussions are presented in Section 4.

2. Data and Methods

2.1. Data

The AIRS is a 2378-channel high-spectral resolution infrared sounder, covering the IR spectrum from 650 to 2675 cm−1. The AMSU is a 15-channel passive microwave temperature sounder. The field of view (FOV) sizes of AIRS and AMSU are 13.5 km and 45 km, respectively. There are about nine AIRS FOVs in one AMSU FOV. The AIRS version 6 retrieval includes two algorithms: the combined AIRS/AMSU (AA) and the AIRS-only (AO) [22]. The AO retrieval algorithm is similar to the AA algorithm, except no AMSU observations are used in the retrieval steps. The retrieval L2 products include temperatures (T values, hereinafter) on 28 isobaric levels from 1100 to 0.1 hPa, water vapor mixing ratios (q values) on 15 isobaric levels from 1100 to 50 hPa, precipitable water vapor (PWV) of a single atmospheric column, as well as the quality control (QC) flags [16,23,24]. The horizontal resolution of AA and AO L2 product is 45 km. In September 2016, AMSU lost its power supply, thus only AO data sets are available after late 2016. Globally, atmospheric humidity retrievals from AA are slightly more accurate than those of AO near the surface [22], but the time length of AA is shorter. To obtain a more comprehensive view about the AIRS L2 version 6 products, the datasets used in this study include an AA standard retrieval data set from 2011 to 2016, and AO data set from 2011 to 2018.
The radiosonde data at 11 sites in the lee of TP from 20 June to 31 July from 2011 to 2018 are used to evaluate the ARIS data. The radiosonde data are obtained by the intensive observation experiment, which is conducted by the Institute of Plateau Meteorology, China Meteorological Administration [8]. The location and altitude of the 11 radiosonde observation sites are listed in Table 1, including 7 operational radiosonde sites of the China Meteorological Administration (red sites in Figure 1a), and 4 intensive radiosonde sites (blue sites in Figure 1a). Different devices are used in the two types of stations. For the seven China Meteorological Administration sites, the L-band wind-measuring radars and GTS1 digital electronic radiosonde sensors are used to collect upper-air data. For the other four sites, the Vaisala RS-92 radiosonde system is used. During the period of experimental observation, a weather balloon at all sites is released four times each day at 05:15, 11:15, 17:15 and 23:15 UTC. However, during other days of the year, only two observations are performed each day and these are only carried out at the seven China Meteorological Administration sites. Meteorological parameters, including temperature, dew point temperature, specific humidity, height, and pressure, are recorded about every 1.2 s. The altitudes of the sounding sites vary from 311 m (Dazhou) to 3394 m (Ganzi), with five sites located above 2000 m.
Since the Aqua satellite overpasses the lee of the TP at about 06:30 and 18:30 UTC, the time differences between the AIRS data and twice daily RAOB measurements are too large. The unique four-times daily RAOB data obtained by the intensive observation can fill the gap. To match the Aqua overpass time, sounding data initiated at 05:15 and 17:15 UTC are used to assess AIRS data in two steps. First, the AIRS profiles within a 50 km radius of the radiosonde observation site are selected to match the RAOB profiles, as the maximum horizontal drift distances of radiosonde are less than 40 km in most cases. There are 2278 matched profiles for AIRS/AMSU (AA) data and 2373 matched profiles for AIRS-only (AO) data. Then, the RAOB data at height levels are linearly interpolated to AIRS pressure levels for direct comparison.
The AIRS products with ‘best’ quality (QC = 0) or ‘good’ quality (QC = 1) flags are used in this study. Figure 1b shows the percentage of samples based on QC criteria. There are only slight differences in percentage between AA and AO cases. The percentage of ‘best’ and ‘good’ data increases with altitude. More than half of the samples above 300 hPa are marked as best, while less than 25% are found below 650 hPa. About 75% of data are marked as ‘best’ or ‘good’ quality (QC = 0 + 1) above 600 hPa, but the percentage reduces quickly to 30% at 700 hPa. Below 850 hPa, only a few data are available. As the percentage of the best quality data is small in the lower troposphere, we focus on the assessment of the AIRS product with ‘best’ or ‘good’ quality in this study.

2.2. Methods

In order to assess the quality of AIRS products, bias (mean difference), root-mean-square errors (RMSEs), the Pearson correlation coefficient (r) and the relative deviation (RD) for different QC levels are used in the analyses. The values are defined as
BIAS = 1 n i = 1 n ( Y i X i )
RMSE = 1 n i = 1 n ( Y i X i ) 2
r = i = 1 n ( X i X ¯ ) ( Y i Y ¯ ) i = 1 n ( X i X ¯ ) 2 i = 1 n ( Y i Y ¯ ) 2
RD = | X q c = 1 | | X q c = 0 | | X q c = 0 |
where n is the number of paired samples, X i indicates observed values of radiosondes, Y i represents values of AIRS products. X ¯ and Y ¯ are the average values of X i and Y i , respectively. For RD, X q c = 0 denotes bias or RMSE between the ‘best’ quality AIRS data and RAOB measurements, X q c = 1 for ‘good’ quality AIRS data.

3. Results

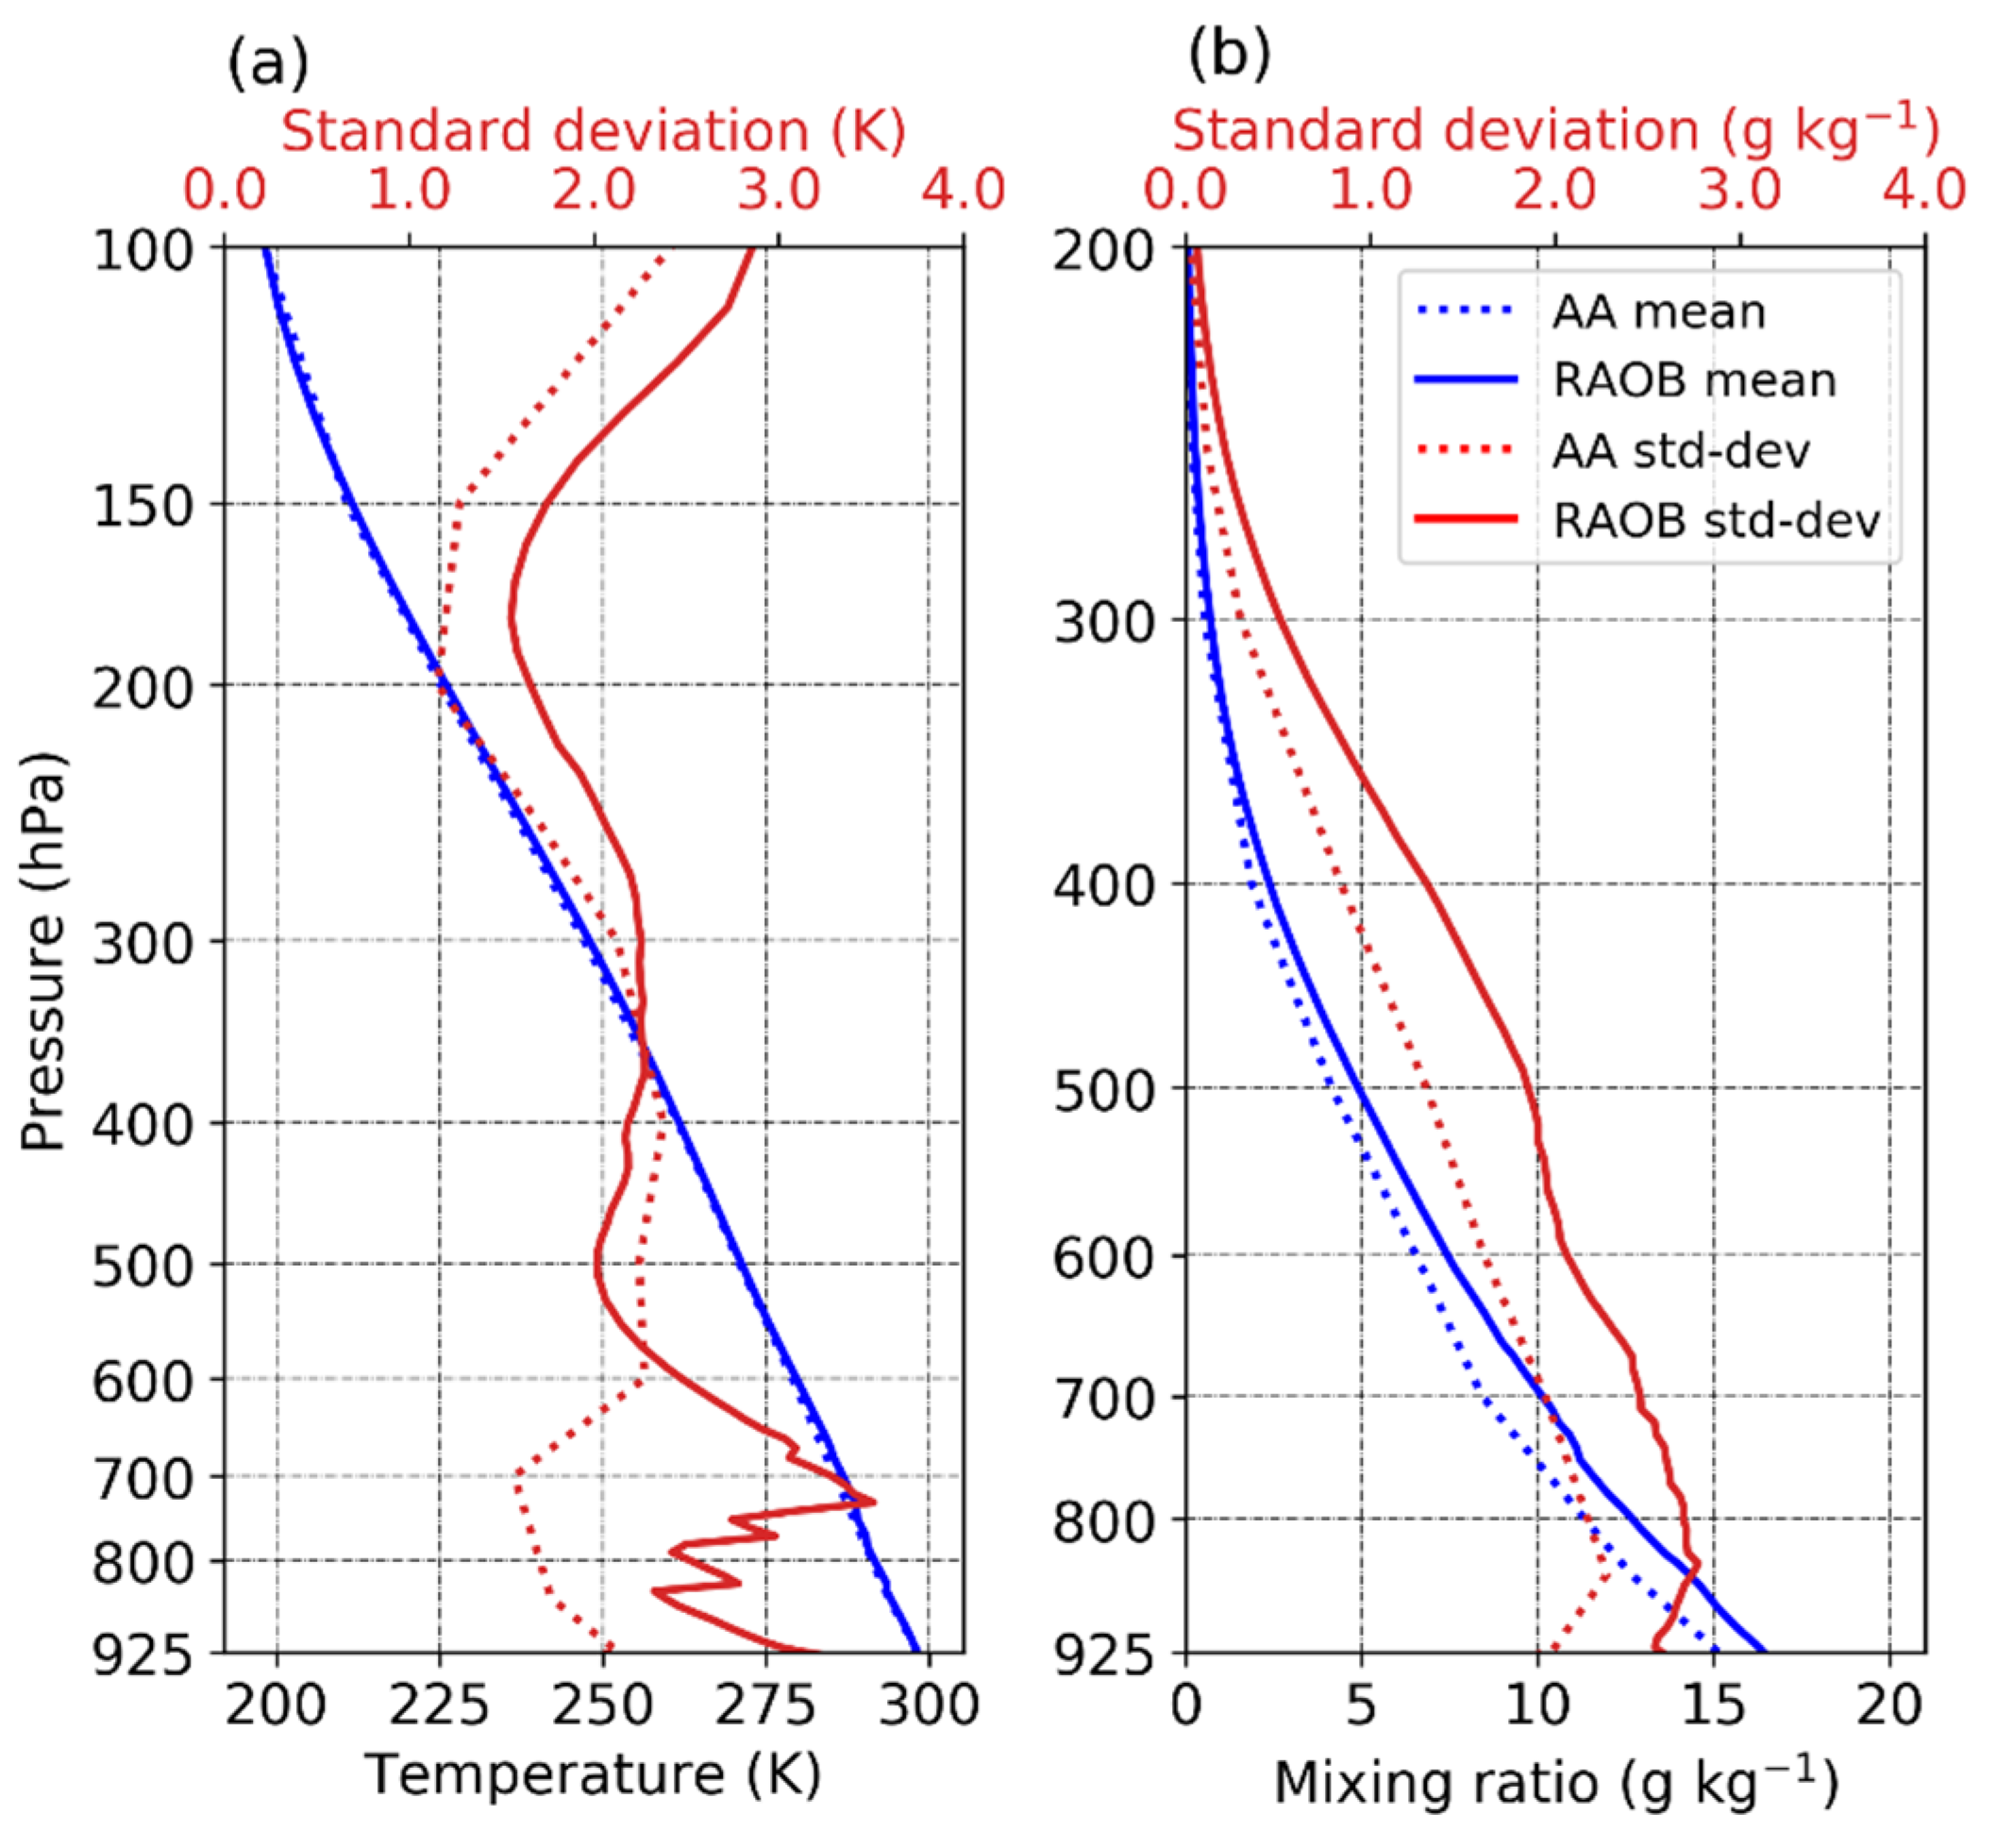
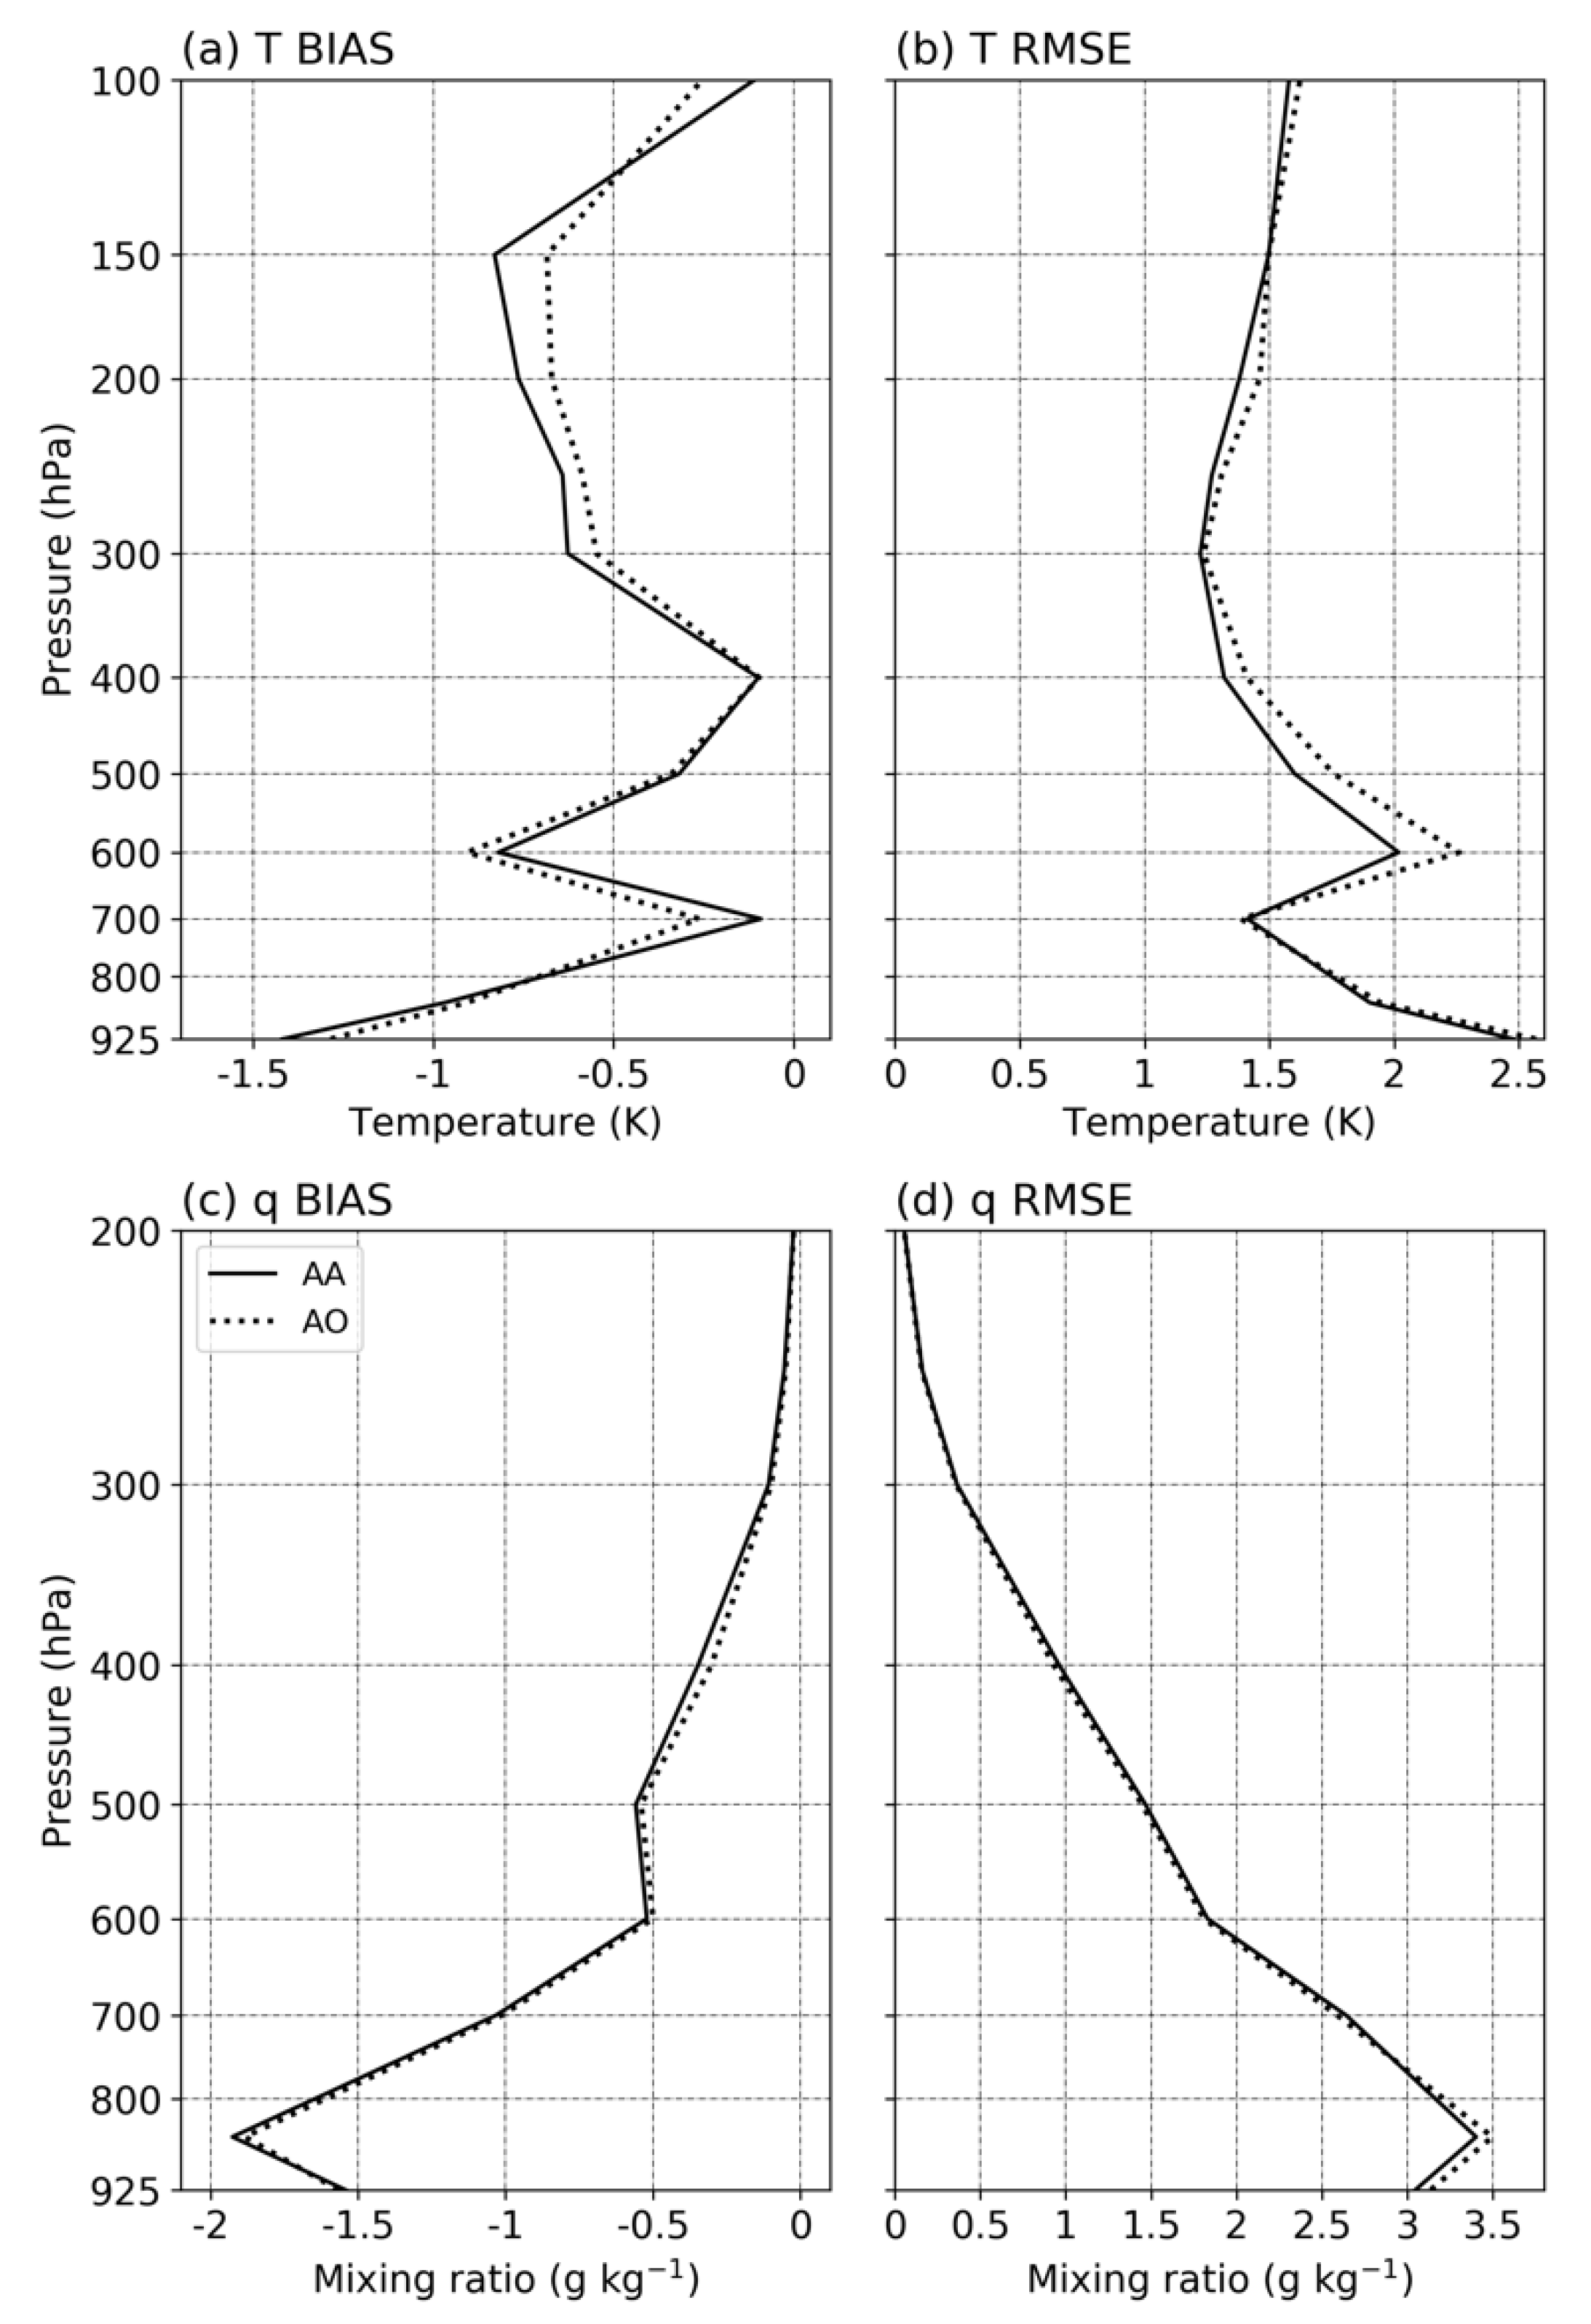
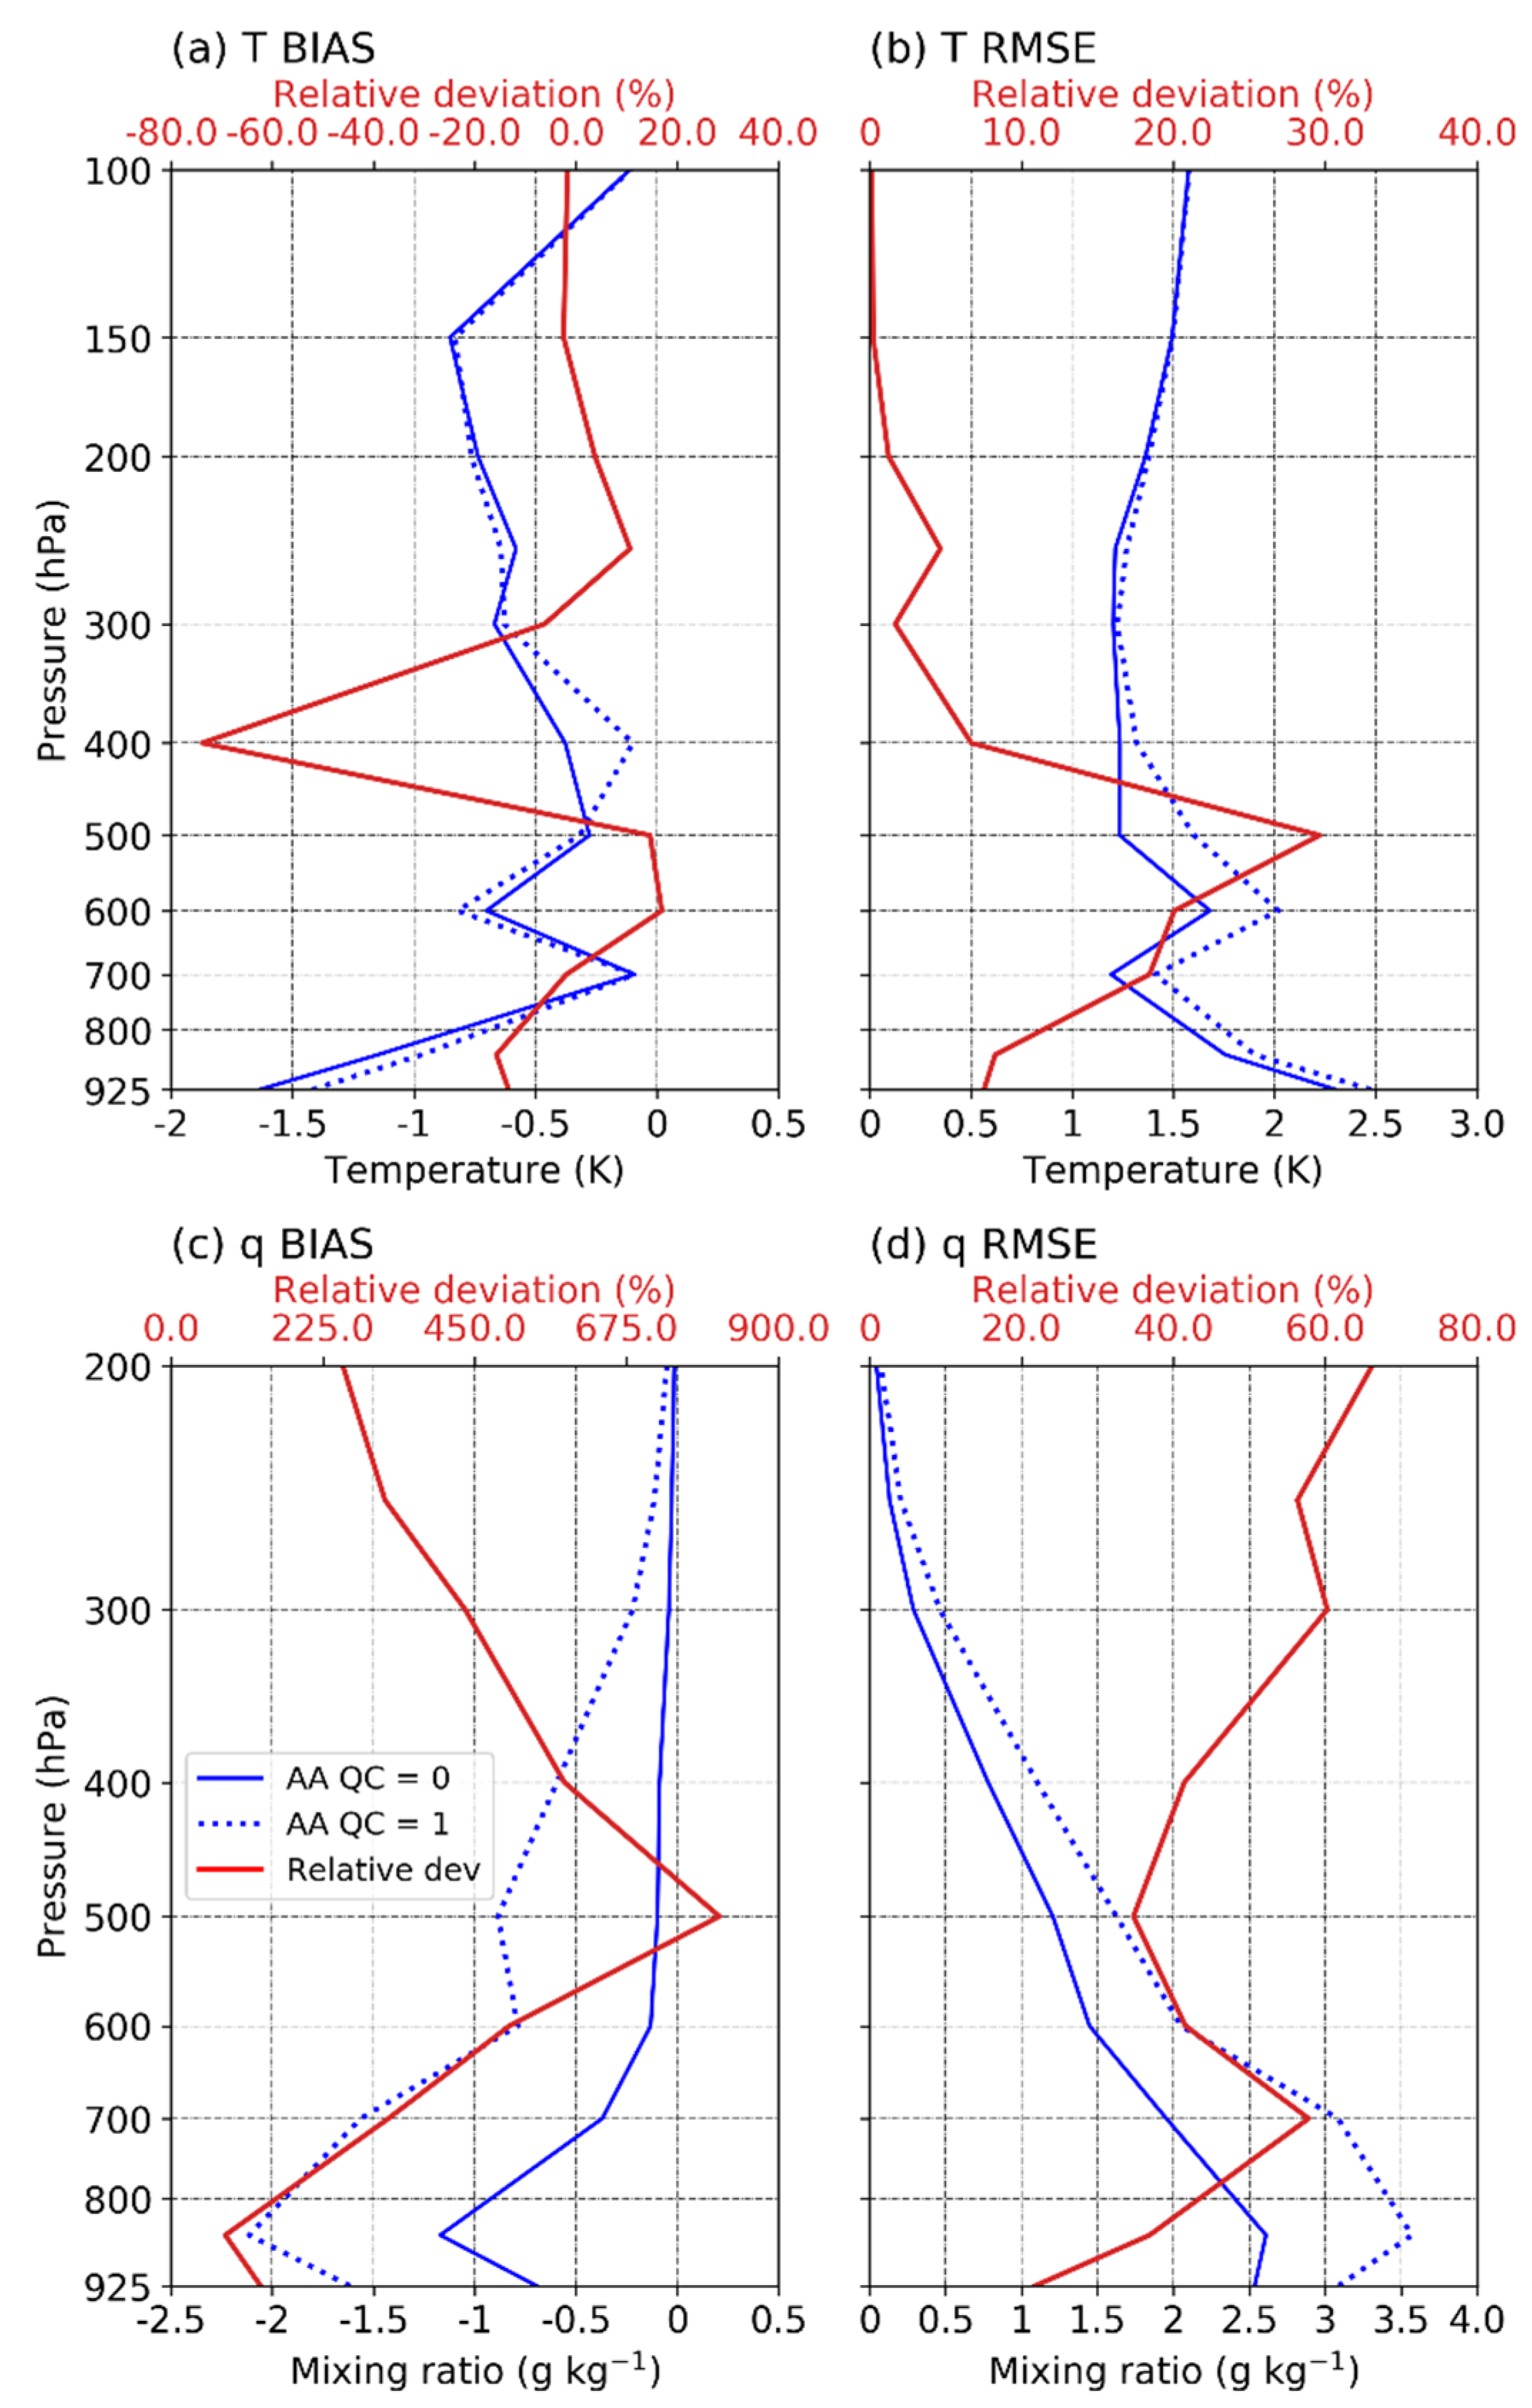
3.1. Vertical Profile Comparisons

The performance of AIRS data is first evaluated for matched data from 2011 to 2016. The average and standard deviation (SD) of RAOB and AIRS are demonstrated in Figure 2. As the average profiles of AA and AO are almost identical (figures not shown), only AA data are shown in Figure 2. The mean values of AA temperature show high agreement with those of RAOB (Figure 2a). The temperature is about 300 K at 925 hPa, and decreases almost linearly with increasing height. The SD of T is about 1.5–3.5 K for RAOB, with larger values at the low and high troposphere, while it is about 1.0–2.2 K for AA, with larger values at the middle troposphere. The SD of T exhibits a large difference between AA and RAOB, especially at the levels below 600 hPa. Different from T, q has an apparent difference between AA and RAOB below 300 hPa, and the AA mean value is less than RAOB mean. The difference is larger at the low troposphere where mean q is larger. This dry bias of AIRS is also found in the valuation of AIRS by using only daytime RAOB in Southwestern China [20]. The SD of q for AA is also less than that for RAOB and both of them decrease with increasing height from 850 hPa to 200 hPa. The maximum SD of q at 850 hPa for AA and RAOB is about 15 g kg−1 and 12 g kg−1, respectively.
Figure 3 shows differences in the mean and RMSE between AIRS and RAOB for AA and AO products. Negative bias can be found for both T and q from the surface up to 100 and 200 hPa, respectively. The difference in the bias of T between AA and AO is small. The bias of T is around 0.5 K, with a maximum of about 1.4 K at 925 hPa for AA. There are two local maxima at 600 hPa and 150 hPa. The difference in the RMSE of T has two maxima at 925 hPa and 600 hPa, with values of about 2.5 K and 2.0 K for AA, respectively. On the other hand, differences in both the RMSE and mean for q essentially decrease with increasing height, with a maximum at 850 hPa. The bias and RMSE of q at 850 hPa are about −1.9 g kg−1 and 3.4 g kg−1 for AA, respectively.

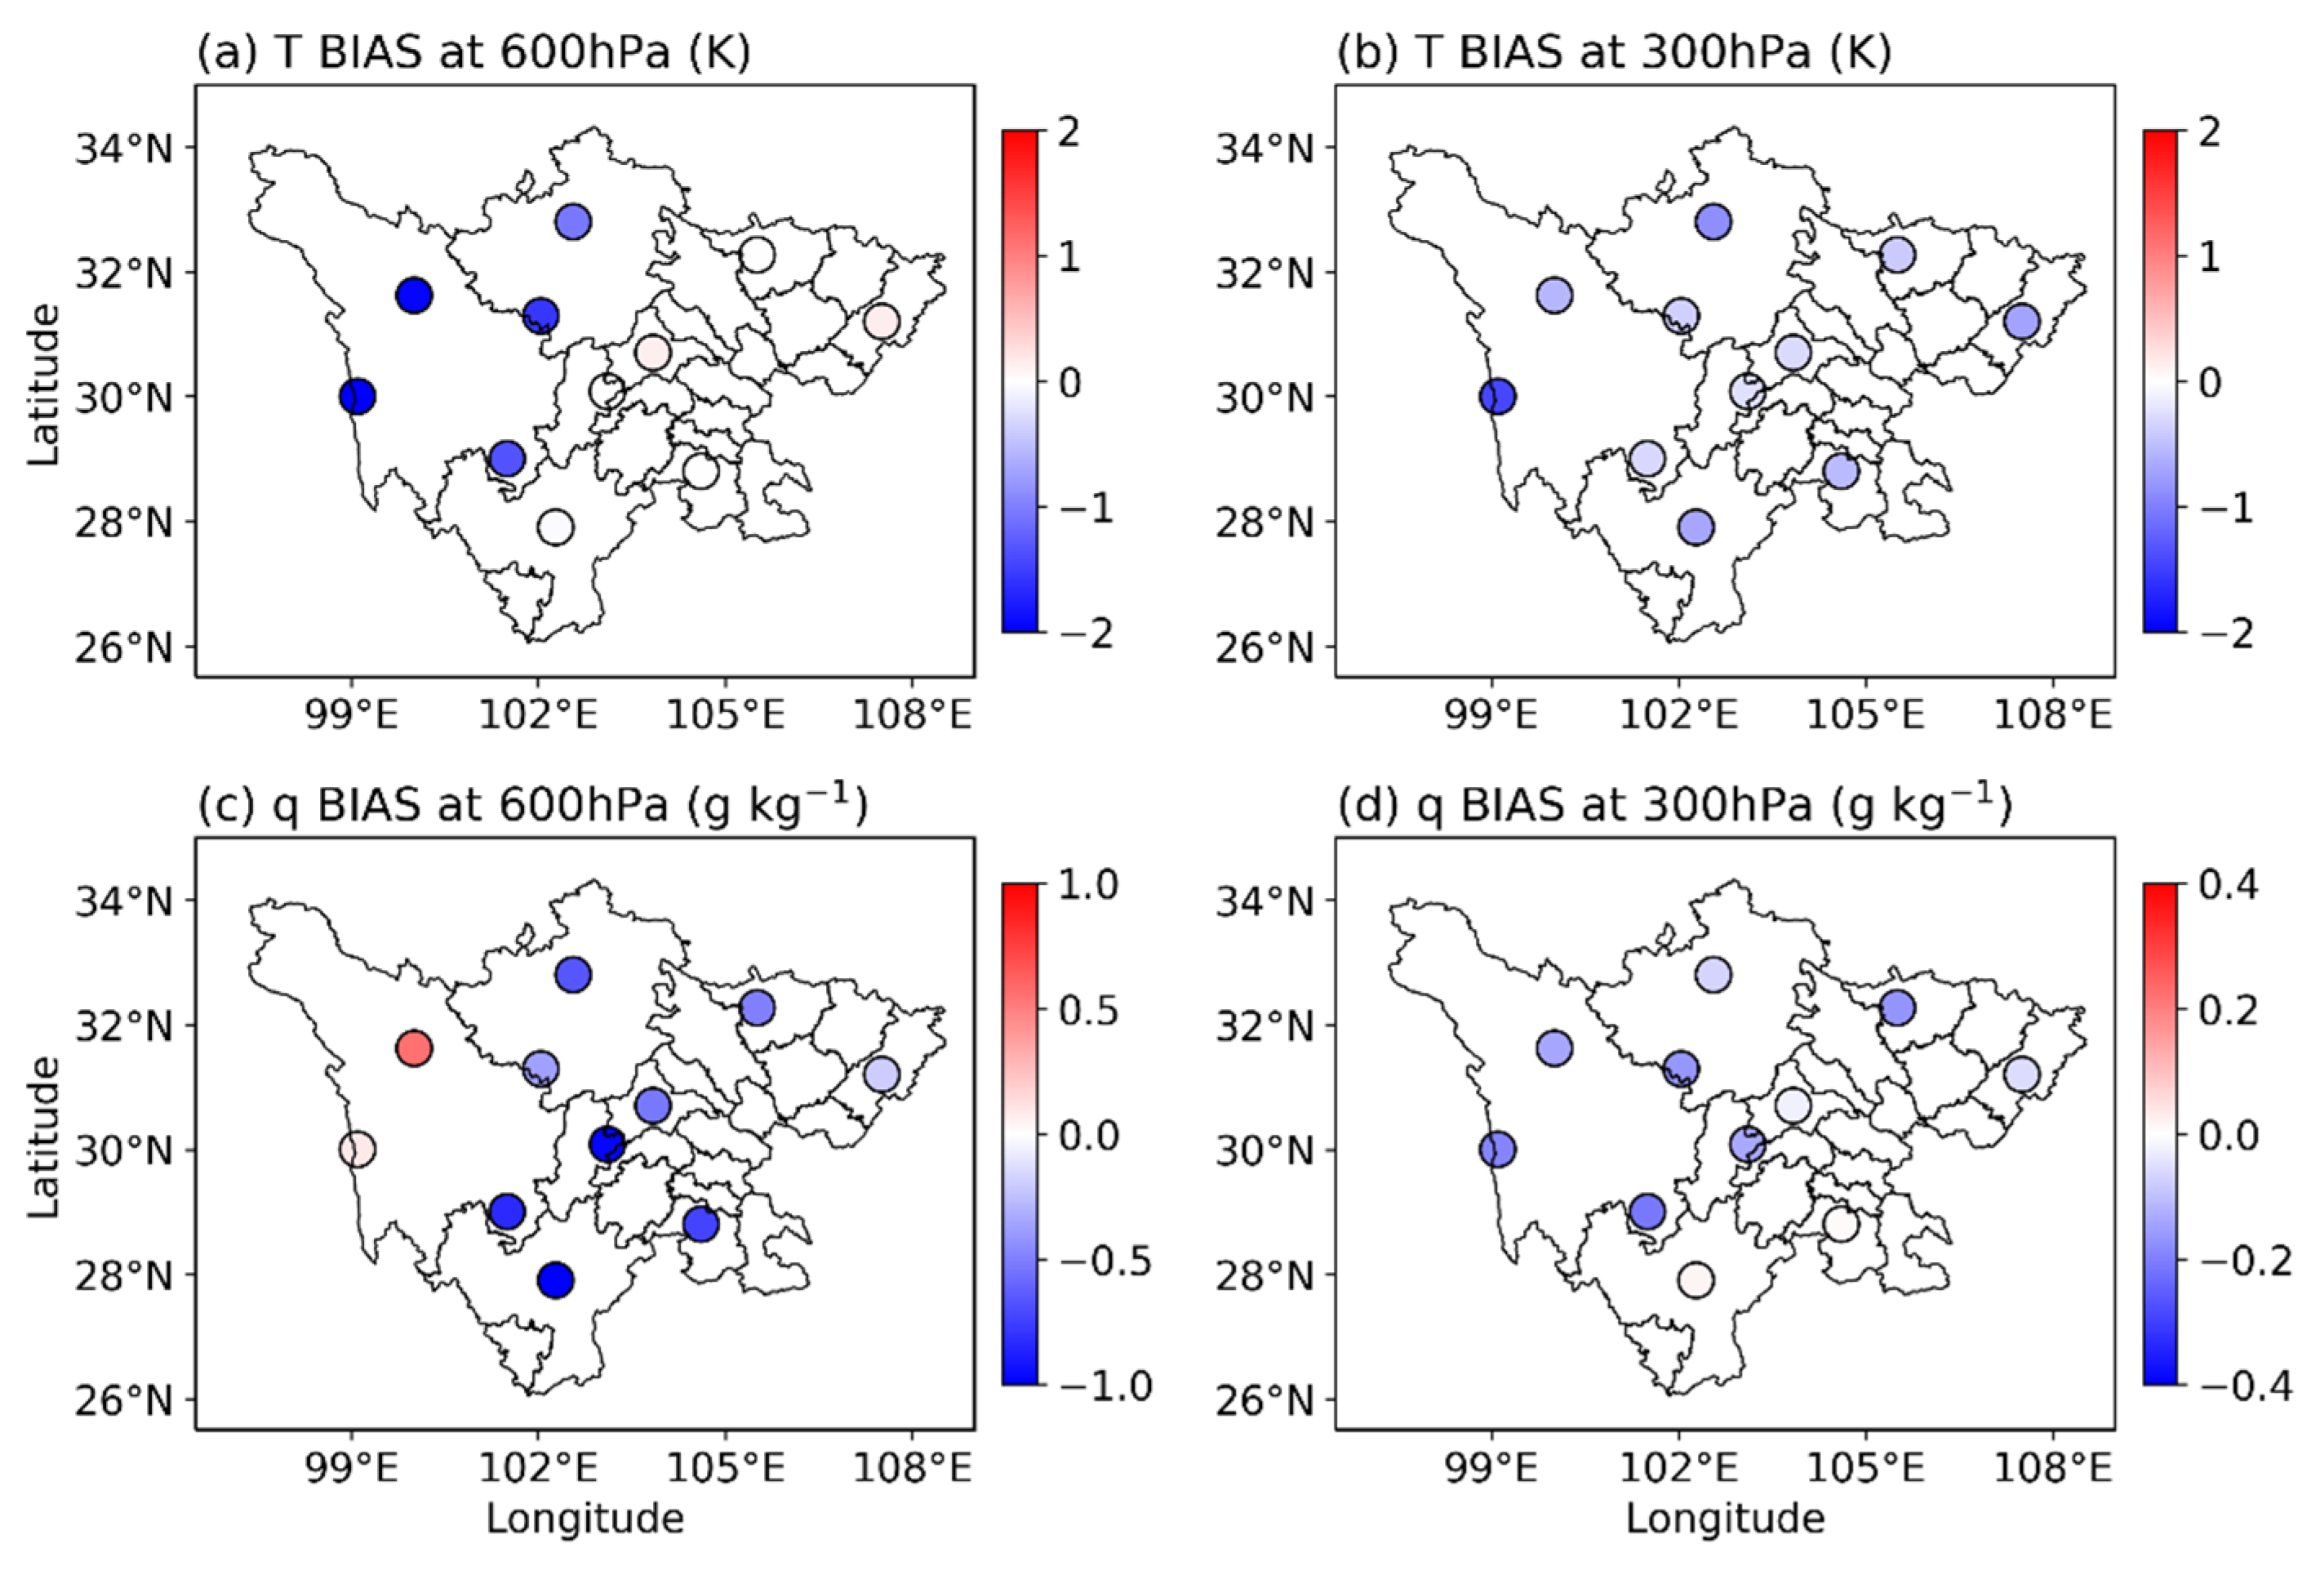
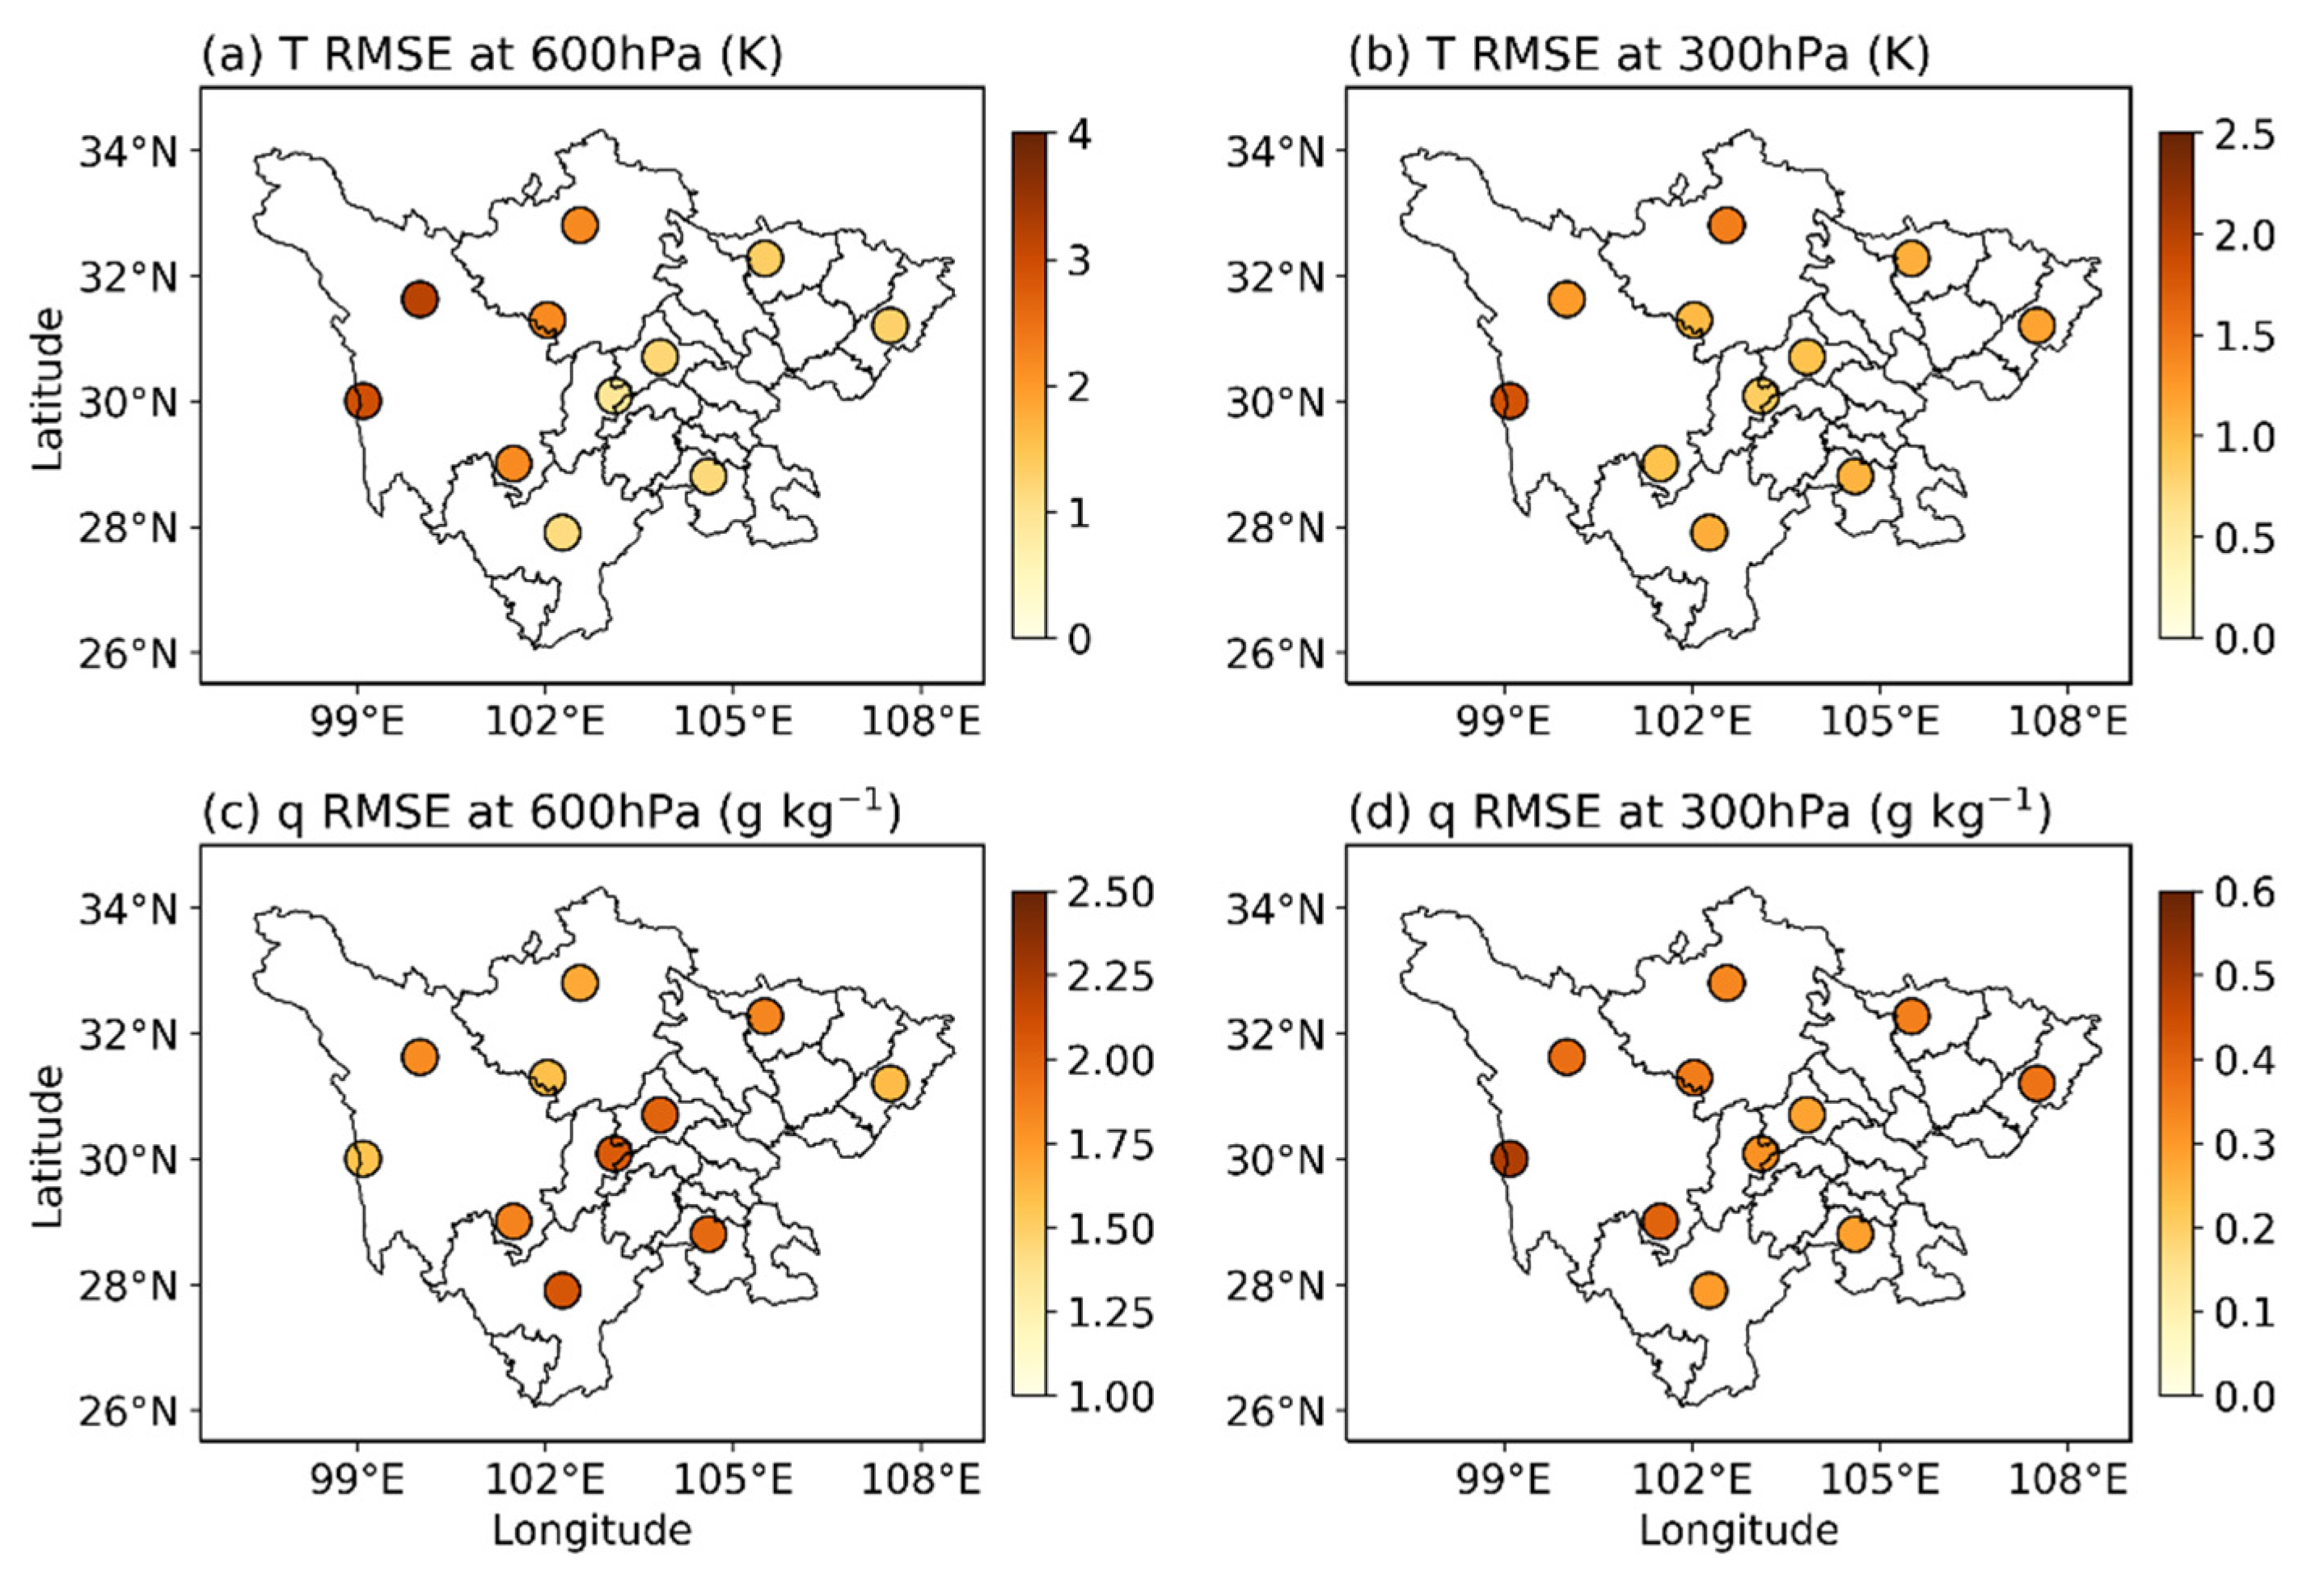
3.2. Horizontal Comparisons

The above discussions indicate that the difference between AA and AO is small in terms of bias and RMSE. Thus, the following discussions only focus on AA. Figure 4 shows spatial patterns of differences in means of T and q between AIRS and RAOB at 600 hPa and 300 hPa. The number of matched profiles of AA and RAOB is greater than 160 for each of the 11 sites. A large cold bias at 600 hPa can be seen over the Eastern TP, while a small bias of T was found over the SCB. At 300 hPa, the bias of T over the Eastern TP is also essentially larger than that over the SCB. As for bias of q at 600 hPa, bias over the Eastern TP also tends to be larger than that over the SCB. The feature of large bias over the Eastern TP is also true for q at 300 hPa. It is interesting that there are some sites with positive biases of q and T, although AIRS has an overall dry and cold bias in this region.
Figure 5 shows spatial patterns of RMSE of T and q at 600 hPa and 300 hPa. The RMSE of T at both 600 hPa and 300 hPa show large values over the Eastern TP but small values over the SCB. The RMSE of T at 600 hPa over the Eastern TP varies from 3.0 to 2.2 K, while the maximum value is only 1.5 K over the SCB. The RMSE of q at 300 hPa is also larger over the Eastern TP but smaller over the SCB. However, this feature is not obvious for RMSE of q at 600 hPa. Larger RMSE of q at 600 hPa is presented at the sites located at the Southeastern TP and nearby areas of the SCB, with values higher than 1.8 g kg−1.

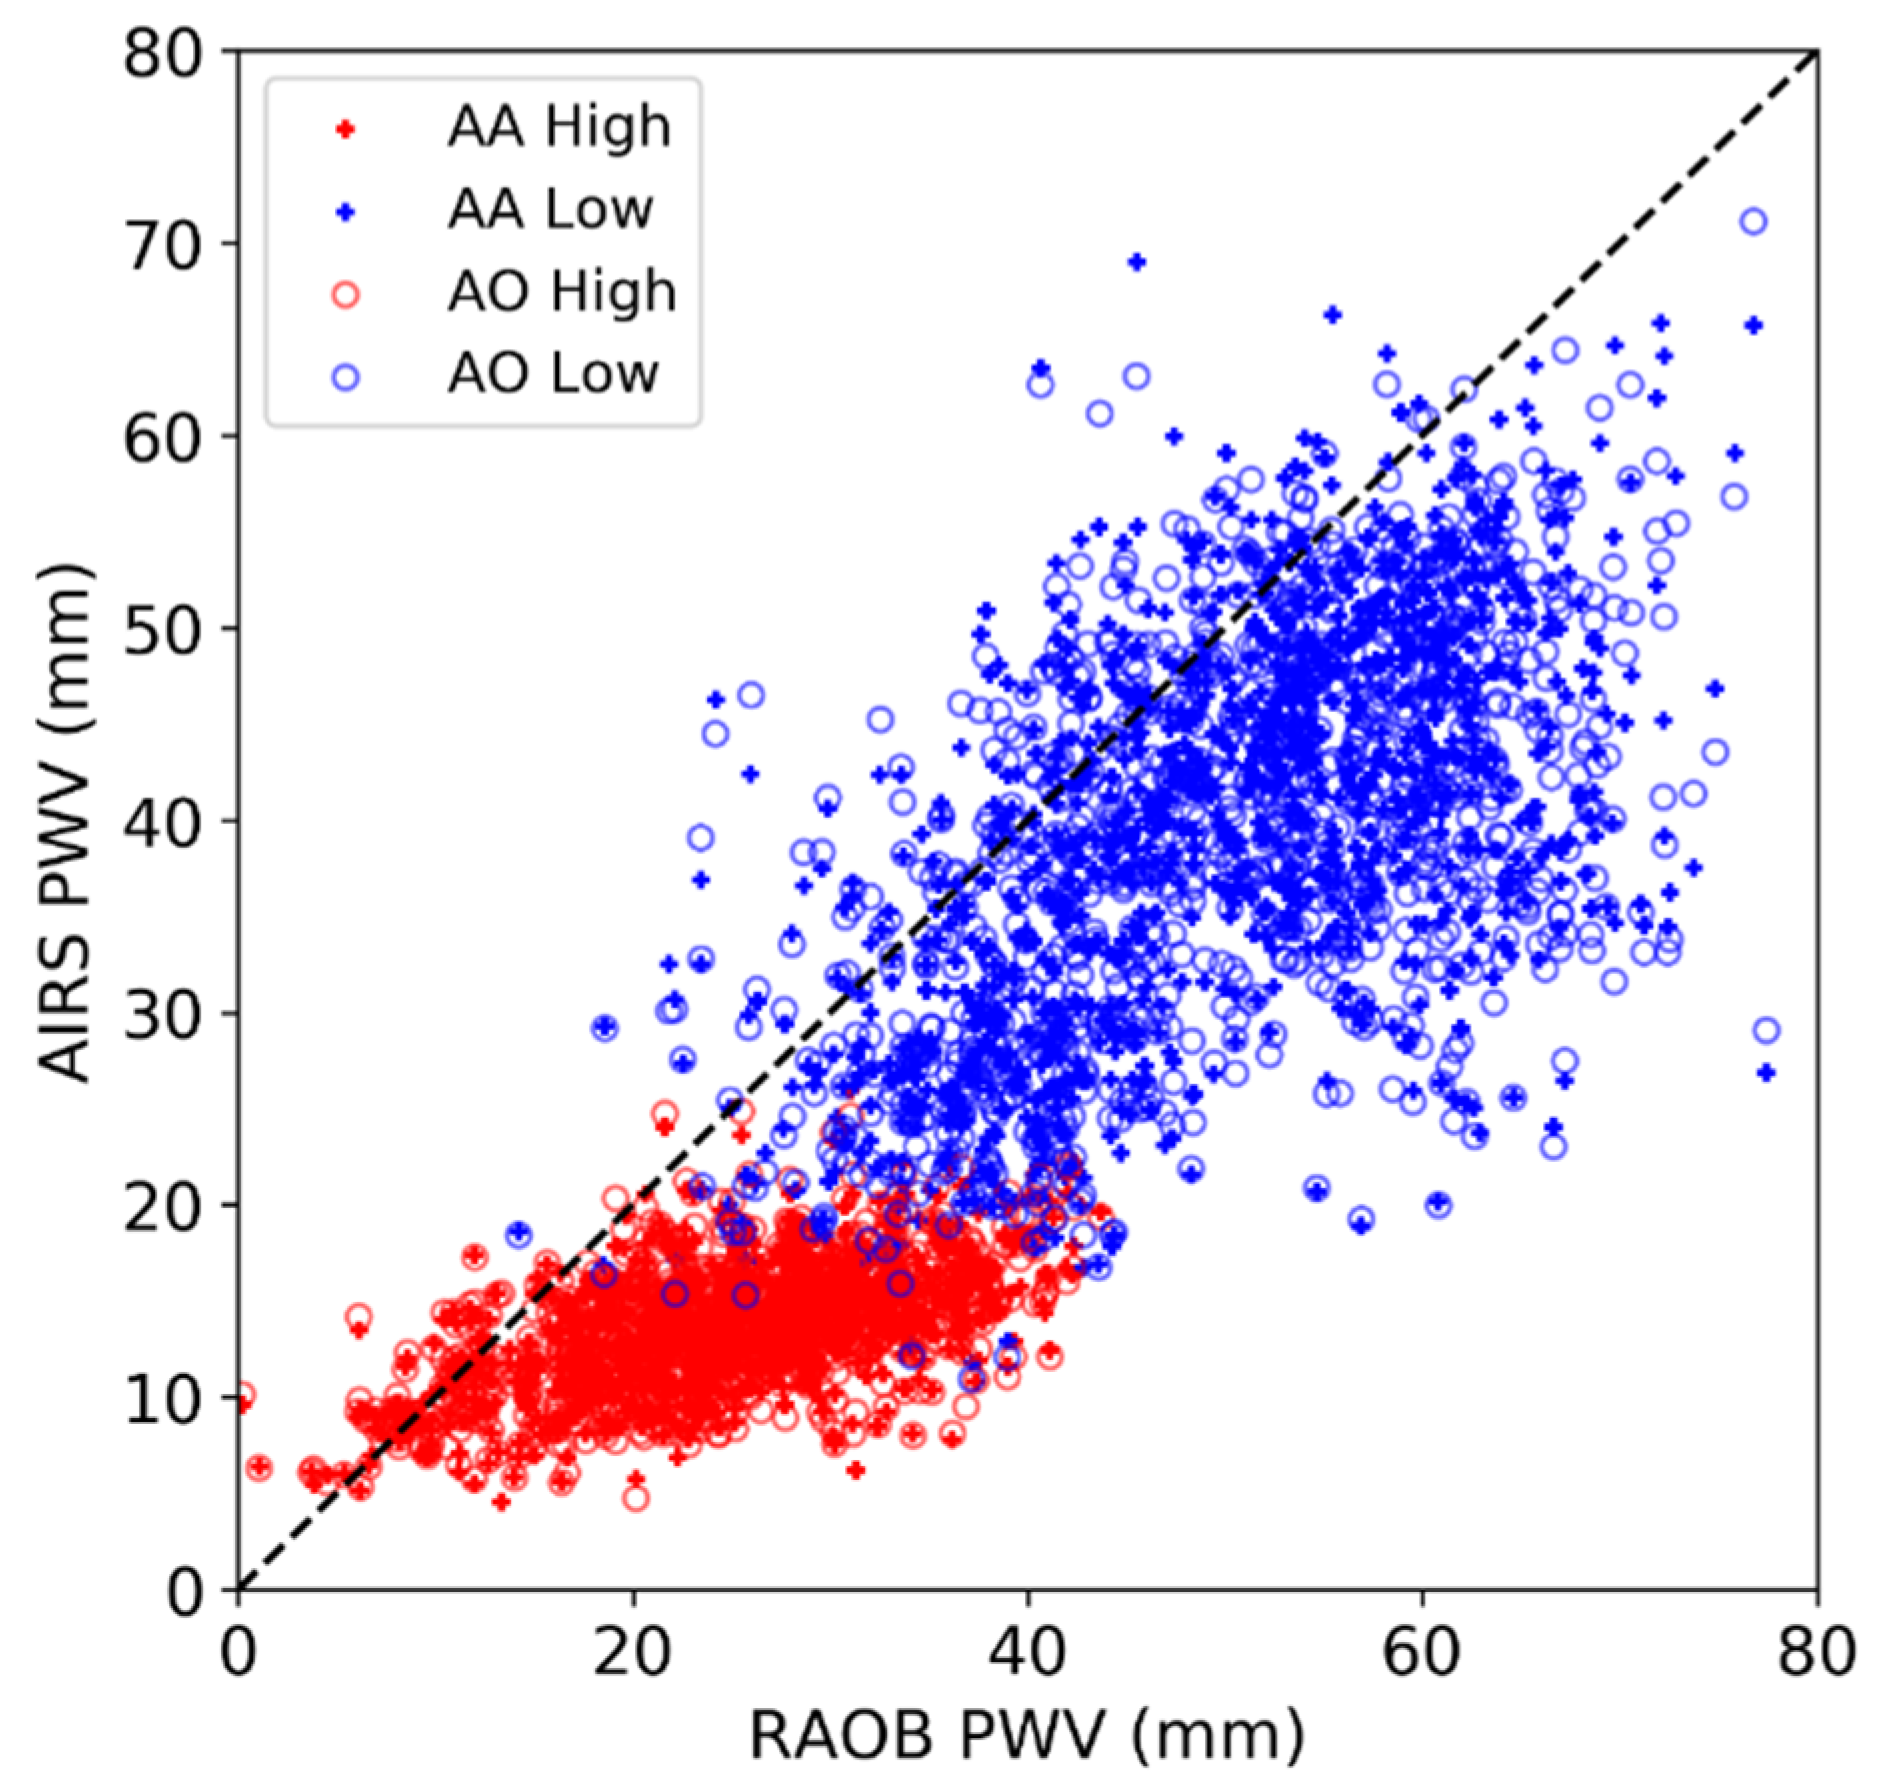
3.3. Comparison of PWV

The spatial patterns of bias and RMSE for both q and T show an influence of the terrain on the quality of AIRS products. The AIRS data quality over low-altitude sites tend to be superior. To further verify this feature, we assess PWV over different altitudes. The data are divided into two groups according to the terrain height of the radiosonde sites. One group of data includes matched profiles for the radiosonde data with site altitudes higher than 2000 m, and this is marked as the ‘high-altitude’ data set. The other group includes data matched for the radiosonde data with a site altitude lower than 2000 m, and this is marked as the ‘low-altitude’ data set.
Figure 6 presents scatterplots of AA and AO against RAOB for PWV over low-altitude and high-altitude sites. The RAOB PWV values vary from 20 mm to 80 mm, while the PWV values for AA and AO vary from 20 mm to 70 mm. As for the data over high-altitude sites, RAOB PWV exceeds 40 mm, but AIRS PWV is almost below 25 mm. The majority of the dots are plotted under the diagonal line, approximately 70% for blue dots and 85% for red dots, indicating that PWV is underestimated by AIRS. This is consistent with the findings of Zeng et al. [20], who reported a dry bias of AIRS PWV over Southwestern China. The differences between red and blue dotes show that the underestimation of PWV over the high-altitude sites by AIRS is worse than that for low-altitude sites. This is confirmed by linear regressions of AIRS against RAOB for PWV, which are shown in Table 2. The correlation coefficient between AIRS and RAOB is about 0.55–0.58, passing the 95% confidence test. The difference in the RMSE between high- and low-altitude sites is small, but the slopes and intercepts between the two groups are large.

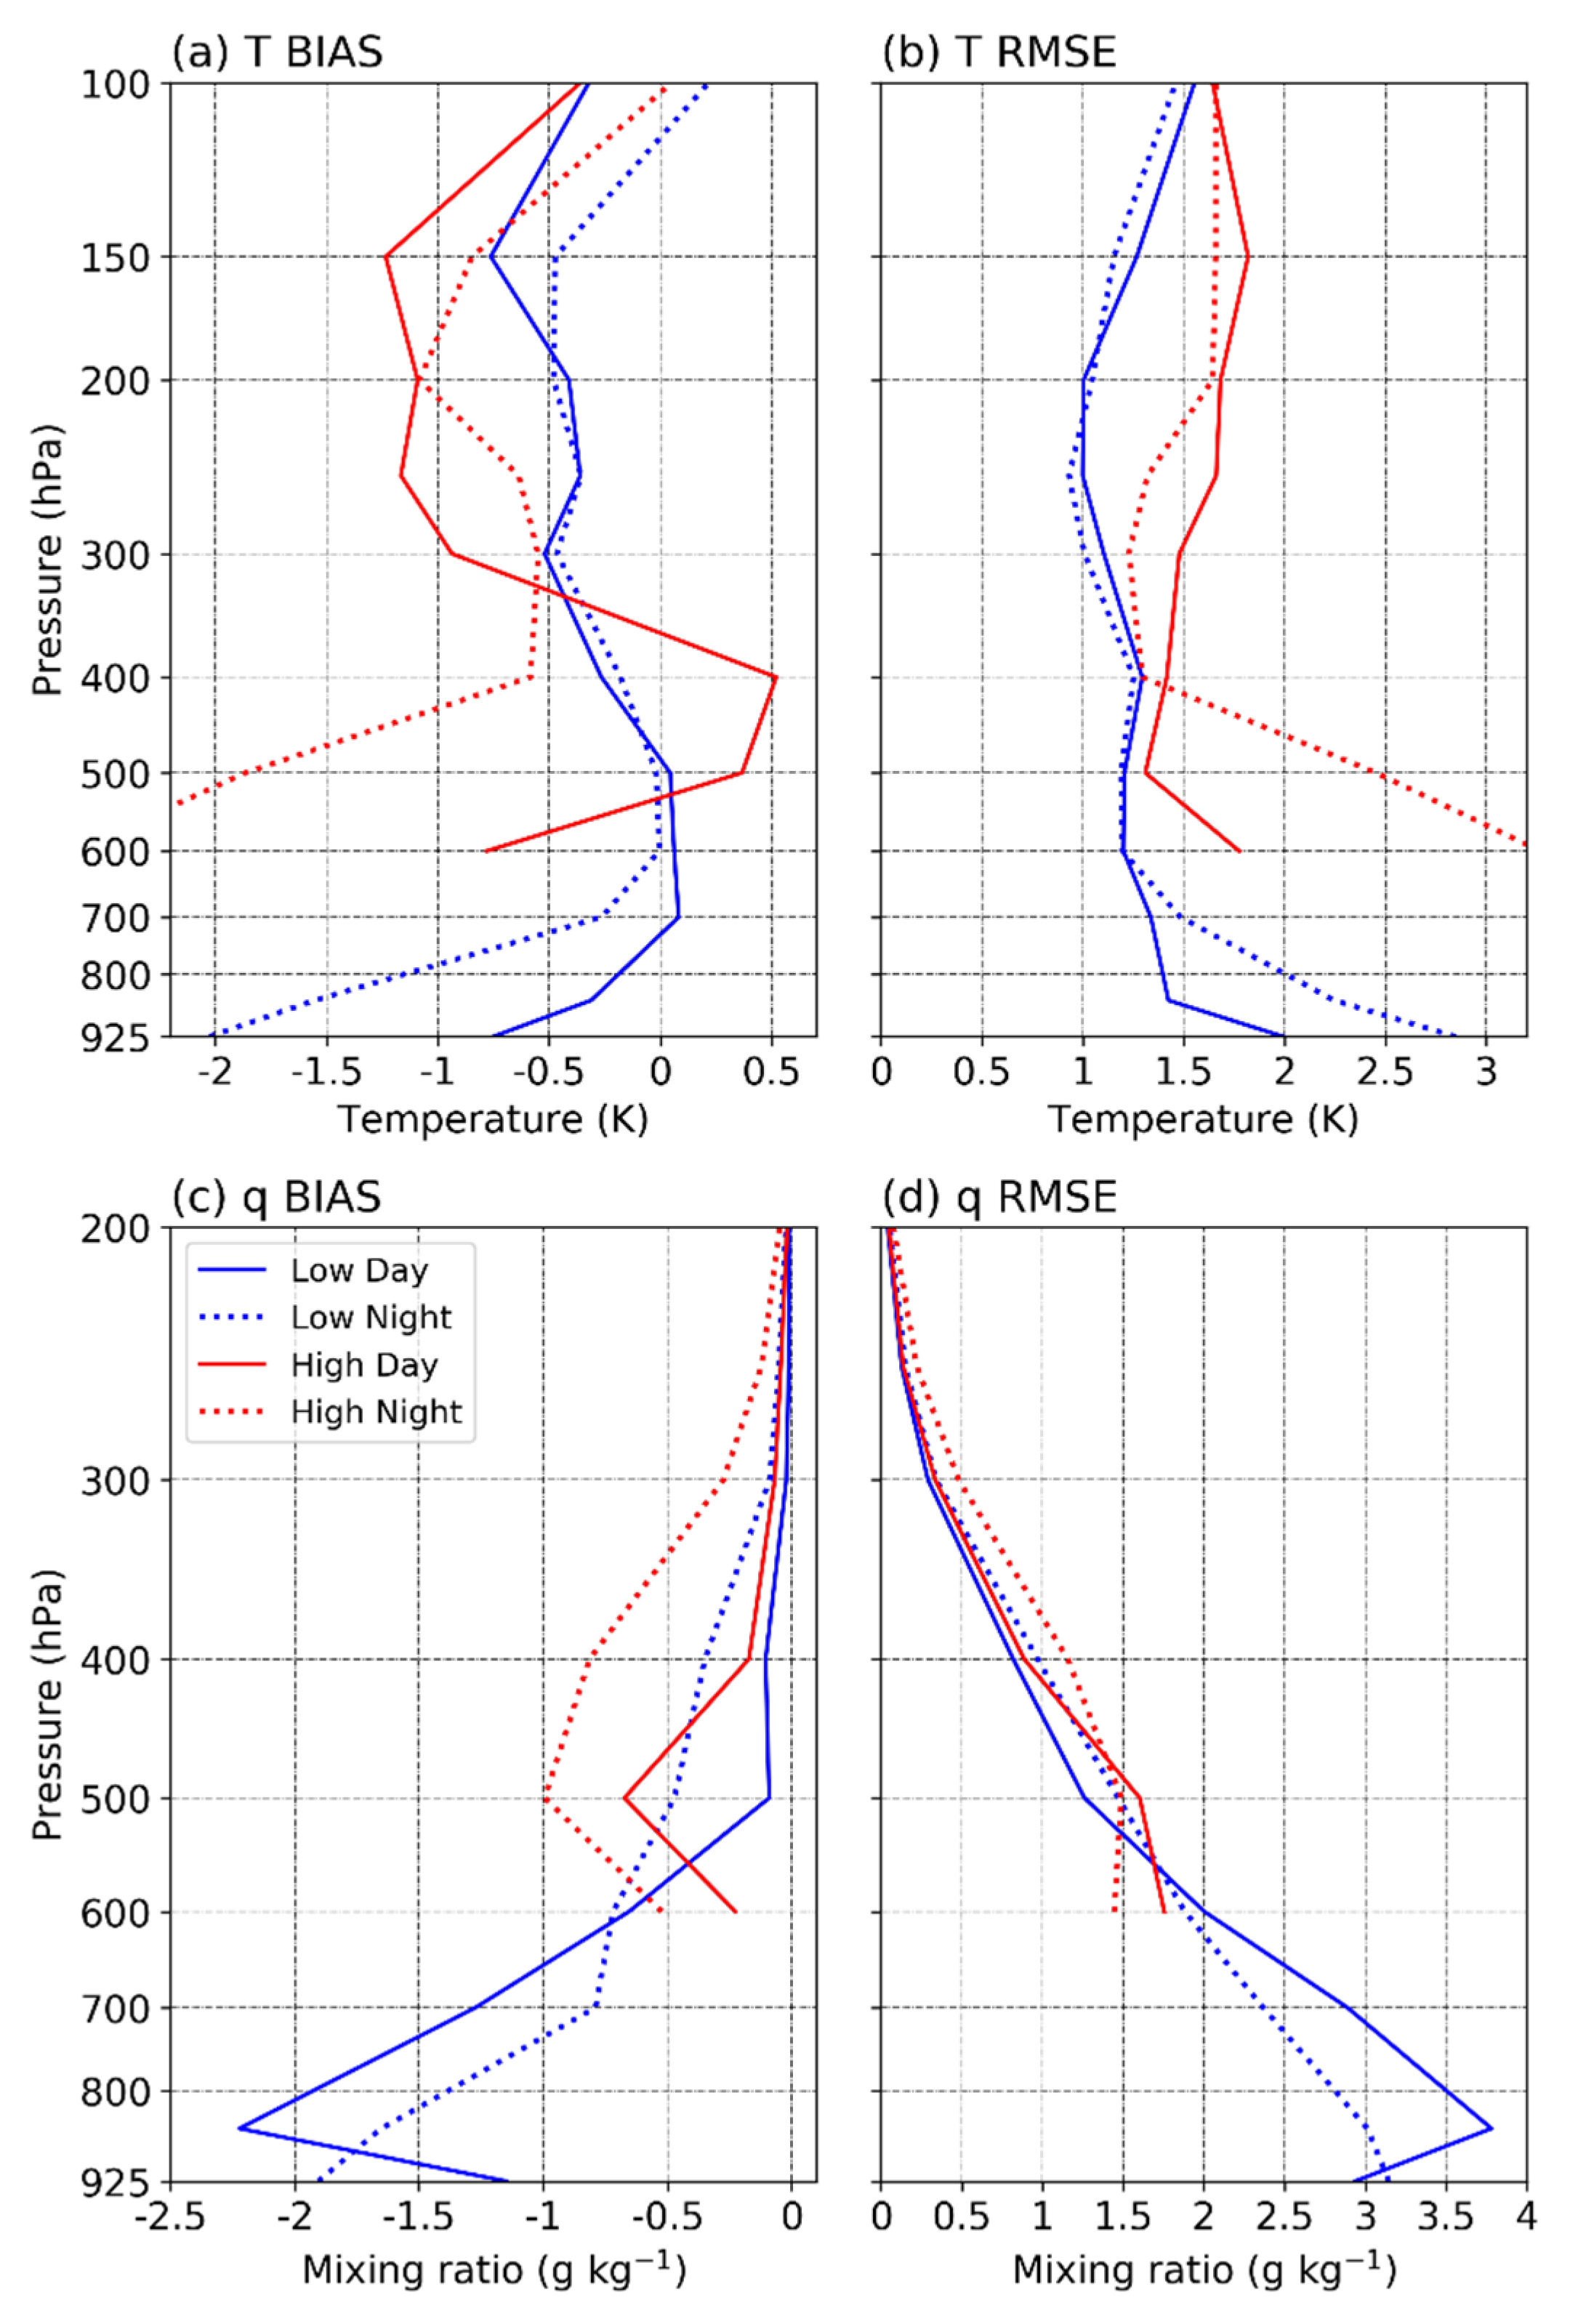
3.4. Comparison of Daytime and Nighttime Products

Because cloud is an important factor affecting the quality of AIRS products [20] and it has a strong diurnal cycle, we assess daytime and nighttime AIRS products separately. Based on the time of the AIRS observations, data are grouped into daytime and nighttime subsets. For every pair of profiles, observations around 06:00 UTC (local time is about 14:00) are treated as daytime data, while observations around 18:00 UTC (local time is about 2:00) are treated as nighttime data. Then, both the daytime and nighttime data sets are further segregated into two groups based on whether or not the height of radiosonde sites is higher than 2000 m.
Bias and RMSE for the four groups are shown in Figure 7. Generally, temperature bias is mostly negative for the four data sets. The differences in temperature biases between daytime and nighttime are larger in the low levels, below 600 hPa and 350 hPa for low- and high-altitude sites, respectively. Bias in daytime changes from negative to positive at 750–500 hPa and 550–350 hPa for low-altitude sites and high-altitude sites, respectively. The RMSEs of T for different data sets show a similar feature of biases. Poorer accuracy is found near the surface at nighttime. The RMSE is about 3.2 K at 600 hPa for high-altitude data and is about 2.8 K at 925 hPa for low-altitude data during nighttime. These analyses indicate that the AIRS temperature has a larger deficiency in the low levels in nighttime compared to that at daytime.
The bias and RMSE for q are presented in Figure 7c,d. Again, daytime products show generally better agreement with RAOB than nighttime data. The large difference between daytime and nighttime, however, is not limited to low levels. The difference in bias is generally large between 500 hPa and 300 hPa for both low-altitude and high-altitude data. Of note is that both bias and RMSE indicate a better quality of the nighttime moisture product below 600 hPa for the low-altitude sites.

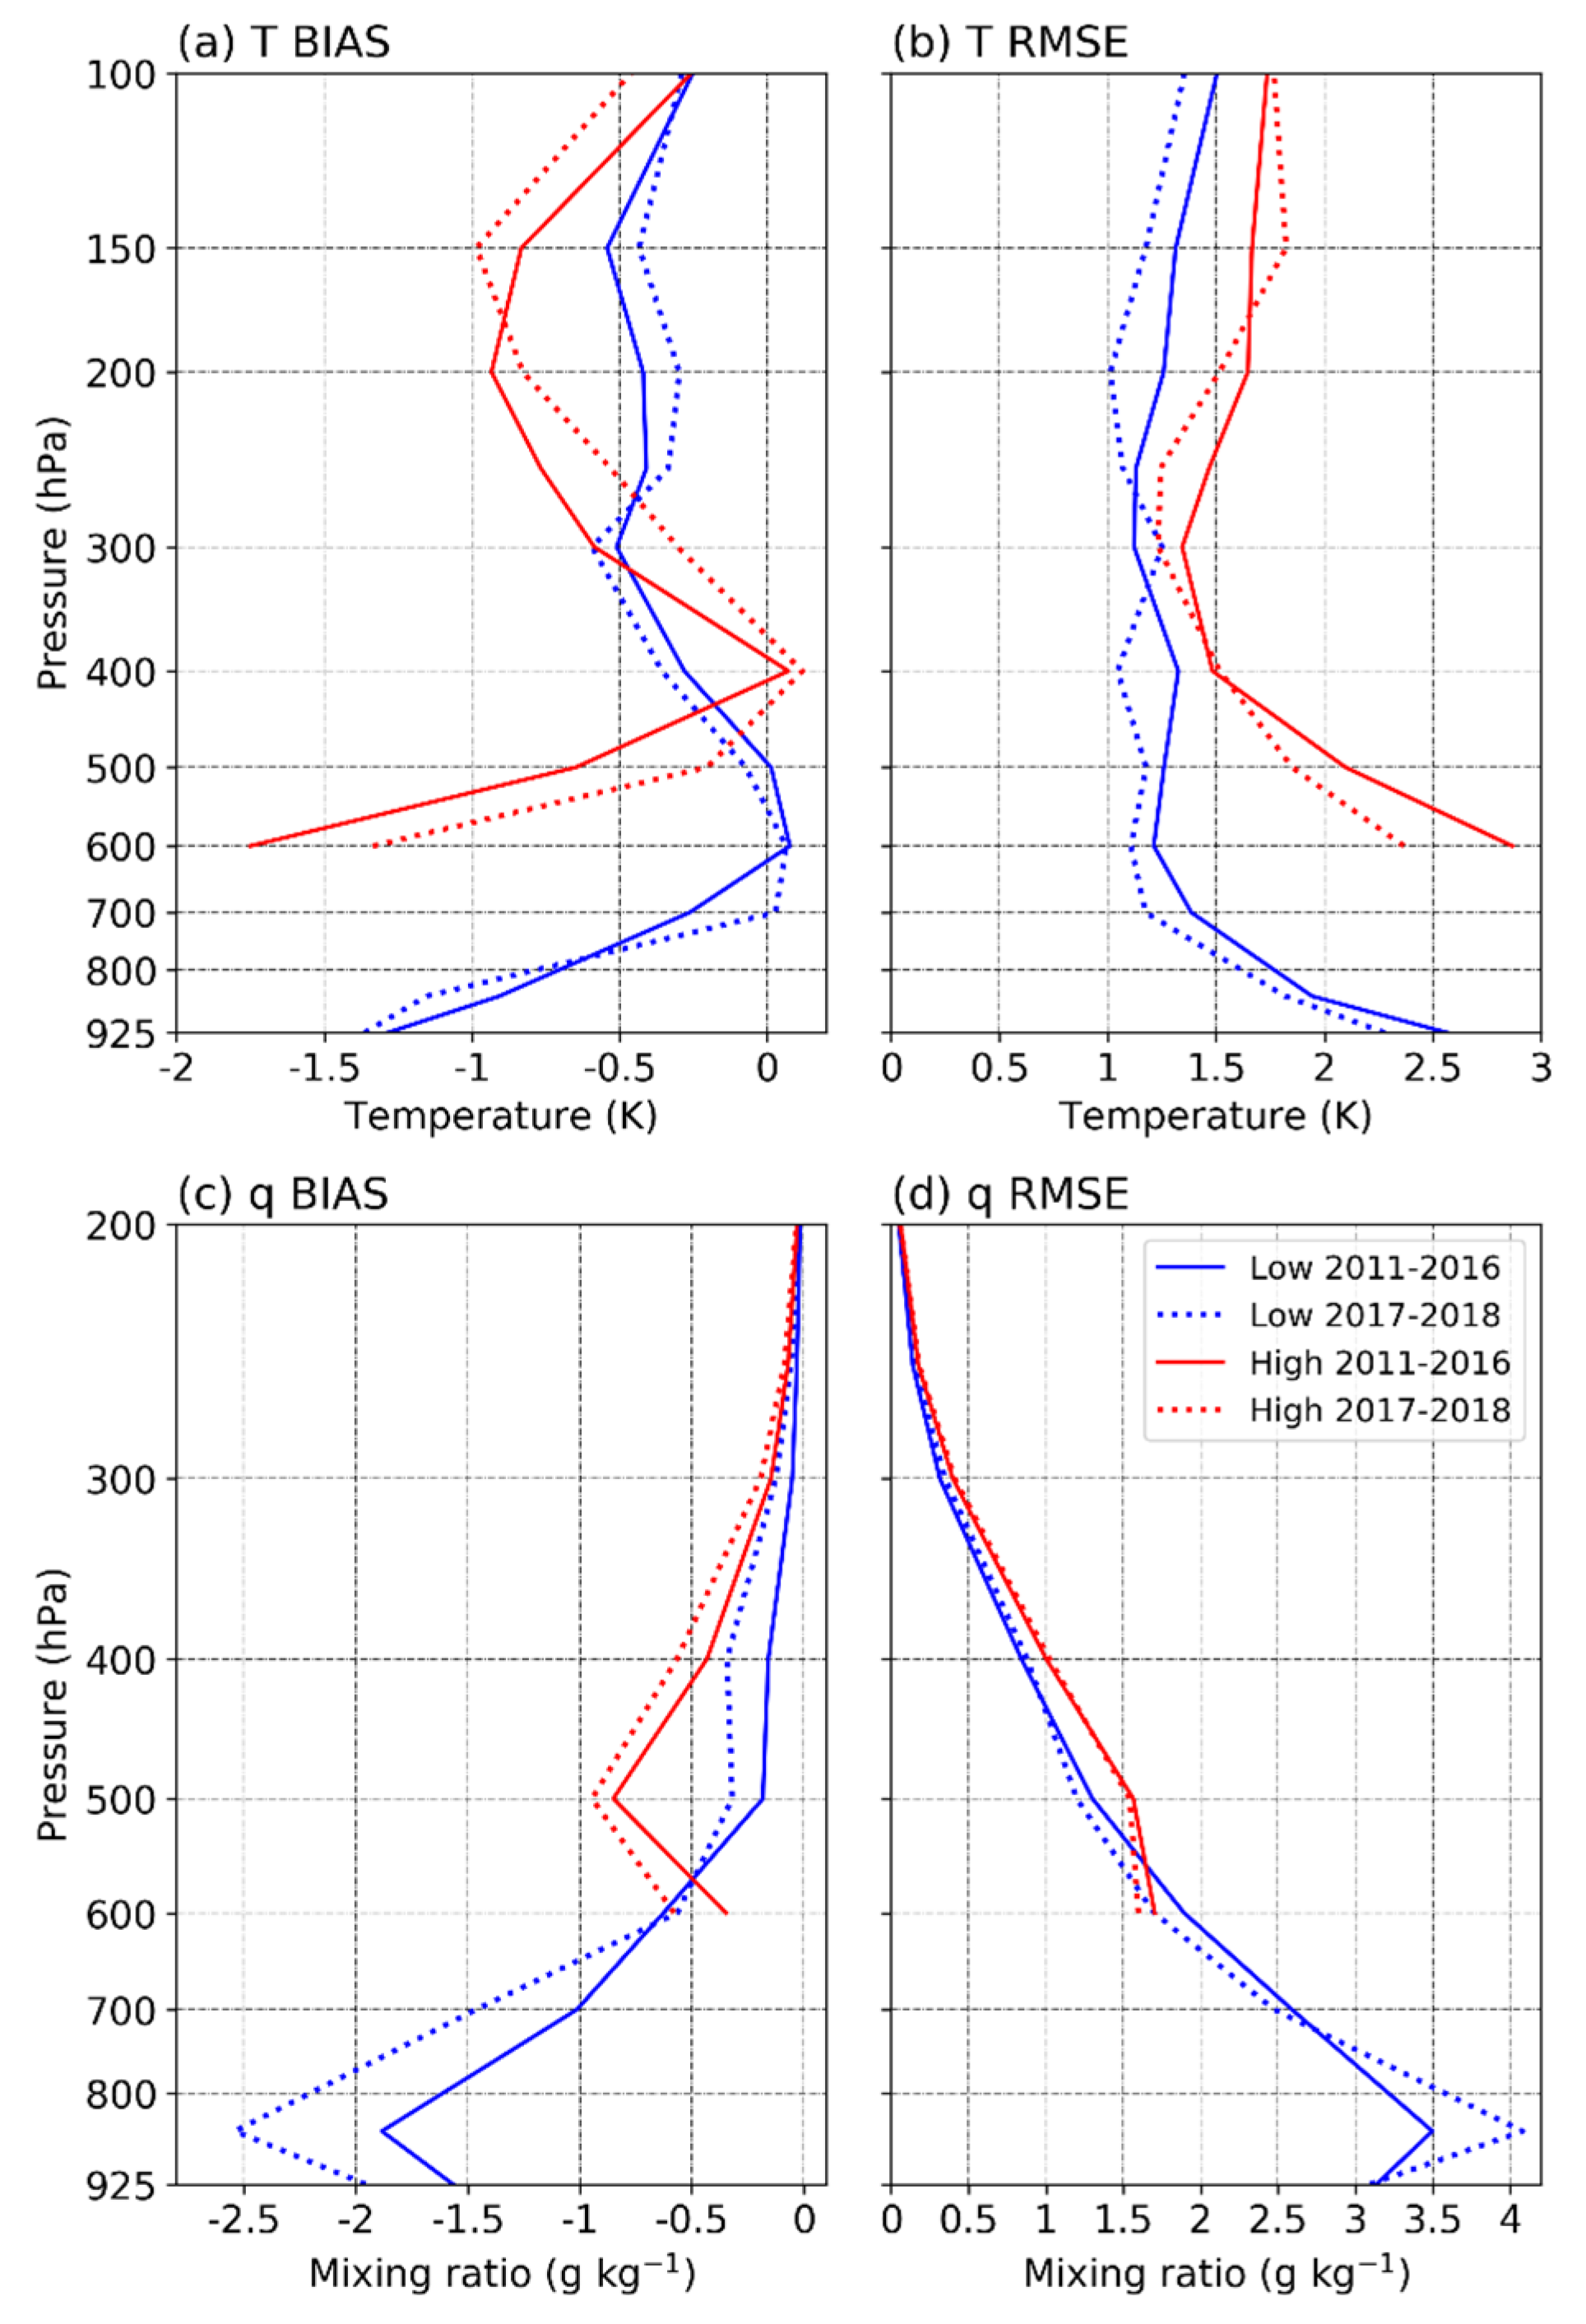
3.5. Comparison of AO Data between Two Periods

The AMSU instrument broke down in September 2016 and remains unfunctional, thus the AO data become the only option of AIRS products for long-term analysis. The above analyses are only based on 6-year AO data. Are the results obtained true for the data observed in the future? To address this question, we further investigate the quality of the AO data after 2017. Figure 8 shows bias and RMSE for both T and q. Generally, there is a good agreement in the vertical profiles of bias and RMSE for data sets between before and after 2017. Large bias is presented near the surface. The maximum difference of bias between before and after 2017, however, is only about 0.2 K at 600 hPa for temperature, and 0.6 g kg−1 at 850 hPa for moisture (Figure 8a,c). The maximum difference of RMSE between before and after 2017 is 0.4 K at 600 hPa for temperature and 0.6 g kg−1 at 850 hPa for moisture (Figure 8b,d). These results indicate that there are no large differences in bias and RMSE between before and after 2017. The current conclusions based on the data from 2011 to 2016 may be applied to data obtained in the future.

3.6. Impact of QC Levels on AIRS Data

All the above results are based on data at QC = 0 + 1. What about the quality of the data at QC = 0? Figure 9 shows the bias and RMSE of T and q for different QC levels. As expected, the bias and RMSE at QC = 0 are smaller than those of QC = 1, especially for moisture. The relative deviation of QC = 1 to QC = 0 shows that the bias or RMSE does not increase largely for temperature from QC = 0 to QC = 1, except for the values at 400 hPa and 500 hPa. However, both the bias and RMSE increase largely from QC = 0 to QC = 1 for moisture. The maximum increase occurs at 500 hPa for bias and at 200 hPa for RMSE. The 500 hPa bias increases seven times from QC = 0 to QC = 1. As the QC flags for q are set to be the same to those of T [22], the large difference indicates that the QC flags for q and T should be considered individually.

4. Discussions and Conclusions

AIRS products are important for weather prediction and climate monitoring for the lee of the TP, where the terrain is complex and surface observation is limited. Since 2010, there is upper-air observation at 5:15 and 17:15 UTC, provided by the intensive observation experiment by the Institute of Plateau Meteorology, China Meteorological Administration. The time of this radiosonde observation is close to the overpass time of the Aqua satellite, which makes it possible to evaluate the quality of AIRS products in this region, both in the day and at nighttime. Using radiosonde observation at 11 sites from 20 June to 31 July in the years 2011 to 2018, we assess the quality of AIRS version 6 products of AIRS/AMSU (AA) and AIRS-only (AO) data in the lee of the TP for the first time.
Overall, the AIRS products have a dry and cold bias in the lee of the TP, with larger bias and RMSE over the sites of higher altitude. The AIRS temperature has a larger deficiency in low levels at nighttime compared to that in the daytime, while a better quality of nighttime moisture product is found below 600 hPa over the low-altitude sites. The conclusions obtained in this study may be applied to data obtained over a longer period. The difference in the bias and RMSE for temperature between the data of QC = 0 and QC = 1 is small, but it is large for moisture, suggesting that the QC flags for temperature and moisture should be considered individually in this region.
As summarized in the work of Chahine and Pagano et al. [24], there are four factors that can explain the deviations between the retrieval products of AIRS and observations. They are: (1) the accuracy of the retrieval algorithm; (2) the influence of clouds; (3) the uncertainties in the surface emissivity; and (4) the deviations from the co-location process. In this study, the deviations resulting from the fourth factor are minimized using a critical data co-location criterion. However, certain other factors may also affect the uncertainties of the comparison. First, the radiosonde observation is about one hour earlier than the AIRS observation, the conditions of the lower troposphere could rapidly change if severe weather occurred, particularly during flood season. Second, over the complex terrain area, the one-site RAOB data may not represent the atmospheric state of the surrounding area, while AIRS data represent an areal-average state of the atmosphere at grids with a horizontal resolution of 45 km. In addition, cloud and surface emissivity could be another main contributor in the deviations between AIRS and RAOB data in the lee of the TP because of complex terrain and persistent low clouds in this region. Zeng and Mao et al. [20] pointed out that the accuracy of the AIRS water-vapor was very low in South China under high cloudy conditions. Reducing uncertainties in cloud and surface emissivity is a challenge, since the AIRS footprint is not fine enough in the cloud-clearing process, as well as the classification of the surface characteristics with the passive infrared remote sensing method. In spite of the overall cold and dry bias in the lee of the TP, and the larger biases near the surface, the AIRS temperature and water vapor products provide valuable vertical information in the weather and climate studies in the lee of the TP.

Author Contributions

Writing—original draft preparation, Z.H.; Writing—review and editing, X.J., Z.H.

Funding

This research was funded by the key project of the National Natural Science Foundation (grant no. 91337215), the Second Tibetan Plateau Scientific Expedition and Research (STEP) program (grant no. 2019QZKK0106), and the Sichuan Science and Technology Program (grant no. 2018JY0030).

Acknowledgments

The AIRS/AMSU and AIRS-only version 6 products were obtained from the Goddard Earth Sciences Data and Information Services Center (https://disc.gsfc.nasa.gov). We also wish to thank the two anonymous reviewers for their constructive comments.

Conflicts of Interest

The authors declare no conflict of interest.

References

  1. Wu, G.; Liu, Y.; He, B.; Bao, Q.; Duan, A.; Jin, F. Thermal controls on the Asian summer monsoon. Sci. Rep. 2012, 2, 404. [Google Scholar] [CrossRef] [PubMed]
  2. Rajagopalan, B.; Molnar, P. Signatures of Tibetan Plateau heating on Indian summer monsoon rainfall variability. J. Geophys. Res. Atmos. 2013, 118, 1170. [Google Scholar] [CrossRef]
  3. Xu, X.; Lu, C.; Ding, Y.; Shi, X.; Guo, Y.; Zhu, W. What is the relationship between China summer precipitation and the change of apparent heat source over the Tibetan Plateau? Atmos. Sci. Lett. 2013, 14, 227–234. [Google Scholar] [CrossRef]
  4. Li, Y.; Li, D.; Yang, S.; Liu, C.; Zhong, A.; Li, Y. Characteristics of the precipitation over the eastern edge of the Tibetan Plateau. Meteorol. Atmos. Phys. 2010, 106, 49–56. [Google Scholar] [CrossRef]
  5. Wang, Y.; Wang, L.; Li, X.; Chen, D. Temporal and spatial changes in estimated near-surface air temperature lapse rates on Tibetan Plateau. Int. J. Climatol. 2018, 38, 2907–2921. [Google Scholar] [CrossRef]
  6. Zhao, Y.; Xu, X.; Zhao, T.; Yang, X. Effects of the Tibetan Plateau and its second staircase terrain on rainstorms over North China: From the perspective of water vapour transport. Int. J. Climatol. 2019, 39, 1–13. [Google Scholar] [CrossRef]
  7. Qian, T.; Zhao, P.; Zhang, F.; Bao, X. Rainy-season precipitation over the Sichuan basin and adjacent regions in Southwestern China. Mon. Wea. Rev. 2015, 143, 383–394. [Google Scholar] [CrossRef]
  8. Cheng, X.; Li, Y.; Xu, L. An analysis of an extreme rainstorm caused by the interaction of the Tibetan Plateau vortex and the Southwest China vortex from an intensive observation. Meteorol. Atmos. Phys. 2016, 128, 373–399. [Google Scholar] [CrossRef]
  9. Yu, S.; Gao, W.; Xiao, D.; Peng, J. Observational facts regarding the joint activities of the southwest vortex and plateau vortex after its departure from the Tibetan Plateau. Adv. Atmos. Sci. 2016, 33, 34–46. [Google Scholar] [CrossRef]
  10. Li, L.; Zhang, R.; Wen, M. Genesis of southwest vortices and its relation to Tibetan Plateau vortices. Q. J. R. Meteorol. Soc. 2017, 143, 2556–2566. [Google Scholar] [CrossRef]
  11. McNally, A.P.; Watts, P.D.; Smith, J.A.; Engelen, R.; Kelly, G.A.; Thépaut, J.N.; Matricardi, M. The assimilation of AIRS radiance data at ECMWF. Q. J. R. Meteorol. Soc. 2006, 132, 935–957. [Google Scholar] [CrossRef] [Green Version]
  12. Raju, A.; Parekh, A.; Kumar, P.; Gnanaseelan, C. Evaluation of the impact of AIRS profiles on prediction of Indian summer monsoon using WRF variational data assimilation system. J. Geophys. Res. Atmos. 2015, 120, 8112–8131. [Google Scholar] [CrossRef]
  13. Zheng, J.; Li, J.; Schmit, T.J.; Li, J.; Liu, Z. The impact of AIRS atmospheric temperature and moisture profiles on hurricane forecasts: Ike (2008) and Irene (2011). Adv. Atmos. Sci. 2015, 32, 319–335. [Google Scholar] [CrossRef]
  14. Pan, F.; Huang, X.; Leroy, S.S.; Lin, P.; Strow, L.L.; Ming, Y.; Ramaswamy, V. The stratospheric changes inferred from 10 years of AIRS and AMSU-A radiances. J. Clim. 2017, 30, 6005–6016. [Google Scholar] [CrossRef]
  15. Wang, X.; Jiang, H. A 13-year global climatology of tropical cyclone warm-core structures from AIRS data. Mon. Wea. Rev. 2019, 147, 773–790. [Google Scholar] [CrossRef]
  16. Fetzer, E.J.; Lambrigtsen, B.H.; Eldering, A.; Aumann, H.H.; Chahine, M.T. Biases in total precipitable water vapor climatologies from atmospheric infrared sounder and advanced microwave scanning radiometer. J. Geophys. Res. 2006, 111. [Google Scholar] [CrossRef]
  17. Yue, Q.; Fetzer, E.J.; Kahn, B.H.; Wong, S.; Manipon, G.; Guillaume, A.; Wilson, B. Cloud-state-dependent sampling in AIRS observations based on cloudsat cloud classification. J. Clim. 2013, 26, 8357–8377. [Google Scholar] [CrossRef]
  18. Boylan, P.; Wang, J.; Cohn, S.A.; Fetzer, E.; Maddy, E.S.; Wong, S. Validation of AIRS version 6 temperature profiles and surface-based inversions over Antarctica using Concordiasi dropsonde data. J. Geophys. Res. Atmos. 2015, 120, 992–1007. [Google Scholar] [CrossRef]
  19. Divakarla, M.G.; Barnet, C.D.; Goldberg, M.D.; McMillin, L.M.; Maddy, E.; Wolf, W.; Zhou, L.; Liu, X. Validation of atmospheric infrared sounder temperature and water vapor retrievals with matched radiosonde measurements and forecasts. J. Geophys. Res. 2006, 111. [Google Scholar] [CrossRef]
  20. Zeng, Z.; Mao, F.; Wang, Z.; Guo, J.; Gui, K.; An, J.; Yim, S.H.L.; Yang, Y.; Zhang, B.; Jiang, H. Preliminary evaluation of the atmospheric infrared sounder water vapor over China against high-resolution radiosonde measurements. J. Geophys. Res. Atmos. 2019, 124, 3871–3888. [Google Scholar] [CrossRef]
  21. Zhou, T.; Yu, R.; Chen, H.; Dai, A.; Pan, Y. Summer precipitation frequency, intensity, and diurnal cycle over China: A comparison of satellite data with rain gauge observations. J. Clim. 2008, 21, 3997–4010. [Google Scholar] [CrossRef]
  22. Susskind, J.; Blaisdell, J.M.; Iredell, L. Improved methodology for surface and atmospheric soundings, error estimates, and quality control procedures: The atmospheric infrared sounder science team version-6 retrieval algorithm. J. Appl. Remote Sens. 2014, 8, 84994. [Google Scholar] [CrossRef]
  23. Aumann, H.H.; Chahine, M.T.; Gautier, C.; Goldberg, M.D.; Kalnay, E.; McMillin, L.M.; Revercomb, H.; Rosenkranz, P.W.; Smith, W.L.; Staelin, D.H.; et al. AIRS/AMSU/HSB on the aqua mission: Design, science objectives, data products, and processing systems. IEEE Trans. Geosci. Remote Sens. 2003, 41, 253–264. [Google Scholar] [CrossRef]
  24. Chahine, M.T.; Pagano, T.S.; Aumann, H.H.; Atlas, R.; Barnet, C.; Blaisdell, J.; Chen, L.; Divakarla, M.; Fetzer, E.J.; Goldberg, M.; et al. AIRS: Improving weather forecasting and providing new data on greenhouse gases. Bull. Am. Meteor. Soc. 2006, 87, 911–926. [Google Scholar] [CrossRef]
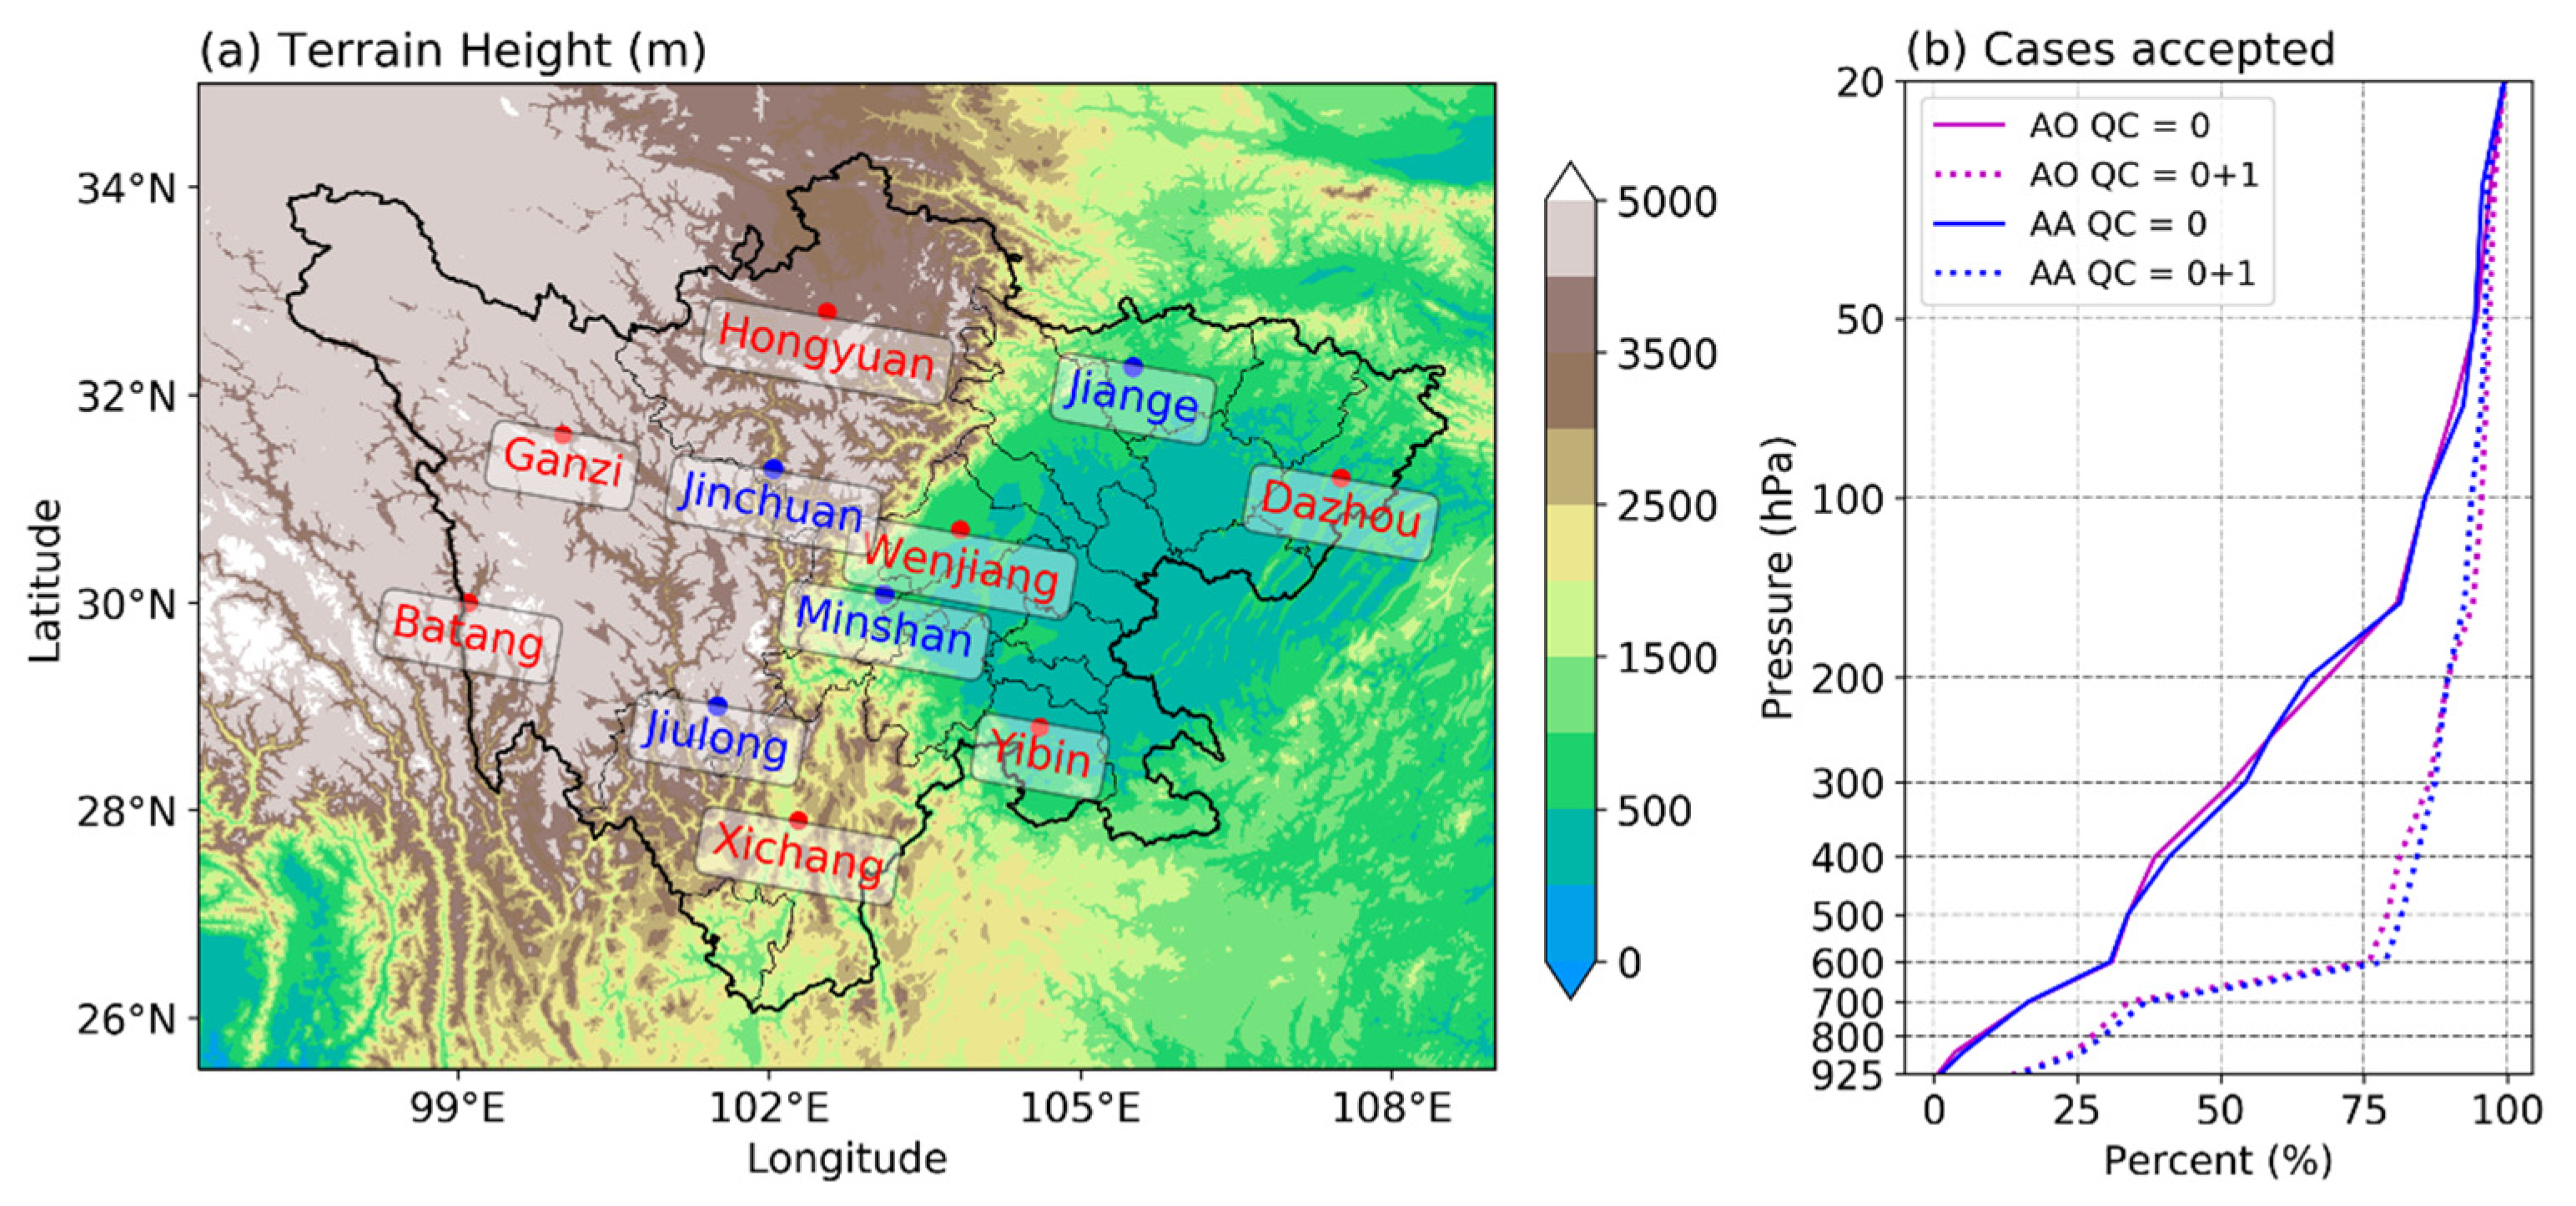
Figure 1. (a) Topographic height in the lee of the TP and the position of radiosonde sites, blue (red) words indicate intensive (operational) radiosonde sites; (b) percentage of sample numbers of Atmospheric Infrared Sounder (AIRS) at different quality control levels, from 20 June to 31 July from 2011 to 2016. The solid lines show ‘best’ quality (quality control (QC) = 0) data and the dashed lines show ‘good’ quality (QC = 1) data. The AA indicates the AIRS/Advanced Microwave Sounding Unit (AMSU) products and AO indicates the AIRS-only products.
Atmosphere 10 00394 g001
Figure 2. Vertical profiles of the mean (in blue) and standard deviation (in red) of (a) temperature and (b) water vapor mixing ratio from 20 June to 31 July in the years 2011 to 2016. Values of AIRS/AMSU (AA) are shown as dashed lines and radiosonde observations (RAOB) as solid lines.
Atmosphere 10 00394 g002
Figure 3. Bias (left column) and root-mean-square errors (RMSE) (right column) for AIRS/AMSU (AA; solid lines) and AIRS-only (AO; dashed lines) data against RAOB measurements, from 20 June to 31 July in the years 2011 to 2016. (a) shows bias of T, (b) RMSE of T, (c) bias of q, and (d) RMSE of q.
Atmosphere 10 00394 g003
Figure 4. Spatial distribution of bias of T at 600 hPa (a) and 300 hPa (b), and bias of q at 600 hPa (c) and 300 hPa (d), for different radiosonde sites for AIRS/AMSU (AA) data.
Atmosphere 10 00394 g004
Figure 5. Same as in Figure 4, but for RMSE. (a) shows RMSE of T at 600 hPa, (b) at 300 hPa, and (c) RMSE of q at 600 hPa, (d) at 300hPa.
Atmosphere 10 00394 g005
Figure 6. Scatterplots of AIRS/AMSU (AA) precipitable water vapor (PWV), AIRS-only (AO) PWV, and radiosonde PWV over different terrain heights, from 20 June to 31 July in the years 2011 to 2016.
Atmosphere 10 00394 g006
Figure 7. Bias (left column) and RMSE (right column) of T and q for AIRS/AMSU (AA) data against RAOB measurements of different observation times and site altitudes. (a) shows bias of T, (b) RMSE of T, (c) bias of q, and (d) RMSE of q.
Atmosphere 10 00394 g007
Figure 8. Bias (left column) and RMSE (right column) for the AIRS-only (AO) data from 2011 to 2016 (solid lines) and from 2017–2018 (dashed lines) for low-altitude and high-altitude sites. (a) shows bias of T, (b) RMSE of T, (c) bias of q, and (d) RMSE of q.
Atmosphere 10 00394 g008
Figure 9. Mean bias (left column) and RMSE (right column) of AIRS/AMSU (AA) data against RAOB for different QC level (QC = 0 solid blue lines and QC = 1 dashed lines). The relative deviations of bias and RMSE between QC = 0 and QC = 1 are shown in red lines. (a) shows bias of T, (b) RMSE of T, (c) bias of q, and (d) RMSE of q.
Atmosphere 10 00394 g009
Table 1. Radiosonde sites in the lee of the Tibetan Plateau (TP).
Radiosonde SiteLatitude (°)Longitude (°)Height (m)
Batang30.0099.102589
Dazhou31.20107.51311
Ganzi31.62100.013394
Hongyuan32.80102.563422
Jiange32.27105.51522
Jinchuan31.29102.042165
Jiulong29.00101.502919
Minshan30.08103.11690
Wenjiang30.70103.84541
Xichang27.90102.281592
Yibin28.80104.61342
Table 2. Linear regression of AIRS/AMSU (AA) and AIRS-only (AO) against RAOB for PWV, from 20 June to 31 July in the years 2011 to 2016.
Data GroupsSlopeInterceptrRMSE
AA High0.228.080.5513.05
AA Low0.5611.360.5814.26
AO High0.228.010.5513.04
AO Low0.5113.010.5514.99

