Article

Seasonal Levels, Sources, and Health Risks of Heavy Metals in Atmospheric PM2.5 from Four Functional Areas of Nanjing City, Eastern China

1
International Center for Ecology, Meteorology, and Environment, Collaborative Innovation Center of Atmospheric Environment and Equipment Technology (AEET), School of Applied Meteorology, Nanjing University of Information Science & Technology, Nanjing 210044, China
2
State Key Laboratory of Pollution Control and Resource Reuse, School of the Environment, Nanjing University, Nanjing 210023, China
3
Key Laboratory of Soil Environment and Pollution Remediation, Institute of Soil Science, Chinese Academy of Sciences, Nanjing 210008, China
*
Author to whom correspondence should be addressed.
Atmosphere 2019, 10(7), 419; https://doi.org/10.3390/atmos10070419
Submission received: 30 June 2019 / Revised: 16 July 2019 / Accepted: 16 July 2019 / Published: 21 July 2019
(This article belongs to the Special Issue Air Quality Control and Planning)

Abstract

:
Aerosol pollution is a serious environmental issue, especially in China where there has been rapid urbanization. To identify the intra-annual and regional distributions of health risks and potential sources of heavy metals in atmospheric particles with an aerodynamic diameter less than or equal to 2.5 μm (PM2.5), this work collected monthly PM2.5 samples from urban, industrial, suburban, and rural areas in Nanjing city during 2016 and analyzed the heavy metal compositions (Cu, Pb, Cd, Co, V, Sr, Mn, Ti, and Sb). Enrichment factors (EFs) and principal component analysis (PCA) were applied to investigate the sources. The atmospheric PM2.5 pollution level was highest in the industrial area, followed by the urban and suburban areas, and was the lowest in the rural area. Seasonally, the concentrations of PM2.5 and associated heavy metals in spring and winter were higher than those in summer and autumn. Besides natural sources, heavy metal pollution in PM2.5 might come from metallurgical dust in the industrial area, while it mainly comes from automobile exhaust in urban and suburban areas. Health risk assessments revealed that noncancerous hazards of heavy metals in PM2.5 were low, while the lifetime cancer risks obviously exceeded the threshold. The airborne metal pollution in various functional areas of the city impacted human health differently.

1. Introduction

Atmospheric particulate matter (PM) contributes to air pollution continuously [1] and has critical influences on both the environment and human health. The World Health Organization (WHO) has reported that air pollution was responsible for 3.7 million deaths in 2012, including 29% of heart disease and stroke deaths, 16% of lung cancer deaths, 11% of chronic-obstructive-pulmonary-disease-related deaths, and approximately 13% of deaths that were due to respiratory infections [2]. Epidemiological studies have shown that PM is associated with increased disease morbidity and mortality, especially heart and lung diseases. PM has become the primary pollutant in the ambient air of China, typically as PM2.5 [3]. PM2.5 refers to atmospheric particles with an aerodynamic diameter less than or equal to 2.5 μm. The spatial distribution of PM2.5 concentrations varies greatly in China, and PM2.5 is generally higher in northern than in southern China [4]. Seasonal variation of PM2.5 is obvious and the highest concentration is during winter while the lowest is in summer [5]. PM2.5 has a larger surface area than coarse PM; thus, it is more likely to adsorb toxic or harmful components such as heavy metals [6,7]. The chemical composition of PM can better identify pollution sources and explain the associated health effects [8]. Heavy metals are highly enriched in PM2.5 and can be directly inhaled into the respiratory tract. Furthermore, they remain in the atmosphere for a long time and can be transported far away, thus making them a considerable cause for concern [9]. The As, Cd, Cr, Hg, Mn, Ni, Pb, and V in the environment can cause various diseases such as asthma, pneumonia, lung cancer, and cerebral hemorrhage [10]. Although heavy metals account for only a small part of the mass concentration of PM2.5, they still pose threats to human health through respiration [11,12,13]. Spatial forecasting of urban air pollution might be beneficial for risk assessments, but it is necessary to know the actual distribution patterns [14,15,16].
Since previous research has already focused on the air pollution level of heavy metals [17], the objectives of this study were to investigate and compare the seasonal distribution characteristics, sources, and human health risks of PM2.5-bound heavy metals in different functional areas of a typical megacity in eastern China.

2. Materials and Methods
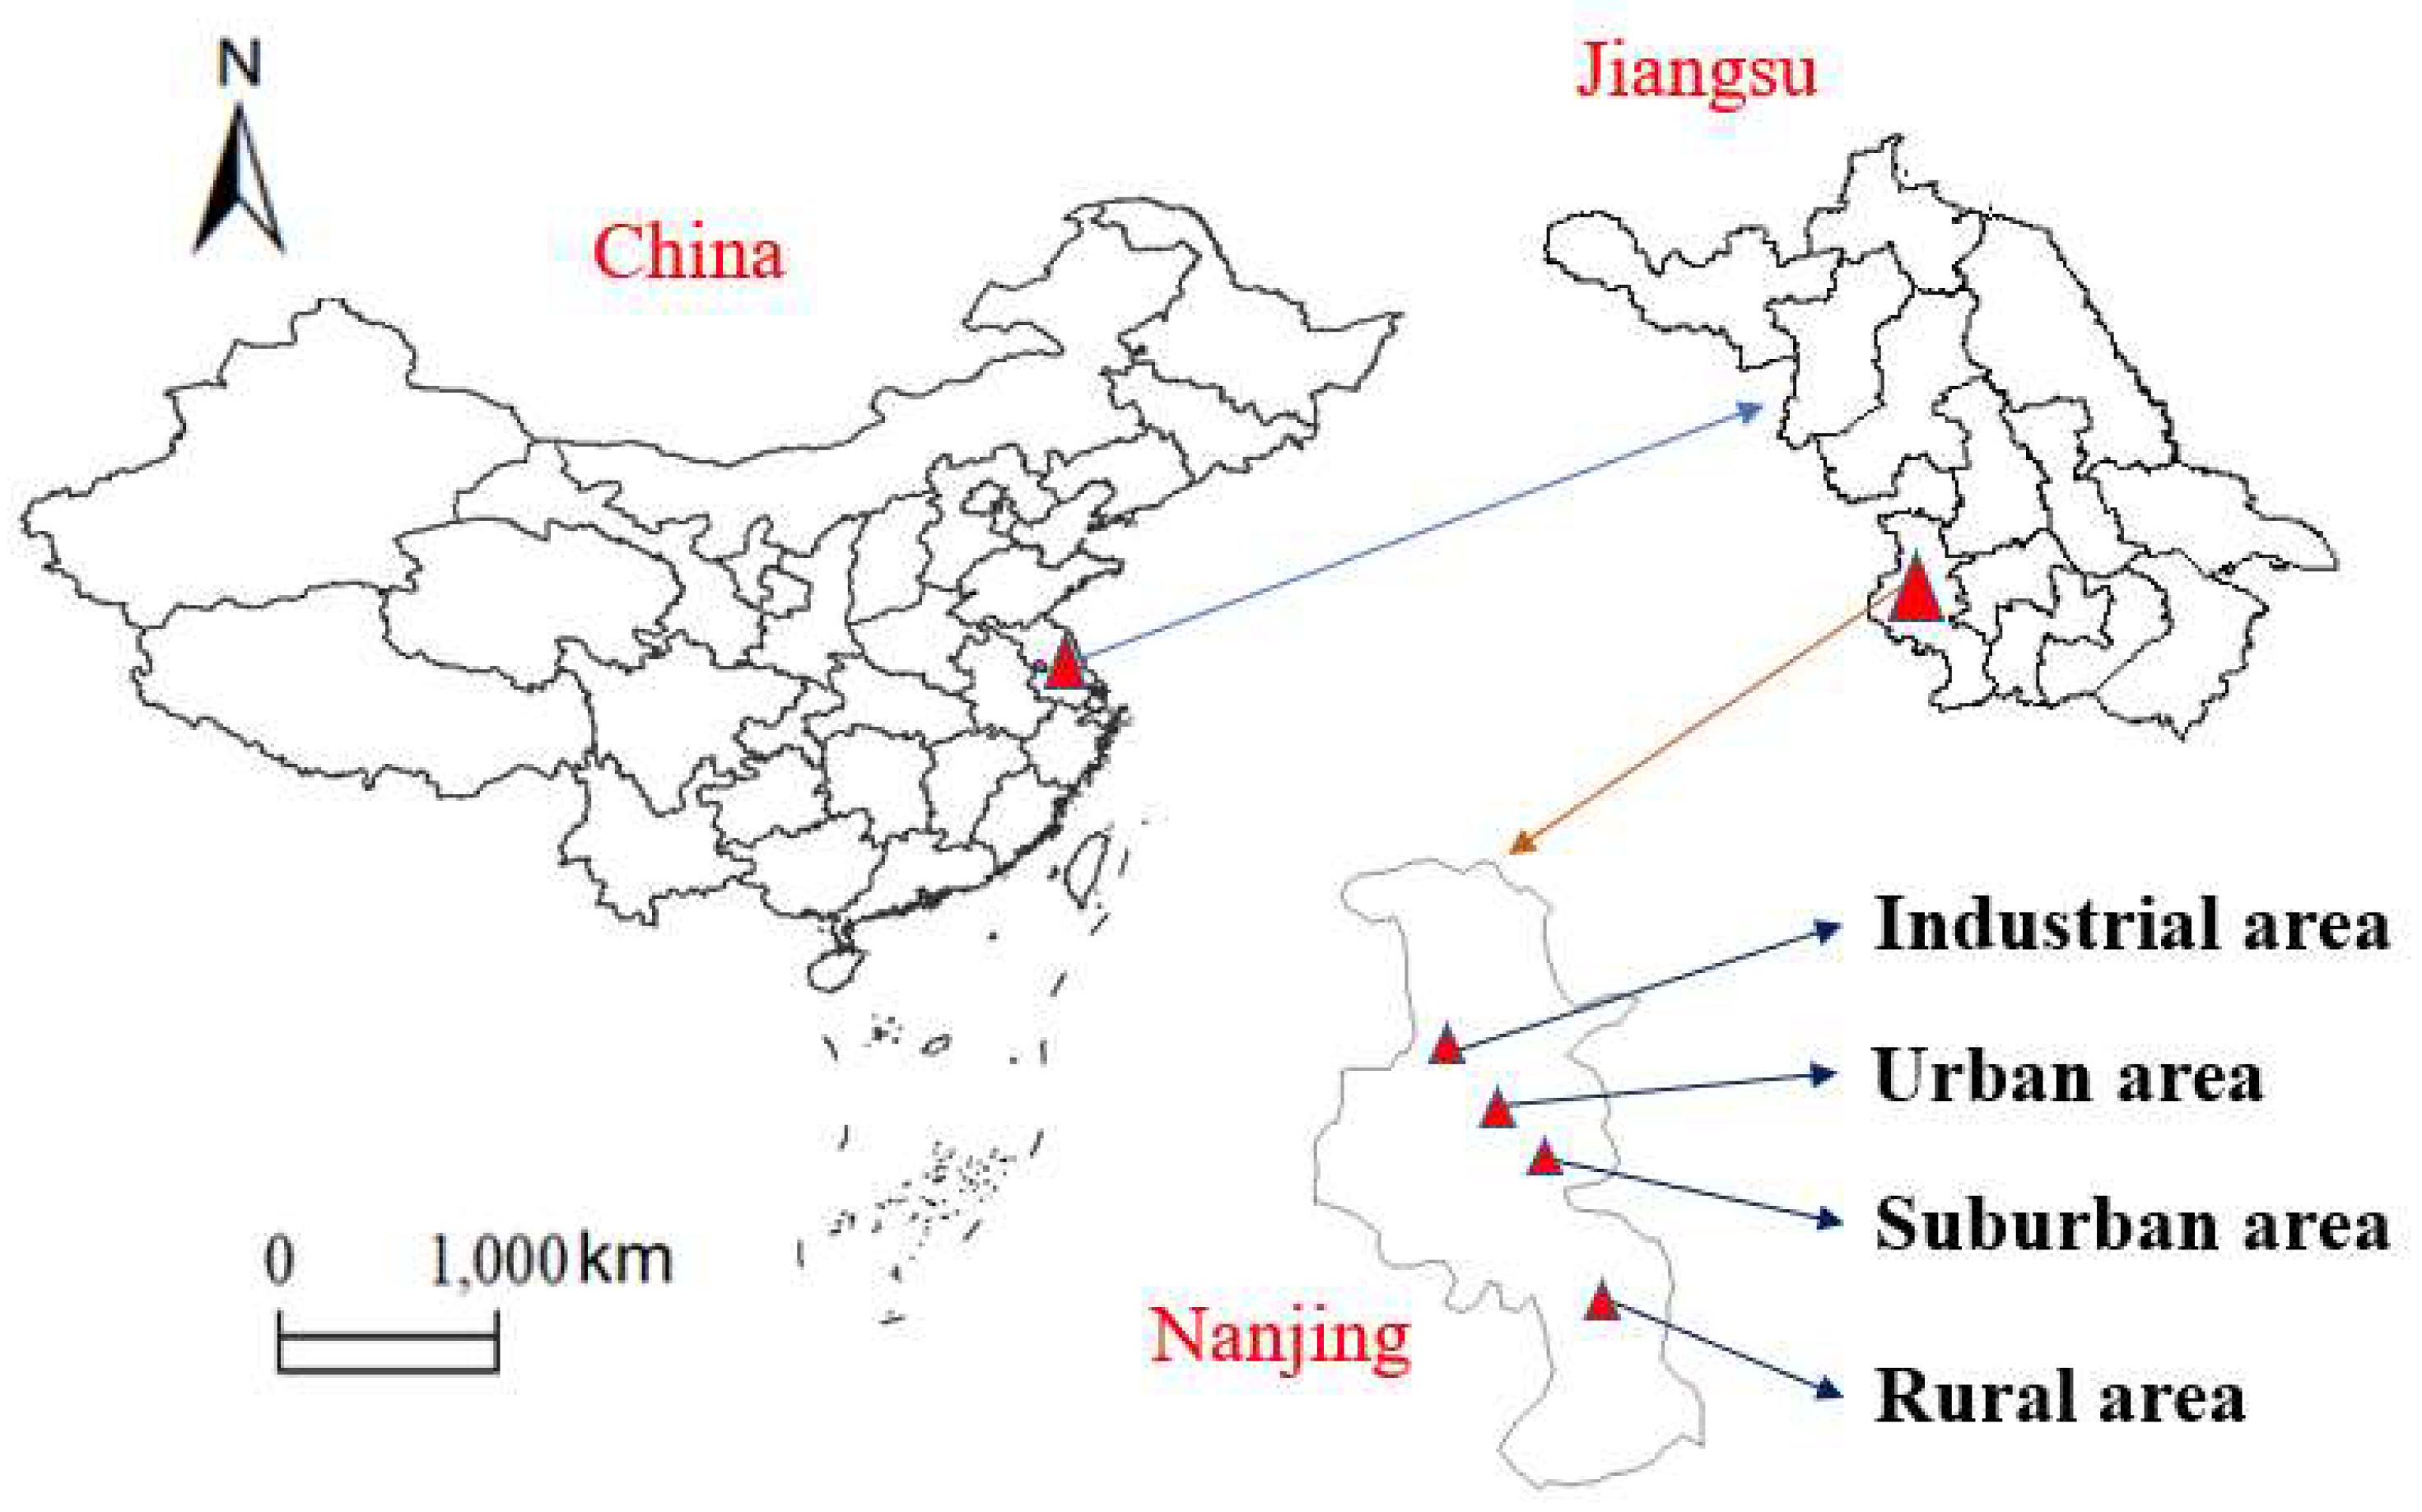
2.1. Study Area

Located in the southwest of Jiangsu Province in eastern China, Nanjing (118°22ʹ–119°14′ E, 31°14′–32°37′ N) is an important regional central city in the economic core of the Yangtze River Delta (YRD) region (Figure 1). Nanjing is a comprehensive transportation hub and industrial production base. The main sources of air pollution in Nanjing are motor vehicle exhaust, industrial emissions, coal combustion, construction dust, and mixed pollution caused by pollutant transport from other regions. The air sampling sites were located in four different functional areas in Nanjing [18]. Highways, light rail, and giant chemical and metallurgical industries are near the industrial site. For the downtown urban site, the nearby road network is complex, with heavy traffic and high building density. The suburban site is on a campus, and the rural site is located in a remote agricultural park.

2.2. PM2.5 Sampling

The daily 23 h PM2.5 samples were collected on quartz microfiber filters (QMA, 203 × 254 mm, Whatman, UK) by high-volume air samplers (1000 L/min) synchronously from the four sites each month. Filters were weighed before and after sampling, after equilibration in a constant temperature and humidity environment [19,20]. After sampling, the loaded filters were stored in a fridge before analysis. For this investigation conducted in 2016, 102 samples were obtained in both the industrial and urban areas from January to December, and 27 and 20 samples were collected in the suburban and remote rural areas from April to December, respectively.

2.3. Heavy Metal Analyses

Total concentrations of heavy metals accumulated in PM2.5 samples were analyzed using filter subsamples with known particle masses, which were digested by concentrated HNO3–HClO4–HF acids and determined by an inductively coupled plasma optical emission spectrometer (ICP-OES, Optima 8000, PerkinElmer, Waltham, Massachusetts, USA) for Cu, Pb, Sr, Mn, Ti , Sb, and Al and by an ICP mass spectrometer (ICP-MS, NexION300X, PerkinElmer, Waltham, Massachusetts, USA) for lower levels of Cd, Co, and V [21,22]. Procedural blanks, sample replicates, and standard reference materials (NIST SRM 1648a, urban PM, San Francisco, California, USA) were randomly inserted for quality control. Then, the airborne metal concentrations (ng/m3) were calculated based on the volume of sampled air.

2.4. Calculation of the Enrichment Factors (EFs) for Source Identification

EF is an analytical method for quantitatively evaluating the source of heavy metals in atmospheric particulates using the crust or soil as a reference medium calculated by the following equation [9]:
EF i = ( C i / C r ) P ( C i / C r ) S    
where Ci is the concentration of the measured heavy metal i in the particulates or soil (mg/kg), Cr is the concentration of the reference element (Al), and P and S represent PM2.5 and Jiangsu background soil, respectively [23,24]. There is no enrichment if the EF < 10 in PM2.5 and the main source may be natural, such as rock weathering or soil, but the primary source is anthropogenic when EF > 10 [25].

2.5. Principal Component Analysis (PCA)

The metal concentration data of atmospheric particulates were analyzed by PCA. According to the correlation between different components, the principal component factors were summarized from multiple variables, and the load of each factor was calculated. Each common factor represents a different source [26].

2.6. Human Health Risk Assessments (HHRAs)

HHRAs can evaluate the adverse health effects (carcinogenic and noncarcinogenic) of environmental pollutant exposure [27]. The model recommended by the US Environmental Protection Agency (EPA) was applied [28]. The hazard quotient (HQ) indicates the noncarcinogenic risk of a single heavy metal through the respiratory pathway, which is small or negligible if HQ < 1. Increased lifetime cancer risk (ILCR) indicates the probability of cancer, which does not pose a cancer risk if ILCR < 1 × 10⁻⁶. The current study focused on the risks of airborne metal inhalation calculated as follows:
HQ = ADD RfD
ILCR = LADD × SF
where ADD is the average daily dose of noncarcinogenic heavy metal (mg/kg/day); RfD is the reference dose, which means the maximum safe amount of heavy metal per unit body weight per day (mg/kg/day); LADD is the lifetime average daily dose (mg/kg/day) of carcinogenic heavy metal; and SF is the slope factor ((kg × day)/mg) (Table 1). The exposure was evaluated by the following equations [29,30,31]:
ADD = ( C × InhR × EF × ED ) / ( BW × AT )
LADD = C × EF AT ( InhR child × ED child BWchild + InhRadult × EDadult BWadult )
where C is the metal concentration (mg/m3), InhR is the inhalation rate (m3/day), EF is the exposure frequency (day/year), ED is the exposure period (year), BW is body weight (kg), and AT is average exposure time (day).

2.7. Statistics

The data were compiled using Microsoft Excel 2016 statistics (Microsoft: Redmond, Washington, USA) and plotted by Origin (2017), and the PCA was conducted by IBM SPSS statistics 24 (IBM: Armonk, NY, USA).

3. Results and Discussion

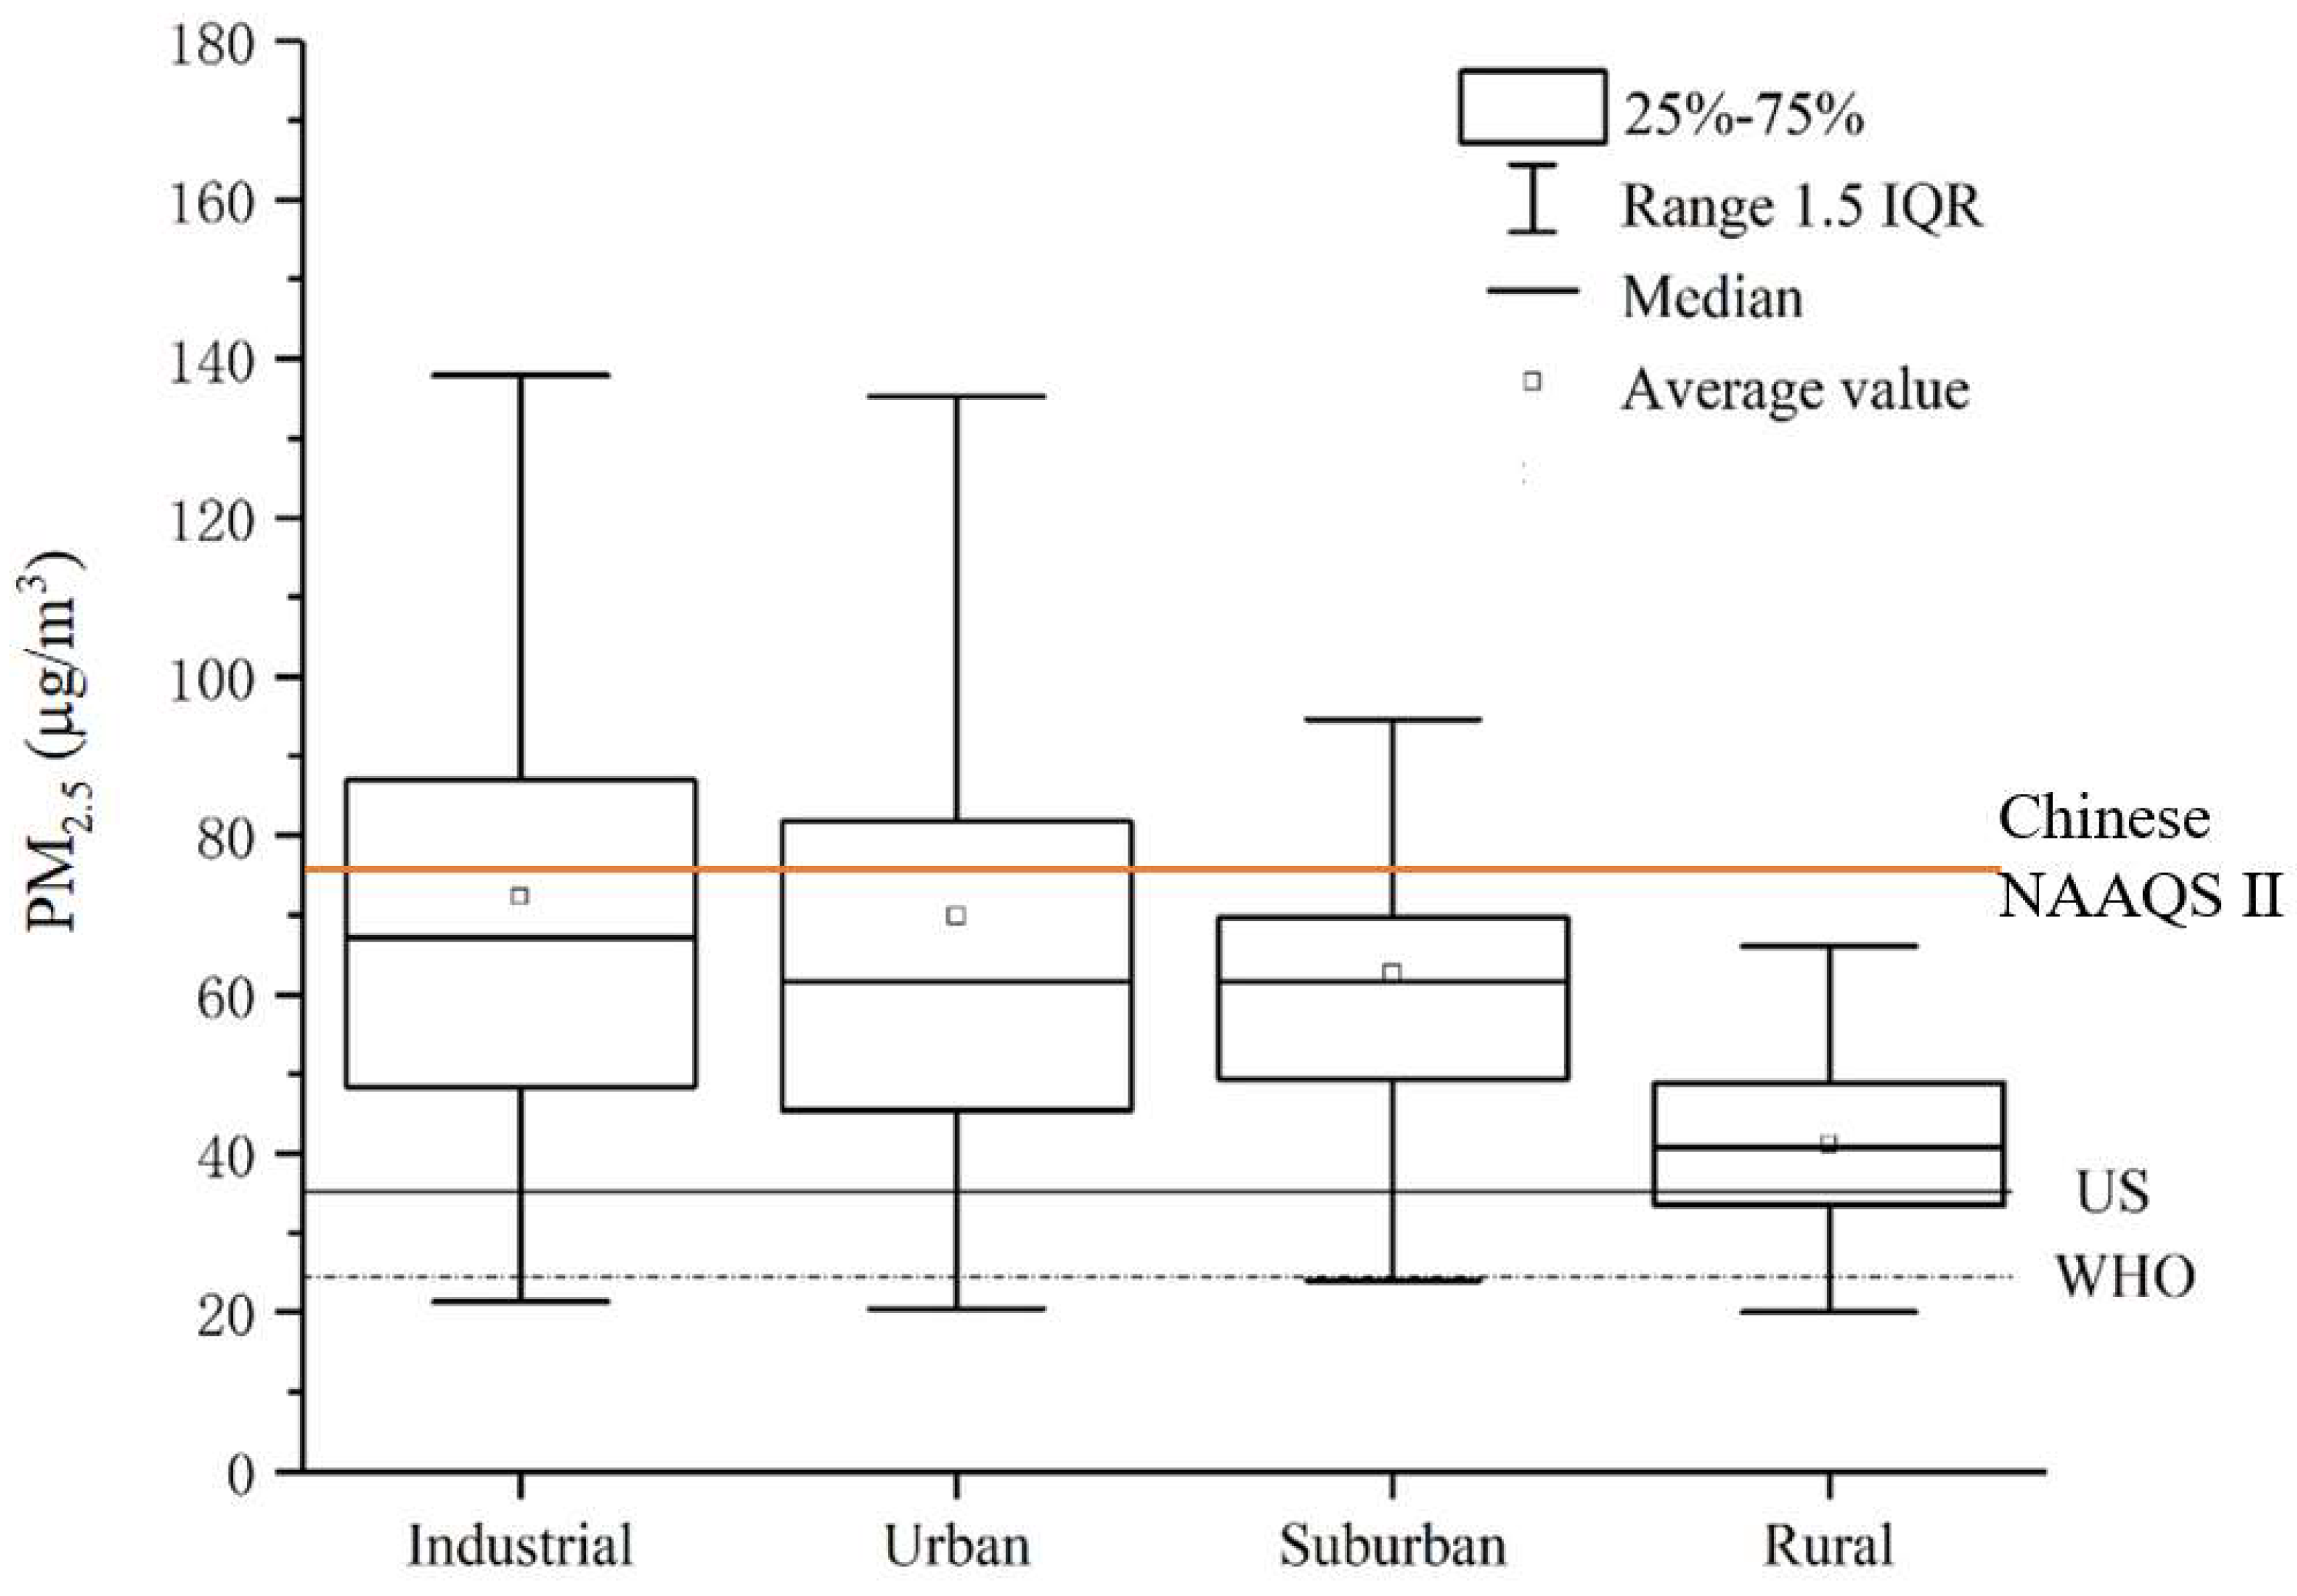
3.1. PM2.5 Concentration Levels in Different Urban Functional Areas

From the perspective of the air concentration levels of PM2.5 at four sampling sites in Nanjing during 2016, the annual average concentrations were 72.3 ± 32.7 μg/m3 (industrial area), 69.9 ± 34.2 μg/m3 (urban area), 62.8 ± 18.8 μg/m3 (suburban area), and 41.1 ± 11.8 μg/m3 (rural area) (Figure 2). China released an ambient air quality standard (Chinese NAAQS Ⅱ) of 75 μg/m3 PM2.5 for 24 h [32], which is lower than the previous threshold value but still much higher than the values of the WHO AQG (25 μg/m3) and US NAAQS-Primary (35 μg/m3). The concentration of PM2.5 in Nanjing was generally higher than the daily average concentration limit stipulated by the WHO and US air quality standards, indicating that the PM2.5 pollution in Nanjing was serious. The annual concentrations of PM2.5 in the YRD region were lower than those in northern China, such as Xingtai (109 μg/m3), but higher than the annual concentrations in the Pearl River Delta region, such as Zhuhai (33.8 μg/m3) and Shenzhen (32.0 μg/m3) [12].
Representatively, the seasonal distributions of PM2.5 were compared between the industrial and urban areas, considering their intensive human activities and dense populations [18]. The seasonal concentrations of PM2.5 in the two functional areas were winter > spring > autumn > summer, and in the industrial area, they were slightly higher than in the urban area (Figure 3). That may be due to the intensive pollutant sources from energy consumption. Also, the serious aerosol pollution in the cold season of Nanjing might be affected by meteorological conditions with less precipitation and lower atmospheric boundary layers [19].
The average concentrations of PM2.5 between the representative warm and cold seasons were compared among four different functional regions in Nanjing city during 2016 (Figure 4). The average concentrations of PM2.5 in the four functional areas were cold season > warm season. However, the average concentration of PM2.5 was highest in the suburban area in the warm season. That may be due to the fact that the impact of human activities is less than that of the other three areas.

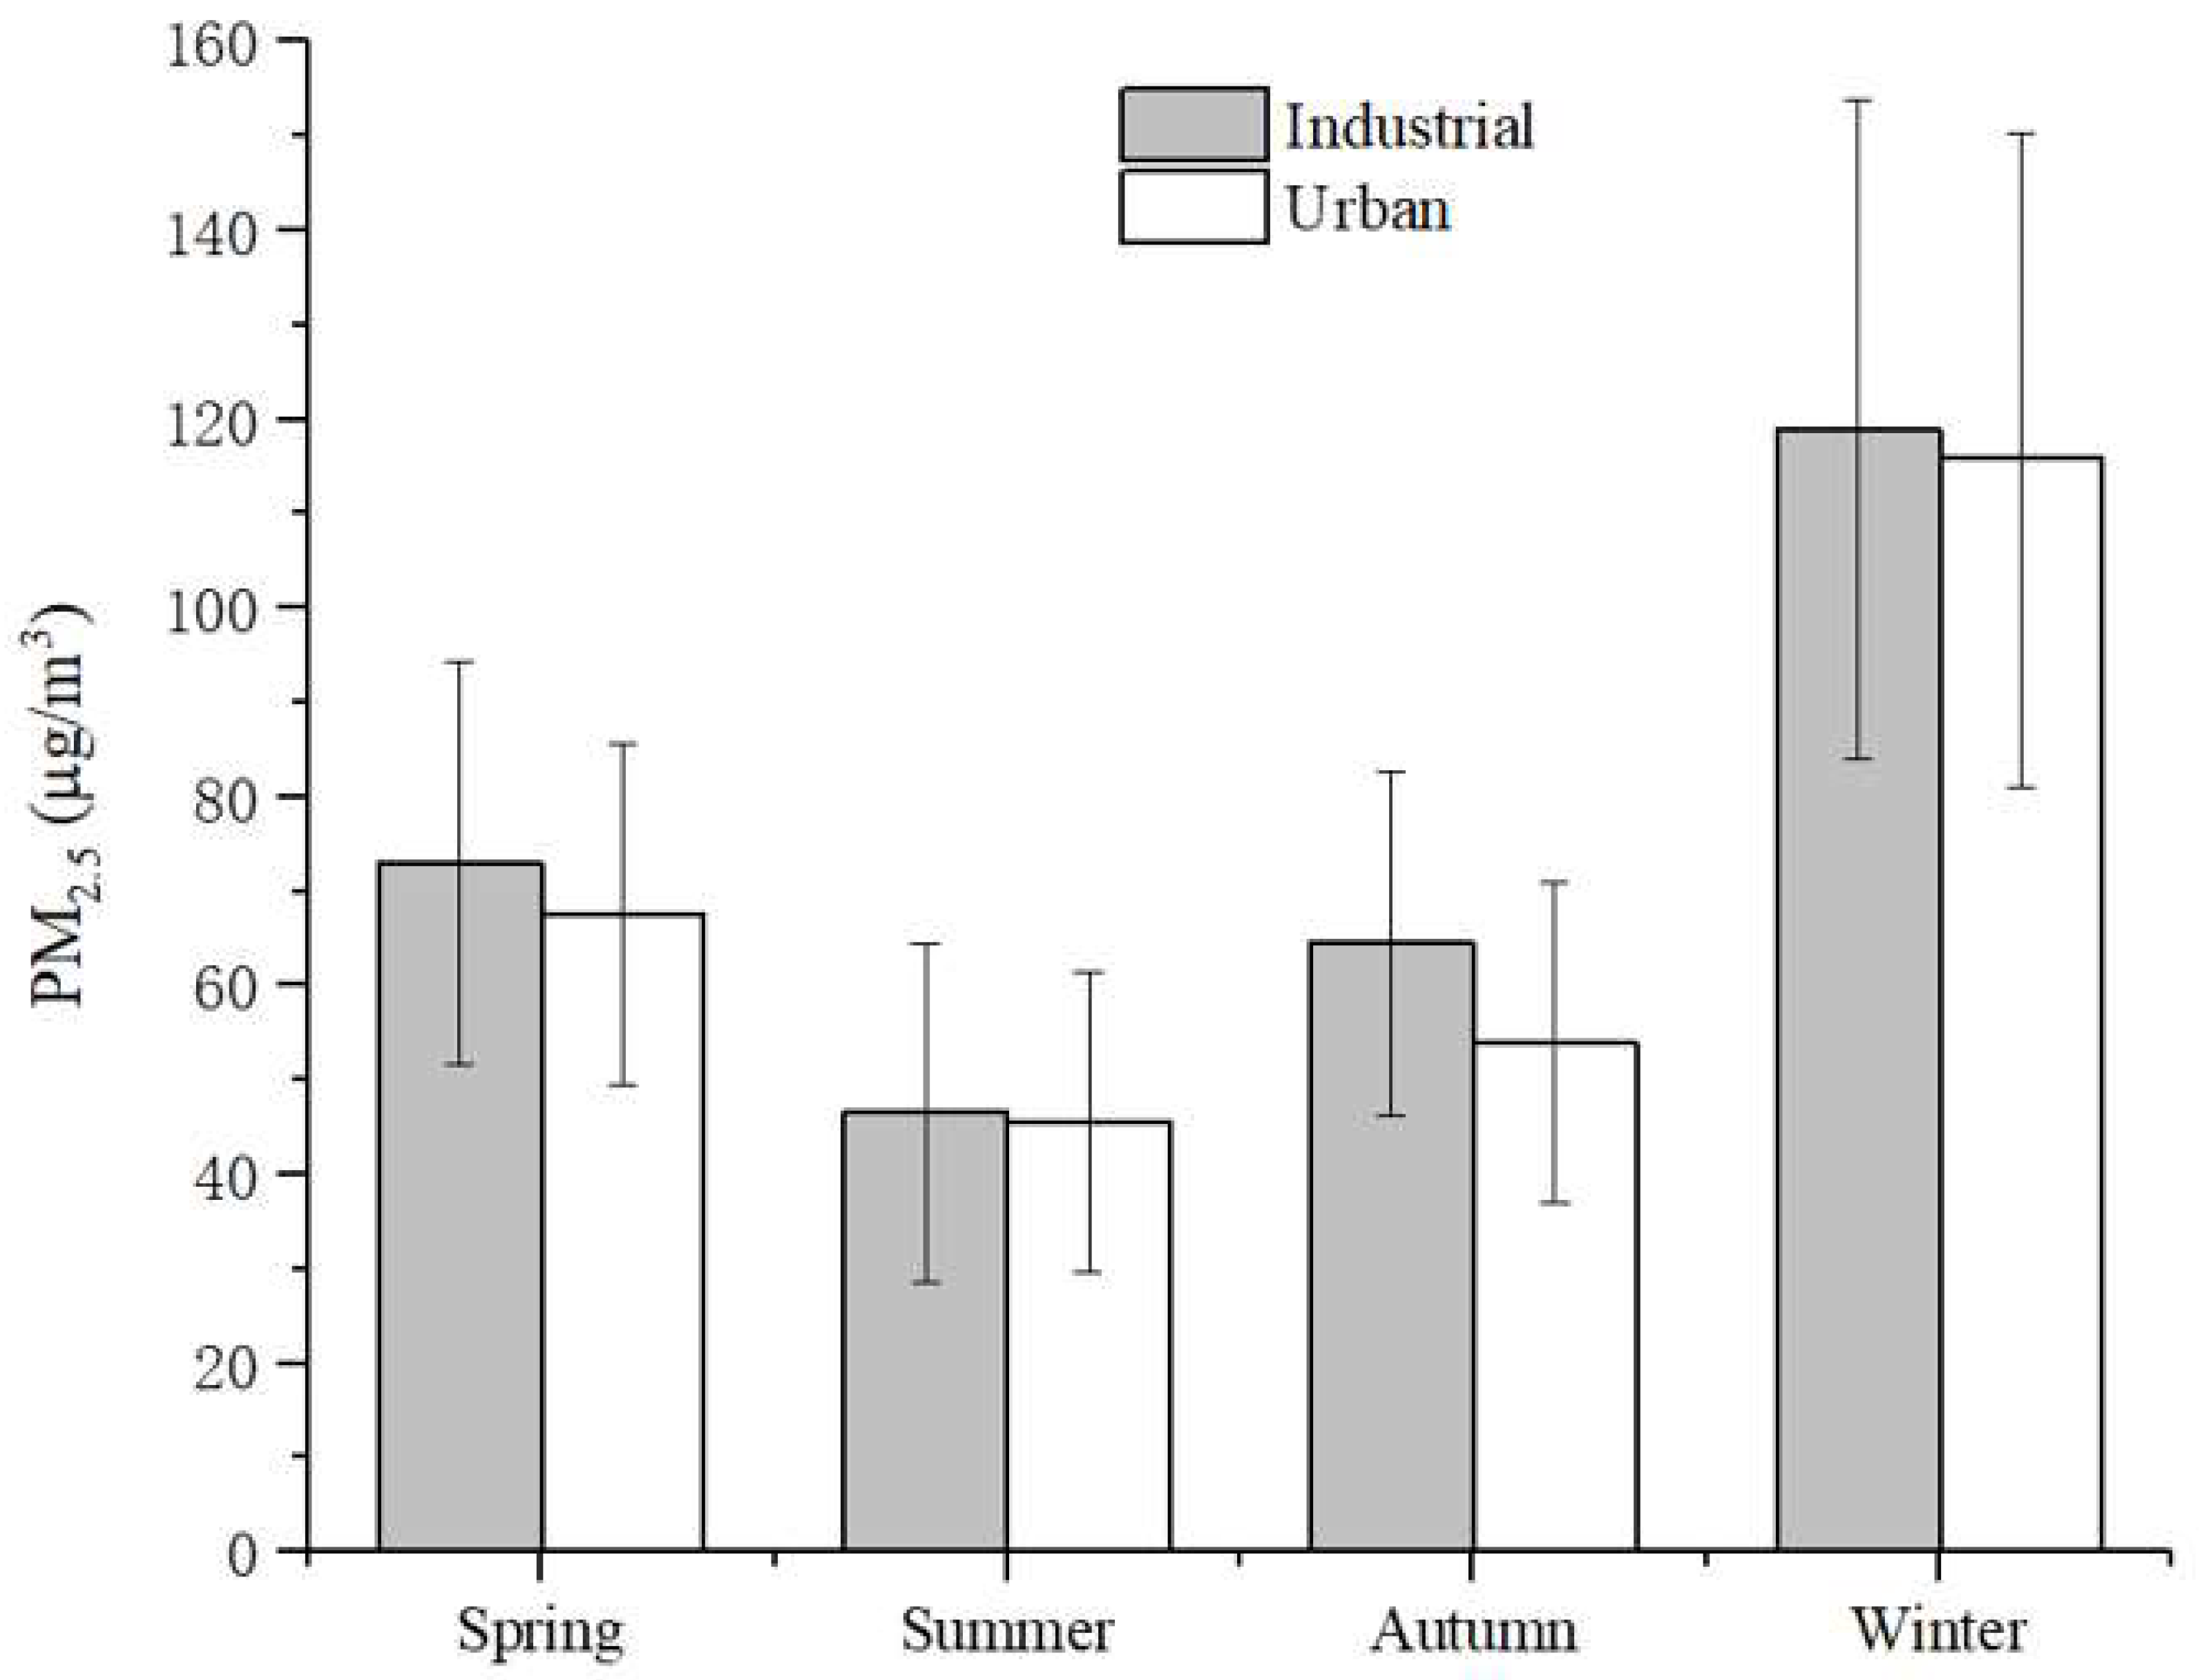
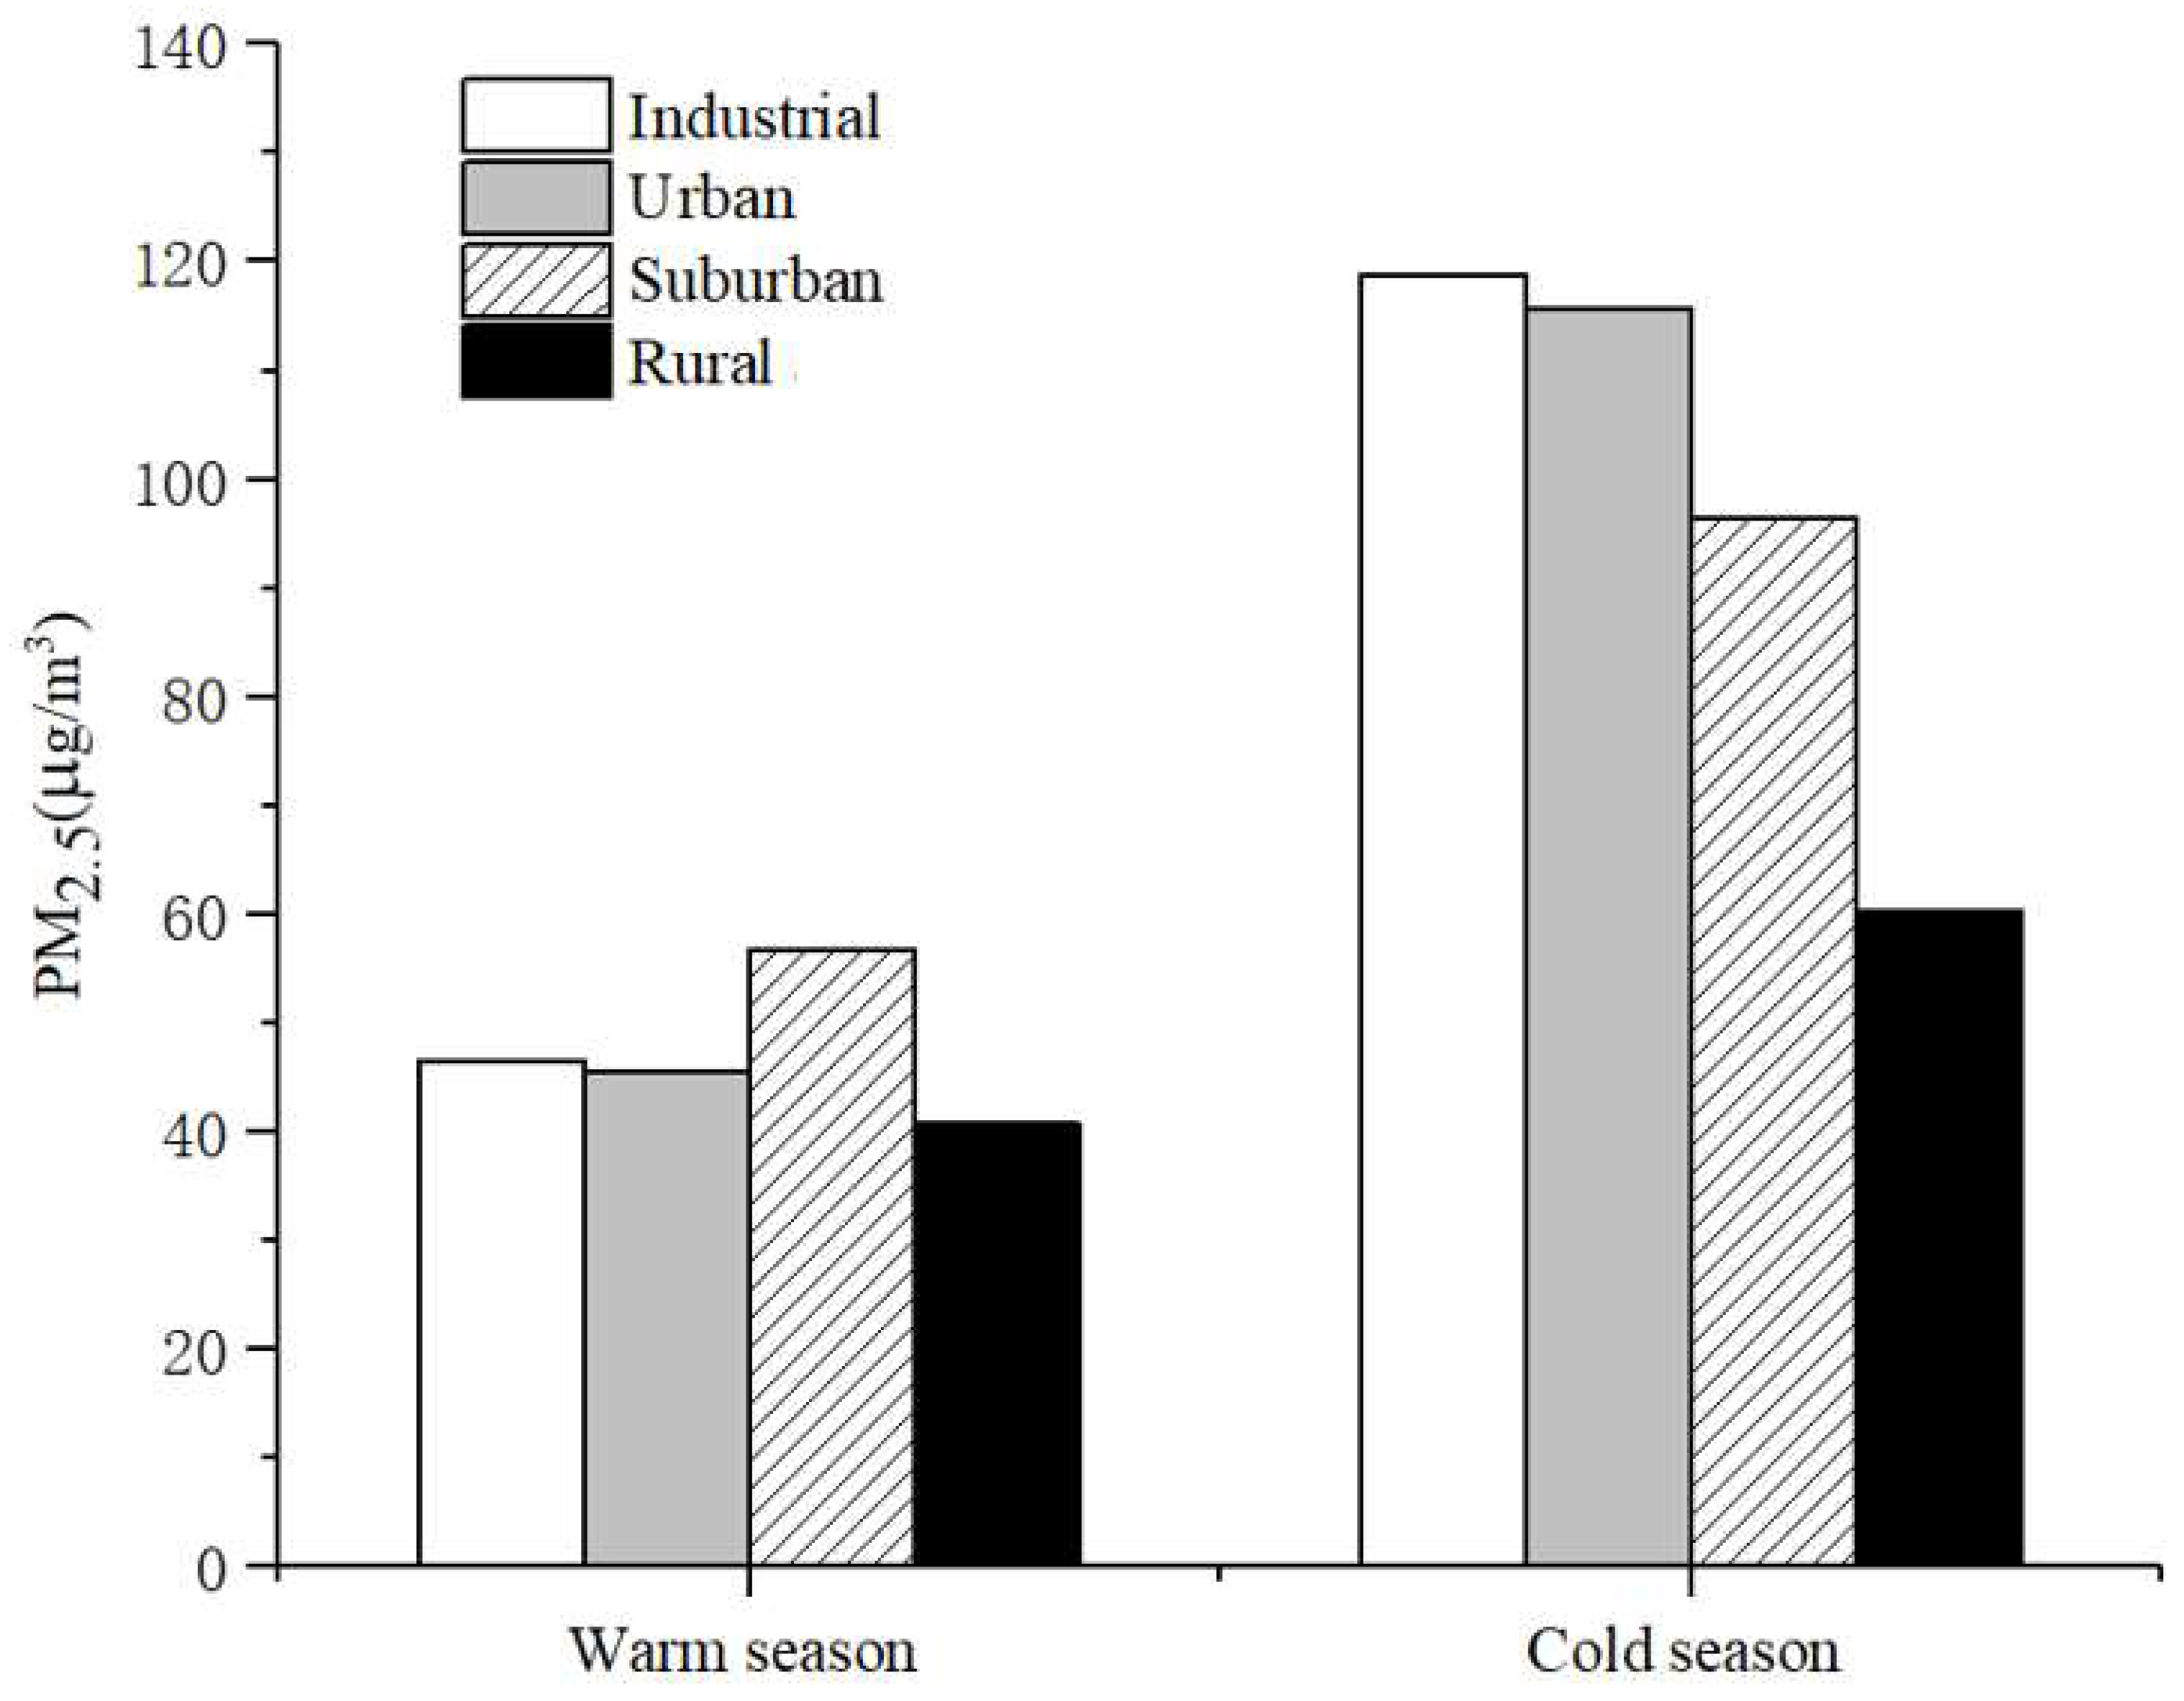
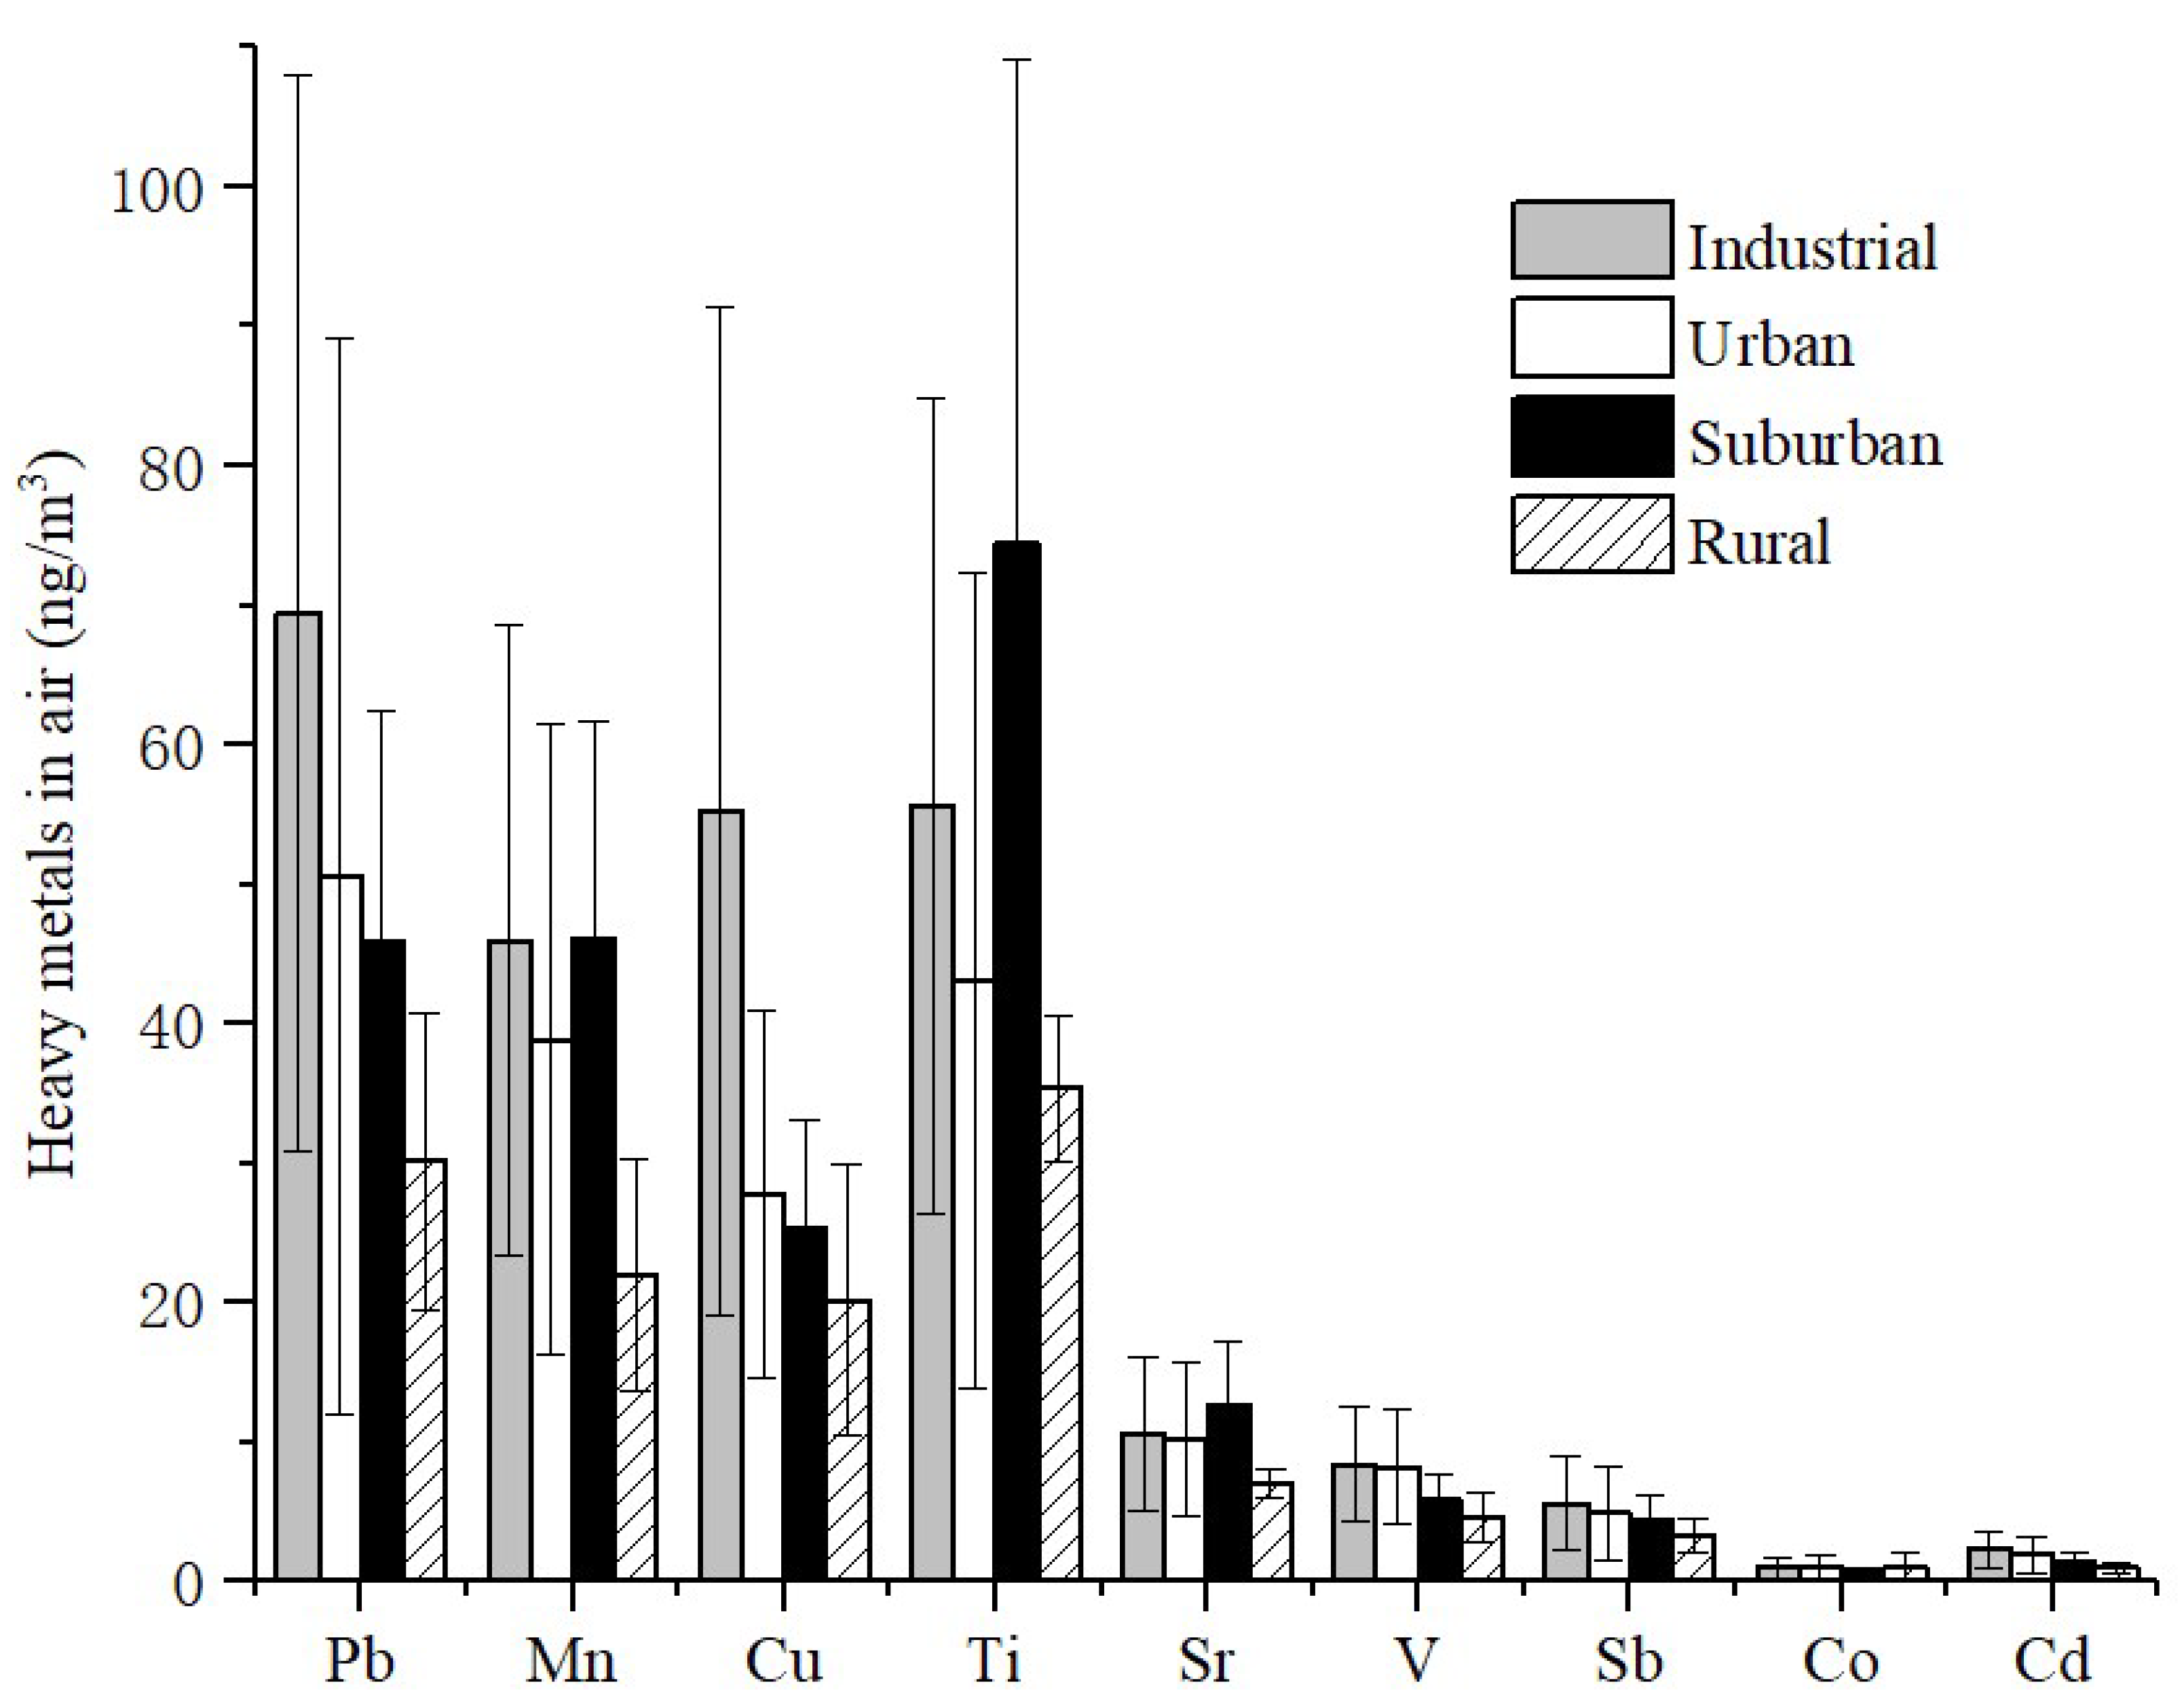
3.2. Seasonal Distribution of PM2.5-Bound Heavy Metal Concentrations in Different Urban Functional Areas

The annual average concentrations of heavy metals in PM2.5 in various areas of Nanjing are shown in Table 2 and Figure 5 and are compared with other domestic and international regions and international air quality guidelines [11,33,34]. The concentrations of atmospheric heavy metals in Nanjing were generally high, especially V and Ti.
Pb, Mn, Cu, and Ti are of higher concentrations compared with other heavy metals [26]. However, there was no clear unified spatial pattern in metal levels among the studied regions. The concentrations of six metals (Sb, Pb, Cd, V, Mn, and Cu) were highest in the industrial area, while Co was highest in the urban area. Although the remarkable role of PM2.5 concentrations in atmospheric metal levels was observed in most studies, there were still some deviations for metal patterns in different areas [20]. Heavy metal levels were higher in winter than in summer (Table 3), similar to other air pollutants in Nanjing [21]. However, some metals, such as Pb, Cu, V, Co, and Cd, were highest in spring in the industrial area.

3.3. Source Identification of Airborne Metals in Different Urban Functional Areas

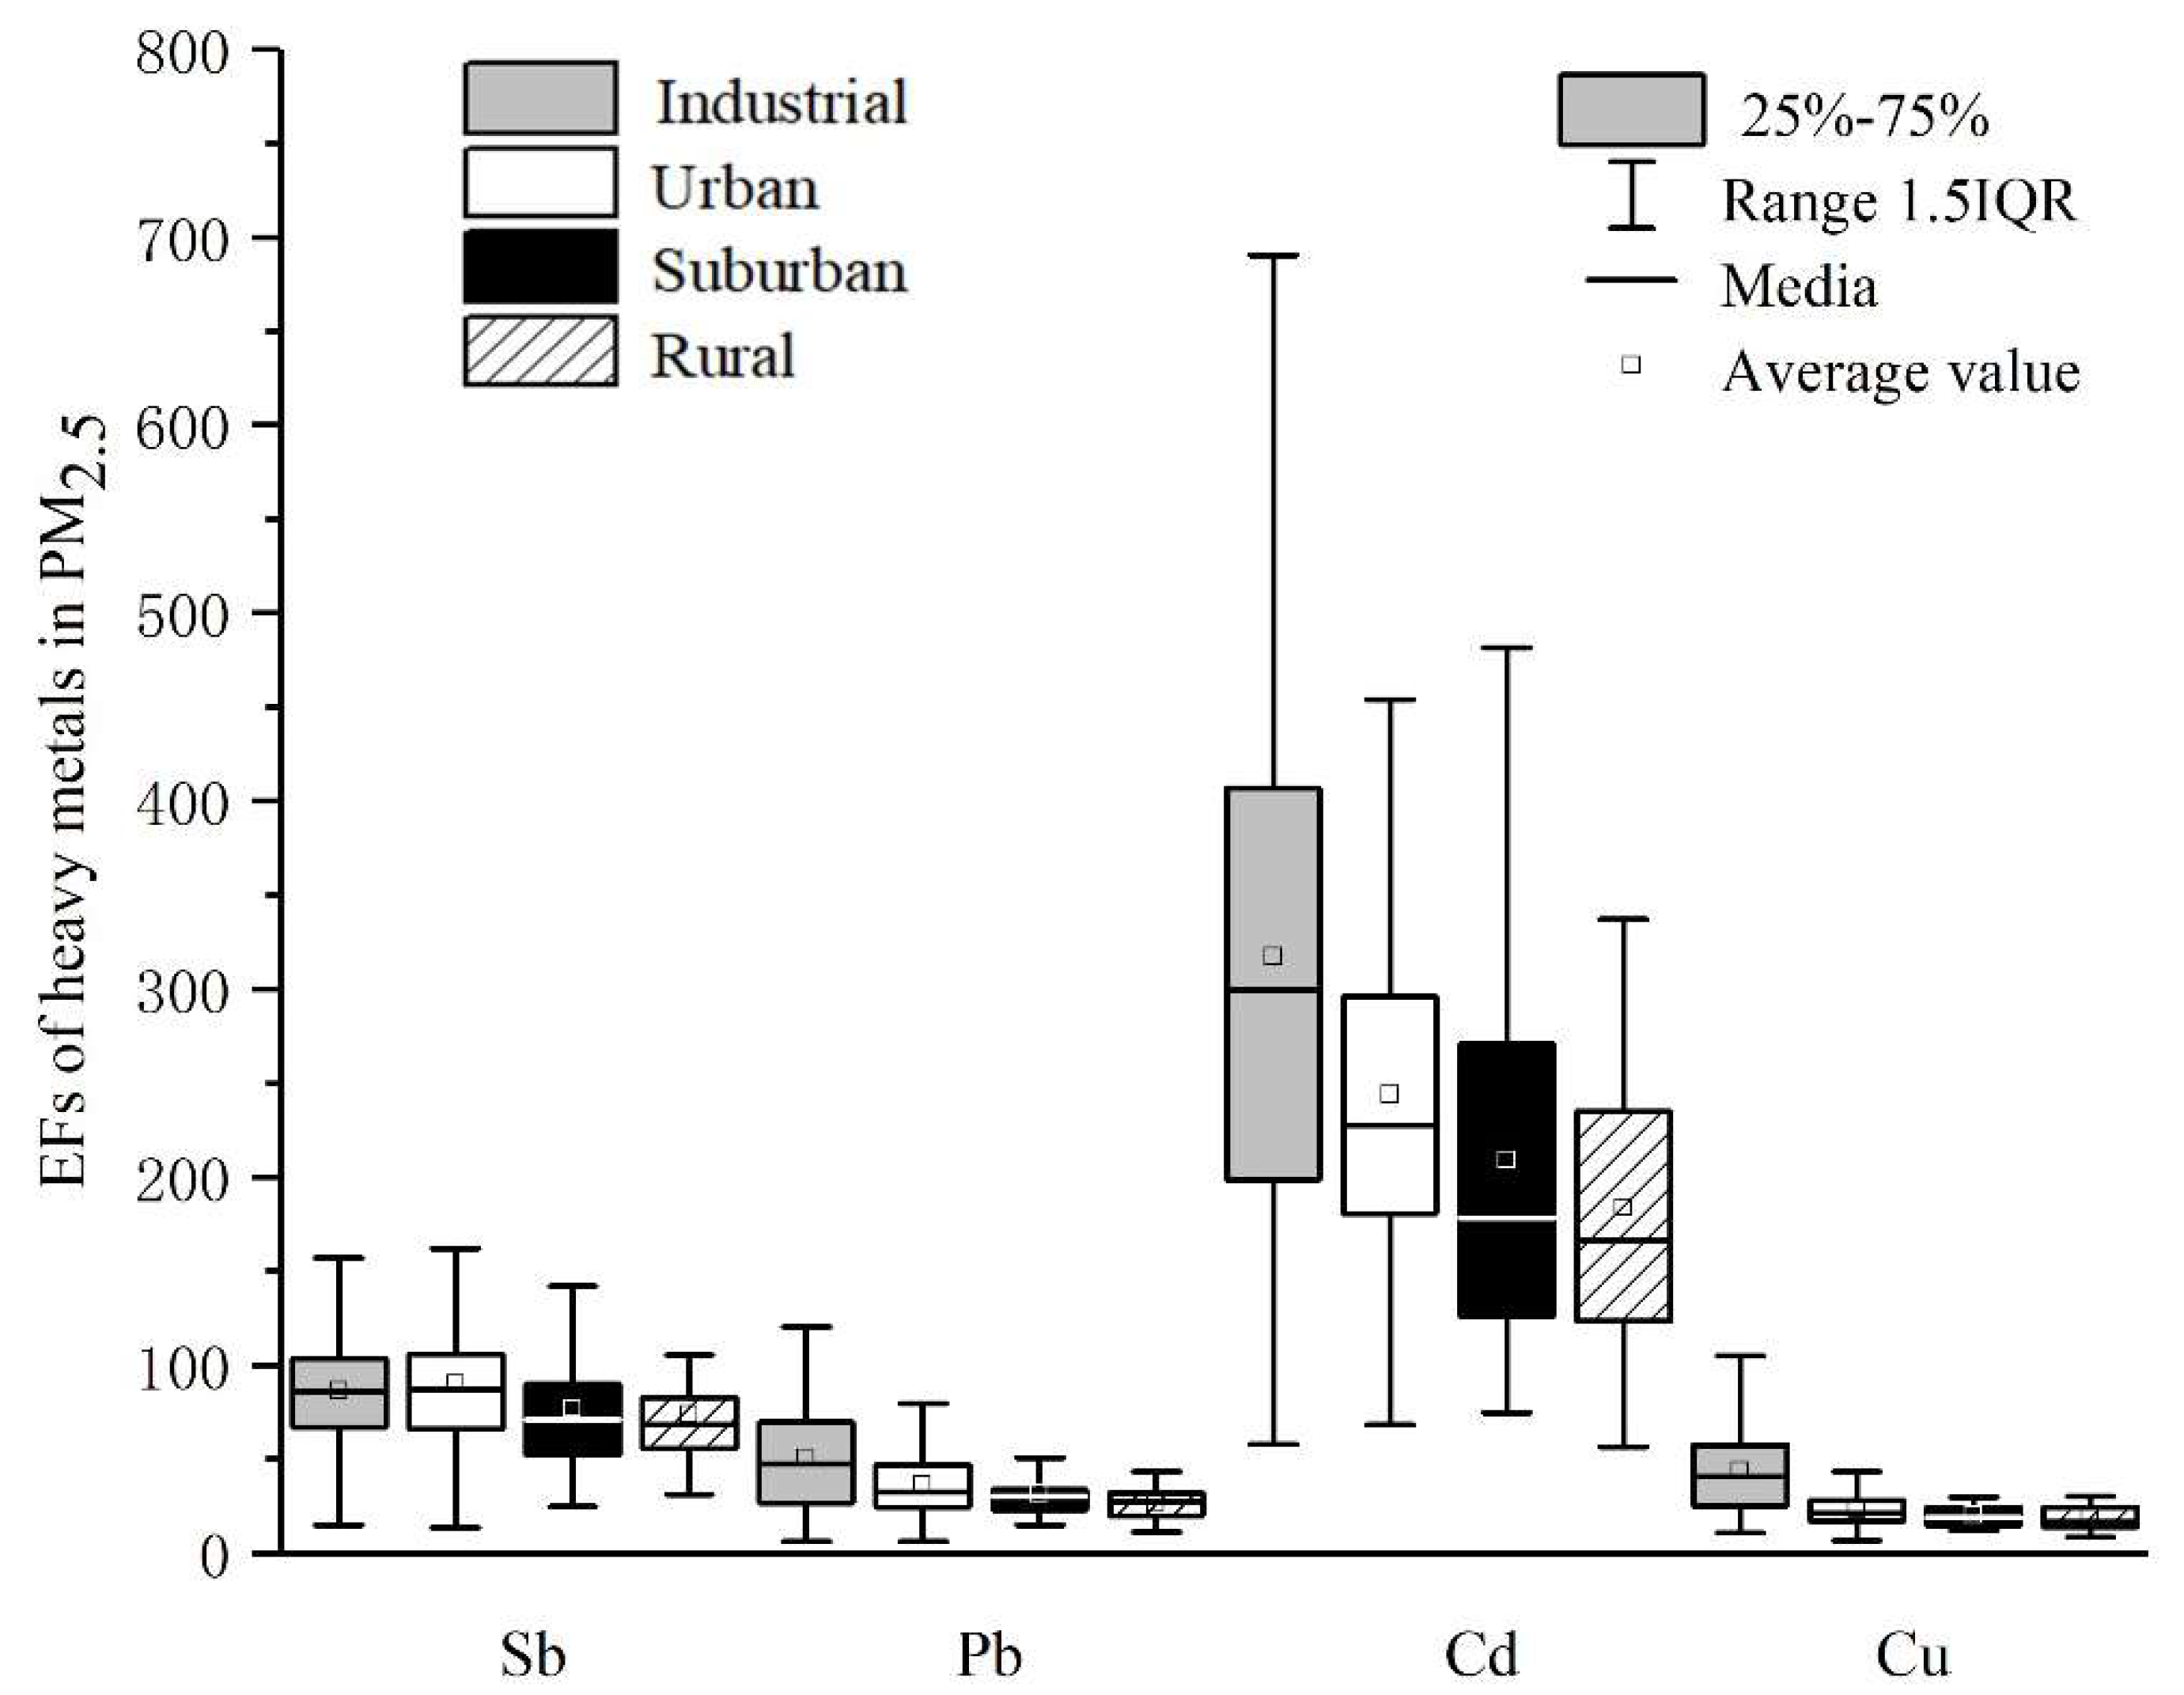
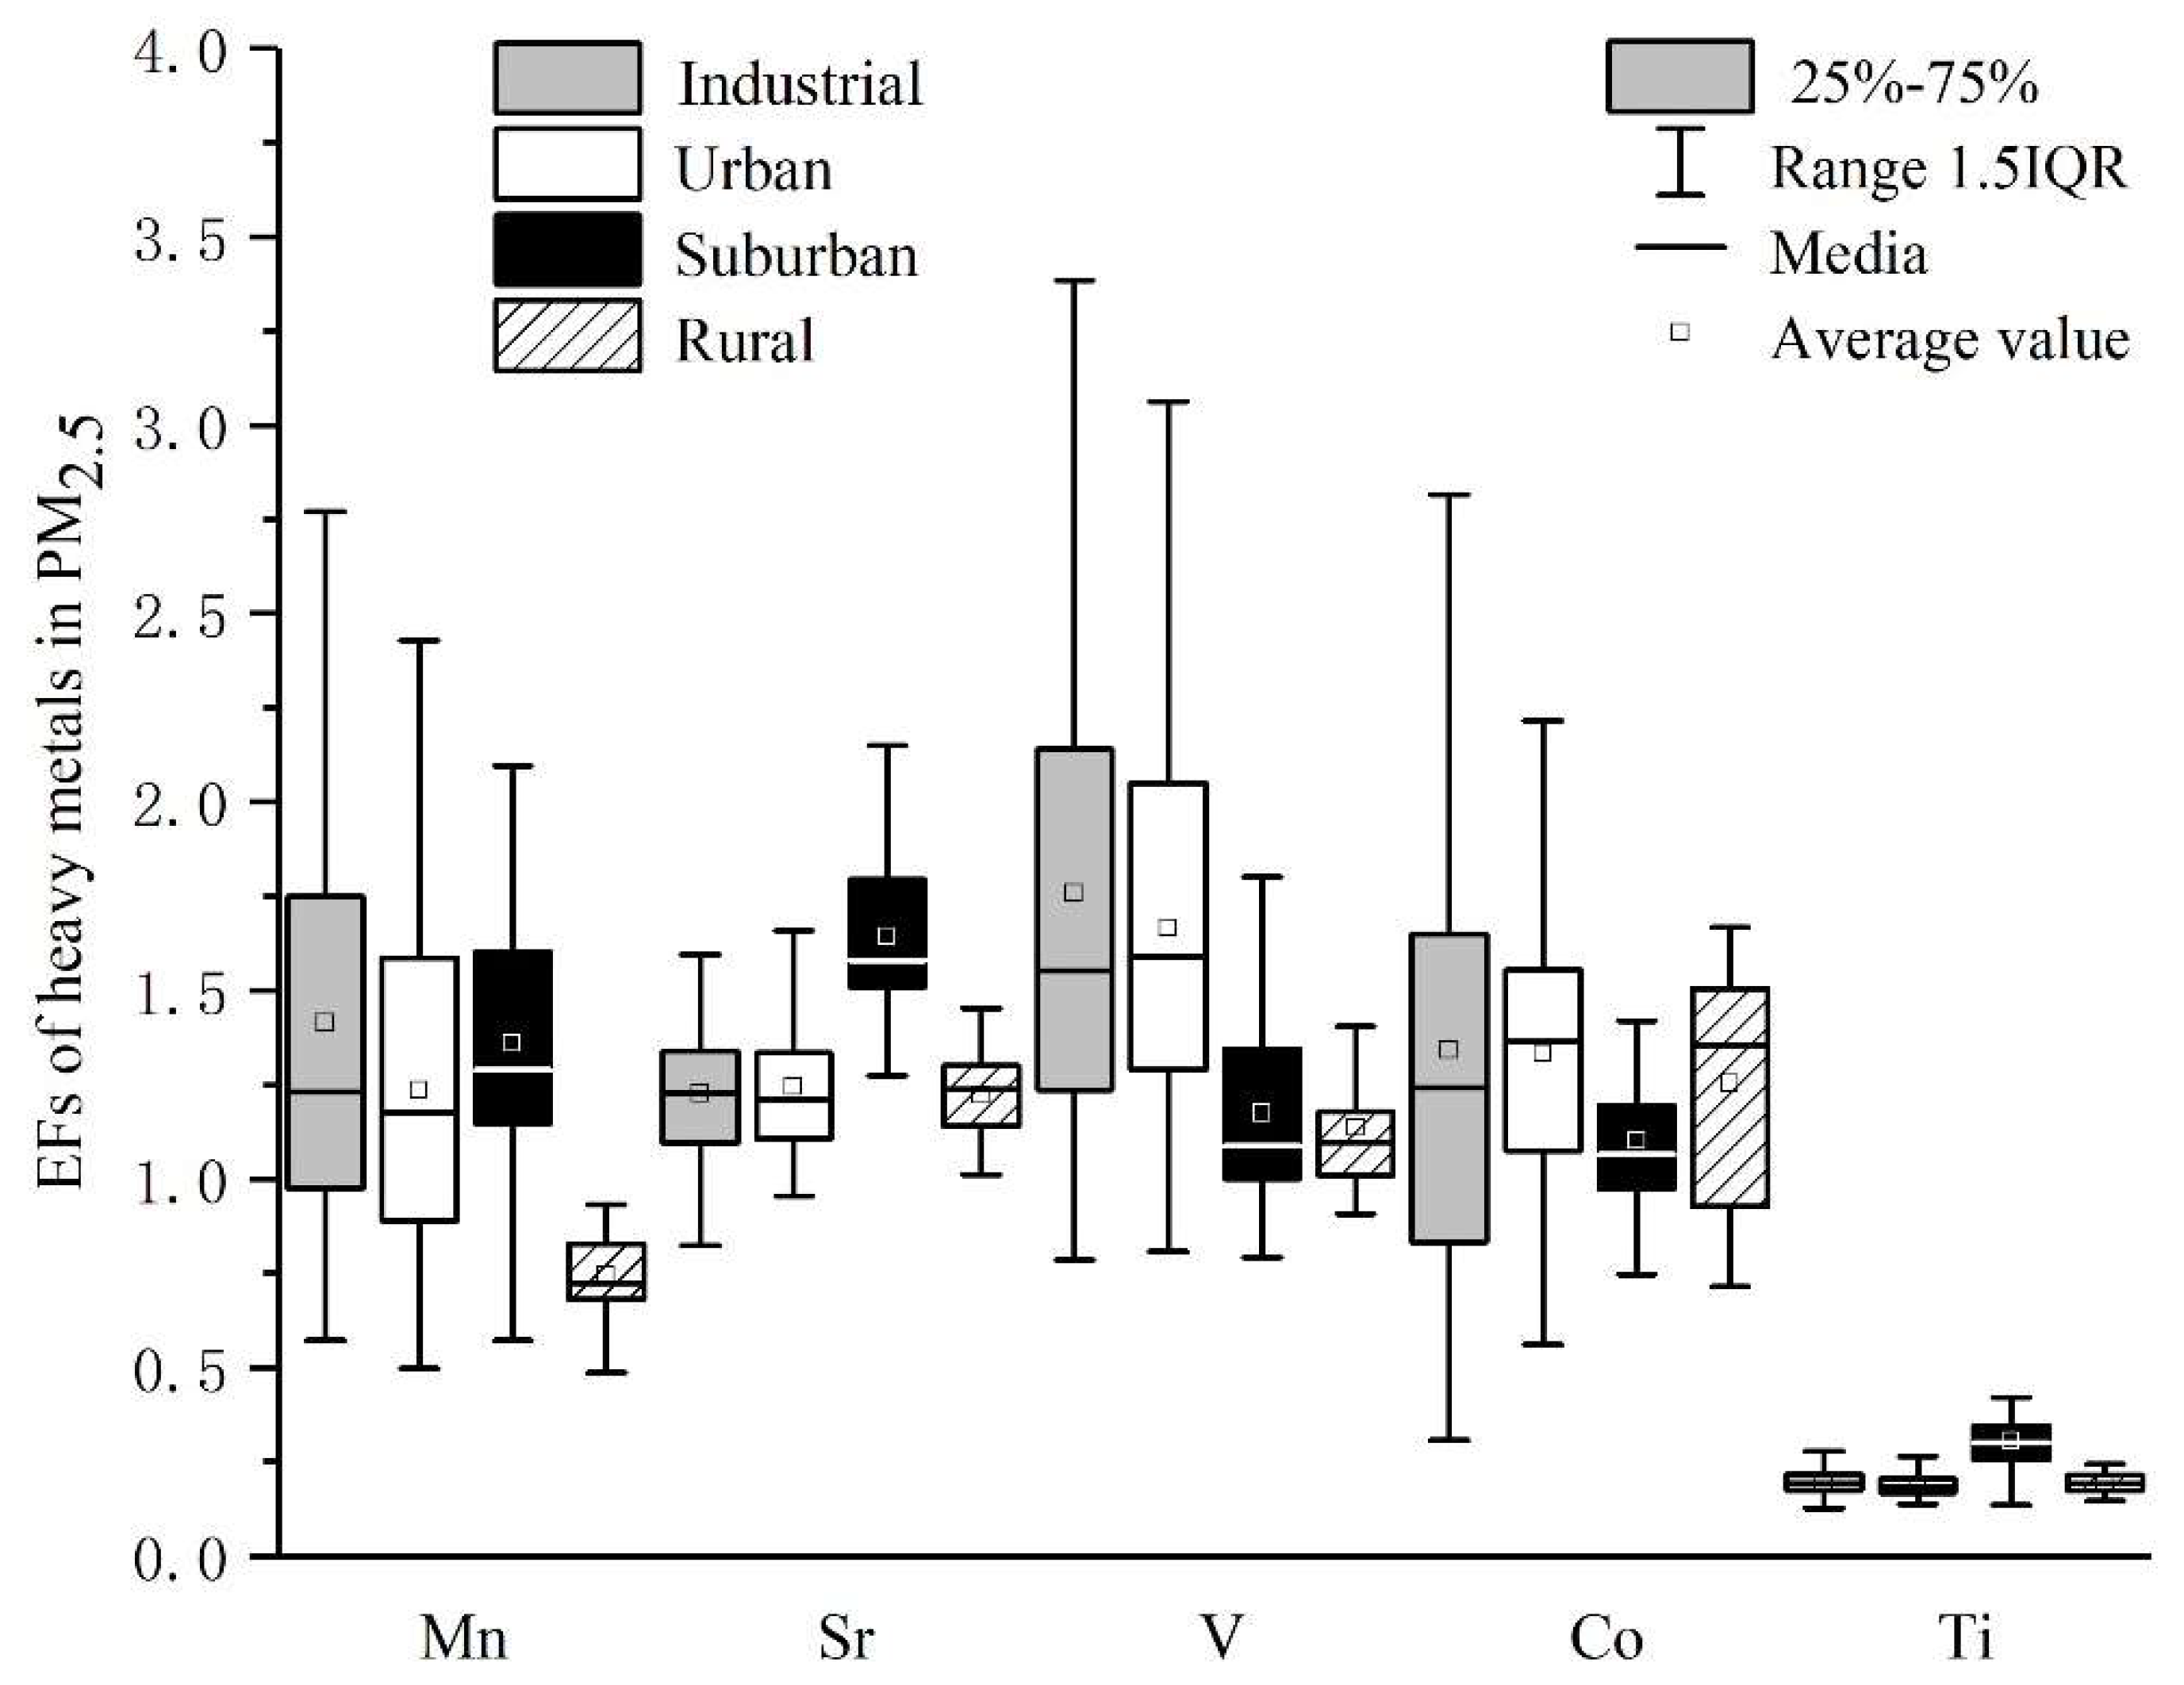
3.3.1. Sources Implied by EFs

The EFs of Cd, Sb, Pb, and Cu were greater than 10 for the whole year, indicating their anthropogenic enrichments, while the EFs of Mg, V, Sr, Mn, Co, and Ti were less than 10, suggesting they were less affected by human activity sources (Figure 6 and Figure 7).
The average EFs of PM2.5-bound heavy metals in industrial areas were Cd > Sb > Pb > Cu > 10 > V > Sr > Mn > Co > Ti, and the EF of Cd was quite high. However, the concentration of air Cd was not high compared with other heavy metals, indicating that it was heavily enriched from anthropogenic sources, such as coal-fired and metallurgical chemical industries. The Sb was the marking component of coal burning, and Pb was often used as a marker for vehicle exhaust and coal combustion sources. Therefore, the main sources of airborne heavy metals in industrial areas were coal combustion, metallurgical chemical industries, and motor vehicle exhaust. The EFs of Cd, Sb, Pb, and Cu were all >10 in the urban area, where traffic emissions greatly contributed to this [35]. No significant difference was found in EFs of any measured elements between the suburban and rural areas.

3.3.2. Sources Implied by PCA

In order to further clarify the sources of heavy metals in PM2.5, the PCA results are shown in Table 4. For the industrial area, all variables were divided into three factors by PCA, with a cumulative contribution of 74.6%. The PC1 was linked to Sr, Al, and Ti (Table 4). As indicated by the relatively low EF values of Sr and Ti, they were mainly from natural sources, such as soil and dust. PC2 was mainly related to Co, V, and Mn, which might have been mainly from petrochemicals. PC3 was mainly related to Sb, Pb, Cd, and Cu, which were contributed by metallurgical chemical dust and traffic [36].
All variables were divided into four factors in the urban area, with an additional source for Mn, which mainly came from natural sources. The results of sources implied by PCA indicated that the sources of heavy metals in the suburban area were natural and traffic sources. In addition, the heavy metals in the rural area mainly came from natural sources.

3.4. Spatial Characteristics of Human Health Risks of Airborne Metals

Heavy metals such as Cd are classified as class A carcinogenic, Pb as class 2A, Co as class 2B, and Mn and Cu are not carcinogenic. Although the noncarcinogenic hazards to adults were greater than those to children, that of PM2.5-bound heavy metals in Nanjing were below the threshold value 1 (Table 5), comparable to Jinan city [37] and Mexico [38]. Among the five metals, Mn had the highest HQ and should be monitored. The ILCR values of Cd were slightly higher than Co and both exceeded 1 × 10⁻⁶ in most areas; thus, their emissions should be strictly controlled. Compared with the risks found in other studies [39,40,41], the noncarcinogenic risk of airborne metals to adults and the cancer risks of Cd and Co in Nanjing are an environmental issue, especially in the industrial and urban areas.

4. Conclusions

The characteristics for concentrations and health risks of PM2.5 and associated heavy metals showed spatial and seasonal patterns in different urban functional areas owing to various sources and components. Although heavy metals are minor components accumulated in atmospheric PM, their distribution patterns are not always consistent with the overall PM. Therefore, both human health risk assessments and air quality guidelines for PM pollution control should consider and include these key pollutants. More detailed and accurate source investigations for ambient aerosols and associated heavy metals are needed in future research. Besides strengthening emission controls for clean air, we recommend reducing outdoor activities in industrial and traffic areas, especially in spring and winter.

Author Contributions

X.-S.L. designed the overall project; L.W. and Z.Z. conceived and carried out the experiments; L.W. and X.-S.L. led the writing of the manuscript; L.C., J.Y., M.T., and J.Y. performed the sampling; H.L. performed sample analysis.

Funding

This work was supported by the Natural Science Foundation of China (NSFC 41471418 and 91543205).

Conflicts of Interest

The authors declare no conflict of interest.

References

  1. Cao, J.J.; Shen, Z.X.; Chow, J.C.; Watson, J.G.; Han, Y.M. Winter and summer PM2.5 chemical compositions in fourteen Chinese cities. J. Air. Waste. Manage. 2012, 62, 1214–1226. [Google Scholar] [CrossRef]
  2. Lee, B.J.; Kim, B.; Lee, K. Air pollution exposure and cardiovascular disease. Toxicol. Res. 2014, 30, 71–75. [Google Scholar] [CrossRef] [PubMed]
  3. Chen, Y.; Luo, X.S.; Zhao, Z.; Chen, Q.; Wu, D.; Sun, X.; Wu, L.; Jin, L. Summer-winter differences of PM2.5 toxicity to human alveolar epithelial cells (A549) and the roles of transition metals. Ecotox. Environ. Saf. 2018, 165, 505–509. [Google Scholar] [CrossRef] [PubMed]
  4. Ye, W.F.; Ma, Z.Y.; Ha, X.Z. Spatial-temporal patterns of PM2.5 concentrations for 338 Chinese cities. Sci. Total Environ 2018, 631–632, 524–533. [Google Scholar] [CrossRef] [PubMed]
  5. Chen, T.; He, J.; Lu, X.; She, J.; Guan, Z. Spatial and Temporal Variations of PM2.5 and Its Relation to Meteorological Factors in the Urban Area of Nanjing, China. Int. J. Environ. Res. Public. Health. 2016, 13. [Google Scholar] [CrossRef] [PubMed]
  6. Luo, X.S.; Yu, S.; Li, X.D. Distribution, availability, and sources of trace metals in different particle size fractions of urban soils in Hong Kong: Implications for assessing the risk to human health. Environ. Pollut. 2011, 159, 1317–1326. [Google Scholar] [CrossRef]
  7. Liu, X.G.; Li, J.; Qu, Y.; Han, T.; Hou, L.; Gu, J.; Chen, C.; Yang, Y.; Liu, X.; Yang, T.; et al. Formation and evolution mechanism of regional haze: a case study in the megacity Beijing, china. Atmos. Chem. Phys. 2013, 13, 4501–4514. [Google Scholar] [CrossRef]
  8. Pey, J.; Querol, X.; Alastuey, A. Discriminating the regional and urban contributions in the North-Western Mediterranean: PM levels and composition. Atmos. Environ. 2010, 44, 1587–1596. [Google Scholar] [CrossRef]
  9. Almeida, T.S.; Ana, M.O.; Cruz, J.M.; Tormen, L.; Bascunan, V.L.A.; Azevedo, P.A.; Garcia, C.A.B.; Alves, J.; Araujo, R.G.O. Characterisation and source identification of the total airborne particulate matter collected in an urban area of Aracaju, Northeast, Brazil. Environ. Pollut. 2017, 226, 444–451. [Google Scholar] [CrossRef]
  10. Mohanraj, R.; Azeez, P.A.; Priscilla, T. Heavy metal in airborne particulate matter of urban Coimbatore. Arch. Environ. Contam. Toxicol. 2004, 47, 162–167. [Google Scholar] [CrossRef]
  11. Qian, Y.; Chen, C.; Zhang, Q.; Li, Y.; Chen, Z.; Li, M. Concentrations of cadmium, lead, mercury and arsenic in Chinese market milled rice and associated population health risk. Food Control 2010, 21, 1757–1763. [Google Scholar] [CrossRef]
  12. Yang, L.; Cheng, S.; Wang, X.; Nie, W.; Xu, P.; Gao, X.; Yuan, C.; Wang, W. Source identification and health impact of PM2.5 in a heavily polluted urban atmosphere in China. Atmos. Environ. 2013, 75, 265–269. [Google Scholar] [CrossRef]
  13. Chalvatzaki, E.; Chatoutsidou, S.; Lehtomäki, H.; Almeida, S.; Eleftheriadis, K.; Hänninen, O.; Lazaridis, M. Characterization of Human Health Risks from Particulate Air Pollution in Selected European Cities. Atmosphere 2019, 10. [Google Scholar] [CrossRef]
  14. Alimissis, A.; Philippopoulos, K.; Tzanis, C.G.; Deligiorgi, D. Spatial estimation of urban air pollution with the use of artificial neural network models. Atmos. Environ. 2018, 191, 205–213. [Google Scholar] [CrossRef]
  15. Catalano, M.; Galatioto, F.; Bell, M.; Namdeo, A.; Bergantino, A.S. Improving the prediction of air pollution peak episodes generated by urban transport networks. Environ. Sci. Policy. 2016, 60, 69–83. [Google Scholar] [CrossRef] [Green Version]
  16. Tzanis, C.G.; Alimissis, A.; Philippopoulos, K.; Deligiorgi, D. Applying linear and nonlinear models for the estimation of particulate matter variability. Environ. Pollut. 2019, 246, 89–98. [Google Scholar] [CrossRef]
  17. Bi, X.; Liu, J.; Han, Z.; Yang, W. Lead in Chinese villager house dust: Geographical variation and influencing factors. Environ. Pollut. 2015, 207, 183–189. [Google Scholar] [CrossRef]
  18. Chen, Q.; Luo, X.S.; Chen, Y.; Zhao, Z.; Hong, Y.; Pang, Y.; Huang, W.; Wang, Y.; Jin, L. Seasonally varied cytotoxicity of organic components in PM2.5 from urban and industrial areas of a Chinese megacity. Chemosphere 2019, 230, 424–431. [Google Scholar] [CrossRef]
  19. Luo, X.S.; Ip, C.C.M.; Li, W.; Tao, S.; Li, X.D. Spatial-temporal variations, sources, and transport of airborne inhalable metals (PM10) in urban and rural areas of northern china. Atmos. Chem. Phys. Discuss. 2014, 14, 13133–13165. [Google Scholar] [CrossRef]
  20. Luo, X.S.; Zhao, Z.; Xie, J.W.; Luo, J.; Chen, Y.B.; Li, H.; Jin, L. Pulmonary bioaccessibility of trace metals in PM2.5 from different megacities simulated by lung fluid extraction and DGT method. Chemosphere 2019, 218, 915–921. [Google Scholar] [CrossRef]
  21. Ming, L.; Jin, L.; Li, J.; Fu, P.; Yang, W.; Liu, D.; Zhang, G.; Wang, Z.; Li, X. PM2.5 in the Yangtze River Delta, China: Chemical compositions, seasonal variations, and regional pollution events. Environ. Pollut. 2017, 223, 200–212. [Google Scholar] [CrossRef]
  22. Birke, M.; Rauch, U.; Hofmann, F. Tree bark as a bioindicator of air pollution in the city of Stassfurt, Saxony-Anhalt, Germany. J. Geochem. Explor. 2018, 187, 97–117. [Google Scholar] [CrossRef]
  23. Lu, X.; Wang, L.; Li, L.Y.; Lei, K.; Huang, L.; Kang, D. Multivariate statistical analysis of heavy metals in street dust of Baoji, NW China. J. Hazard. Mater. 2010, 173, 744–749. [Google Scholar] [CrossRef]
  24. Doabi, S.A.; Afyuni, M.; Karami, M. Multivariate statistical analysis of heavy metals contamination in atmospheric dust of Kermanshah province, western Iran, during the spring and summer 2013. J. Geochem. Explor. 2017, 180, 61–70. [Google Scholar] [CrossRef]
  25. Feng, J.; Yu, H.; Su, X.; Liu, S.; Li, Y.; Pan, Y.; Sun, J.H. Chemical composition and source apportionment of PM2.5 during Chinese Spring Festival at Xinxiang, a heavily polluted city in North China: Fireworks and health risks. Atmos. Res. 2016, 182, 176–188. [Google Scholar] [CrossRef]
  26. Ghosh, S.; Rabha, R.; Chowdhury, M.; Padhy, P.K. Source and chemical species characterization of PM10 and human health risk assessment of semi-urban, urban and industrial areas of West Bengal, India. Chemosphere 2018, 207, 626–636. [Google Scholar] [CrossRef]
  27. Betha, R.; Behera, S.N.; Balasubramanian, R. 2013 Southeast Asian smoke haze: fractionation of particulate-bound elements and associated health risk. Environ. Sci. Technol. 2014, 48, 4327–4335. [Google Scholar] [CrossRef]
  28. Ding, X.; Jiang, M.; Jing, H.; Sheng, W.; Wang, X.; Han, J.; Wang, L. Analysis of serum levels of 15 trace elements in breast cancer patients in Shandong, China. Environ. Sci. Pollut. Res. Int. 2015, 22, 7930–7935. [Google Scholar] [CrossRef]
  29. US EPA. Risk Assessment Guidance for Superfund, Volume I. In Human Health Evaluation Manual (Part A); EPA/540/1-89/002; US Environmental Protection Agency, Office of Emergency and Remedial Response: Washington, DC, USA, 1989. [Google Scholar]
  30. US EPA. Exposure Factors Handbook 2011 Edition; EPA/600/R-09/052F; US Environmental Protection Agency, Office of Emergency and Remedial Response: Washington, DC, USA, 2011.
  31. US EPA. Risk Assessment Guidance for Superfund Volume I. In Human Health Evaluation Manual (Part F, Supplemental Guidance for Inhalation Risk Assessment); EPA/540/R/070/002; US Environmental Protection Agency, Office of Emergency and Remedial Response: Washington, DC, USA, 2009. [Google Scholar]
  32. CMEP. Ambient Air Quality Standards (In Chinese); GB 3095–2012; Chinese Ministry of Environmental Protection (CMEP), China Environmental Science Press: Beijing, China, 2012. [Google Scholar]
  33. Yang, Y.; Liu, L.; Xu, C.; Li, N.; Liu, Z.; Wang, Q.; Xu, D. Source Apportionment and Influencing Factor Analysis of Residential Indoor PM2.5 in Beijing. Int. J. Environ. Res. Public. Health. 2018, 15. [Google Scholar] [CrossRef]
  34. Goudarzi, G.; Shirmardi, M.; Naimabadi, A.; Ghadiri, A.; Sajedifar, J. Chemical and organic characteristics of PM2.5 particles and their in-vitro cytotoxic effects on lung cells: The Middle East dust storms in Ahvaz, Iran. Sci. Total Environ. 2019, 655, 434–445. [Google Scholar] [CrossRef]
  35. Othman, M.; Latif, M.T.; Mohamed, A.F. The PM10 compositions, sources and health risks assessment in mechanically ventilated office buildings in an urban environment. Air Qual. Atmos. Health 2015, 9, 597–612. [Google Scholar] [CrossRef]
  36. Zhang, G.L.; Yang, F.G.; Zhao, W.J.; Zhao, Y.G.; Yang, J.L.; Gong, Z.T. Historical change of soil Pb content and Pb isotope signatures of the cultural layers in urban Nanjing. Catena 2007, 69, 51–56. [Google Scholar] [CrossRef]
  37. Zhang, J.; Chen, J.; Yang, L.; Sui, X.; Yao, L.; Zheng, L.; Wen, L.; Xu, C.; Wang, W. Indoor PM2.5 and its chemical composition during a heavy haze–fog episode at Jinan, China. Atmos. Environ. 2014, 99, 641–649. [Google Scholar] [CrossRef]
  38. Díaz, R.V.; Dominguez, E.R. Health risk by inhalation of PM2.5 in the metropolitan zone of the City of Mexico. Ecotoxicol. Environ. Saf. 2009, 72, 866–871. [Google Scholar] [CrossRef]
  39. Fang, W.; Yang, Y.; Xu, Z. PM10 and PM2.5 and Health Risk Assessment for Heavy Metals in a Typical Factory for Cathode Ray Tube Television Recycling. Environ. Sci. Technol. 2013, 47, 12469–12476. [Google Scholar] [CrossRef]
  40. Niu, L.; Ye, H.; Xu, C.; Yao, Y.; Liu, W. Highly time- and size-resolved fingerprint analysis and risk assessment of airborne elements in a megacity in the Yangtze River Delta, china. Chemosphere 2015, 119, 112–121. [Google Scholar] [CrossRef]
  41. Satsangi, P.G.; Yadav, S.; Pipal, A.S.; Kumbhar, N. Characteristics of trace metals in fine (PM2.5) and inhalable (PM10) particles and its health risk assessment along with in-silico approach in indoor environment of India. Atmos. Environ. 2014, 92, 384–393. [Google Scholar] [CrossRef]
Figure 1. Locations of the four representative air sampling sites in Nanjing city, eastern China.
Atmosphere 10 00419 g001
Figure 2. The concentrations of atmospheric particles with an aerodynamic diameter less than or equal to 2.5 μm (PM2.5) in industrial, urban, suburban, and rural areas of Nanjing city during 2016 compared with typical international air quality guideline values (24 h).
Atmosphere 10 00419 g002
Figure 3. Seasonal average concentrations of PM2.5 in industrial and urban areas of Nanjing city during 2016.
Atmosphere 10 00419 g003
Figure 4. Comparison of average concentrations of PM2.5 between the representative warm and cold seasons among four different functional regions in Nanjing city during 2016.
Atmosphere 10 00419 g004
Figure 5. Comparison of the concentrations of PM2.5-bound heavy metals (ng/m3) in air among four different functional regions in Nanjing city during 2016.
Atmosphere 10 00419 g005
Figure 6. Comparison of the enrichment factors (EFs) of PM2.5-bound heavy metals (EF > 10) in air among four different functional regions in Nanjing city during 2016.
Atmosphere 10 00419 g006
Figure 7. Comparison of the EFs of PM2.5-bound heavy metals (EF < 10) in air among four different functional regions in Nanjing city during 2016.
Atmosphere 10 00419 g007
Table 1. Slope factor and the reference dose entering the human body through the respiratory route for human health risk assessments [26].
MetalsSF 1RfD 2
Cd6.31 × 10−3
Co9.85.7 × 10−6
Pb--3.5 × 10⁻³
Mn--1.4 × 10⁻⁵
Cu--4 × 10⁻²
1 Slope factor, 2 Reference dose.
Table 2. Atmospheric concentrations (ng/m3) of heavy metals in PM2.5 from industrial, urban, suburban, and rural areas of Nanjing, China compared with other regions.
RegionsYearSbPbCoCdMnVCuTiSr
WHO AQG 5150
Industrial area a (n = 102)20165.6369.51.022.3445.98.4355.355.610.6
Urban area a (n = 102)20164.9650.61.061.9538.98.2427.843.110.2
Suburban area a (n = 27)20164.4345.9 0.82 1.4746.05.8525.474.412.7
Rural area a (n = 20)20163.3430.11.021.0122.04.6520.235.47.12
Beijing (China) b2013–2014 145 1.9354.42.4035.41.19
Athens (Greece) c2010 6.013.53 15.0
Ahvaz (Iran) d2016 4.4 0.004 6
a This study, b [33], c [11], d [34].
Table 3. Seasonal average concentrations (ng/m3) of PM2.5-bound heavy metals in industrial and urban sites of Nanjing city during 2016.
LocationSeasonPbMnCuTiSrVSbCoCd
Industrial areaSpring (n = 34)79.9 45.9 48.8 50.2 8.14 8.29 5.98 0.80 2.12
Summer (n = 28)54.3 36.3 39.1 44.0 9.54 7.72 4.81 0.82 2.19
Autumn (n = 22)79.5 53.2 41.5 47.6 11.3 10.0 5.31 1.56 2.97
Winter (n = 28)63.0 52.5 86.9 93.9 16.2 7.95 5.04 1.08 2.24
Urban areaSpring (n = 34)47.9 36.0 26.3 40.7 8.00 8.67 4.93 1.14 1.61
Summer (n = 28) 39.7 27.3 21.4 33.2 6.95 7.17 4.57 0.92 1.67
Autumn (n = 22)42.6 38.0 25.6 40.8 9.60 7.62 4.74 1.11 2.04
Winter (n = 28)70.8 48.9 70.3 82.4 12.6 8.48 5.13 1.21 2.32
Table 4. Results of principal component analysis (PCA) of heavy metals in PM2.5 from industrial, urban, suburban, and rural areas of Nanjing, China.
ElementsIndustrial AreaUrban AreaSuburban AreaRural Area
PC1PC2PC3PC1PC2PC3PC4PC1PC2PC3PC1PC2PC3PC4
Sb0.3530.0090.6780.1910.3630.7580.1290.1650.3830.6560.0500.7280.2150.071
Pb0.0640.2540.7960.0420.0540.8840.1870.1120.0850.8430.0970.7200.0230.482
Co0.2100.8680.0330.2040.7240.1230.2290.7900.2210.2020.0310.0450.8960.133
Cd0.2680.0690.8260.5540.2210.4990.1590.0410.0510.8790.1090.0300.1540.940
Mn0.1620.8560.3490.1650.3220.1490.7690.2760.7560.2010.4120.8350.0490.029
V0.4330.6700.2640.2680.7580.0720.0790.7990.0430.2610.3110.4840.6960.053
Cu0.1000.3470.7010.1060.6110.5340.1610.8410.1500.3230.7180.0280.2650.298
Ti0.844*0.1020.1070.7900.3030.0480.3030.1550.8910.1590.9060.1610.1500.276
Al0.7940.4040.3390.8610.4050.0940.1850.8930.2900.1180.9580.1680.1550.046
Sr0.8480.3150.2050.8400.1180.0020.3310.8490.3760.0160.9480.2180.0830.155
Eigenvalue > 13.272.862.823.2282.321.991.774.512.692.244.922.371.531.44
Variance %27.223.923.526.919.316.714.737.622.418.740.919.712.811.9
Cumulative %27.251.174.626.946.262.977.637.660.078.740.960.773.485.4
SourceNatural sourceNatural sourceNatural sourceNatural source
Metallurgical chemical dustAutomobile exhaustAutomobile exhaust
* Bold numbers (>0.6) indicate a significant association in an analyzed principle component.
Table 5. Hazard quotient (HQ) and increased lifetime cancer risk (ILCR) for heavy metals in PM2.5 from industrial, urban, suburban, and rural areas during 2016.
Health RiskElementsIndustrial AreaUrban AreaSuburban AreaRural Area
AdultChildrenAdultChildrenAdultChildrenAdultChildren
Noncarcinogenic HazardPb1.52 × 10−38.16 × 10−41.10 × 10−35.94 × 10−41.00 × 10−35.38 × 10−46.57 × 10−43.54 × 10⁻⁴
Co1.37 × 10−27.35 × 10−31.42 × 10−27.64 × 10−31.10 × 10−25.91 × 10−31.37 × 10−27.35 × 10⁻³
Cd1.79 × 10−49.62 × 10−51.49 × 10−48.01 × 10−51.12 × 10−46.04 × 10−57.71 × 10−54.15 × 10⁻⁵
Mn2.50 × 10−11.35 × 10−12.12 × 10−11.14 × 10−12.51 × 10−11.35 × 10−11.20 × 10−16.45 × 10⁻²
Cu1.05 × 10−45.68 × 10−55.30 × 10−52.85 × 10−54.84 × 10−52.61 × 10−53.85 × 10−52.07 × 10⁻⁵
CarcinogenicRiskCo1.17 × 10−61.22 × 10−69.44 × 10−71.17 × 10⁻⁶
Cd1.73 × 10−61.44 × 10−61.09 × 10−67.47 × 10⁻⁷

