Next Issue
Volume 16, November
Previous Issue
Volume 16, September


Atmosphere, Volume 16, Issue 10 (October 2025) – 108 articles

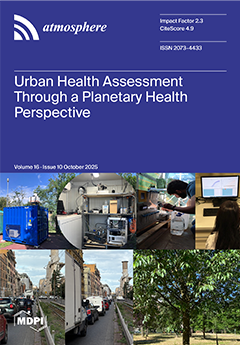
Cover Story (view full-size image): This paper introduces the NBFC-Rome experiment, whose primary objective is to outline the planetary health approach as a framework for assessing urban health. The initial results of this highly transdisciplinary case study indicate that short-term exposure to urban aerosols, even at low concentrations, triggers rapid oxidative and inflammatory responses in bronchial epithelial cells, modulates gene and miRNA expression, alters gut microbiota diversity, and induces functional trait changes in urban trees. The study also highlights feedback mechanisms between vegetation and atmospheric conditions, emphasizing the role of urban greenery in modulating microclimate and pollutant exposure. In an increasingly urbanized world, this evidence could be pivotal in promoting the widespread adoption of planetary health approaches to assess and improve urban health. View this paper
  • Issues are regarded as officially published after their release is announced to the table of contents alert mailing list.
  • You may sign up for e-mail alerts to receive table of contents of newly released issues.
  • PDF is the official format for papers published in both, html and pdf forms. To view the papers in pdf format, click on the "PDF Full-text" link, and use the free Adobe Reader to open them.
Order results
Result details
Section
Select all
Export citation of selected articles as:
16 pages, 1293 KB  
Article
Associations Between Air Pollution and Hospital Admissions for Cardiovascular and Respiratory Diseases in Makkah, Saudi Arabia, During the Hajj Cultural Events and the COVID-19 Outbreak
by Albaraa A. Milibari, Ivan C. Hanigan, Hatim M. Badri, Wahaj A. Khan and Krassi Rumchev
Atmosphere 2025, 16(10), 1220; https://doi.org/10.3390/atmos16101220 - 21 Oct 2025
Viewed by 474
Abstract
Air pollution is a global issue affecting health and the environment. This study investigated associations between PM10, NO2, and admissions from cardiovascular and respiratory diseases in Makkah (2019–2022), comparing Hajj cultural events and the COVID-19 lockdown with non-event periods, [...] Read more.
Air pollution is a global issue affecting health and the environment. This study investigated associations between PM10, NO2, and admissions from cardiovascular and respiratory diseases in Makkah (2019–2022), comparing Hajj cultural events and the COVID-19 lockdown with non-event periods, using time-series Poisson regression models adjusted for time and seasonality. Event interactions, particularly the impact of the Hajj and COVID-19 periods, were examined to assess potential effects on morbidity. The study findings showed that PM10 was significantly associated with increased respiratory admissions during the Hajj period (lag 0: RR = 1.066; 95% CI: 1.030–1.104), and with decreased risk during the non-Hajj period (lag 0: RR = 0.966; 95% CI: 0.942–0.991) and non-COVID periods (lag 0: RR = 0.946; 95% CI: 0.920–0.973). NO2 demonstrated a strong positive association with respiratory admissions during the Hajj period across all lags, peaking at lag 0 with a 16.2% increased risk (RR = 1.162; 95% CI: 1.118–1.207). Exposure to PM10 during Hajj was associated with a 3.1% increased risk of cardiovascular admissions (lag 0: RR = 1.031; 95% CI: 1.012–1.050) and decreased risk during non-Hajj (lag 0: RR = 0.981; 95% CI: 0.963–0.999) and non-COVID periods (lag 0: RR = 0.962; 95% CI: 0.942–0.983). NO2 exposure was positively associated with cardiovascular admissions during Hajj (lag 0: RR = 1.039; 95% CI: 1.019–1.056) and non-COVID periods (lag 0: RR = 1.037; 95% CI: 1.007–1.068). These findings provide event-specific evidence to guide targeted air quality management during mass gatherings, helping policymakers protect the health of Makkah’s residents and visitors. Full article
(This article belongs to the Section Air Quality and Health)
Show Figures

Figure 1

25 pages, 7246 KB  
Article
Research on the Distribution Characteristics and Health Effects of O3 in the Fenwei Plain
by Qianqian Wang, Chunhui Yang, Man Liu and Ruifeng Yan
Atmosphere 2025, 16(10), 1219; https://doi.org/10.3390/atmos16101219 - 21 Oct 2025
Viewed by 315
Abstract
In recent years, coal-combustion-related air pollution has declined markedly, whereas tropospheric ozone (O3) pollution has emerged as a growing environmental concern. Long-term exposure to O3 can severely impact human health and ecosystems, constraining socioeconomic development. The Fenwei Plain has complex [...] Read more.
In recent years, coal-combustion-related air pollution has declined markedly, whereas tropospheric ozone (O3) pollution has emerged as a growing environmental concern. Long-term exposure to O3 can severely impact human health and ecosystems, constraining socioeconomic development. The Fenwei Plain has complex topographical conditions and a relatively simple industrial structure, and at present, O3 is one of the main pollutants affecting air quality in this region. Therefore, studying the distribution of O3 pollution in the Fenwei Plain can provide a reference for developing plans to control O3 pollution in the area, which is important for safeguarding local public health and economic development. Currently, the number of pollutant monitoring stations in China is limited, spatially discontinuous, and significantly affected by environmental factors, making it difficult to obtain high-precision, large-scale observational data. Satellite-based remote sensing provides broad spatial coverage and is free from topographic constraints, thereby serving as an effective complement to ground-based monitoring networks. This provides important technical support for studying the distribution characteristics of O3 pollution and its associated health risks. This study focuses on the Fenwei Plain, utilizing machine learning models to estimate continuous O3 concentrations from 2015 to 2022 and analyze the spatiotemporal distribution of O3. Based on this, an assessment and analysis of the health risks associated with near-surface O3 exposure in the study area will be conducted, incorporating the population exposed in the Fenwei Plain and individuals with chronic obstructive pulmonary disease (COPD). Full article
(This article belongs to the Section Air Quality and Health)
Show Figures

Figure 1

10 pages, 5749 KB  
Article
Clear-Air Turbulence over China: Climatology and Multiscale Mechanisms from First Long-Term Aircraft Reports
by Wei Zhang, Xiaochen Zhang, Wei Yuan, Chongyu Zhang, Minghua Hu and Ting Yang
Atmosphere 2025, 16(10), 1218; https://doi.org/10.3390/atmos16101218 - 21 Oct 2025
Viewed by 341
Abstract
Clear-air turbulence (CAT), as a key meteorological hazard threatening aviation safety, urgently requires the revelation of its spatiotemporal distribution patterns and formation mechanisms within the China region. Based on the first release of 12,539 aircraft turbulence voice reports from China’s civil aviation from [...] Read more.
Clear-air turbulence (CAT), as a key meteorological hazard threatening aviation safety, urgently requires the revelation of its spatiotemporal distribution patterns and formation mechanisms within the China region. Based on the first release of 12,539 aircraft turbulence voice reports from China’s civil aviation from 2022 to 2024 and ERA5 high-resolution reanalysis data, this study constructs for the first time a climatological portrait of aircraft turbulence over China, revealing the spatiotemporal distribution characteristics and formation mechanisms of CAT in the region: turbulence occurs predominantly at 3000–8000 m (accounting for 61.0%), peaking at 7000–8000 m, driven by strong low-level jet wind shear and Kelvin–Helmholtz instability (KHI); wintertime exhibits a high frequency (33.4%) stemming from strong upper-level jets (>30 m s−1), while summer is dominated by low-level thermal convection (21.0%); the high-incidence zones of Central-South and Southwest China (>2800 events) are jointly governed by a mid-level strong horizontal gradient of vertical vorticity, divergence perturbations, and jet shear, with the winter jet shifting southward (22–30° N), further intensifying the turbulence risk. The findings establish a dynamic–thermodynamic coupling mechanism for CAT over China, providing a scientific basis for aviation safety early warning. Full article
(This article belongs to the Section Aerosols)
Show Figures

Graphical abstract

10 pages, 1521 KB  
Article
Estimation of Ionosphere Electron Density Structure Related to the Solar Terminator
by Alexey Andreyev, Vyacheslav Somsikov, Vitaliy Kapytin, Yekaterina Chsherbulova and Stanislav Utebayev
Atmosphere 2025, 16(10), 1217; https://doi.org/10.3390/atmos16101217 - 20 Oct 2025
Viewed by 218
Abstract
The solar terminator, due to its unique characteristics, is a remarkable source of atmospheric disturbances. Due to its regularity and constancy, dependent solely on geometric factors, it can serve as a test source of disturbances, which can be used to test the response [...] Read more.
The solar terminator, due to its unique characteristics, is a remarkable source of atmospheric disturbances. Due to its regularity and constancy, dependent solely on geometric factors, it can serve as a test source of disturbances, which can be used to test the response of the medium through which it passes and determine its state. However, our knowledge of the atmospheric phenomena generated by the terminator is far from complete. One clear indication of the terminator’s influence is geomagnetic disturbances manifested in the vertical and eastward components of the magnetic field measured at magnetic observatories. To determine the sources of geomagnetic disturbances from the solar terminator, which can be identified by the strict phase correlation of these disturbances with the moments of terminator passage, ionospheric irregularities arising during terminator passage were studied. Ionospheric irregularities extending along the boundary of the morning solar terminator were detected in total electron content data, based on measurements by GNSS receivers. Assumptions are made about the possible parameters of the ionospheric current structure that creates variations in the magnetic field associated with the passage of the solar terminator. Full article
(This article belongs to the Special Issue Advanced GNSS for Ionospheric Sounding and Disturbances Monitoring)
Show Figures

Figure 1

20 pages, 1428 KB  
Article
A Framework to Minimise the Impacts of Climate Change on UK Residential Buildings and Occupants
by Ehis Lawrence Onus, Ezekiel Chinyio, Emmanuel Itodo Daniel and Michael Gerges
Atmosphere 2025, 16(10), 1216; https://doi.org/10.3390/atmos16101216 - 20 Oct 2025
Viewed by 316
Abstract
Residential buildings, the bastions of shelter and protection, are facing an escalating threat from climate change. The need to bolster the resilience of UK residential buildings is becoming more urgent, given the nature and frequency of the impact of climate change. This study [...] Read more.
Residential buildings, the bastions of shelter and protection, are facing an escalating threat from climate change. The need to bolster the resilience of UK residential buildings is becoming more urgent, given the nature and frequency of the impact of climate change. This study employed a sequential explanatory mixed-method approach. The first phase involved surveying 313 households, revealing that Climate Change on Buildings (CCB) and Climate Change Measures (CCM) significantly influenced Climate Change on Occupants (CCO). Moreover, climate-positive measures were found to have a significant impact on building occupants. The second phase involved semi-structured interviews with ten UK construction experts to gather insights into the effects of climate change on residential buildings and strategies for mitigation. The findings from both phases underscore the need for government incentives, green loans, and increased stakeholder awareness to mitigate the impacts of climate change. To fully address climate change and improve the quality of life for residents, all stakeholders, including policy makers, construction professionals, and the community, must participate actively in these efforts. Consequently, a framework was developed to minimise the impacts of climate change on UK residential buildings. Full article
(This article belongs to the Section Climatology)
Show Figures

Figure 1

18 pages, 12942 KB  
Article
Unfavorable Local Meteorological Conditions in the Vicinity of the Planned Nuclear Power Plant in Jordan
by Shatha S. Ali-Saleh, Marwan M. Al-Kloub, Shatha Alsadi, Safaa Marei, Alexander Baklanov, Alexander Mahura, Nahid Atashi and Tareq Hussein
Atmosphere 2025, 16(10), 1215; https://doi.org/10.3390/atmos16101215 - 20 Oct 2025
Viewed by 290
Abstract
The development of nuclear energy in Jordan necessitates a detailed understanding of local meteorological behavior, particularly during unfavorable weather conditions. This study uses the METEO mesoscale model to simulate wind fields, vertical motions, and surface–air temperature differences under unfavorable wind directions (15°, 105°, [...] Read more.
The development of nuclear energy in Jordan necessitates a detailed understanding of local meteorological behavior, particularly during unfavorable weather conditions. This study uses the METEO mesoscale model to simulate wind fields, vertical motions, and surface–air temperature differences under unfavorable wind directions (15°, 105°, and 195°) and two wind speeds (1 m/s and 5 m/s), across cold season (January) and warm season (July), near the Samra Energy Power Plant (SEPP)—a proposed location for Jordan’s nuclear plant. Simulations reveal that low wind speeds create stable atmospheric layers with limited vertical motion (±0.1 m/s), enhancing the risk of pollutant accumulation in valleys. Higher wind speeds promote vertical mixing (up to ±0.15 m/s) and lower temperature gradients (within ±0.2 °C), dispersing pollutants more efficiently. These results suggest that specific wind thresholds could determine the spatial extent of emergency response zones, including “shelter-in-place” areas and evacuation perimeters. This study offers valuable insights for nuclear safety planning and environmental risk assessment in complex terrain. Full article
(This article belongs to the Section Meteorology)
Show Figures

Figure 1

20 pages, 2426 KB  
Article
Comprehensive Health Risk Assessment of PM2.5 Chemical Composition in an Urban Megacity: A Case Study from Greater Cairo Area
by Eliane Farah, Marc Fadel, Hassan R. Dhaini, Nansi Fakhri, Minas Iakovides, Salwa K. Hassan, Mohamed Boraiy, Mostafa El-Nazer, Ali Wheida, Magdy Abdelwahab, Stéphane Sauvage, Agnès Borbon, Jean Sciare, Frédéric Ledoux, Charbel Afif and Dominique Courcot
Atmosphere 2025, 16(10), 1214; https://doi.org/10.3390/atmos16101214 - 20 Oct 2025
Viewed by 418
Abstract
While many studies on the health effects of PM2.5 exist, the risks of PM2.5 species remain largely unexplored in Middle Eastern and North African countries. This study assesses, for the first time, the carcinogenic and non-carcinogenic health risks for elements, polycyclic [...] Read more.
While many studies on the health effects of PM2.5 exist, the risks of PM2.5 species remain largely unexplored in Middle Eastern and North African countries. This study assesses, for the first time, the carcinogenic and non-carcinogenic health risks for elements, polycyclic aromatic hydrocarbons (PAHs), phthalates, polychlorinated dibenzo-p-dioxins (PCDDs), dibenzofurans (PCDFs), and dioxin-like polychlorinated biphenyls (DL-PCBs) bound to PM2.5 in the Greater Cairo Area. A total of 59 samples were collected from an urban site in Dokki (November 2019–January 2020). Chemical analysis showed higher concentrations of PCDFs (5418 fg/m3) than PCDDs (1469 fg/m3), with DL-PCBs being the most abundant (6577 fg/m3). Health risk assessment for inhalation showed non-carcinogenic risks for all age groups, especially for newborns. Manganese (Mn) and lead (Pb) posed the highest elemental non-carcinogenic risk, while the hazard quotient (HQ) for PAHs exceeded 1 across all ages. PCDDs, PCDFs, and DL-PCBs showed an estimated cancer risk reaching 10−6 in adults, indicating a significant health concern. Key contributors to cancer risk included arsenic (As), chromium (Cr(VI)), and vanadium (V), which accounted for over 80% of the total elemental cancer risk. Major and trace elements posed the highest lifetime cancer risk, nearly 37 times the acceptable level. Full article
(This article belongs to the Section Air Quality and Health)
Show Figures

Figure 1

27 pages, 10609 KB  
Article
High-Resolution Traffic Flow Prediction and Vehicle Emission Inventory Estimation for Chinese Cities Using Geo-Spatial Data of Jinan City, China
by Xuejun Yan, Qi Yang, Jingyang Fan, Ziyuan Cai, Pan Wang, Xiuli Zhang, Hengzhi Wang, Chenxi Zhu, Dongquan He and Chunxiao Hao
Atmosphere 2025, 16(10), 1213; https://doi.org/10.3390/atmos16101213 - 20 Oct 2025
Viewed by 272
Abstract
Motor vehicle emissions are a major air quality concern in Chinese cities. However, traditional population-based emission inventory methods fail to capture the spatial and temporal variations in emissions for effective policy design. This study proposes a high-resolution approach for traffic flow prediction and [...] Read more.
Motor vehicle emissions are a major air quality concern in Chinese cities. However, traditional population-based emission inventory methods fail to capture the spatial and temporal variations in emissions for effective policy design. This study proposes a high-resolution approach for traffic flow prediction and vehicle emission inventory estimation, using Jinan City, China, as a case study. We leverage multi-source geospatial data and employ a two-fold random forest model to predict hourly traffic flow at a road-segment level. Speed-aligned emission factors were then combined with these data to calculate hourly and road-level vehicle emission estimates. Compared to traditional methods, our approach offers substantial improvements: (1) improved spatiotemporal resolution; (2) enhanced accuracy of traffic flow prediction; and (3) support for more effective vehicle emission control strategies. Results show that heavy-duty vehicles, particularly freight trucks operating on inter-regional corridors through Jinan, contribute 78% more to NOX emissions than local light-duty vehicles. These transient emissions are typically overlooked in static inventories but constitute a significant source of urban pollution. This study offers valuable insights for combining geospatial data and machine learning to improve the accuracy and resolution of vehicle emission inventories, supporting urban air quality policy and planning. Full article
(This article belongs to the Special Issue Recent Advances in Mobile Source Emissions (2nd Edition))
Show Figures

Figure 1

13 pages, 1742 KB  
Article
Black Carbon in Urban and Suburban Hangzhou: Spatiotemporal Variation, Precipitation Scavenging, and Policy Impacts
by Mengjing Zhu, Honghui Xu, Meng Shan, Huansang Chen, Yilei Dong and Yuyun Lei
Atmosphere 2025, 16(10), 1212; https://doi.org/10.3390/atmos16101212 - 20 Oct 2025
Viewed by 251
Abstract
Black carbon (BC) aerosols significantly impact regional air quality and global climate as important light-absorbing atmospheric particles. Using high-temporal resolution BC observation data from urban and suburban sites in Hangzhou and PM10 concentrations, this study analyzed the temporal and spatial distribution characteristics [...] Read more.
Black carbon (BC) aerosols significantly impact regional air quality and global climate as important light-absorbing atmospheric particles. Using high-temporal resolution BC observation data from urban and suburban sites in Hangzhou and PM10 concentrations, this study analyzed the temporal and spatial distribution characteristics of BC concentrations, precipitation scavenging efficiency, and the efficacy of emission mitigation policies. The results showed that (1) suburban BC concentrations presented a significant interannual decline. Seasonal variation displayed a single peak, with high concentrations in winter and low concentrations in summer. A characteristic bimodal diurnal variation pattern was observed, with peaks during morning and evening rush hours. In terms of spatial distribution, the annual average concentration in urban areas was 20.7% higher than in suburban areas, with the largest difference in winter. (2) The scavenging efficiency of precipitation showed nonlinear characteristics. The average efficiency of light rain was the highest, whereas heavy rainfall showed more complex characteristics. The scavenging efficiency of continuous 12 h precipitation was significantly higher than that of short-term heavy rainfall. (3) Emission mitigation policy implementation had a marked effect, with diesel vehicle restrictions and biomass combustion control reducing BC concentrations by 11% and 19%, respectively. Full article
(This article belongs to the Section Aerosols)
Show Figures

Figure 1

20 pages, 4040 KB  
Article
Spatial Correlation Network Analysis of PM2.5 in China: A Temporal Exponential Random Graph Model Approach
by Xia Wu and Linyi Zhou
Atmosphere 2025, 16(10), 1211; https://doi.org/10.3390/atmos16101211 - 20 Oct 2025
Viewed by 295
Abstract
With the rapid acceleration of industrialization and urbanization in China, PM2.5 pollution has emerged as a major challenge to public health and sustainable development of the society and economy. At the interprovincial level, PM2.5 exhibits a complex spatial correlation network structure. Using data [...] Read more.
With the rapid acceleration of industrialization and urbanization in China, PM2.5 pollution has emerged as a major challenge to public health and sustainable development of the society and economy. At the interprovincial level, PM2.5 exhibits a complex spatial correlation network structure. Using data from 31 provinces in China from 2000 to 2023, this study constructed a spatial correlation network of PM2.5 and analyzed its structural characteristics and formation mechanisms. The results reveal that China’s PM2.5 spatial correlation network is both complex and stable, underscoring the severity of the pollution problem. The network demonstrates a distinct ‘core–periphery’ distribution, with provinces such as Jiangsu, Shandong, and Henan occupying central positions and functioning as critical bridges. Block model analysis showed a clear role of differentiation among provinces in the diffusion of pollution. Temporal exponential random graph model suggests that geographical proximity, industrial structure, vehicle ownership, and government intervention are key factors shaping the network. Geographically adjacent provinces are more likely to form close connections, whereas environmental regulation and vehicle ownership tend to constrain the spread of pollution. This study provides a novel theoretical framework for understanding the spatial diffusion pathways of PM2.5 pollution and offers important policy implications for optimizing and implementing cross-regional air quality governance strategies in China. Full article
(This article belongs to the Special Issue Coordinated Control of PM2.5 and O3 and Its Impacts in China)
Show Figures

Figure 1

19 pages, 15745 KB  
Article
Variability in Meteorological Parameters at the Lenghu Site on the Tibetan Plateau
by Yong Zhao, Fei He, Ruiyue Li, Fan Yang and Licai Deng
Atmosphere 2025, 16(10), 1210; https://doi.org/10.3390/atmos16101210 - 20 Oct 2025
Viewed by 239
Abstract
This study presents a comprehensive analysis of key meteorological parameters at the Lenghu site, a premier astronomical observing location, with particular emphasis on understanding their variability patterns and long-term trends. The research systematically investigates regional distribution characteristics, periodic variations, seasonal changes, and the [...] Read more.
This study presents a comprehensive analysis of key meteorological parameters at the Lenghu site, a premier astronomical observing location, with particular emphasis on understanding their variability patterns and long-term trends. The research systematically investigates regional distribution characteristics, periodic variations, seasonal changes, and the temporal evolution of critical atmospheric parameters that influence astronomical observations. Furthermore, this study explores the potential connections between these parameters and major climate oscillation patterns, including ENSO (El Niño–Southern Oscillation), PDO (Pacific Decadal Oscillation), and AMO (Atlantic Multidecadal Oscillation). Utilizing ERA5 (the fifth-generation atmospheric reanalysis from the European Centre for Medium-Range Weather Forecasts) reanalysis data, we examine the regional atmospheric conditions (82°–102° E and 31°–46° N) surrounding the Lenghu site from 2000 to 2023 (24 years). The analysis focuses on fundamental meteorological parameters: precipitable water vapor (PWV), temperature, wind speed at 200 hPa (W200), and total cloud cover (TCC). For the Lenghu site specifically, we extend the temporal coverage to 1990–2023 (34 years) to include additional parameters such as high cloud cover (HCC) and total column ozone (TCO). The analysis reveals that the ENSO and PDO indices are negatively correlated with W200. The AMO index has a positive correlation with PWV and a slight positive correlation with W200, temperature, and TCO. Moreover, a comparative analysis of Lenghu, Mauna Kea, and Paranal reveals distinct variation trends across sites due to regional climate differences. Notably, while all observatory sites are affected by global climate change, their response patterns and temporal characteristics exhibit subtle variations. Full article
(This article belongs to the Section Climatology)
Show Figures

Figure 1

31 pages, 3502 KB  
Article
Air Pollution in Taiyuan City During 2022 to 2024: Status and Influence of Meteorological Factors
by Xiaohui Huang and Lizhen Gao
Atmosphere 2025, 16(10), 1209; https://doi.org/10.3390/atmos16101209 - 19 Oct 2025
Viewed by 273
Abstract
The deterioration of environmental air quality is an urgent global issue, and the level of air pollution is particularly severe in developing countries. This study aims to understand the air quality problems in Taiyuan City and explore the evolution of air pollution trends [...] Read more.
The deterioration of environmental air quality is an urgent global issue, and the level of air pollution is particularly severe in developing countries. This study aims to understand the air quality problems in Taiyuan City and explore the evolution of air pollution trends and their relationship with meteorological factors. The result shows that the air quality in Taiyuan has distinct temporal distribution characteristics, with summer being better than winter. Wind speed has an impact on air quality and is closely related to the season. The increase in wind speed in spring is conducive to a reduction in NO2 concentrations, but it leads to an increase in PM10 concentration. In summer, wind speed is negatively correlated with CO and positively correlated with O3. In autumn, except for O3, wind speed is negatively correlated with various air pollutants. During winter, wind speed has a favorable effect on most atmospheric pollutants, except for O3 and PM10. When temperatures soar, it is necessary to be vigilant about the possibility of O3 concentration exceeding standards in summer. But, in winter, an increase in temperature often leads to an increase in PM2.5 and PM10 concentrations. An increase in humidity is very beneficial in spring, helping to lower the concentration of PM10, but in winter it can lead to an increase in the concentrations of both PM2.5 and PM10. Precipitation can improve air quality, especially when it exceeds 3 mm. These findings suggest that pollutant control strategies may need to be adjusted according to the season, especially for particulate matter. Full article
(This article belongs to the Section Air Quality)
Show Figures

Figure 1

24 pages, 31821 KB  
Article
Response of Vegetation Net Primary Productivity to Extreme Climate in a Climate Transition Zone: Evidence from the Qinling Mountains
by Qiuqiang Zeng and Chengyuan Hao
Atmosphere 2025, 16(10), 1208; https://doi.org/10.3390/atmos16101208 - 18 Oct 2025
Viewed by 279
Abstract
The Qinling Mountains, situated in the climatic transition zone between northern and southern China, represent a critical region for climate and ecological studies due to their unique transitional characteristics and the rising frequency of extreme climate events. As net primary productivity (NPP) is [...] Read more.
The Qinling Mountains, situated in the climatic transition zone between northern and southern China, represent a critical region for climate and ecological studies due to their unique transitional characteristics and the rising frequency of extreme climate events. As net primary productivity (NPP) is a key indicator of ecosystem stability, clarifying its response to extreme climate events is essential for understanding ecological resilience in this region. In this study, daily observational data from 123 meteorological stations (1960–2023) were used to derive eight extreme temperature and precipitation indices. Combined with MODIS NPP data (2001–2023), we applied Theil–Sen slope estimation, Mann–Kendall significance testing, ridge regression, Pearson correlation analysis, and Moran’s I spatial autocorrelation to systematically investigate the spatiotemporal dynamics and driving mechanisms of NPP. The main findings are as follows: (1) From 2001 to 2023, the mean annual NPP in the Qinling region was 558.43 ± 134.27 gC·m−2·year−1, showing a significant increasing trend of 5.44 gC·m−2·year−1 (p < 0.05). (2) Extreme temperature indices exhibited significant changes, whereas among the precipitation indices, only the number of days with daily precipitation ≥ 20 mm (R20) showed a significant trend, suggesting that extreme temperatures exert a stronger influence in the region. (3) Correlation analysis indicated that temperature-related indices were generally positively correlated, precipitation-related indices displayed even stronger associations, and covariation existed among extreme precipitation events of varying intensities. Moreover, precipitation indices demonstrated relatively stable spatial distributions, while temperature indices fluctuated considerably. (4) Absolute contribution analysis further revealed that the number of days with daily minimum temperature below the 10th percentile (TN10p) contributed up to 3.53 gC·m−2·year−1 to annual NPP variation in the Henan subregion, whereas maximum rainfall over five consecutive days (Rx5day) exerted an overall negative effect on NPP (−0.77 gC·m−2·year−1). By integrating long-term meteorological observations with remote sensing products, this study quantitatively evaluates the differential impacts of extreme climate events on vegetation within a climatic transition zone, offering important implications for ecological conservation and adaptive management in the Qinling Mountains. Full article
(This article belongs to the Special Issue Vegetation–Atmosphere Interactions in a Changing Climate)
Show Figures

Figure 1

14 pages, 3889 KB  
Article
Runoff and Sediment Response to Rainfall Events in China’s North-South Transitional Zone: Insights from Runoff Plot Observations
by Zhijia Gu, Keke Ji, Gaohan Xu, Maidinamu Reheman, Detai Feng, Yi Shen, Qiang Yi, Jiayi Kang, Xinmiao Zhang and Sitong Pan
Atmosphere 2025, 16(10), 1207; https://doi.org/10.3390/atmos16101207 - 18 Oct 2025
Viewed by 278
Abstract
China’s North-South Transition Zone is a critical ecological transition region, marked by complex environments, climatic sensitivity, and transitional characteristics. To investigate the effects of individual rainfall events on runoff generation and sediment yield across different slopes and land uses within this zone, the [...] Read more.
China’s North-South Transition Zone is a critical ecological transition region, marked by complex environments, climatic sensitivity, and transitional characteristics. To investigate the effects of individual rainfall events on runoff generation and sediment yield across different slopes and land uses within this zone, the study collected data from slope runoff plots (20 m in length and 5 m in width, measured as horizontal projection) at three monitoring stations (Luoshan, Lushan, Shanzhou) between 2014 and 2023. Rainfall events were classified via K-means clustering. Regression and correlation analyses were applied to reveal the effects of rainfall characteristics, slope gradient and land use type (grass land, dry land, forest land, bare land and natural vegetation) on runoff and sediment. The results indicate that: (1) The most frequent rainstorms were Type C (short, low-intensity, low-volume, low-erosivity events). (2) The runoff depth of bare land is 3.6, 2.3, and 2 times that of forest land, dry land, and natural vegetation, respectively. Similarly, its sediment concentration is 134, 13, and 16 times higher, respectively. Grassland, however, showed markedly lower levels of both runoff and sediment. (3) Rainfall intensity was significantly correlated with runoff and sediment across slopes. Runoff depth depended mainly on rainfall amount. While Type A (prolonged, high-intensity) caused peak runoff, Type D (moderate but intense and erosive) yielded the highest sediment. (4) Sediment reduction efficiency (sediment reduction compared to bare land under identical conditions) consistently surpassed runoff reduction across all land types, with grassland showing the highest efficiency for both. For soil and water conservation, grass-planting was the most effective measure on 10° and 15° slopes, whereas both afforestation and grass-planting were optimal on the 25° slopes. Full article
(This article belongs to the Section Meteorology)
Show Figures

Figure 1

17 pages, 2813 KB  
Article
Study on Improving Pulsed-Jet Performance in Cone Filter Cartridges Using a Porous Diffusion Nozzle
by Quanquan Wu, Zhenqiang Xing, Yufan Xu, Yuanbing Tang, Yangyang Li, Yuxiu Wang, Heli Wang, Zhuo Liu, Wenjun Xie, Shukai Sun, Da You and Jianlong Li
Atmosphere 2025, 16(10), 1206; https://doi.org/10.3390/atmos16101206 - 18 Oct 2025
Viewed by 224
Abstract
The new type of gold cone filter cartridge has dual functions of increasing filter area and enhancing pulsed-jet cleaning, but the issue of patchy cleaning remains to be addressed. This study further enhances the pulsed-jet cleaning performance of cone filter cartridges by employing [...] Read more.
The new type of gold cone filter cartridge has dual functions of increasing filter area and enhancing pulsed-jet cleaning, but the issue of patchy cleaning remains to be addressed. This study further enhances the pulsed-jet cleaning performance of cone filter cartridges by employing a porous diffusion nozzle. The temporal and spatial distributions of pulse jet velocity and pressure under the condition of porous nozzles were investigated through numerical modeling. The variation law of pressure on the side wall of the filter cartridge was analyzed. The influence of jet distance of porous nozzles on pulsed-jet pressure and pulsed-jet uniformity was experimentally investigated. Dust filtration and cleaning experiments were conducted, and the filtration pressure drop, dust emission concentration, and comprehensive filtration performance were compared. It was found that the airflow jetted by the porous diffusion nozzle is more divergent than that of the common round nozzle. This results in a larger entrainment of the jet stream, a milder collision of the jet stream with the cartridge cone, and a slower overall velocity reduction. More airflow is generated into the filter cartridge and accumulated; the accumulated static pressure covers a larger range of the upper section of the filter cartridge, with a longer duration of static pressure. In the online dust filtration and cleaning experiment, compared with the condition of the common round nozzle, the porous nozzle can reduce the residual pressure drop by 27.0%, increase the filtration cleaning interval by a factor of 3.80, reduce the average dust emission concentration by 45.2%, and increase the comprehensive performance index QF by 5.2%. The research conclusions can provide references for the design and optimization of industrial filter cartridge dust collectors. Full article
(This article belongs to the Section Air Pollution Control)
Show Figures

Figure 1

14 pages, 7785 KB  
Article
Influence of the Stratospheric Polar Vortex on the Near-Surface Wind Speed in Winter over China
by Yang Li, Xiran Xu and Ruhua Zhang
Atmosphere 2025, 16(10), 1205; https://doi.org/10.3390/atmos16101205 - 17 Oct 2025
Viewed by 315
Abstract
Using station observations, the JRA-55 reanalysis dataset, and the CESM2 model, this study investigates the impacts of the stratospheric polar vortex (SPV) on winter near-surface wind speed (NSWS) over China across interannual and interdecadal timescales. On the interannual timescale, a strong SPV leads [...] Read more.
Using station observations, the JRA-55 reanalysis dataset, and the CESM2 model, this study investigates the impacts of the stratospheric polar vortex (SPV) on winter near-surface wind speed (NSWS) over China across interannual and interdecadal timescales. On the interannual timescale, a strong SPV leads to a downward-extension signal that generates negative geopotential height anomalies over the Arctic, skewed toward the Atlantic sector. The associated surface response resembles the positive phase of the Arctic Oscillation (AO), resulting in reduced NSWS over northern China. In contrast, a weak SPV produces opposite effects. On the decadal timescale, a weakened SPV induces positive height anomalies over the Arctic that shift toward Northeast Eurasia. The surface response over the polar region stimulates a wave train, which drives a positive height anomaly over the North Pacific. The pressure gradient between East Asia and the North Pacific suppresses NSWS over eastern China. The response of China’s NSWS to interannual SPV variability is more pronounced than its response to interdecadal changes. CESM2 model simulations confirm these contrasting responses and the associated mechanisms. Full article
(This article belongs to the Section Climatology)
Show Figures

Figure 1

13 pages, 5483 KB  
Article
Implications of East Pacific La Niña Events for Southern African Climate
by Mark R. Jury
Atmosphere 2025, 16(10), 1204; https://doi.org/10.3390/atmos16101204 - 17 Oct 2025
Viewed by 296
Abstract
Longitudinal shifts in the zonal dipole associated with the El Niño–Southern Oscillation (ENSO) in the tropical Pacific have implications for the summer climate of Southern Africa. These features are studied via Empirical Orthogonal Function analysis applied to monthly standardized sea temperatures from 1 [...] Read more.
Longitudinal shifts in the zonal dipole associated with the El Niño–Southern Oscillation (ENSO) in the tropical Pacific have implications for the summer climate of Southern Africa. These features are studied via Empirical Orthogonal Function analysis applied to monthly standardized sea temperatures from 1 to 100 m in depth and spanning 1980–2024. The dipole exhibits two modes: central and east Pacific. The central mode has 4–7 yr oscillations, while the east mode has a periodicity of 3 yr and 8–14 yr, with a trend toward La Niña. Correlations are mapped with environmental fields around Southern Africa. During east-mode La Niña, there are low-level westerlies over the Kalahari Plateau that coincide with a warm-west Indian Ocean and neutral summer (Dec–Mar) weather conditions over Southern Africa. The weak climatic response across the Atlantic–Indian basins during east Pacific La Niña is linked to an isolated Walker cell that feeds tropical moisture into a trough over the dateline (180° W). It is the central mode that has greater influence over Southern Africa, by triggering global Walker cells that link with the Indian Ocean Dipole. Full article
(This article belongs to the Section Climatology)
Show Figures

Figure 1

35 pages, 13736 KB  
Article
Effects of Improved Atmospheric Boundary Layer Inlet Boundary Conditions for Uneven Terrain on Pollutant Dispersion from Nuclear Facilities
by Zhongkun Wang, Dexin Ding, Xiumin Dou and Zhengming Li
Atmosphere 2025, 16(10), 1203; https://doi.org/10.3390/atmos16101203 - 17 Oct 2025
Viewed by 349
Abstract
The specification of inlet boundary conditions plays a critical role in computational fluid dynamics (CFD) simulations of pollutant dispersion from nuclear facilities, particularly in regions characterized by uneven terrain. Previous studies have often simplified such terrain by approximating it as a flat surface [...] Read more.
The specification of inlet boundary conditions plays a critical role in computational fluid dynamics (CFD) simulations of pollutant dispersion from nuclear facilities, particularly in regions characterized by uneven terrain. Previous studies have often simplified such terrain by approximating it as a flat surface to reduce computational complexity. However, this approach fails to adequately capture the realistic atmospheric boundary layer dynamics inherent to uneven topographies. To address this limitation, this study conducted atmospheric dispersion tracer experiments specifically designed for nuclear facilities situated on non-uniform terrain. A novel inlet boundary condition, termed the Atmospheric Boundary Layer of Uneven Terrain (ABLUT), was developed by modifying the existing atmBoundaryLayer model in OpenFOAM. Numerical simulations were performed using both the default and the proposed ABLUT boundary conditions, incorporating different turbulence models and examining the influence of turbulent Schmidt numbers across a range of 0.3 to 1.3. The results demonstrate that the ABLUT boundary condition, particularly when coupled with a turbulent Schmidt number of 0.7 and the SST kω turbulence model, yields the closest agreement with experimental tracer dispersion data. Notably, comparative analyses between the default and improved models revealed significant discrepancies in near-surface wind speed profiles, with deviations becoming increasingly pronounced at higher elevations. Numerical simulations were conducted to assess the ground-level distribution of Total Effective Dose Equivalent (TEDE) for four typical radionuclides (3H, 14C, 85Kr and 129I) emitted from nuclear facilities under both higher and lower wind speed conditions. Results demonstrate that the TEDE maxima across all scenarios remain orders of magnitude below regulatory annual limits. These findings provide critical insights for enhancing the accuracy of wind field simulations in the vicinity of nuclear facilities located on uneven terrain, thereby contributing to improved risk assessment and environmental impact evaluations. Full article
(This article belongs to the Section Air Pollution Control)
Show Figures

Figure 1

19 pages, 11031 KB  
Article
Exploring the Diurnal Dynamics Mechanism of the Cold Island Effect in Urban Parks of Island Cities: A Three-Dimensional Spatial Morphology Perspective
by Jingjing Wang, Yongshu Wu, Junyi Li, Zhipeng Zhu, Weicong Fu, Guochang Ding and Xiaoling Xu
Atmosphere 2025, 16(10), 1202; https://doi.org/10.3390/atmos16101202 - 17 Oct 2025
Viewed by 265
Abstract
Urban parks play a crucial role in mitigating urban heat stress and maintaining ecological stability through their cold island effect (PCIE). However, studies examining how multidimensional urban morphology influences these effects, particularly from a diurnal perspective in island cities, remain limited. This study [...] Read more.
Urban parks play a crucial role in mitigating urban heat stress and maintaining ecological stability through their cold island effect (PCIE). However, studies examining how multidimensional urban morphology influences these effects, particularly from a diurnal perspective in island cities, remain limited. This study investigates 30 representative urban parks within a typical island city, exploring how two-dimensional and three-dimensional spatial morphological factors affect four key PCIE indicators: park cooling intensity (PCI), park cooling gradient (PCG), park cooling area (PCA) and park cooling efficiency (PCE) across different times of day and night. The results reveal that: (1) coastal zones exhibit significantly lower land surface temperature (LST) than inland zones, with peak LST occurring at 5:00 p.m.; (2) the four cold island indicators follow a diurnal pattern of 5:00 p.m. > 1:00 a.m. > 7:00 a.m.; (3) morphological construction factors—such as building density (BD) and built-up proportion (BP)—positively contribute to cooling effects at 7:00 a.m., while park perimeter (PP) enhances cooling performance at both 5:00 p.m. and 1:00 a.m. Additionally, vegetation characteristics surrounding parks, including the normalized difference vegetation index (NDVI) and green space proportion (GP), influence daytime cooling in directions opposite to those of the aforementioned construction-related factors. These findings offer valuable insights into the temporal dynamics and spatial determinants of urban park cooling in island cities, providing a scientific basis for scientifically informed park planning and contributing to healthier and more sustainable urban development. Full article
(This article belongs to the Section Meteorology)
Show Figures

Graphical abstract

15 pages, 2951 KB  
Article
Urban–Rural PM2.5 Dynamics in Kraków, Poland: Patterns and Source Attribution
by Dorota Lipiec, Piotr Lipiec and Tomasz Danek
Atmosphere 2025, 16(10), 1201; https://doi.org/10.3390/atmos16101201 - 17 Oct 2025
Viewed by 433
Abstract
Hourly PM2.5 concentrations were measured from February to May 2025 by a network of low-cost sensors located in urban Kraków and its surrounding municipalities. Temporal variability associated with the transition from the heating period to the spring months, together with spatial contrasts, [...] Read more.
Hourly PM2.5 concentrations were measured from February to May 2025 by a network of low-cost sensors located in urban Kraków and its surrounding municipalities. Temporal variability associated with the transition from the heating period to the spring months, together with spatial contrasts, were assessed with principal component analysis (PCA), urban–rural difference curves, and a detailed examination of the most severe smog episode (12–13 February). Particle trajectories generated with the HYSPLIT dispersion model, run in a coarse-grained, 36-task parallel configuration, were combined with kernel density mapping to trace emission pathways. The results show that peak concentrations coincide with the heating season; rural sites recorded higher amplitudes and led the urban signal by up to several hours, implicating external sources. Time-series patterns, PCA loadings, and HYSPLIT density fields provided mutually consistent evidence of pollutant advection toward the city. Parallelizing HYSPLIT on nine central processing unit (CPU) cores reduced the runtime from more than 600 s to about 100 s (speed-up ≈ 6.5), demonstrating that routine episode-scale analyses are feasible even on modest hardware. The findings underline the need to extend monitoring and mitigation beyond Kraków’s administrative boundary and confirm that coarse-grained parallel HYSPLIT modeling, combined with low-cost sensor data and relatively basic statistics, offers a practical framework for rapid source attribution. Full article
(This article belongs to the Special Issue High-Performance Computing for Atmospheric Modeling (2nd Edition))
Show Figures

Graphical abstract

20 pages, 2801 KB  
Article
Monthly Scale Validation of Climate Models’ Outputs Against Gridded Data over South Africa
by Helga Chauke and Rita Pongrácz
Atmosphere 2025, 16(10), 1200; https://doi.org/10.3390/atmos16101200 - 17 Oct 2025
Viewed by 261
Abstract
The validation of climate models is important for ensuring accurate climate variability over a given region. This study evaluates the performance of multiple global climate model simulations from the Coupled Model Intercomparison Project Phases 5 and 6 and the downscaled regional climate model [...] Read more.
The validation of climate models is important for ensuring accurate climate variability over a given region. This study evaluates the performance of multiple global climate model simulations from the Coupled Model Intercomparison Project Phases 5 and 6 and the downscaled regional climate model simulations from the Coordinated Regional Climate Downscaling Experiment against gridded observational data from the Climatic Research Unit gridded data during the historic period 1981–2000. Spatial analysis using monthly bias maps and statistical metrics (i.e., correlation coefficient, standard deviation, and centred root-mean-squared error) were employed to assess the model outputs’ ability to reproduce monthly temperature and precipitation patterns over South Africa. The results indicate an improvement in CMIP6 and CORDEX model simulation outputs compared to their CMIP5 predecessors, with reduced biases and enhanced correlation. The study underscores the importance of model selection for regional climate analysis and highlights a need for further model development to capture complex physical processes. Full article
(This article belongs to the Section Climatology)
Show Figures

Figure 1

21 pages, 4149 KB  
Article
Air Pollution Monitoring and Modeling: A Comparative Study of PM, NO2, and SO2 with Meteorological Correlations
by Elżbieta Wójcik-Gront and Dariusz Gozdowski
Atmosphere 2025, 16(10), 1199; https://doi.org/10.3390/atmos16101199 - 17 Oct 2025
Viewed by 453
Abstract
Monitoring air pollution remains a significant challenge for both environmental policy and public health, particularly in parts of Eastern Europe where industrial structures are undergoing transition. In this paper, we examine long-term air quality trends in Poland between 1990 and 2023, drawing on [...] Read more.
Monitoring air pollution remains a significant challenge for both environmental policy and public health, particularly in parts of Eastern Europe where industrial structures are undergoing transition. In this paper, we examine long-term air quality trends in Poland between 1990 and 2023, drawing on multiple sources: satellite observations (from 2019 to 2025), ground-based stations, and official national emission inventories. The analysis focused on sulfur dioxide (SO2), nitrogen dioxide (NO2), and particulate matter (PM10, PM2.5). Data were obtained from the Sentinel-5P TROPOMI sensor, processed through Google Earth Engine, and monitored by the Chief Inspectorate of Environmental Protection (GIOŚ, Warsaw, Poland) and the National Inventory Report (NIR, Warsaw, Poland), compiled by KOBiZE (The National Centre for Emissions Management, Warsaw, Poland). The results show a decline in emissions. SO2, for instance, dropped from about 2700 kilotons in 1990 to under 400 kilotons in 2023. Ground-based measurements matched well with inventory data (correlations around 0.75–0.85), but the agreement was noticeably weaker when satellite estimates were compared with surface monitoring. In addition to analyzing emission trends, this study examined the relationship between pollution levels and meteorological conditions across major Polish cities from 2019 to mid-2024. Pearson’s correlation analysis revealed strong negative correlations between temperature and pollutant concentrations, especially for SO2, reflecting the seasonal nature of pollution peaks during colder months. Wind speed exhibited ambiguous relationships, with daily data indicating a dilution effect (negative correlations), whereas monthly averages revealed positive associations, likely due to seasonal confounding. Higher humidity was consistently linked to higher pollution levels, and precipitation showed weak negative correlations, likely influenced by seasonal weather patterns rather than direct atmospheric processes. These findings suggest that combining different monitoring methods, despite their quirks and mismatches, provides a fuller picture of atmospheric pollution. They also point to a practical challenge. Further improvements will depend less on sweeping industrial reform and more on shifting everyday practices, like how homes are heated and how people move around cities. Full article
(This article belongs to the Section Air Quality)
Show Figures

Figure 1

13 pages, 18301 KB  
Article
Spatiotemporal Characteristics of Parallel Stacked Structure Signals in VLF Electric Field Observations from CSES-01 Satellite
by Bo Hao, Jianping Huang, Zhong Li, Kexin Zhu, Yuanjing Zhang, Kexin Pan and Wenjing Li
Atmosphere 2025, 16(10), 1198; https://doi.org/10.3390/atmos16101198 - 17 Oct 2025
Viewed by 247
Abstract
This study reports, for the first time, the discovery and systematic characterization of a distinct electromagnetic phenomenon—the parallel stacked structure signal—in the VLF band using CSES-01 satellite electric field data. Its main contribution lies in defining this novel signal, characterized by transversely aligned [...] Read more.
This study reports, for the first time, the discovery and systematic characterization of a distinct electromagnetic phenomenon—the parallel stacked structure signal—in the VLF band using CSES-01 satellite electric field data. Its main contribution lies in defining this novel signal, characterized by transversely aligned and longitudinally clustered high-energy regions, and revealing its unique spatiotemporal patterns. We find these signals exhibit a pronounced Southern Hemisphere mid-to-high latitude preference (40° S–65° S), a strong seasonal dependence (peak in winter and autumn), and a remarkable nightside dominance (86.4%). Analysis shows these patterns are not primarily governed by routine solar (F10.7) or geomagnetic (SME) activity, indicating a more complex generation mechanism. This work provides a foundational classification and analysis, offering a new and significant observable for future investigations into space weather and Lithosphere–Atmosphere–Ionosphere Coupling processes. Full article
(This article belongs to the Special Issue Research and Space-Based Exploration on Space Plasma)
Show Figures

Figure 1

15 pages, 516 KB  
Perspective
Advances in High-Resolution Spatiotemporal Monitoring Techniques for Indoor PM2.5 Distribution
by Qingyang Liu
Atmosphere 2025, 16(10), 1196; https://doi.org/10.3390/atmos16101196 - 17 Oct 2025
Viewed by 337
Abstract
Indoor air pollution, including fine particulate matter (PM2.5), poses a severe threat to human health. Due to the diverse sources of indoor PM2.5 and its high spatial heterogeneity in distribution, traditional single-point fixed monitoring fails to accurately reflect the actual [...] Read more.
Indoor air pollution, including fine particulate matter (PM2.5), poses a severe threat to human health. Due to the diverse sources of indoor PM2.5 and its high spatial heterogeneity in distribution, traditional single-point fixed monitoring fails to accurately reflect the actual human exposure level. In recent years, the development of high spatiotemporal resolution monitoring technologies has provided a new perspective for revealing the dynamic distribution patterns of indoor PM2.5. This study discusses two cutting-edge monitoring strategies: (1) mobile monitoring technology based on Indoor Positioning Systems (IPS) and portable sensors, which maps 2D exposure trajectories and concentration fields by having personnel carry sensors while moving; and (2) 3D dynamic monitoring technology based on in situ Lateral Scattering LiDAR (I-LiDAR), which non-intrusively reconstructs the 3D dynamic distribution of PM2.5 concentrations using laser arrays. This study elaborates on the principles, calibration methods, application cases, advantages, and disadvantages of the two technologies, compares their applicable scenarios, and outlines future research directions in multi-technology integration, intelligent calibration, and public health applications. It aims to provide a theoretical basis and technical reference for the accurate assessment of indoor air quality and the prevention and control of health risks. Full article
Show Figures

Graphical abstract

34 pages, 9217 KB  
Article
Collaborative Station Learning for Rainfall Forecasting
by Bagati Sudarsan Patro and Prashant P. Bartakke
Atmosphere 2025, 16(10), 1197; https://doi.org/10.3390/atmos16101197 - 16 Oct 2025
Viewed by 443
Abstract
Cloudbursts and other extreme rainfall events are becoming more frequent and intense, making precise forecasts and disaster preparedness more challenging. Despite advances in meteorological monitoring, current models often lack the precision needed for hyperlocal extreme rainfall forecasts. This study addresses the research gap [...] Read more.
Cloudbursts and other extreme rainfall events are becoming more frequent and intense, making precise forecasts and disaster preparedness more challenging. Despite advances in meteorological monitoring, current models often lack the precision needed for hyperlocal extreme rainfall forecasts. This study addresses the research gap in spatial configuration-aware modeling by proposing a novel framework that combines geometry-based weather station selection with advanced deep learning architectures. The primary goal is to utilize real-time data from well-placed Automatic Weather Stations to enhance the precision and reliability of extreme rainfall predictions. Twelve unique datasets were generated using four different geometric topologies—linear, triangular, quadrilateral, and circular—centered around the target station Chinchwad in Pune, India, a site that has recorded diverse rainfall intensities, including a cloudburst event. Using common performance criteria, six deep learning models were trained and assessed across these topologies. The proposed Bi-GRU model under linear topology achieved the highest predictive accuracy (R2 = 0.9548, RMSE = 2.2120), outperforming other configurations. These findings underscore the significance of geometric topology in rainfall prediction and provide practical guidance for refining AWS network design in data-sparse regions. In contrast, the Transformer model showed poor generalization with high MAPE values. These results highlight the critical role of spatial station configuration and model architecture in improving prediction accuracy. The proposed framework enables real-time, location-specific early warning systems capable of issuing alerts 2 h before extreme rainfall events. Timely and reliable predictions support disaster risk reduction, infrastructure resilience, and community preparedness, which are essential for safeguarding lives and property in vulnerable regions. Full article
Show Figures

Figure 1

29 pages, 7085 KB  
Article
Marine Boundary Layer Cloud Boundaries and Phase Estimation Using Airborne Radar and In Situ Measurements During the SOCRATES Campaign over Southern Ocean
by Anik Das, Baike Xi, Xiaojian Zheng and Xiquan Dong
Atmosphere 2025, 16(10), 1195; https://doi.org/10.3390/atmos16101195 - 16 Oct 2025
Viewed by 253
Abstract
The Southern Ocean Clouds, Radiation, Aerosol Transport Experimental Study (SOCRATES) was an aircraft-based campaign (15 January–26 February 2018) that deployed in situ probes and remote sensors to investigate low-level clouds over the Southern Ocean (SO). A novel methodology was developed to identify cloud [...] Read more.
The Southern Ocean Clouds, Radiation, Aerosol Transport Experimental Study (SOCRATES) was an aircraft-based campaign (15 January–26 February 2018) that deployed in situ probes and remote sensors to investigate low-level clouds over the Southern Ocean (SO). A novel methodology was developed to identify cloud boundaries and classify cloud phases in single-layer, low-level marine boundary layer (MBL) clouds below 3 km using the HIAPER Cloud Radar (HCR) and in situ measurements. The cloud base and top heights derived from HCR reflectivity, Doppler velocity, and spectrum width measurements agreed well with corresponding lidar-based and in situ estimates of cloud boundaries, with mean differences below 100 m. A liquid water content–reflectivity (LWC-Z) relationship, LWC = 0.70Z0.29, was derived to retrieve the LWC and liquid water path (LWP) from HCR profiles. The cloud phase was classified using HCR measurements, temperature, and LWP, yielding 40.6% liquid, 18.3% mixed-phase, and 5.1% ice samples, along with drizzle (29.1%), rain (3.2%), and snow (3.7%) for drizzling cloud cases. The classification algorithm demonstrates good consistency with established methods. This study provides a framework for the boundary and phase detection of MBL clouds, offering insights into SO cloud microphysics and supporting future efforts in satellite retrievals and climate model evaluation. Full article
(This article belongs to the Section Atmospheric Techniques, Instruments, and Modeling)
Show Figures

Figure 1

17 pages, 3785 KB  
Article
Feasibility Study of Microwave Radiometer Neural Network Modeling Method Based on Reanalysis Data
by Xuan Liu, Qinglin Zhu, Xiang Dong, Houcai Chen, Tingting Shu, Wenxin Wang and Bin Xu
Atmosphere 2025, 16(10), 1194; https://doi.org/10.3390/atmos16101194 - 16 Oct 2025
Viewed by 238
Abstract
To address the challenge of microwave radiometer modeling in regions lacking radiosonde data, this study proposes a neural network retrieval method based on high-resolution the Final Reanalysis (FNL) reanalysis data and validates its feasibility. A microwave radiometer brightness temperature–profiles retrieval model was developed [...] Read more.
To address the challenge of microwave radiometer modeling in regions lacking radiosonde data, this study proposes a neural network retrieval method based on high-resolution the Final Reanalysis (FNL) reanalysis data and validates its feasibility. A microwave radiometer brightness temperature–profiles retrieval model was developed by the Back Propagation (BP) neural network, based on FNL reanalysis data from Qingdao, China. The model’s accuracy was evaluated by comparing retrieval results with synchronous radiosonde data, with an analysis of seasonal variations. Results indicate that the Root Mean Square Error (RMSE) of temperature profiles are 1.15 °C in the near-surface layer (0–2 km) and 2.05 °C in the mid-to-upper layers (>2 km). The comprehensive RMSE for relative humidity, water vapor density, and Integrated Water Vaper (IWV) are 17.27%, 0.96 g/m3, and 1.37 mm, respectively. Overall, the errors are relatively small, and the retrieval results exhibit strong spatiotemporal consistency with radiosonde data. The error increases most rapidly within the lower atmosphere (<2 km), with distinct seasonal differences observed. Temperature and relative humidity retrieval accuracies peak in summer, whereas water vapor density and IWV retrievals perform best in winter and worst in summer. This study confirms that reanalysis data–based modeling effectively addresses the issue of limited radiosonde coverage. This method is applicable to atmospheric remote sensing in regions lacking radiosonde data, such as oceans and plateaus. It provides a feasible solution to the regional limitations of microwave radiometer applications and expands the potential uses of reanalysis data. Full article
Show Figures

Figure 1

22 pages, 8353 KB  
Article
Application of Hybrid Data Assimilation Methods for Mesoscale Eddy Simulation and Prediction in the South China Sea
by Yuewen Shan, Wentao Jia, Yan Chen and Meng Shen
Atmosphere 2025, 16(10), 1193; https://doi.org/10.3390/atmos16101193 - 16 Oct 2025
Viewed by 282
Abstract
In this study, we compare two novel hybrid data assimilation (DA) methods: Localized Weighted Ensemble Kalman filter (LWEnKF) and Implicit Equal-Weights Variational Particle Smoother (IEWVPS). These methods integrate a particle filter (PF) with traditional DA methods. LWEnKF combines the PF with EnKF, while [...] Read more.
In this study, we compare two novel hybrid data assimilation (DA) methods: Localized Weighted Ensemble Kalman filter (LWEnKF) and Implicit Equal-Weights Variational Particle Smoother (IEWVPS). These methods integrate a particle filter (PF) with traditional DA methods. LWEnKF combines the PF with EnKF, while IEWVPS integrates the PF with the four-dimensional variational (4DVAR) method. These hybrid DA methods not only overcome the limitations of linear or Gaussian assumptions in traditional assimilation methods but also address the issue of filter degeneracy in high-dimensional models encountered by pure PFs. Using the Regional Ocean Model System (ROMS), the effects of different DA methods for mesoscale eddies in the northern South China Sea (SCS) are examined using simulation experiments. The hybrid DA methods outperform the linear deterministic variational and Kalman filter methods: compared to the control experiment (no assimilation), EnKF, LWEnKF, IS4DVar and IEWVPS reduce the sea level anomaly (SLA) root-mean-squared error (RMSE) by 55%, 65%, 65% and 80%, respectively, and reduce the sea surface temperature (SST) RMSE by 77%, 78%, 74% and 82%, respectively. In the short-term assimilation experiment, IEWVPS exhibits superior performance and greater stability compared to 4DVAR, and LWEnKF outperforms EnKF (LWEnKF’s posterior SLA RMSE is 0.03 m, lower than EnKF’s value of 0.04 m). Long-term forecasting experiments (16 days, starting on 20 July 2017) are also conducted for mesoscale eddy prediction. The variational methods (especially IEWVPS) perform better in simulating the flow field characteristics of eddies (maintaining accurate eddy structure for the first 10 days, with an average SLA RMSE of 0.05 m in the studied AE1 eddy region), while the filters are more advantageous in determining the total root-mean-squared error (RMSE), as well as the temperature under the sea surface. Overall, compared to EnKF and 4DVAR, the hybrid DA methods better predict mesoscale eddies across both short- and long-term timescales. Although the computational costs of hybrid DA are higher, they are still acceptable: specifically, IEWVPS takes approximately 907 s for a single assimilation cycle, whereas LWEnKF only takes 24 s, and its assimilation accuracy in the later stage can approach that of IEWVPS. Given the computational demands arising from increased model resolution, these hybrid DA methods have great potential for future applications. Full article
Show Figures

Figure 1

21 pages, 3734 KB  
Article
Characterization of VOC Emissions Based on Oil Depots Source Profiles Observations and Influence of Ozone Numerical Simulation
by Weiming An, Jilong Tong, Lei Zhang, Lingyun Ma, Yongle Liu, Hong Yang and Min Chen
Atmosphere 2025, 16(10), 1192; https://doi.org/10.3390/atmos16101192 - 16 Oct 2025
Viewed by 366
Abstract
Oil depots are continuous sources of volatile organic compounds (VOCs), which contribute to ground-level ozone (O3) and secondary organic aerosol formation, posing threats to air quality and public health. This study investigated typical crude and refined oil depots in the Xigu [...] Read more.
Oil depots are continuous sources of volatile organic compounds (VOCs), which contribute to ground-level ozone (O3) and secondary organic aerosol formation, posing threats to air quality and public health. This study investigated typical crude and refined oil depots in the Xigu District of Lanzhou by measuring VOC source profiles and establishing an emission inventory. The maximum incremental reactivity (MIR) method was applied to assess the chemical reactivity of VOCs; both the emission inventory and VOC profiles were incorporated into the WRF-CMAQ model for numerical simulations. Results showed that the average ambient VOC concentrations were 49.8 μg/m3 for the crude oil depot and 66.1 μg/m3 for the refined oil depot. The crude oil depot was dominated by alkanes (37.1%), aromatics (25.1%), and OVOCs (22.5%), while the refined oil depot was dominated by alkanes (57.3%) and OVOCs (16.7%), with isopentane identified as the most abundant species in both depots. The ozone formation potentials (OFPs) of the crude oil and refined oil depots were 153.1 μg/m3 and 178.3 μg/m3, respectively. Aromatics (47.0%) and OVOCs (29.0%) were the primary contributors at the crude oil depot, with isopentane, o-xylene, etc., as the dominant reactive species. In the refined oil depot, the main contributors were alkanes (27.8%), alkenes and alkynes (26.6%), OVOCs (24.5%), and aromatics (20.5%), among which isopentane, trans-2-butene, etc., were most prominent. In 2023, VOC emissions from the crude oil and refined oil depots were estimated at 1605.3 t and 1287.8 t, respectively, mainly from working loss (96.6%) in the crude oil depot and deck fitting loss (60.7%) and working loss (31.3%) in the refined oil depot. Numerical simulations indicated that oil depot emissions could increase regional MDA8 O3 concentrations by up to 40.0 μg/m3. At the nearby Lanlian Hotel site, emissions contributed 15.1% of the MDA8 O3, equivalent to a 6.1 μg/m3 increase, while the citywide average was 1.7 μg/m3. This study enriches the VOC source profile database for oil depots, reveals their significant role in regional O3 formation, and provides a scientific basis for precise O3 control and differentiated emission reduction strategies in Northwest China. Full article
(This article belongs to the Special Issue Air Pollution: Emission Characteristics and Formation Mechanisms)
Show Figures

Graphical abstract

12 pages, 36890 KB  
Article
Big L Days in GNSS TEC Data
by Klemens Hocke and Guanyi Ma
Atmosphere 2025, 16(10), 1191; https://doi.org/10.3390/atmos16101191 - 16 Oct 2025
Viewed by 274
Abstract
Big L days are days when the lunar semidiurnal variation M2 in the ionosphere is strongly enhanced by a factor of 2 or more. The worldwide network of ground-based receivers for the Global Navigation Satellite System (GNSS) has monitored the ionospheric total [...] Read more.
Big L days are days when the lunar semidiurnal variation M2 in the ionosphere is strongly enhanced by a factor of 2 or more. The worldwide network of ground-based receivers for the Global Navigation Satellite System (GNSS) has monitored the ionospheric total electron content (TEC) since 1998. The derived world maps of TEC are provided by the International GNSS Service (IGS) and allow the study of the characteristics of big L days in TEC. In the data analysis, the signal of the lunar semidiurnal variation M2 in TEC is separated from the solar semidiurnal variation S2 by means of windowing in the spectral domain. The time series of the M2 amplitude often shows enhancements of M2 (big L days) a few days after sudden stratospheric warmings (SSWs). The M2 amplitude can reach values of 8 TECU. The M2 composite of all SSWs from 1998 to 2024 shows that the M2 amplitude is enhanced after the central date of the SSW. Regions in Southern China and South America show stronger effects of big L days. Generally, the effects of big L days on TEC show latitudinal and longitudinal dependencies. Full article
(This article belongs to the Special Issue Ionospheric Disturbances and Space Weather)
Show Figures

Figure 1

Previous Issue
Next Issue
Back to TopTop