




Journal Description
Forecasting
Forecasting
is an international, peer-reviewed, open access journal on all aspects of forecasting published bimonthly online by MDPI.
- Open Access— free for readers, with article processing charges (APC) paid by authors or their institutions.
- High Visibility: indexed within Scopus, ESCI (Web of Science), RePEc, and other databases.
- Journal Rank: JCR - Q1 (Multidisciplinary Sciences) / CiteScore - Q1 (Economics, Econometrics and Finance (miscellaneous))
- Rapid Publication: manuscripts are peer-reviewed and a first decision is provided to authors approximately 23.8 days after submission; acceptance to publication is undertaken in 2.9 days (median values for papers published in this journal in the first half of 2026).
- Recognition of Reviewers: reviewers who provide timely, thorough peer-review reports receive vouchers entitling them to a discount on the APC of their next publication in any MDPI journal, in appreciation of the work done.
- Journal Cluster of Economics, Finance and Risk Systems: Commodities, Econometrics, Economies, FinTech, Forecasting, Games, International Journal of Financial Studies, Journal of Risk and Financial Management, Platforms and Risks.
Impact Factor:
4.2 (2025);
5-Year Impact Factor:
3.3 (2025)
Latest Articles
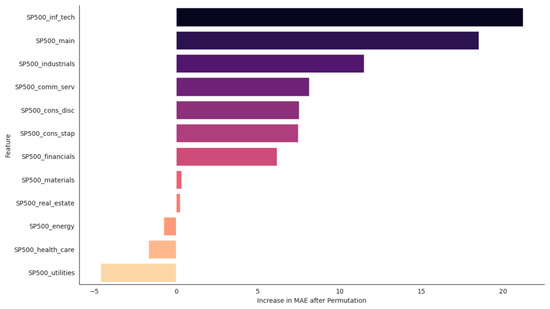
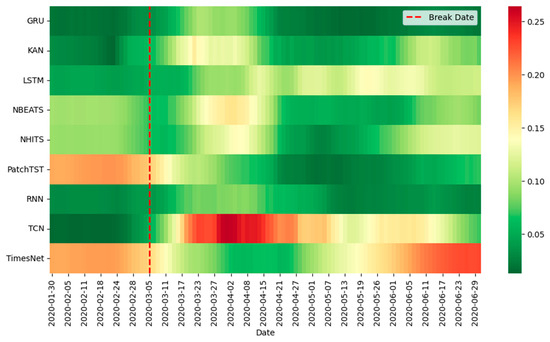
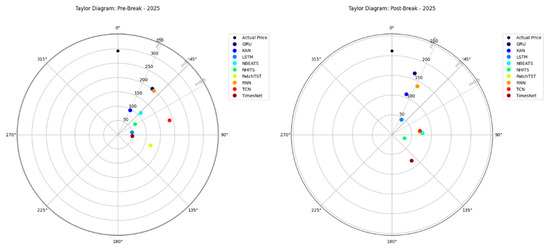
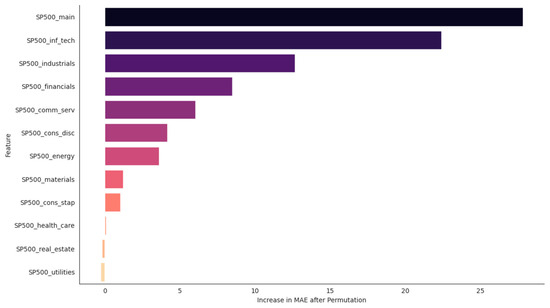
Regime-Dependent Sectoral Information Transmission in S&P 500 Forecasting
Forecasting 2026, 8(4), 75; https://doi.org/10.3390/forecast8040075 - 16 Aug 2026
Abstract
►
Show Figures
Understanding which segments of the economy drive aggregate stock market movements is central to risk management. This study traces how the economic drivers of the Standard & Poor’s 500 Index (S&P 500) changed across two episodes: the 2020 COVID-19 shock and the 2025
[...] Read more.
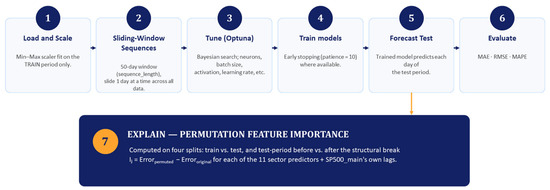
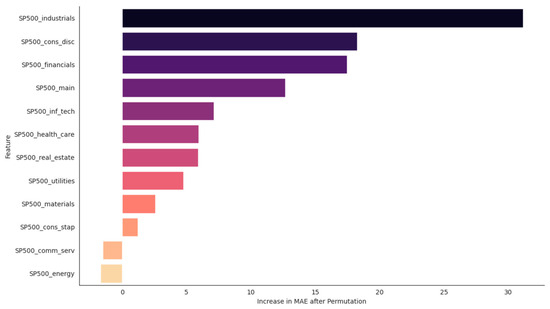
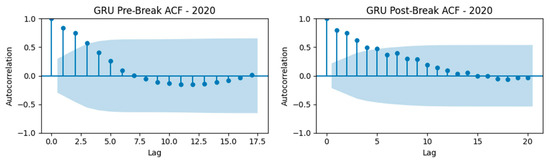
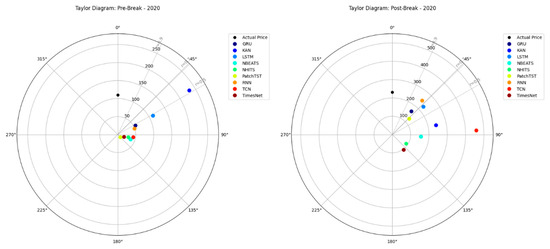
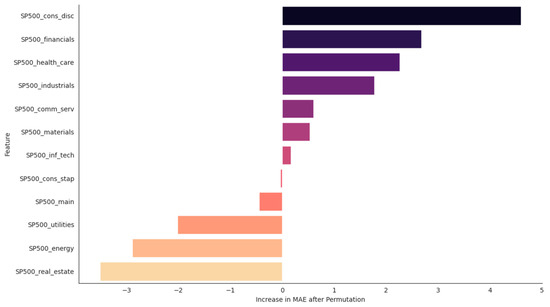
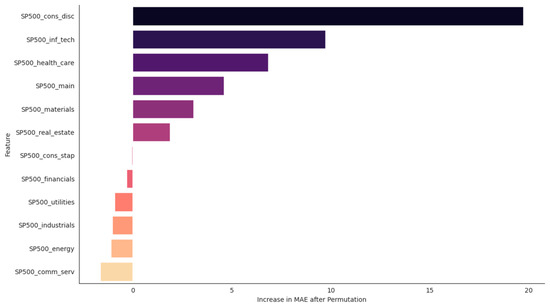
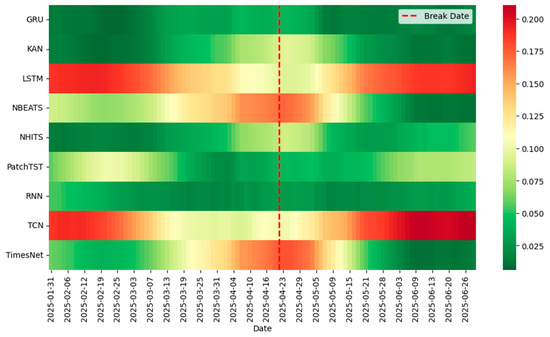
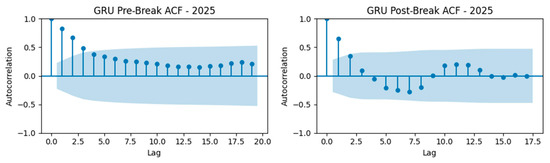
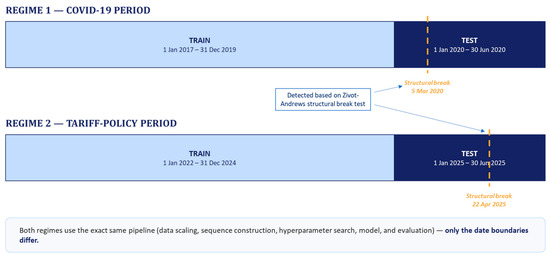
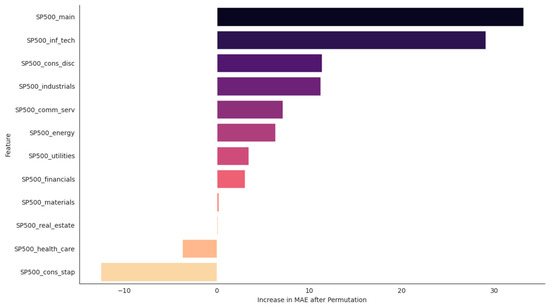
Understanding which segments of the economy drive aggregate stock market movements is central to risk management. This study traces how the economic drivers of the Standard & Poor’s 500 Index (S&P 500) changed across two episodes: the 2020 COVID-19 shock and the 2025 technology-led period, using eleven sector indices and nine deep learning architectures. During COVID-19, forecasting power concentrated in Consumer Discretionary, Health Care, and Industrials before reorganizing sharply around Information Technology, consistent with a disruptive break. In 2025, Information Technology and market momentum dominated throughout, with no comparable reorganization, consistent with a gradual adjustment rather than a disruptive shift. This distinction, invisible from accuracy metrics alone (Gated Recurrent Unit: Mean Absolute Percentage Error = 3.41% and 2.16%), shows that information-concentration diagnostics can complement forecast-accuracy and risk-monitoring frameworks.
Full article
Open AccessArticle
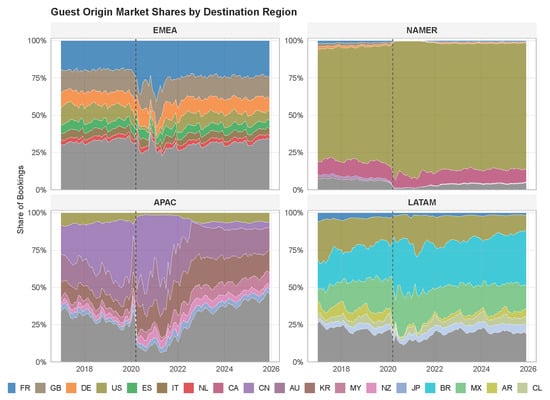
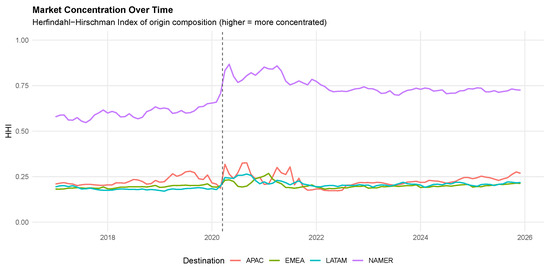
Forecasting the Evolving Composition of Guest Origin Markets in Platform Bookings: A Bayesian Compositional Time-Series Approach Using Airbnb Data
by
Harrison E. Katz
Forecasting 2026, 8(4), 74; https://doi.org/10.3390/forecast8040074 - 16 Aug 2026
Cited by 1
Abstract
►▼
Show Figures
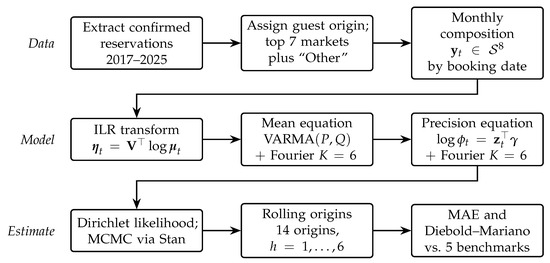
Tourism-demand forecasting overwhelmingly targets aggregate volumes, leaving the question of where demand will come from largely unaddressed. This paper forecasts that question directly. We make three contributions. First, we apply Bayesian Dirichlet autoregressive moving average (BDARMA) models to guest origin composition in large-scale
[...] Read more.
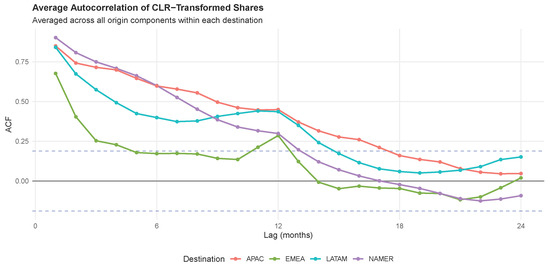
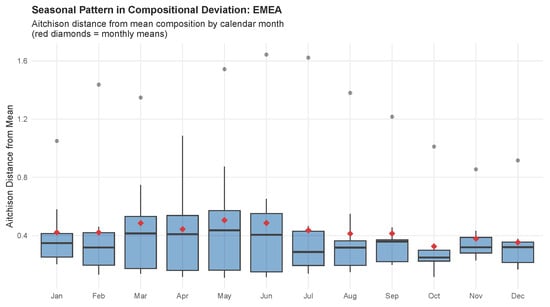
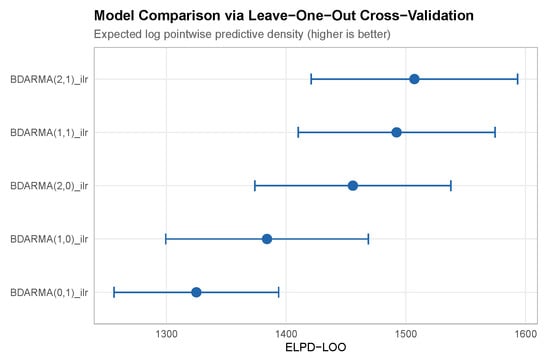
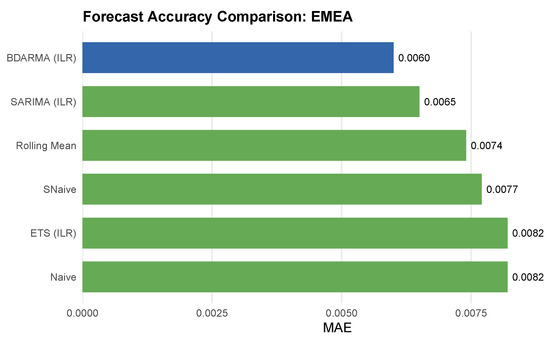
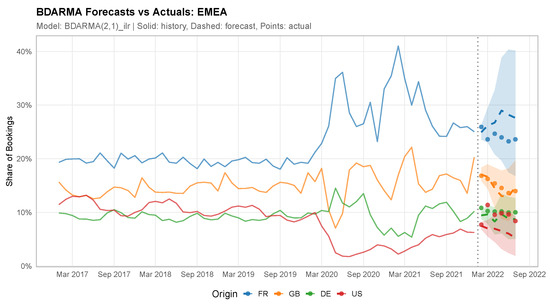
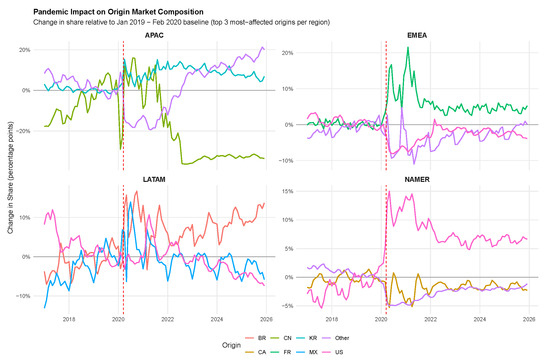
Tourism-demand forecasting overwhelmingly targets aggregate volumes, leaving the question of where demand will come from largely unaddressed. This paper forecasts that question directly. We make three contributions. First, we apply Bayesian Dirichlet autoregressive moving average (BDARMA) models to guest origin composition in large-scale platform booking data, which to our knowledge is the first use of Bayesian compositional time-series methods on booking-origin shares across multiple global destination regions. Second, we introduce seasonal structure in the Dirichlet precision parameter, and we isolate its contribution through an ablation against an otherwise identical constant-precision specification: seasonal precision lowers mean absolute error in all four destination regions, by between 13% and 35%. Third, the forecast target is the monthly composition of bookings indexed by booking date rather than stay date, which makes it observable ahead of realized arrivals and therefore usable for decisions with long lead times. Using proprietary Airbnb reservation data spanning 2017–2025 across four destination regions, we document substantial pandemic-era shifts in booking composition with heterogeneous recovery patterns. In rolling-origin evaluation, BDARMA achieves the lowest forecast error for EMEA, the most compositionally diverse region, reducing mean absolute error by 27% relative to naïve forecasts ( ). Performance elsewhere is mixed: simple benchmarks remain hard to beat, and exponential smoothing on isometric log-ratio-transformed data attains the lowest error averaged across the four regions. The EMEA pattern suggests that direct compositional modeling is most valuable where several origin markets hold material shares, although four destination regions are too few to establish this as a general rule. The methodology yields probabilistic forecasts of source market shares that can inform marketing allocation, concentration-risk monitoring, and forward-looking operational planning.
Full article

Figure 1
Open AccessArticle
Forecasting Multivariate Time Series: A Comparison of Machine Learning, Statistical and Deep Learning Models
by
Dler Hussein Kadir, Diyar Muadh Khalil and Azhin Muhammed Khudhur
Forecasting 2026, 8(4), 73; https://doi.org/10.3390/forecast8040073 - 12 Aug 2026
Abstract
►▼
Show Figures
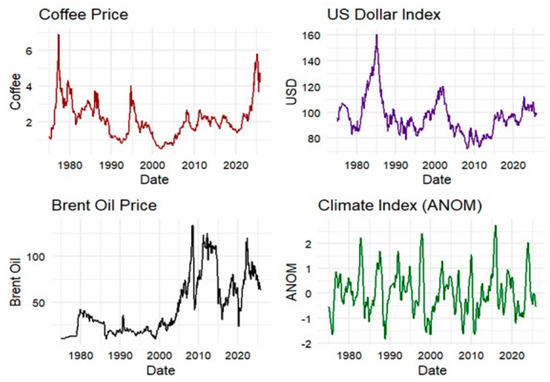
This study develops a rigorous, leakage-free forecasting framework for monthly Robusta coffee prices using historical observations from January 1975 to December 2025. A comprehensive set of explanatory variables is constructed from lagged coffee prices, moving averages, logarithmic returns, rolling volatility, and exogenous variables
[...] Read more.
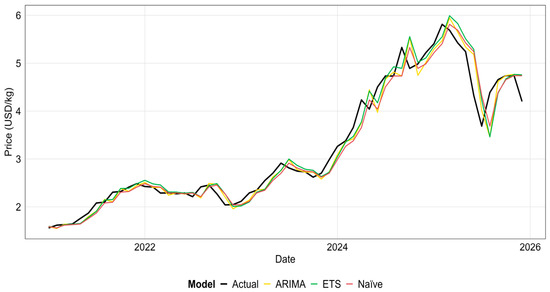
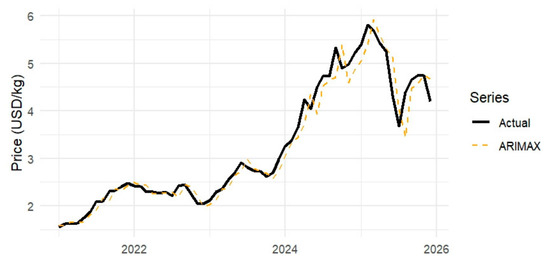
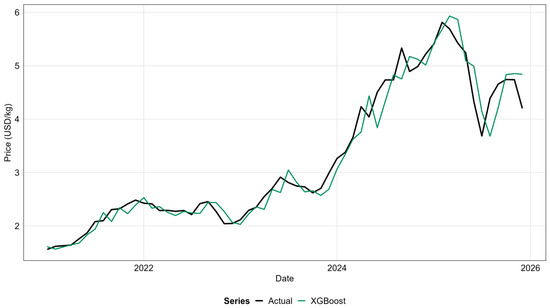
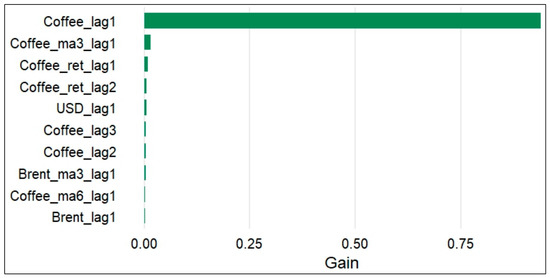
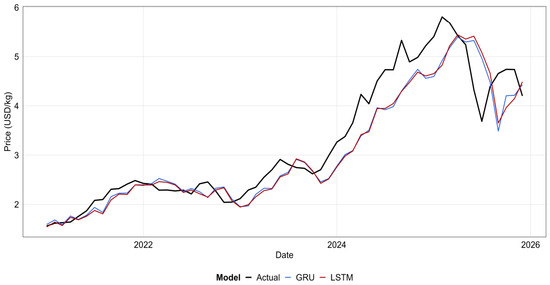
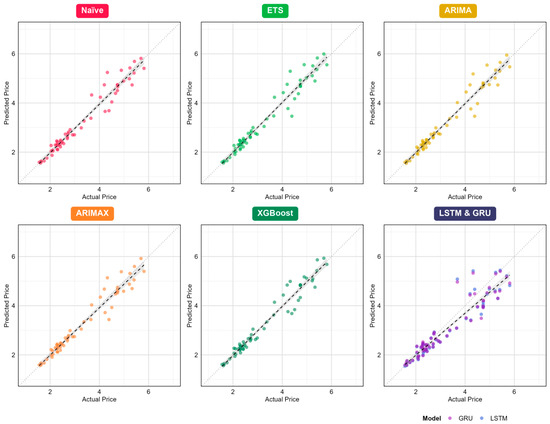
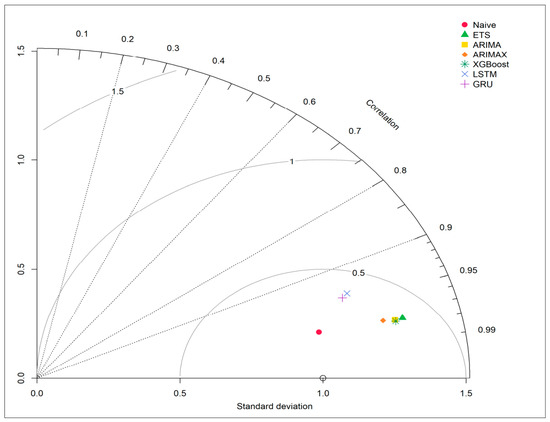
This study develops a rigorous, leakage-free forecasting framework for monthly Robusta coffee prices using historical observations from January 1975 to December 2025. A comprehensive set of explanatory variables is constructed from lagged coffee prices, moving averages, logarithmic returns, rolling volatility, and exogenous variables such as the Oceanic Niño Index (ONI), the U.S. Dollar Index, and Brent crude oil prices. To ensure methodological fairness, all predictors are generated exclusively from information available at the forecast origin, and all competing models are evaluated under a unified expanding-window walk-forward validation framework. Seven forecasting models are compared: Naïve, Exponential Smoothing (ETS), ARIMA, ARIMAX, Extreme Gradient Boosting (XGBoost), Long Short-Term Memory (LSTM), and Gated Recurrent Unit (GRU). Forecasting performance is evaluated using R2, RMSE, MAE, and MAPE, while Taylor diagrams and the Diebold–Mariano test are employed to assess model agreement and differences in predictive accuracy. The results show that XGBoost achieves the highest forecasting accuracy (R2 = 0.956, RMSE = 0.264), followed closely by the Naïve (R2 = 0.954, RMSE = 0.271) and ARIMA (R2 = 0.954, RMSE = 0.270) benchmarks, whereas ARIMAX and ETS provide comparable performance and the deep learning models (LSTM and GRU) produce substantially larger prediction errors. Feature importance analysis further indicates that the first lag of coffee price is the dominant predictor, accounting for approximately 94% of the predictive gain in XGBoost. Overall, the findings demonstrate that rigorous leakage-free validation is essential for reliable forecasting research and that, for monthly Robusta coffee prices, increased model complexity does not necessarily yield superior predictive performance.
Full article

Figure 1
Open AccessReview
Air-Quality Forecasting Across Monitoring, Predictor, and Validation Regimes: A Systematic Mapping Review and Decision Framework
by
Elena Chianese and Angelo Riccio
Forecasting 2026, 8(4), 72; https://doi.org/10.3390/forecast8040072 - 12 Aug 2026
Abstract
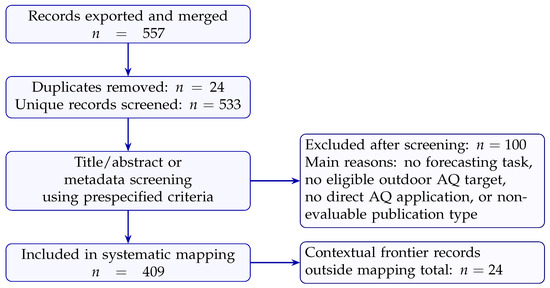
Air-quality forecasting models are often compared by architecture, although reported skill also depends on the pollutant, monitoring density, forecast horizon, predictor latency, validation design, and deployment objective. We conducted a systematic mapping review of 533 unique records published between 2000 and 15 June
[...] Read more.
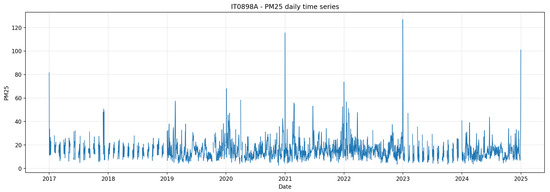
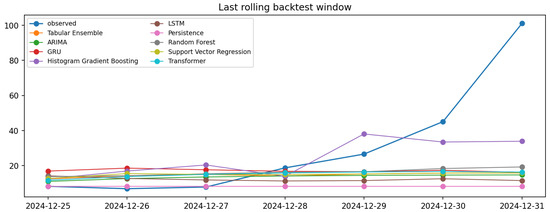
Air-quality forecasting models are often compared by architecture, although reported skill also depends on the pollutant, monitoring density, forecast horizon, predictor latency, validation design, and deployment objective. We conducted a systematic mapping review of 533 unique records published between 2000 and 15 June 2026; 409 met the forecasting eligibility criteria. The evidence was analysed in two layers: a metadata-derived map of the full corpus and a targeted full-text synthesis of representative studies. The non-exclusive metadata categories show that general machine learning or benchmark studies were most common ( ), followed by recurrent deep learning ( ), hybrid or decomposition methods ( ), Transformer or attention models ( ), tree ensembles ( ), CNN/ConvLSTM models ( ), classical statistical methods ( ), graph neural networks ( ), and physics-informed or CTM-coupled methods ( ). These counts describe topical prevalence, not comparative effectiveness. The main contribution is a decision framework that links the forecasting setting to a defensible starting model, the evidence available for that model family, and the minimum validation needed to support temporal, spatial, or external generalisation. The synthesis favours transparent statistical and tabular baselines for short or sparse single-station records; spatial deep models only when network geometry and leave-site-out testing support them; and CTM-coupled postprocessing when operational physical fields are available at issue time. Diffusion and foundation models remain promising but unevenly validated for pollutant forecasting. A leakage-safe daily PM2.5 case study in Naples illustrates the practical consequence: model rankings change with the metric, and every fitted model underestimates the highest 5% of concentrations.
Full article
(This article belongs to the Section Environmental Forecasting)
►▼
Show Figures

Figure 1
Open AccessArticle
Simulator-Grounded Benchmarking and a Corpus-Distilled Physics-Informed Forecaster for Fire Hazard-State and Damage Forecasting
by
Dohun Kim, Seonghee Lee and In-Hwan Lee
Forecasting 2026, 8(4), 71; https://doi.org/10.3390/forecast8040071 - 11 Aug 2026
Abstract
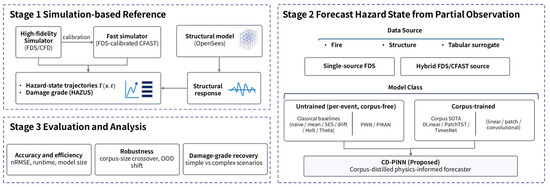
Forecasting research repeatedly finds that simple methods can match or beat complex ones out of sample. We test this in a safety-critical domain, near-real-time prediction of fire hazard state and structural damage, using a simulator-grounded benchmark: high-fidelity computational fluid dynamics (Fire Dynamics Simulator,
[...] Read more.
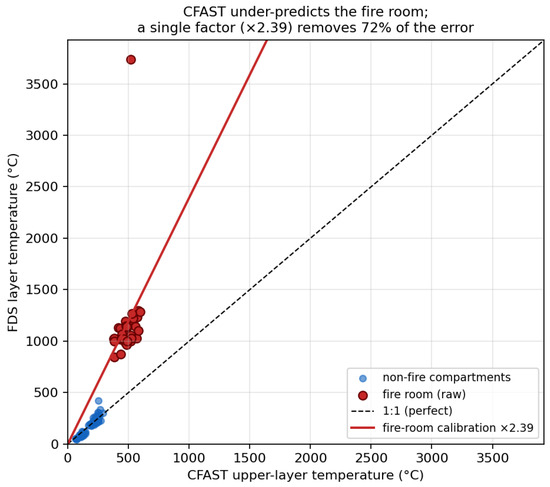
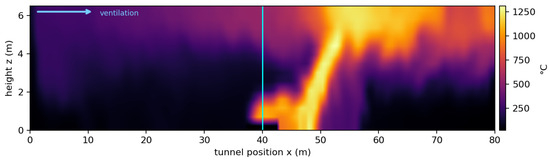
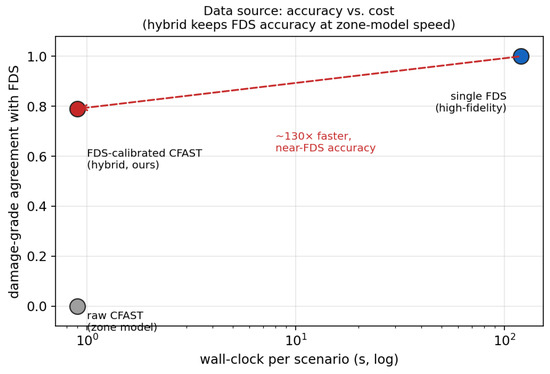
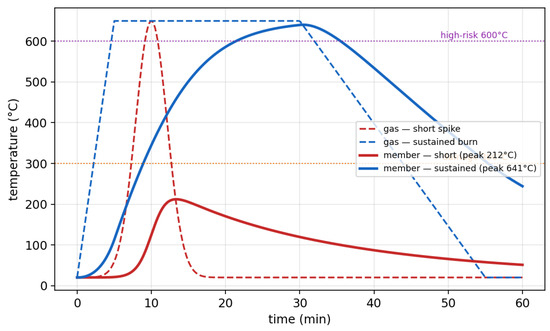
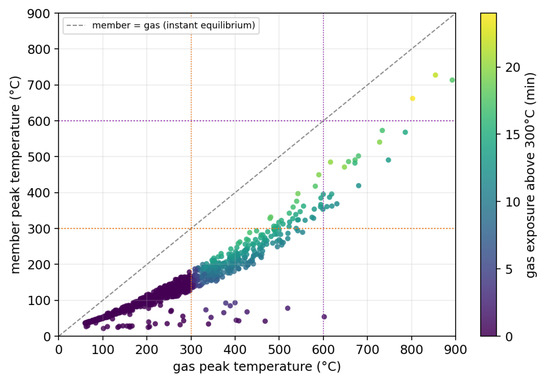
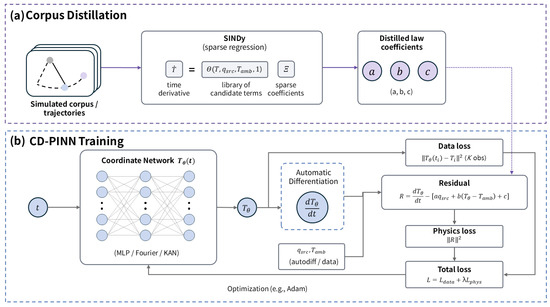
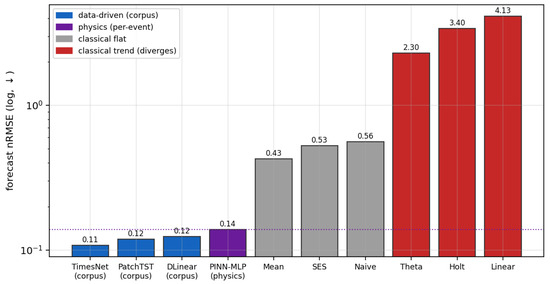
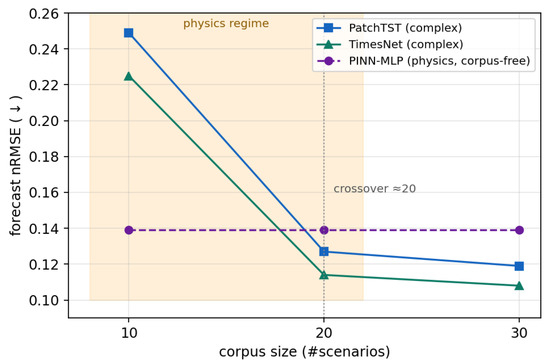
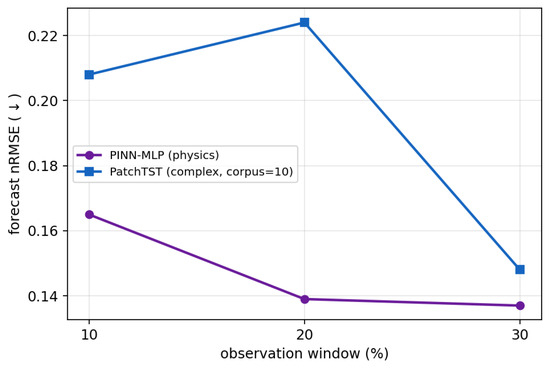
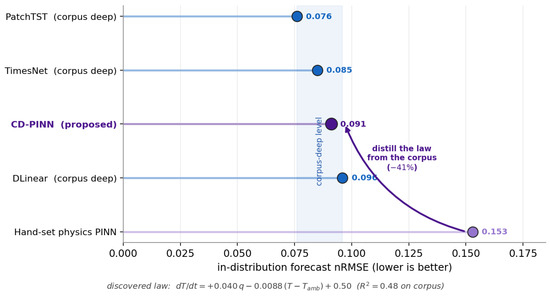
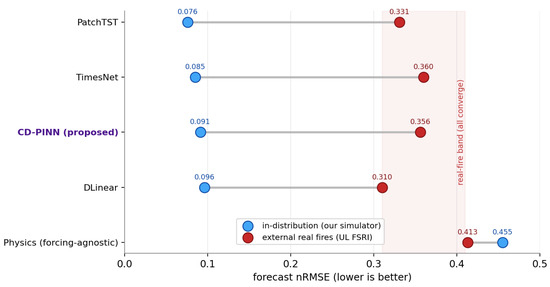
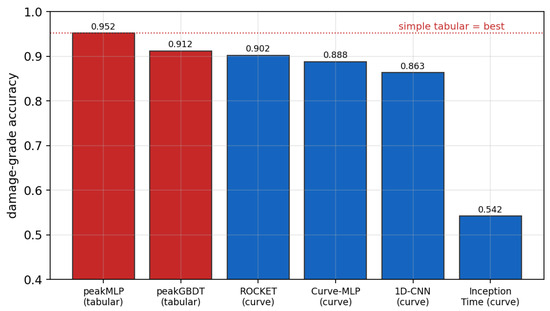
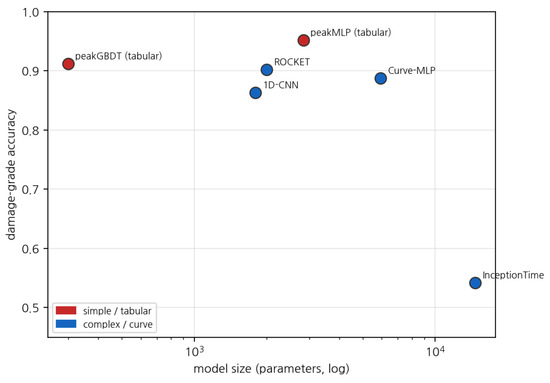
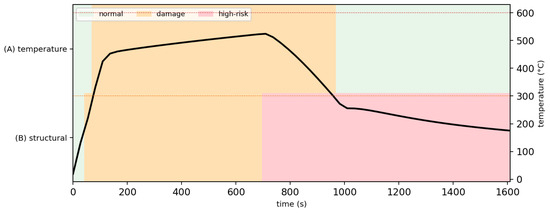
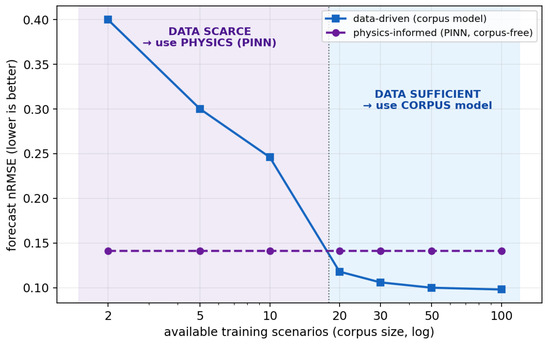
Forecasting research repeatedly finds that simple methods can match or beat complex ones out of sample. We test this in a safety-critical domain, near-real-time prediction of fire hazard state and structural damage, using a simulator-grounded benchmark: high-fidelity computational fluid dynamics (Fire Dynamics Simulator, FDS) provides reference data, an FDS-calibrated zone model (CFAST) generates a large corpus cheaply, and the temperature trajectories drive a finite-element model (OpenSees) and a HAZUS/Eurocode-informed damage rule. Under one protocol we compare simple, deep (PatchTST, TimesNet), and physics-informed (PINN, PIKAN) forecasters. Complex models do not dominate: a small corpus lets parsimonious models approach best accuracy, and physics helps mainly when data are scarce (crossover near twenty scenarios). We propose CD-PINN, which identifies a data-optimal reduced-order physics residual from the corpus by physics-guided regression over a candidate library and uses it as the physics constraint. This lifts a per-event physics model to the accuracy of corpus-trained forecasters while staying interpretable. On 26 laboratory-fire experiments, however, in-distribution rankings do not transfer: the large accuracy spread collapses to near-parity, so a leaderboard poorly predicts laboratory-fire accuracy. For downstream damage, we further show that the label definition, not the model class, sets the achievable ceiling.
Full article
(This article belongs to the Special Issue Benchmark Models in Time Series Forecasting)
►▼
Show Figures

Figure 1
Open AccessArticle
A Reproducible Workflow for AIS-Based ETA Forecasting: Evaluating the Influence of Data Preprocessing and Machine Learning Model Selection
by
João Marreiros, Ana de Jesus Mendes, Marcela Castro, Maria da Graça Costa and Tiago Pinho
Forecasting 2026, 8(4), 70; https://doi.org/10.3390/forecast8040070 - 11 Aug 2026
Abstract
►▼
Show Figures
Accurate Estimated Time of Arrival (ETA) forecasting is essential for improving operational planning and decision-making in modern ports. While machine learning has significantly enhanced ETA prediction using Automatic Identification System data, the impact of data preprocessing on forecasting performance remains underexplored. This study
[...] Read more.
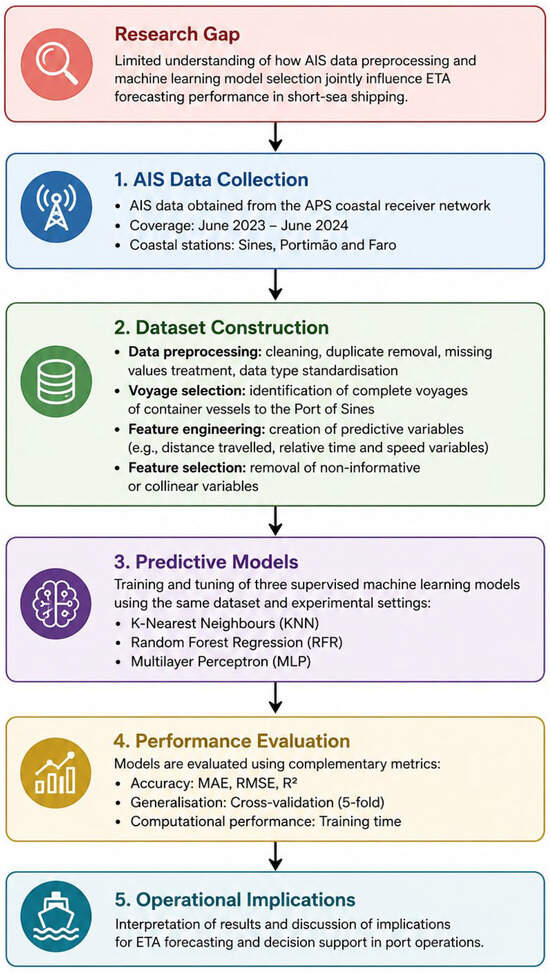
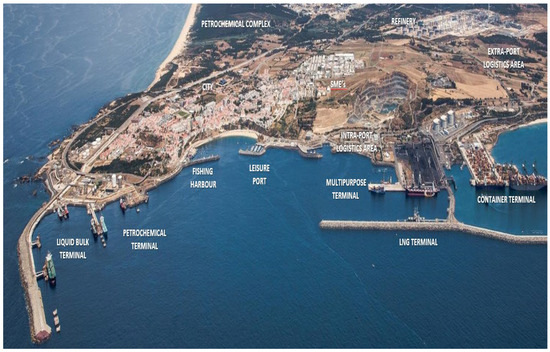
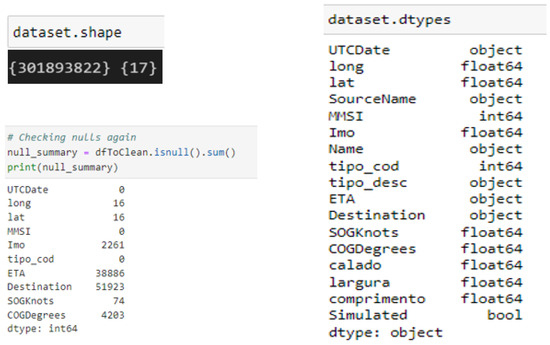
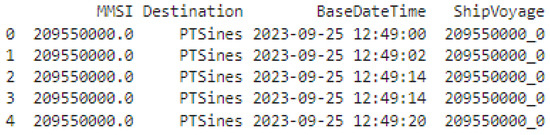
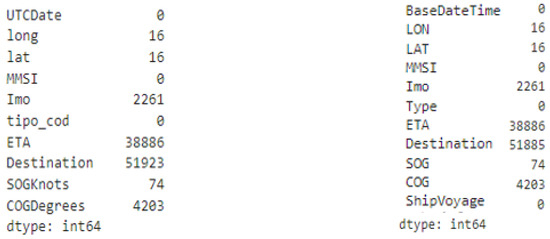
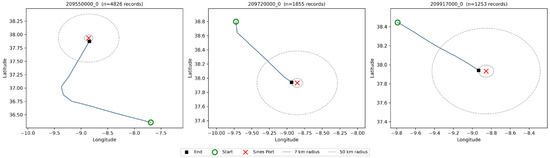
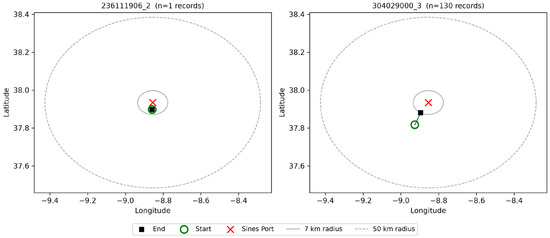
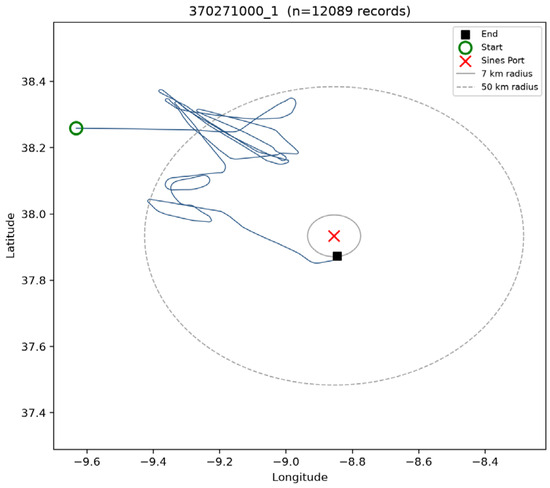
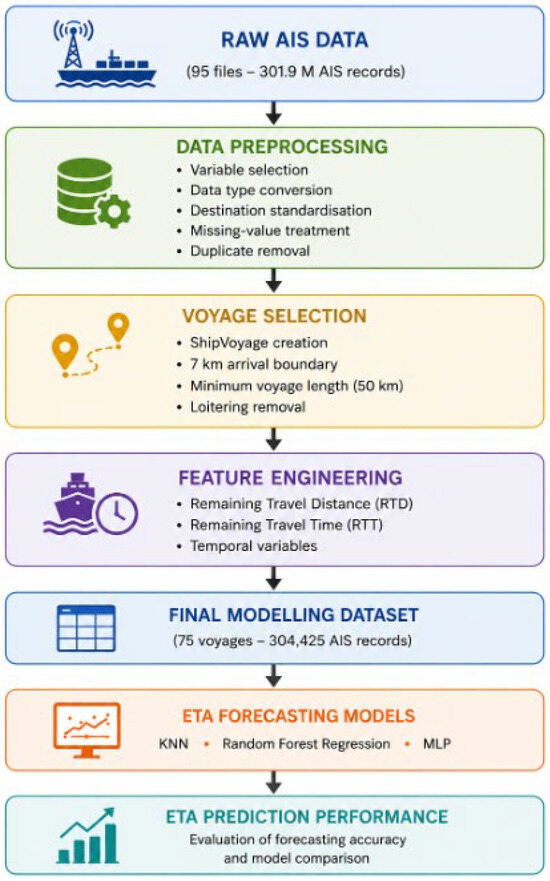
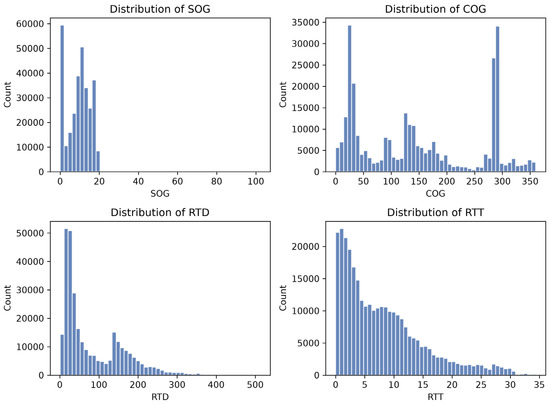
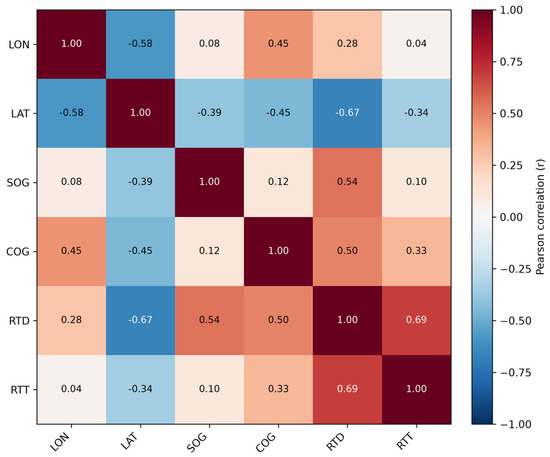
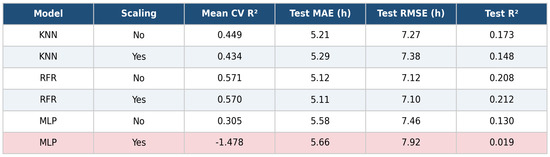
Accurate Estimated Time of Arrival (ETA) forecasting is essential for improving operational planning and decision-making in modern ports. While machine learning has significantly enhanced ETA prediction using Automatic Identification System data, the impact of data preprocessing on forecasting performance remains underexplored. This study investigates how AIS data preprocessing and machine learning model selection jointly affect ETA forecasting for short-sea shipping, using the Port of Sines as an empirical case study. A reproducible forecasting workflow was developed, integrating dataset construction, voyage selection, feature engineering, predictive modelling and performance evaluation. Three supervised machine learning algorithms, K-Nearest Neighbors, Random Forest Regression, and Multilayer Perceptron, were trained and compared under identical experimental conditions. The results show that forecasting performance depends not only on model selection but also on the quality of the modelling dataset. In particular, Random Forest Regression achieved the strongest and most consistent performance. It was found to be invariant to feature scaling, whereas scaling had a small negative effect on K-Nearest Neighbors and increased training variance for the Multilayer Perceptron. Although all three models achieved accurate ETA predictions, they exhibited different strengths regarding predictive performance, computational efficiency, and operational applicability. The proposed workflow contributes to the development of transparent and reproducible ETA forecasting methodologies and provides practical guidance for implementing AIS-based decision-support systems in short-sea port operations.
Full article

Figure 1
Open AccessArticle
Terrain Controls on the Portability of Rainfall Prediction Models: A Framework for Transferability and Adaptability Across Tropical and Temperate Climates
by
Ogochukwu Ejike, David Ndzi and Muhammad Shakir
Forecasting 2026, 8(4), 69; https://doi.org/10.3390/forecast8040069 - 8 Aug 2026
Abstract
►▼
Show Figures
Rainfall prediction models often lose skill when transferred across regions, particularly in data-sparse settings where local recalibration is not feasible. This study investigates whether topographically analogous landscapes exhibit consistent patterns of model portability in next-day rainfall occurrence prediction across contrasting climates. Random Forest
[...] Read more.
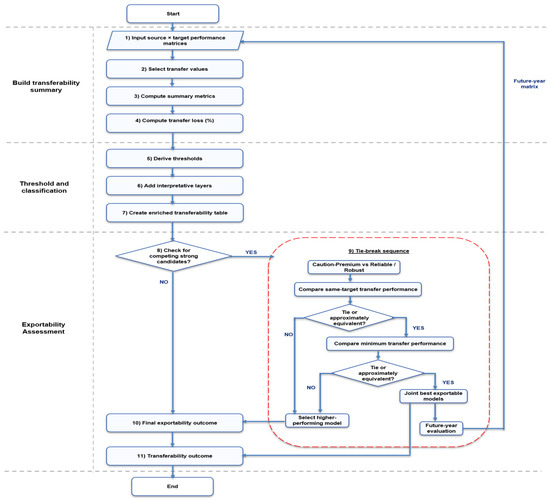
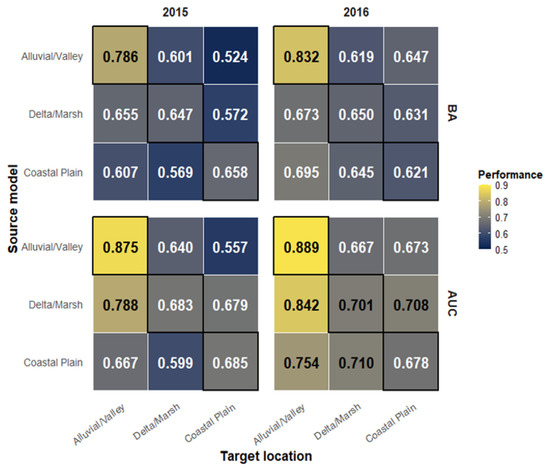
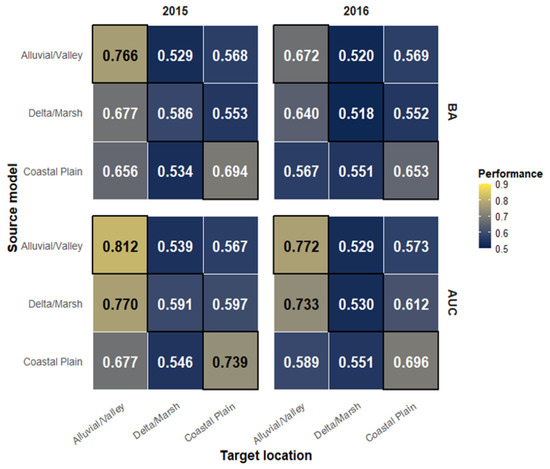
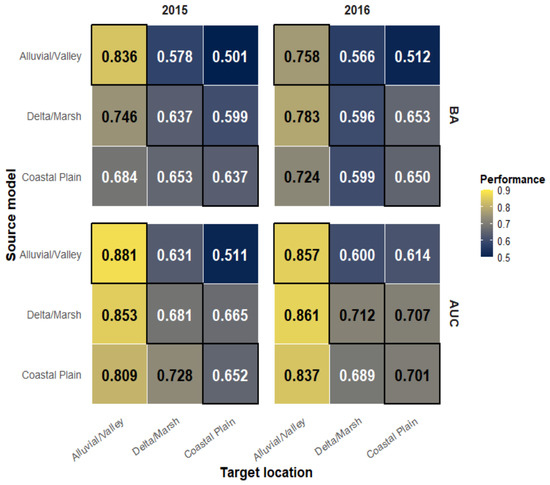
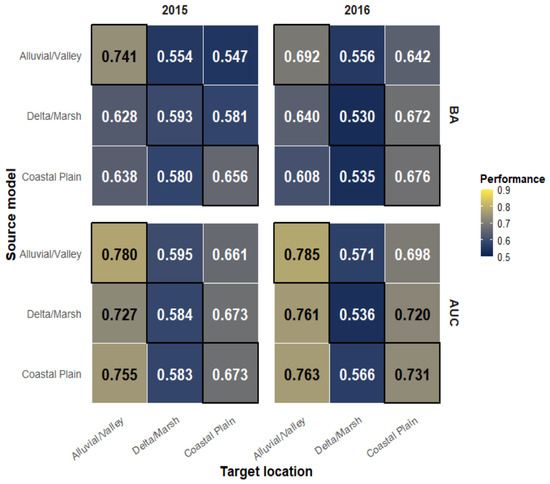
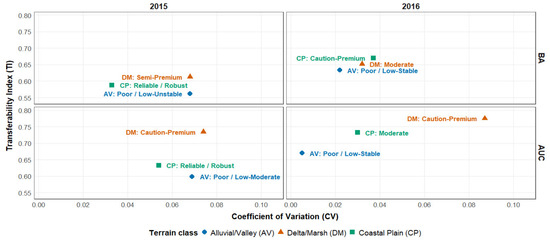
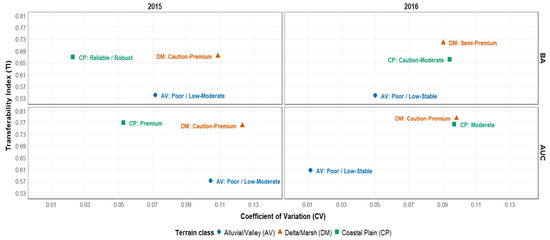
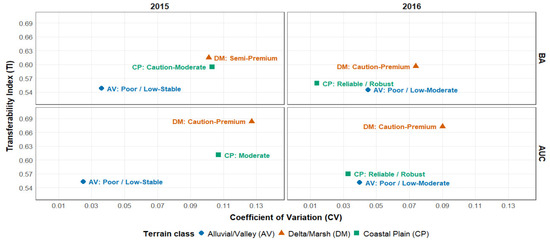
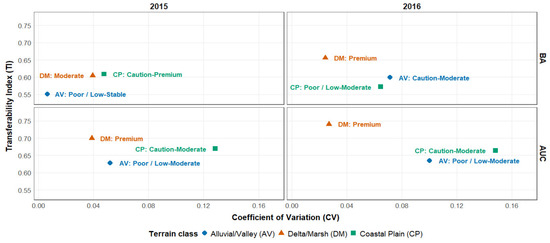
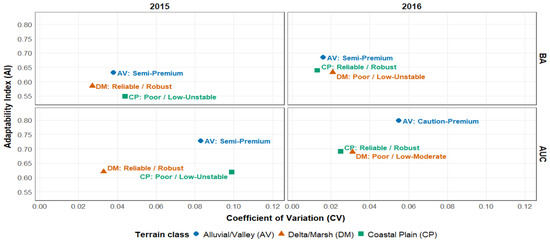
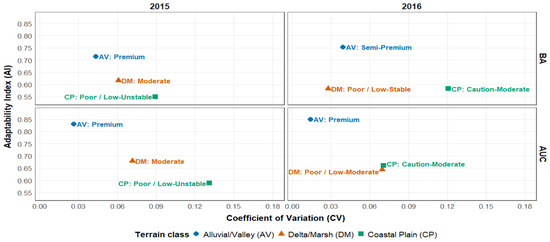
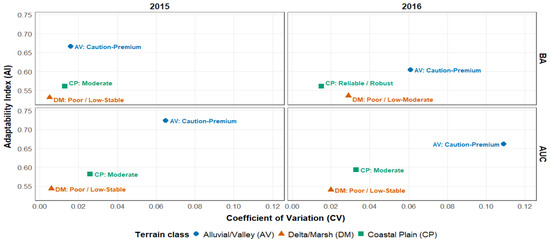
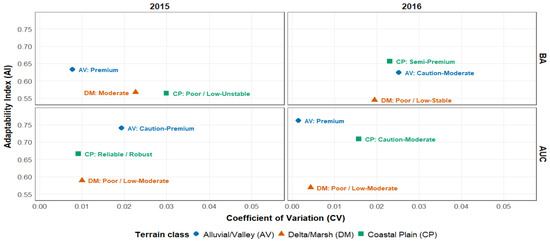
Rainfall prediction models often lose skill when transferred across regions, particularly in data-sparse settings where local recalibration is not feasible. This study investigates whether topographically analogous landscapes exhibit consistent patterns of model portability in next-day rainfall occurrence prediction across contrasting climates. Random Forest and Logistic Regression classifiers trained on multi-year daily atmospheric data were evaluated across three hydrogeomorphic classes, Alluvial/Valley, Delta/Marsh, and Coastal Plain, using paired temperate sites in the United States and tropical sites in Malaysia. Portability was quantified using Transferability, representing a model’s ability to export predictive skill, and Adaptability, representing a site’s receptivity to externally trained models. Performance, sensitivity, and stability metrics were synthesized within a Behaviour Grid to support systematic interpretation. Results reveal a robust terrain-driven hierarchy: Delta/Marsh models are the strongest exporters, Alluvial/Valley sites the most adaptable receivers, and Coastal Plain sites are stable generalists. This general hierarchy is preserved across climates and years when evaluated using Area Under the Receiver Operating Characteristics Curve, indicating strong terrain structuring of portability, although fixed-threshold performance metrics show sensitivity to temporal variability. These findings indicate that terrain class provides a useful basis for evaluating cross-regional model transfer, supporting more informed regionalisation and deployment decisions across heterogeneous environmental settings.
Full article

Figure 1
Open AccessArticle
Distinguishing Contemporaneous Rule Recovery from Financial Risk Forecasting in Higher Education Institutions: A Controlled Synthetic-Panel Experiment
by
Yu Chao, Nur Fazidah Elias, Yazrina Yahya, Ruzzakiah Jenal and Mo Fan
Forecasting 2026, 8(4), 68; https://doi.org/10.3390/forecast8040068 - 7 Aug 2026
Abstract
►▼
Show Figures
High classification performance in financial-risk early-warning research may reflect recovery of a constructed contemporaneous rating rule rather than prediction of an independent future outcome. This study distinguishes these two forms of evidence through a controlled synthetic-panel experiment situated in the context of higher
[...] Read more.
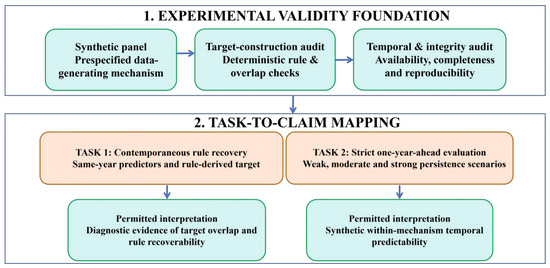
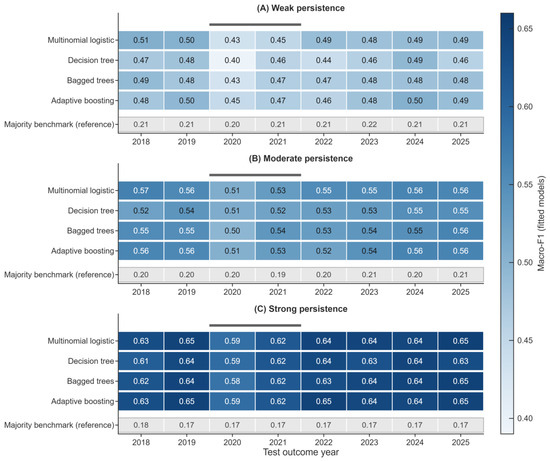
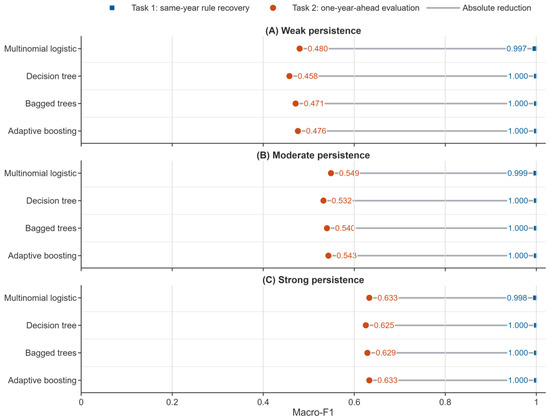
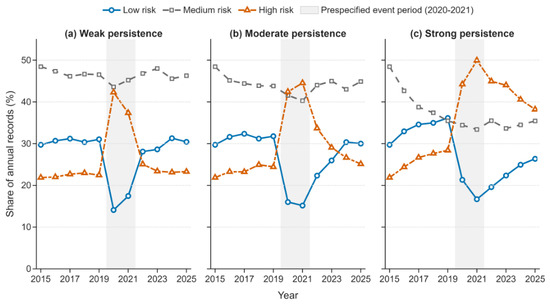
High classification performance in financial-risk early-warning research may reflect recovery of a constructed contemporaneous rating rule rather than prediction of an independent future outcome. This study distinguishes these two forms of evidence through a controlled synthetic-panel experiment situated in the context of higher education institutions (HEIs). Task 1 is a contemporaneous positive-control audit in which the four components defining a deterministic three-class rating are supplied to the classifiers. Task 2 uses predictors measured at year to classify the rating at year t through strict rolling-origin evaluation under prespecified Weak, Moderate, and Strong temporal-persistence conditions. In Task 1, the four fitted classifiers achieved held-out Macro-F1 values of 0.9968–1.0000, demonstrating near-complete recovery of the disclosed rating rule but providing no prospective forecasting evidence. In Task 2, the best mean annual Macro-F1/Macro-AUC increased from 0.480/0.696 under Weak persistence to 0.549/0.747 under Moderate persistence and 0.633/0.824 under Strong persistence. The Weak–Moderate–Strong ordering was observed for both primary metrics across all four fitted classifiers, while higher model complexity provided no consistent advantage within the disclosed synthetic mechanism. These findings confirm contemporaneous rule recoverability and sensitivity to deliberately embedded temporal persistence only within the controlled experiment. They do not establish predictive validity, transportability, or decision benefit in real HEIs. The study contributes a reproducible task-to-claim approach that aligns target construction, predictor–target overlap, information timing, rolling-origin evaluation, probability quality, and model performance with the inferences that the resulting evidence can legitimately support. Real-world validation would require source-indexed longitudinal HEI data, independently adjudicated post-origin outcomes, verified information-availability dates, external testing, and prospective decision evaluation.
Full article

Figure 1
Open AccessArticle
VMD-Enhanced Multi-Model Ensemble Framework for Tourism Demand Forecasting: A Feature Engineering Approach
by
Cuicui Yu, Wangyu Shen, Erlong Zhao, Shouyang Wang and Pei Du
Forecasting 2026, 8(4), 67; https://doi.org/10.3390/forecast8040067 - 5 Aug 2026
Abstract
►▼
Show Figures
This paper proposes a novel variational mode decomposition (VMD)-enhanced ensemble framework for tourism demand forecasting, which achieves competitive predictive performance. The core innovation is a structured hybrid methodology that first employs VMD to decompose complex temporal signals, from which multiple interpretable features—encoding trend,
[...] Read more.
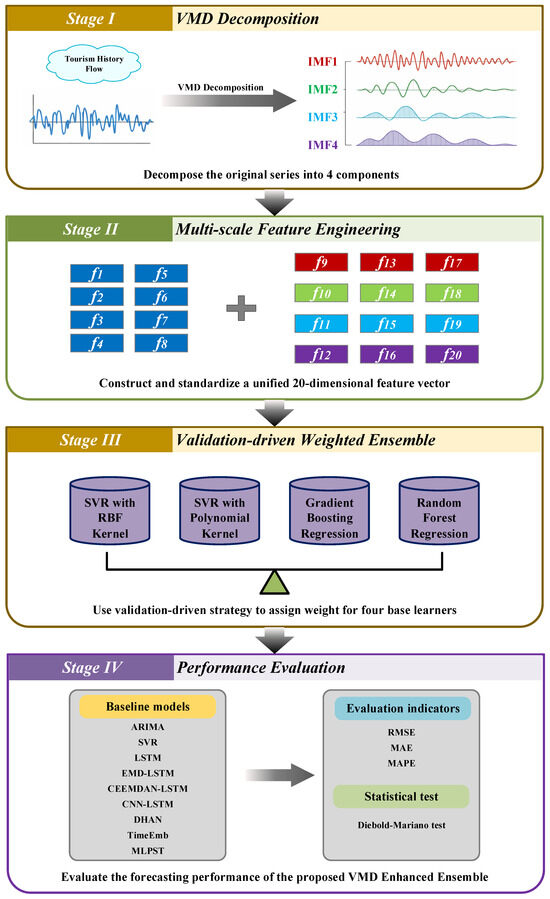
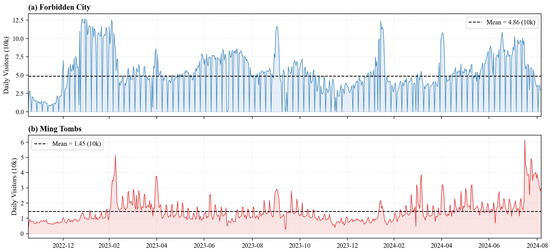
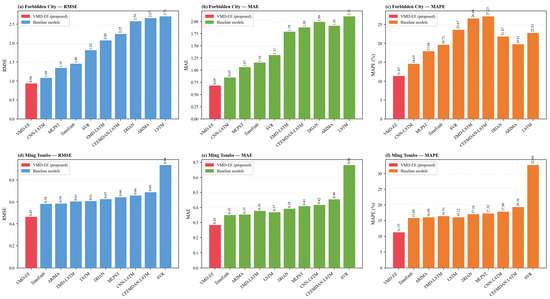
This paper proposes a novel variational mode decomposition (VMD)-enhanced ensemble framework for tourism demand forecasting, which achieves competitive predictive performance. The core innovation is a structured hybrid methodology that first employs VMD to decompose complex temporal signals, from which multiple interpretable features—encoding trend, volatility, and momentum characteristics—are extracted. These enriched features are then processed by an intelligently weighted ensemble of three diverse models: support vector regression (SVR), gradient boosting regression (GBR), and random forest (RF). An adaptive weighting mechanism dynamically optimizes the contribution of each base model, enhancing robustness and accuracy. Comprehensive experiments demonstrate the framework’s superior effectiveness. Compared to strong contemporary benchmarks such as CNN-LSTM, our approach achieves significant error reduction: an RMSE of 0.837 (16.29% improvement), an MAE of 0.584 (12.19% improvement), and a MAPE of 15.42% (13.38% improvement). These results validate that the integration of VMD-based feature engineering with an adaptive multi-model ensemble effectively captures complex temporal dynamics and mitigates individual model limitations.
Full article

Figure 1
Open AccessArticle
Accelerating Probabilistic Forecasting: A GPU-Based Approach to Reducing Computational Time
by
Juan R. Trapero, Enrique Holgado de Frutos and Francisco Ramos
Forecasting 2026, 8(4), 66; https://doi.org/10.3390/forecast8040066 - 5 Aug 2026
Abstract
High-performance computing based on general-purpose graphical processing units (GPUs) is a powerful tool for reducing computational time. In a context where big data is becoming increasingly relevant, GPUs may play a crucial role. This study analyzes the performance of GPUs by implementing probabilistic
[...] Read more.
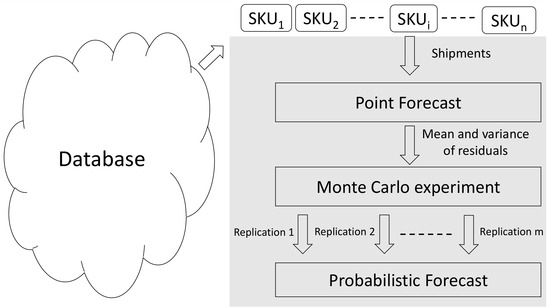
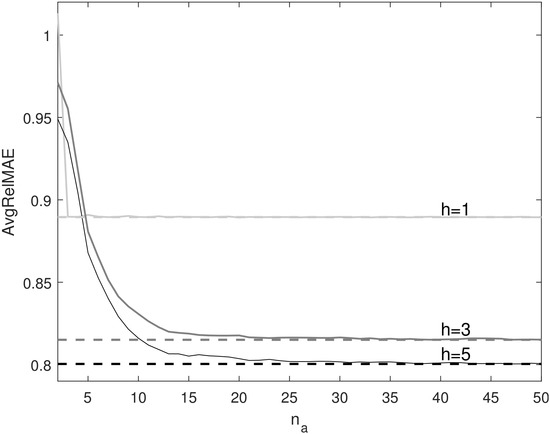
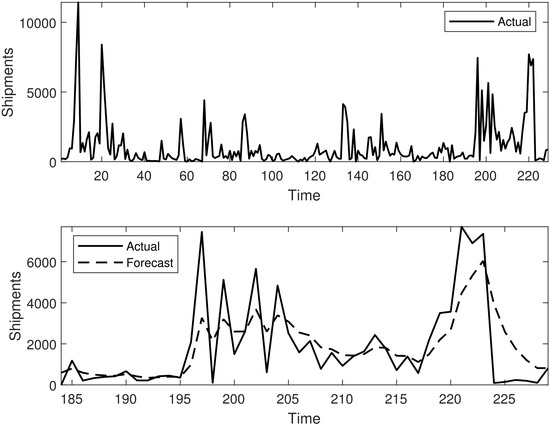
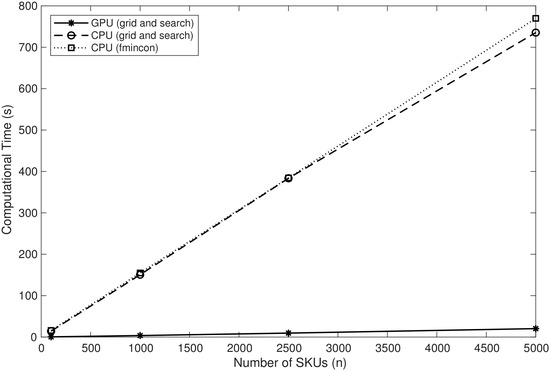
High-performance computing based on general-purpose graphical processing units (GPUs) is a powerful tool for reducing computational time. In a context where big data is becoming increasingly relevant, GPUs may play a crucial role. This study analyzes the performance of GPUs by implementing probabilistic forecasts based on single exponential smoothing combined with simulated predictive distributions. In supply chain environments, companies must generate a large number of forecasts at the SKU level. Therefore, reducing computational time can provide a significant competitive advantage. Since forecasts are typically computed independently for each SKU, the problem is naturally parallelizable, making it well-suited for GPU computing. To the best of the authors’ knowledge, this is the first study to apply GPU computing to demand forecasting in a supply chain context. First, we show how to adapt typical probabilistic forecasting algorithms to a parallel computing framework. Then, real data from a manufacturing company are used to compare GPU and traditional CPU implementations.Theresults indicate that GPUs can deliver computational speedups ranging from 28 to 42 times relative to CPU-based implementations.
Full article
(This article belongs to the Section Forecasting in Economics and Management)
►▼
Show Figures

Figure 1
Open AccessArticle
Do Solana Exchange Flows Matter? Hypothesis-Driven Evidence from Short-Term SOL Direction Forecasting
by
Yan Egorov, Dmitry Grigoriev, Daniil Zharikov and Anastasia Grigorieva
Forecasting 2026, 8(4), 65; https://doi.org/10.3390/forecast8040065 - 30 Jul 2026
Abstract
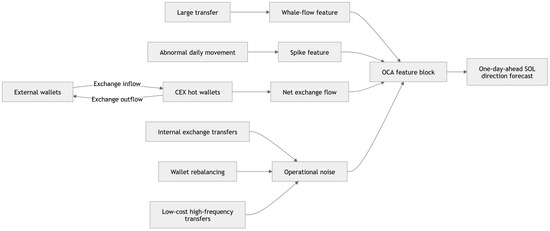
This study examines whether centralized-exchange flows improve one-day-ahead forecasts of SOL return direction. Daily on-chain analysis (OCA) predictors are constructed from more than 41 million transfers above 1 SOL involving 101 labeled centralized-exchange hot wallets. Seven feature sets are evaluated using CatBoost, XGBoost,
[...] Read more.
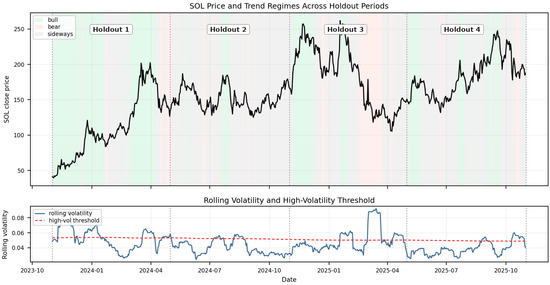
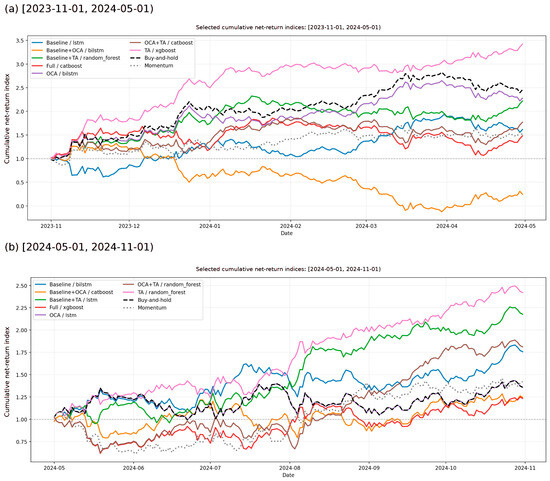
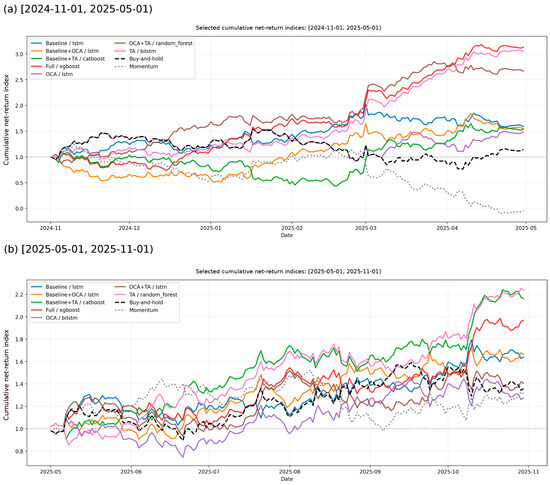
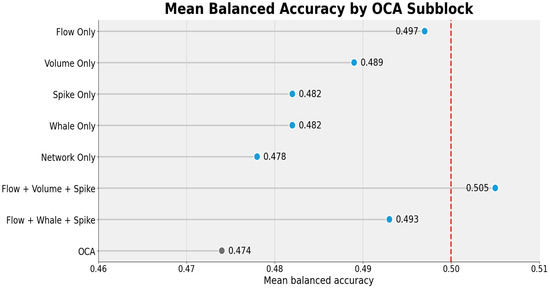
This study examines whether centralized-exchange flows improve one-day-ahead forecasts of SOL return direction. Daily on-chain analysis (OCA) predictors are constructed from more than 41 million transfers above 1 SOL involving 101 labeled centralized-exchange hot wallets. Seven feature sets are evaluated using CatBoost, XGBoost, Random Forest, LSTM, and BiLSTM across four expanding-origin holdouts, with Elastic Net Logistic Regression as a linear benchmark. Technical analysis (TA) achieves the strongest average classification and transaction-cost-adjusted trading performance. OCA performs weakly alone and provides no stable average improvement when added to Baseline or TA. Selected flow- and volume-related subblocks outperform unrestricted OCA on individual descriptive metrics, but none achieves positive average trading performance. Observable Solana exchange flows therefore provide no robust standalone or incremental forecasting advantage beyond conventional predictors.
Full article
(This article belongs to the Section Forecasting in Economics and Management)
►▼
Show Figures

Figure 1
Open AccessArticle
Modelling the RES Balanced Integration in Forecasting the Power System’s Long-Term Development
by
Tetiana Nechaieva, Volodymyr Derii, Artur Zaporozhets and Viktor Denysov
Forecasting 2026, 8(4), 64; https://doi.org/10.3390/forecast8040064 - 27 Jul 2026
Abstract
►▼
Show Figures
The growing integration of variable renewable energy sources (VRES) challenges power system flexibility and may cause curtailment due to excess capacity, grid constraints, or operational and market factors. Power-to-Heat (PtH) technology can mitigate these issues by coupling electricity and district heating sectors, providing
[...] Read more.
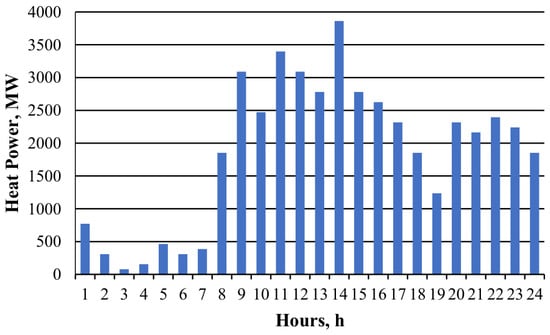
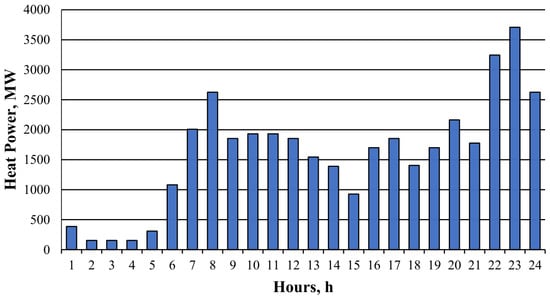
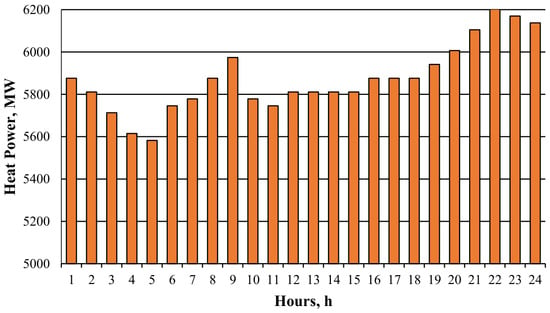
The growing integration of variable renewable energy sources (VRES) challenges power system flexibility and may cause curtailment due to excess capacity, grid constraints, or operational and market factors. Power-to-Heat (PtH) technology can mitigate these issues by coupling electricity and district heating sectors, providing additional flexibility and supporting decarbonisation. This study develops a long-term generation capacity expansion model that integrates PtH and district heating system (DHS) operation to achieve balanced VRES penetration. The model includes DHS heat demand balances and links electricity and heat via thermal power plants, combined heat and power (CHP) plants, and PtH units. The methodology is applied to Ukraine’s Integrated Power System and district heating demand through 2040, employing typical daily load profiles discretised into six four-hour segments. Results demonstrate the feasibility of deploying PtH electric boilers during the non-heating season, when high RES and base load nuclear generation create surplus electricity. These boilers convert excess wind and solar power into thermal energy for district heating, displacing natural gas-fired technologies and simultaneously decarbonising electricity and heat supply.
Full article

Figure 1
Open AccessReview
Machine Learning for Heatwave Prediction: A Global Scoping Review of Environmental Predictors and Modelling Practices
by
Adam Ashford, Fahad Ayaz, Muhammad Zeeshan Shakir, Naeem Ramzan, Michael Grebreslasie, Serestina Viriri, David Ndzi, Natalie Dickinson, Llinos Haf Spencer, Mary Lynch and Saloshni Naidoo
Forecasting 2026, 8(4), 63; https://doi.org/10.3390/forecast8040063 - 24 Jul 2026
Abstract
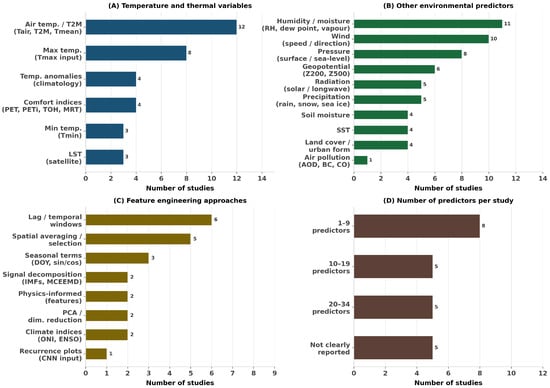
As extreme heat events increase in frequency, intensity, and duration due to climate change, forecasting these events has become vital for early warning systems, public health preparedness, and climate adaptation strategies, especially in parts of the world that are already subject to extreme
[...] Read more.
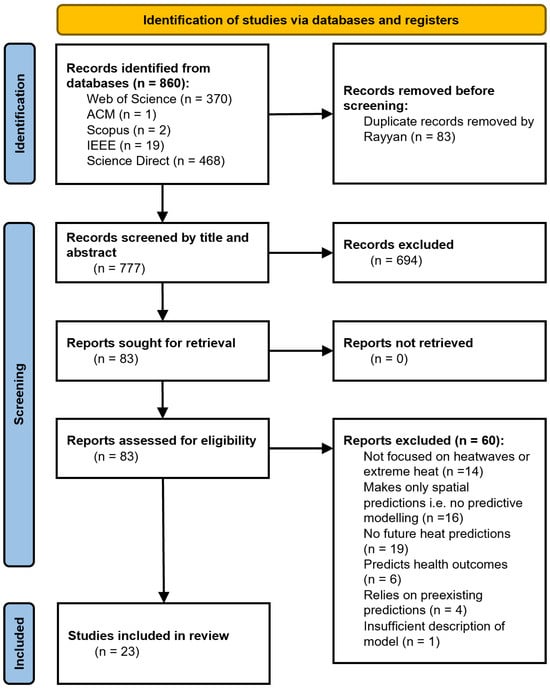
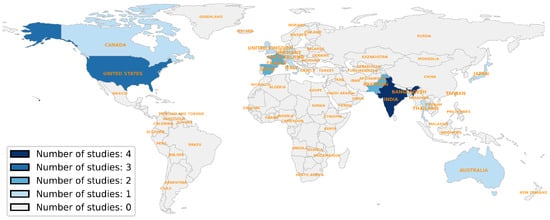
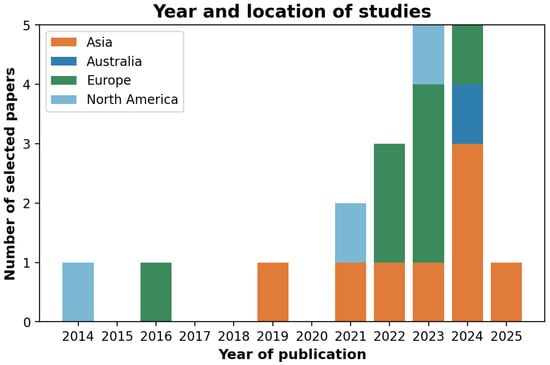
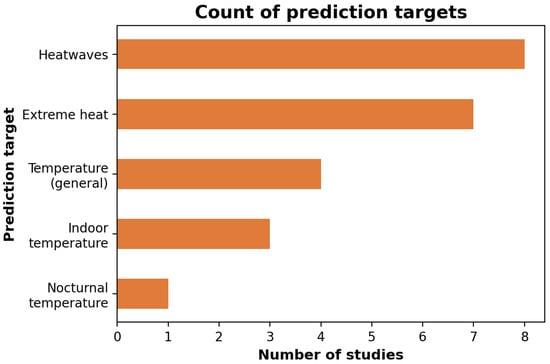
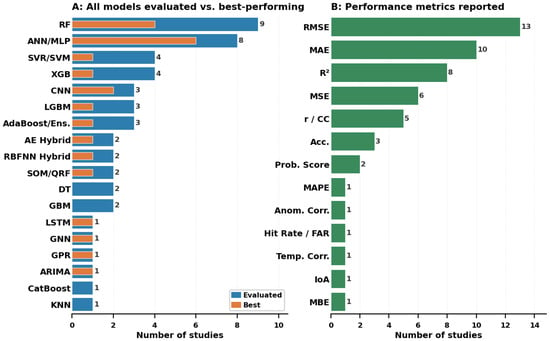
As extreme heat events increase in frequency, intensity, and duration due to climate change, forecasting these events has become vital for early warning systems, public health preparedness, and climate adaptation strategies, especially in parts of the world that are already subject to extreme heat, such as tropical regions. In recent years, machine learning (ML) has increasingly been applied to environmental and meteorological data to improve the prediction of heatwaves and extreme heat events. This scoping review examines global peer-reviewed literature on the application of ML techniques for extreme heat prediction using environmental variables. This includes heatwave prediction, environmental and meteorological predictors used in these models, and the geographical distribution of existing research. A total of 23 peer-reviewed studies meeting the inclusion criteria were included in the review, following the PRISMA-ScR guidelines. The findings indicate that artificial neural networks and random forest models were most frequently reported as high performing within individual studies. However, direct comparisons across studies are limited by heterogeneity in prediction targets, validation strategies, lead times, heatwave definitions, and performance metrics. Temperature-related variables, especially maximum temperature, were consistently identified as the most influential predictors across studies. Furthermore, the evidence base was heavily concentrated in Europe, Asia, and North America, with comparatively limited representation from low- and middle-income countries respective to population, despite these regions often experiencing disproportionate impacts of climate change and extreme heat exposure. By synthesising current evidence on ML-based heatwave prediction, associated environmental predictors, and geographical research trends, this review provides insights to support the development of more robust, context-aware, and globally representative heatwave forecasting frameworks.
Full article
(This article belongs to the Special Issue Forecasting Impacts of Air Pollution and Hydro-Meteorological Extremes: Models, Methods, and Applications)
►▼
Show Figures

Figure 1
Open AccessArticle
Assessing the Propagation of Weather Forecast Errors into Power Outage Predictions
by
Farzaneh Esmaeilian, Xinxuan Zhang, Fatemeh Azizpourshoubi, Marina Astitha and Emmanouil Anagnostou
Forecasting 2026, 8(4), 62; https://doi.org/10.3390/forecast8040062 - 23 Jul 2026
Abstract
►▼
Show Figures
Reliable power systems are essential to modern life, as severe storms continue to disrupt grid stability and cause widespread outages. Predicting storm outages enables utilities and emergency managers to pre-stage resources and improve resilience. However, the several days of forecast lead time typically
[...] Read more.
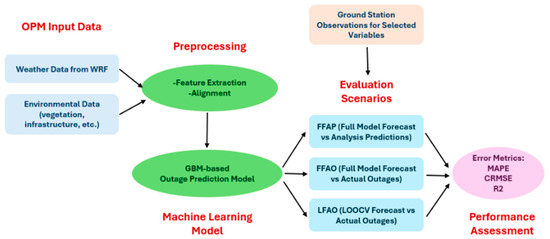
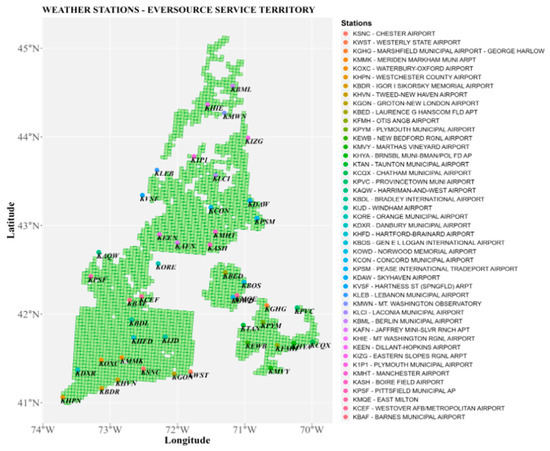
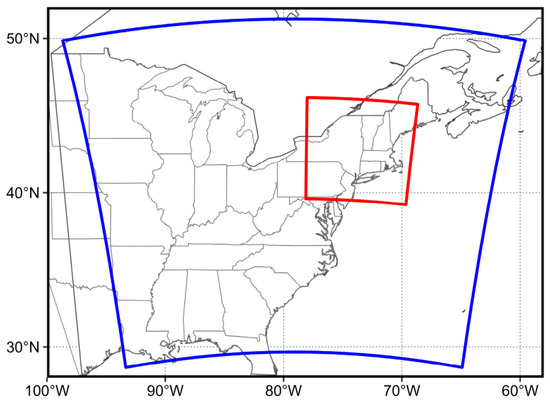
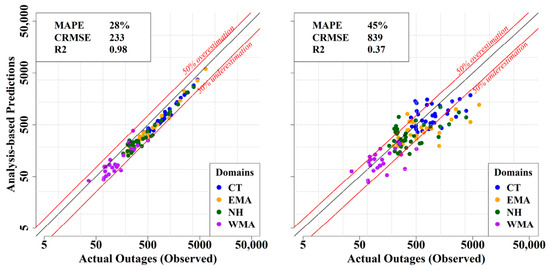
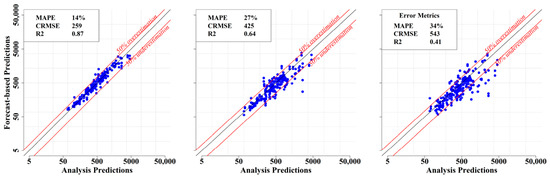
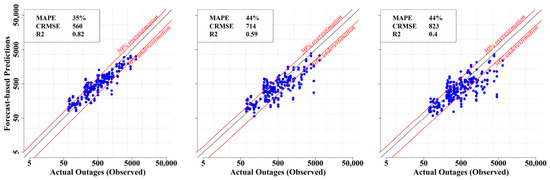
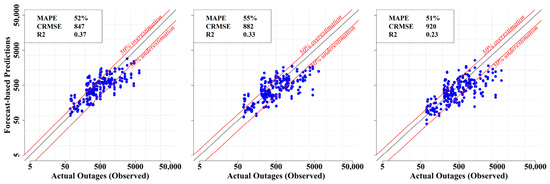
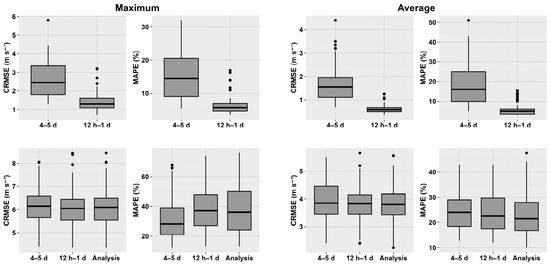
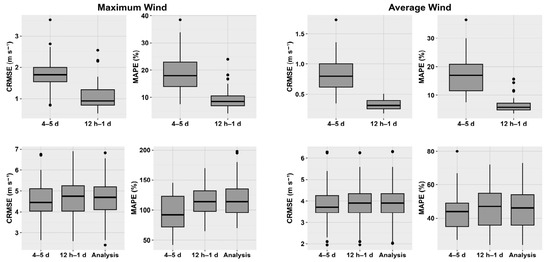
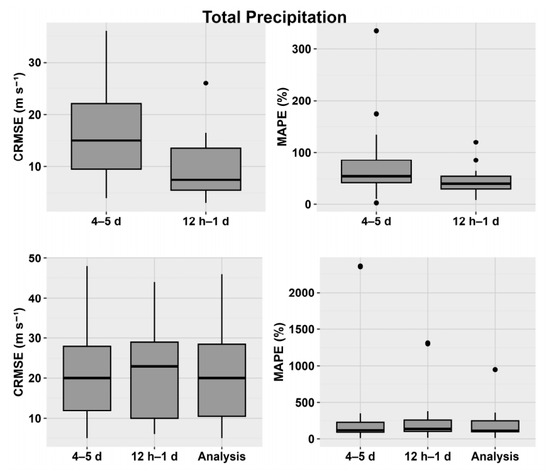
Reliable power systems are essential to modern life, as severe storms continue to disrupt grid stability and cause widespread outages. Predicting storm outages enables utilities and emergency managers to pre-stage resources and improve resilience. However, the several days of forecast lead time typically needed for preparedness significantly affect the accuracy of outage predictions. This study investigates the impact of forecast lead time on the error propagation of a Gradient Boosting Machine (GBM)-based outage prediction model (OPM) driven by Weather Research and Forecasting (WRF) model forecasts and analysis predictions. We evaluate three error-analysis scenarios: FFAP (forecast vs. analysis-based outage predictions), FFAO (forecast vs. actual outages), and LFAO (leave-one-storm-out forecast vs. actual outages). Model performance is compared using Mean Absolute Percentage Error (MAPE) and Centered Root-Mean-Square Error (CRMSE) across short (12 h–1 d), medium (2–3 d), and long (4–5 d) forecast lead-time categories, with the long category representing the upper end of the medium-range forecast window relevant to operational preparedness. The results show that forecast lead time substantially affects outage prediction accuracy, but the magnitude depends on the evaluation setup. In the controlled FFAP scenario, CRMSE increased by approximately 110% as lead time increased, from 259 to 543 outages, isolating the effect of weather forecast degradation. In the more operational LFAO scenario, CRMSE was already high at short lead times, increasing from 847 to 920 outages, indicating that model generalization error dominates once storms are unseen. Across scenarios, LFAO errors were 51% higher than FFAO errors at short lead times, highlighting the importance of testing outage models under unseen-event conditions. These results quantify how forecast degradation and model generalization jointly shape the reliability of outage prediction and provide practical guidance for lead-time-aware storm preparedness.
Full article

Figure 1

Open AccessArticle
Week-Ahead Electricity Price Forecasting for Battery Arbitrage: Benchmarking ML/DL Models and Interpreting Feature Importance Through Merit-Order Pricing in Spain
by
Amgad Khamis, Francesco Crespi and David Sánchez
Forecasting 2026, 8(4), 61; https://doi.org/10.3390/forecast8040061 - 21 Jul 2026
Abstract
Accurate electricity price forecasting is essential for market participants seeking to optimise bidding and arbitrage strategies. This paper presents a week-ahead (168 h) hourly electricity price forecasting study for the Spanish day-ahead market. Nine competing models—two naïve baselines (a Seasonal Naïve and a
[...] Read more.
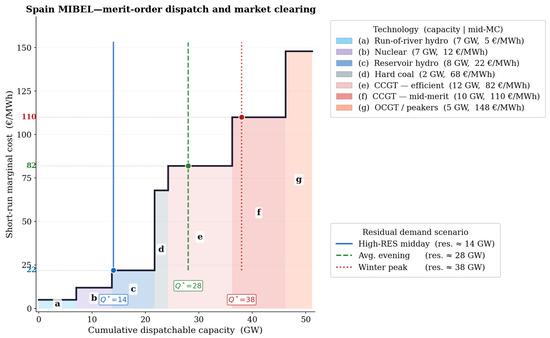
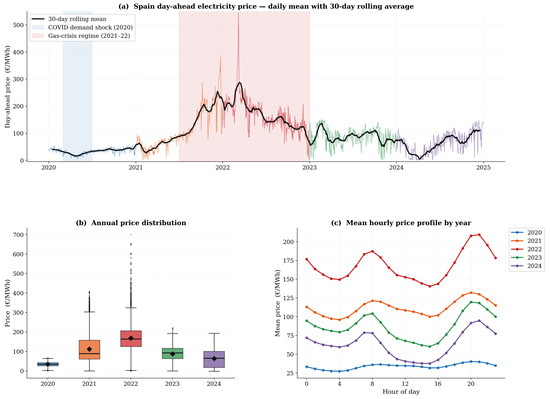
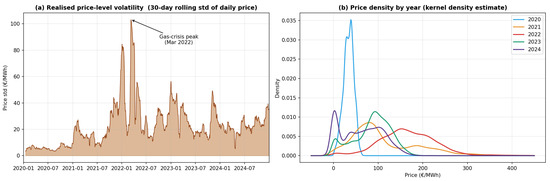
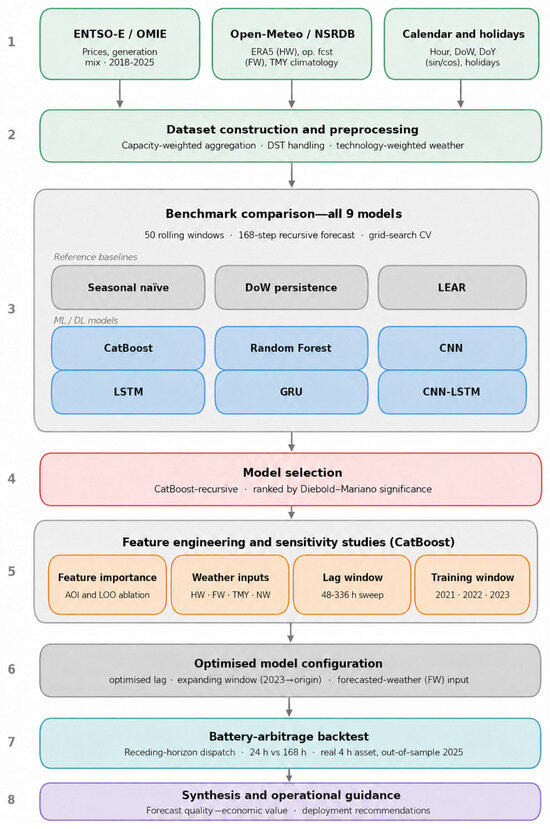
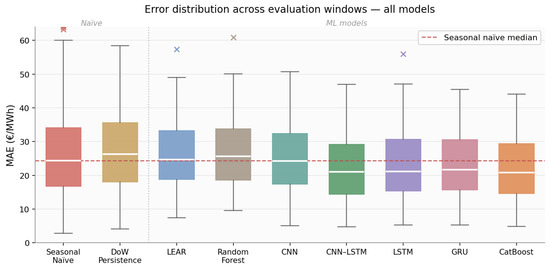
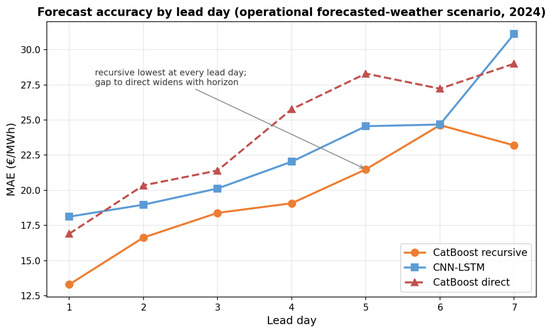
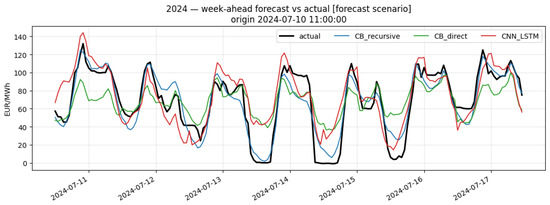
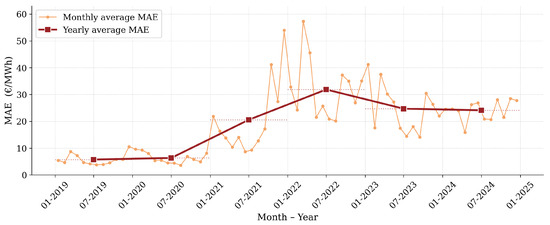
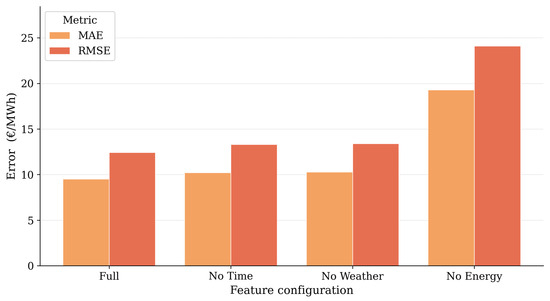
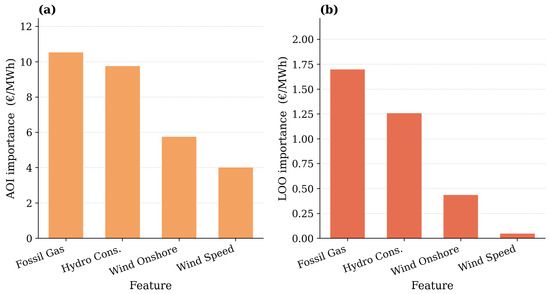
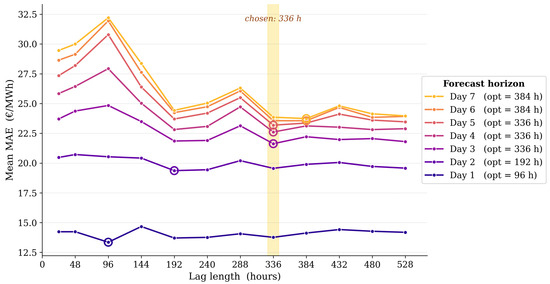
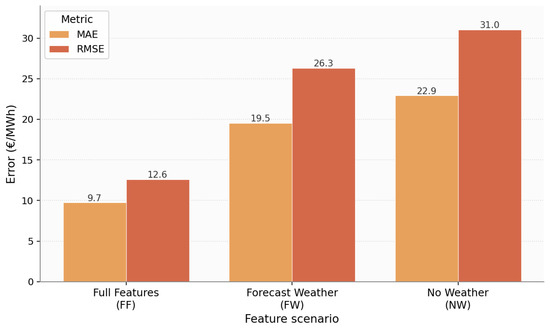
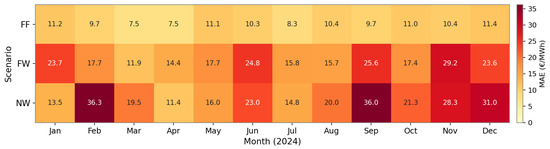
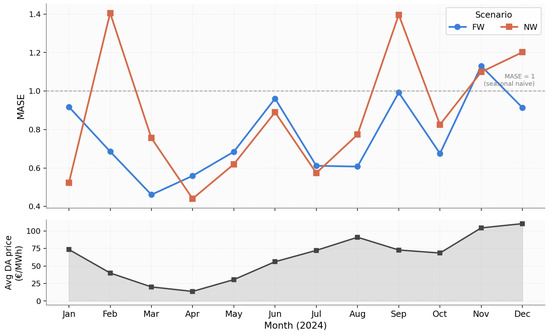
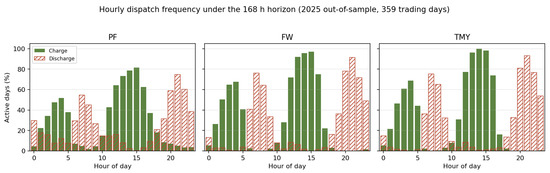
Accurate electricity price forecasting is essential for market participants seeking to optimise bidding and arbitrage strategies. This paper presents a week-ahead (168 h) hourly electricity price forecasting study for the Spanish day-ahead market. Nine competing models—two naïve baselines (a Seasonal Naïve and a Day-of-Week persistence), a Lasso-estimated auto-regressive (LEAR) statistical benchmark, and six machine- and deep-learning models (CatBoost, Random Forest, LSTM, GRU, CNN, and a hybrid CNN–LSTM)—are benchmarked; the two leading models, CNN–LSTM and CatBoost, are then compared under exogenous-feature configurations. The analysis is complemented by an ex-post Add-One-In and Leave-One-Out feature-importance analysis, a controlled comparison of weather-input scenarios, and a rolling battery-arbitrage backtest that translates forecast quality into economic value. Under an endogenous benchmark of weekly rolling origins across 2024 (with a rotating start weekday) and Diebold–Mariano testing, a recursive CatBoost and the hybrid CNN–LSTM are statistically indistinguishable and both significantly outperform a direct multi-horizon CatBoost; once an operational (forecasted) weather input is added, recursive CatBoost becomes significantly the most accurate while remaining simpler and more stable to train, a ranking confirmed on a fully out-of-sample 2025 year. Operational weather forecasts are found to be the best weather input, recovering about 84% of the perfect-foresight weather improvement over a no-weather baseline, with the advantage concentrated at longer lead times. Natural-gas-fired generation emerged as the dominant explanatory feature, consistent with the marginal-pricing mechanism governing the Spanish market. In a rolling battery-arbitrage backtest on the out-of-sample 2025 year, a deployable forecast-driven 4-h grid-scale unit (200 MW/800 MWh) captured about 89% of perfect-foresight value at a 168 h optimisation horizon and about 87% at 24 h; extending the horizon from 24 h to 168 h added about 2.4% of profit, an optimisation-horizon (look-ahead) effect bounded at +4.5% under perfect foresight.
Full article
(This article belongs to the Collection Energy Forecasting)
►▼
Show Figures

Figure 1
Open AccessArticle
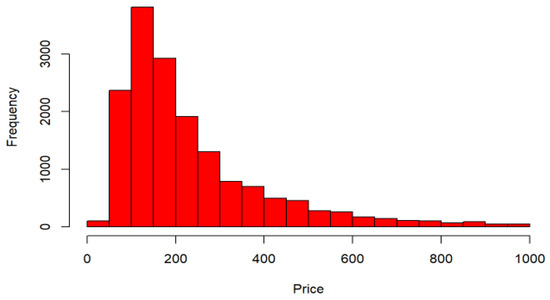
Identifying Key Attributes Associated with Short-Term Rental Occupancy Rates: Case of Airbnb
by
Sanelisiwe Amanda Nkomo, Ehsan Ahmadi and Reza Maihami
Forecasting 2026, 8(4), 60; https://doi.org/10.3390/forecast8040060 - 18 Jul 2026
Abstract
►▼
Show Figures
Short-term rental housing plays an important role in the housing market by increasing property utilization and generating income opportunities for property owners. This study investigates the key attributes associated with Airbnb occupancy rates using listing data from five major U.S. cities. Data mining
[...] Read more.
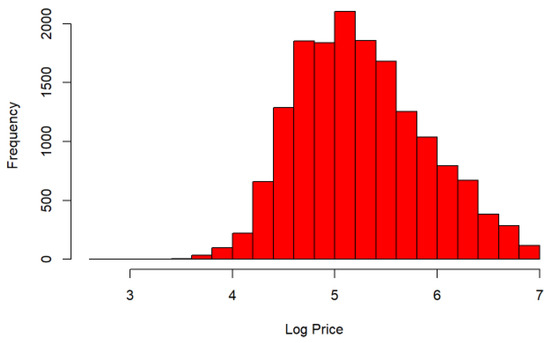
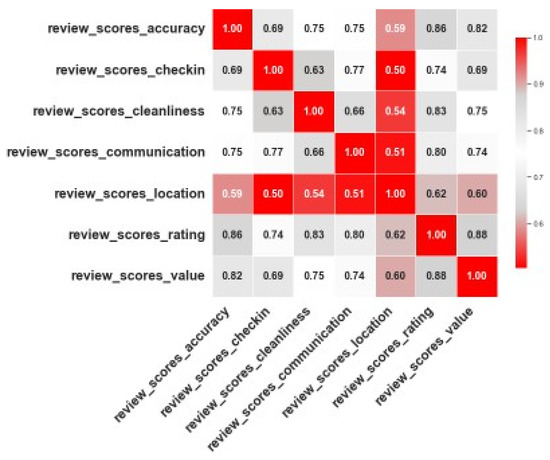
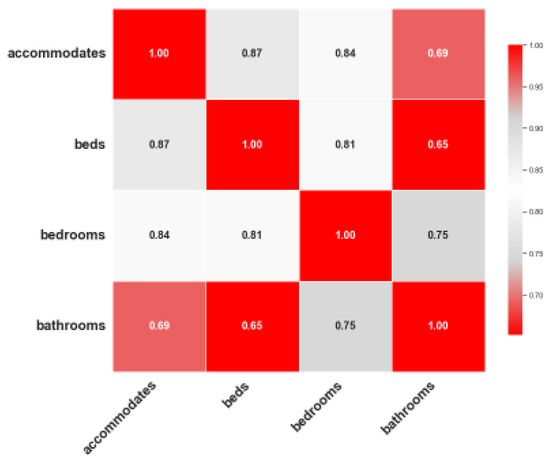
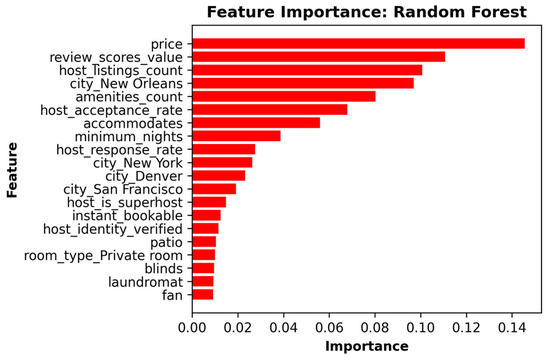
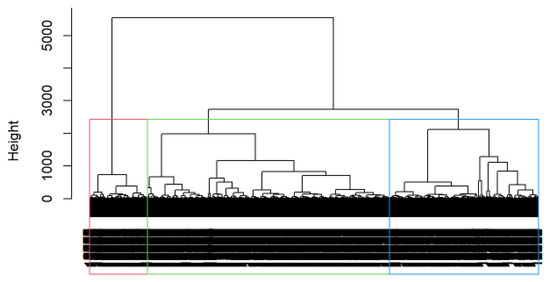
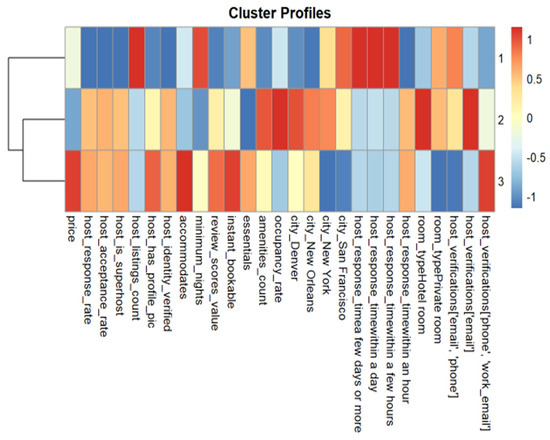
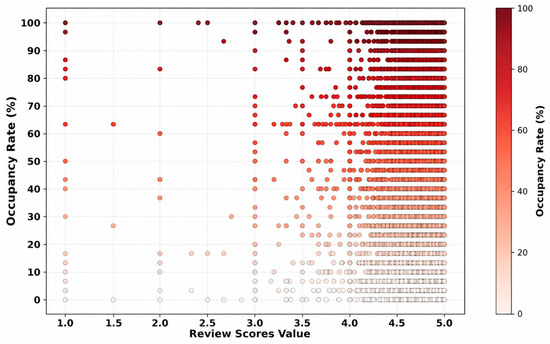
Short-term rental housing plays an important role in the housing market by increasing property utilization and generating income opportunities for property owners. This study investigates the key attributes associated with Airbnb occupancy rates using listing data from five major U.S. cities. Data mining and machine learning techniques, including Random Forest, XGBoost, Deep Neural Networks (DNN), and hierarchical cluster analysis, were applied to identify factors associated with occupancy rate variation. Random Forest achieved the best performance (R2 = 23.92%). Feature importance analysis identified price, location (city), listing capacity, amenities, and host response rate as the variables most strongly associated with occupancy rates. Cluster analysis supported these findings by identifying a dominant group of moderately priced listings with smaller accommodation capacity, more amenities, higher host responsiveness, and an average occupancy rate of 57%. These findings provide data-driven insights that may help property owners optimize listing performance and improve occupancy rates.
Full article

Figure 1
Open AccessArticle
Do Supply-Chain Stress and Geopolitical Risk Predict Strategic Commodity and Clean Energy Market Returns? Evidence from Explainable Machine Learning
by
Nader Naifar
Forecasting 2026, 8(4), 59; https://doi.org/10.3390/forecast8040059 - 15 Jul 2026
Abstract
►▼
Show Figures
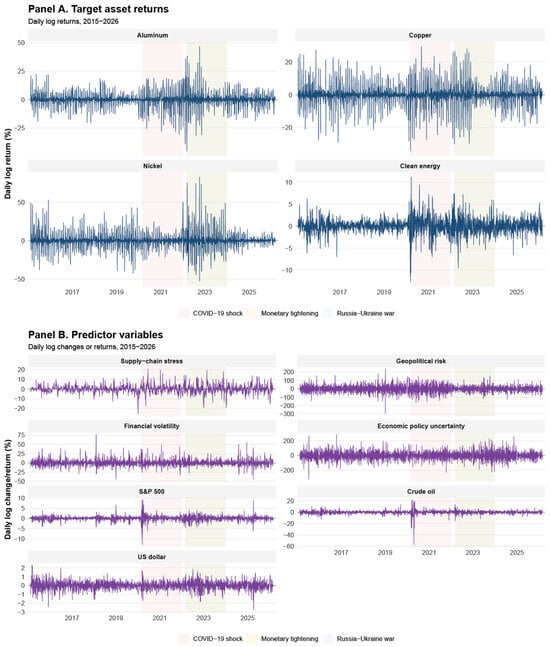
This study examines whether daily supply-chain stress and geopolitical risk improve the forecasting of strategic commodity and clean energy market returns. Using daily data on aluminum, copper, nickel, and clean energy from 10 February 2015 to 27 February 2026, the analysis compares a
[...] Read more.
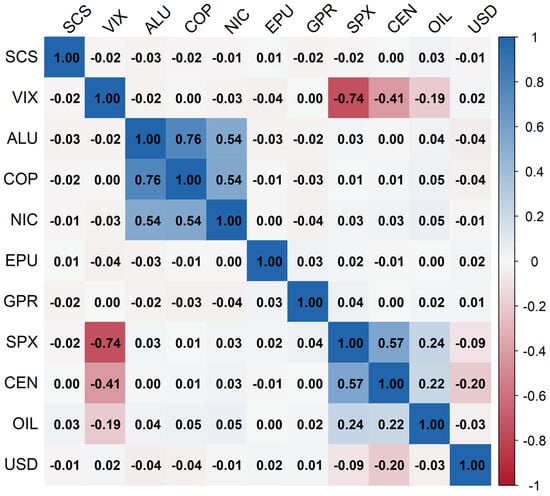
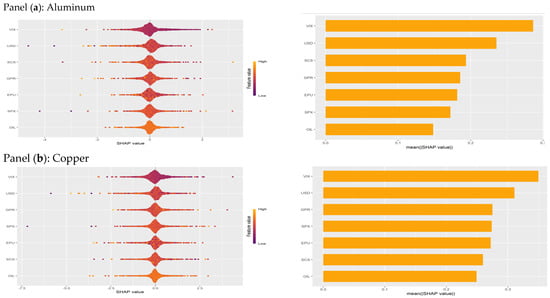
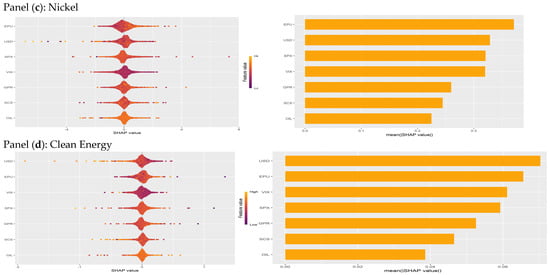
This study examines whether daily supply-chain stress and geopolitical risk improve the forecasting of strategic commodity and clean energy market returns. Using daily data on aluminum, copper, nickel, and clean energy from 10 February 2015 to 27 February 2026, the analysis compares a baseline forecasting model based on conventional market controls with augmented specifications that incorporate supply-chain stress, geopolitical risk, and their joint effects. The empirical framework combines multiple machine-learning algorithms with SHAP-based explainability to evaluate both forecast performance and the relative importance of predictors. Formal Diebold-Mariano tests are also used to assess whether the forecasting gains from augmented specifications are statistically significant. A Model Confidence Set analysis is further used to identify statistically superior model groups across the full set of algorithm-specification combinations. The results show that disruption-related predictors contain asset-specific forecasting information, while the comparison across algorithms indicates that no single model uniformly dominates across all assets and loss functions. The forecasting gains from disruption-related predictors, however, are strongly asset-specific and statistically uneven. For aluminum returns, augmented specifications that include supply-chain stress and/or geopolitical risk significantly improve forecast accuracy relative to the baseline. For copper returns, the evidence is weaker and mainly associated with geopolitical risk. For nickel returns, the joint inclusion of supply-chain stress and geopolitical risk provides the greatest improvement. By contrast, clean energy returns remain more closely tied to conventional macro-financial conditions, with no statistically significant incremental gains from disruption-related variables. SHAP evidence further indicates that predictor importance is asset-specific rather than dominated by a single market factor across all assets. The findings highlight the importance of combining flexible forecasting methods with economically interpretable tools when evaluating disruption-sensitive commodity and clean energy markets.
Full article

Figure 1

Open AccessArticle
Causal-Structure-Based Cryptocurrency Price Direction Prediction Model
by
Yuantai Cui and Hiroaki Fukunishi
Forecasting 2026, 8(4), 58; https://doi.org/10.3390/forecast8040058 - 7 Jul 2026
Abstract
In the highly volatile cryptocurrency market, trading decision support based on price prediction remains a challenging task. Although machine learning and deep learning techniques have been widely applied to cryptocurrency price prediction, many existing approaches rely on correlation-based black-box models, which limits interpretability
[...] Read more.
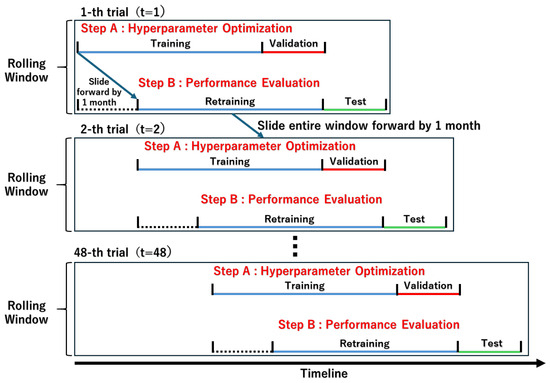
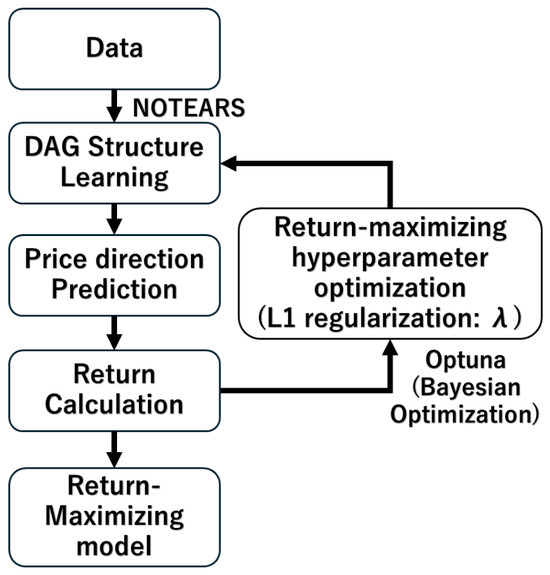
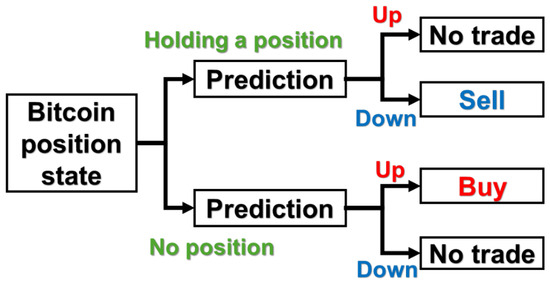
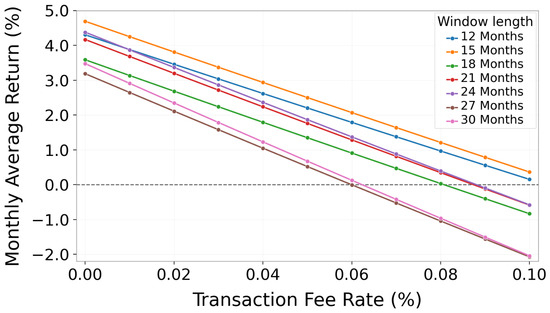
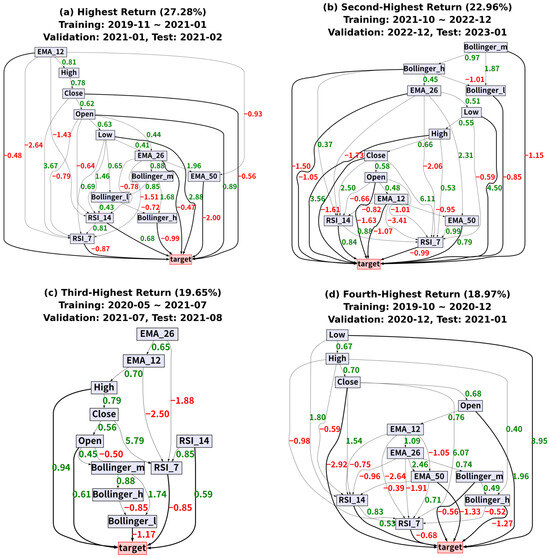
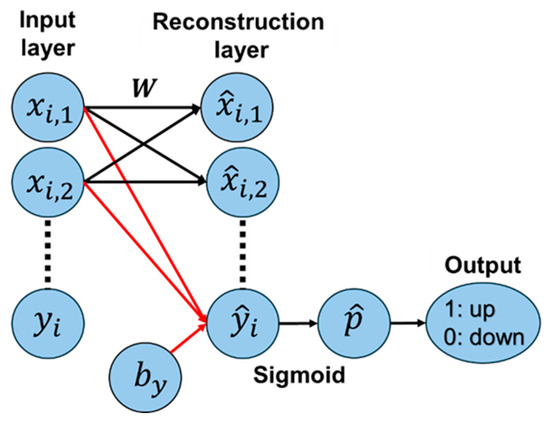
In the highly volatile cryptocurrency market, trading decision support based on price prediction remains a challenging task. Although machine learning and deep learning techniques have been widely applied to cryptocurrency price prediction, many existing approaches rely on correlation-based black-box models, which limits interpretability and robustness. In this study, we employed a NOTEARS-Linear-based Prediction Model (NLBPM) that directly incorporated causal structures inferred through a causal discovery method as structural constraints within the prediction model. Unlike conventional approaches that focus primarily on minimizing prediction error, the NLBPM emphasized return maximization as its objective function, thereby prioritizing practical economic value. Using Bitcoin as a case study, we constructed a model to predict the direction of price movement four hours ahead and evaluated its performance using a rolling-window scheme with a one-month sliding window. Analysis of the inferred causal structures showed that the returns improved when trades were executed only during rolling-window trials in which specific directed edges to the target variable were detected. Based on this finding, we proposed a causal filter strategy that restricts trading to periods in which specific directed edges to the target variable are detected. In the data period analyzed in this study, the selected edge was the one from the opening price (Open) to the target variable. Backtesting experiments incorporating a transaction fee of 0.1% demonstrated that, while the benchmark LSTM model achieved a negative monthly average return of −3.20% and the NLBPM without filtering yielded −0.72%, the NLBPM with the Open filter attained a higher monthly average return of 10.35%. This study supports the usefulness of using inferred causal structure for cryptocurrency trading decision support.
Full article
(This article belongs to the Topic Modern Challenges and Innovations in Financial Econometrics)
►▼
Show Figures

Figure 1
Open AccessArticle
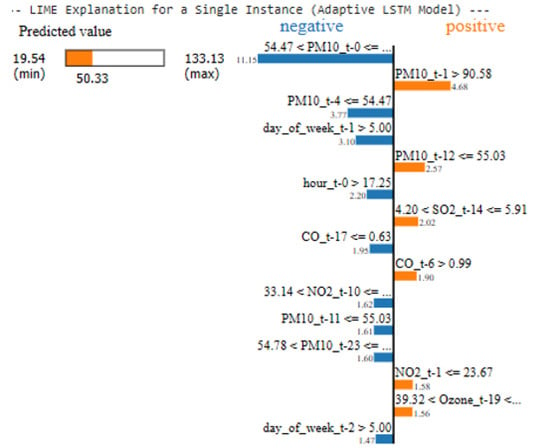
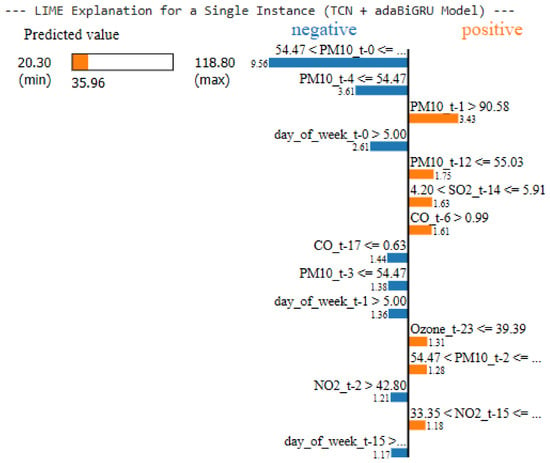
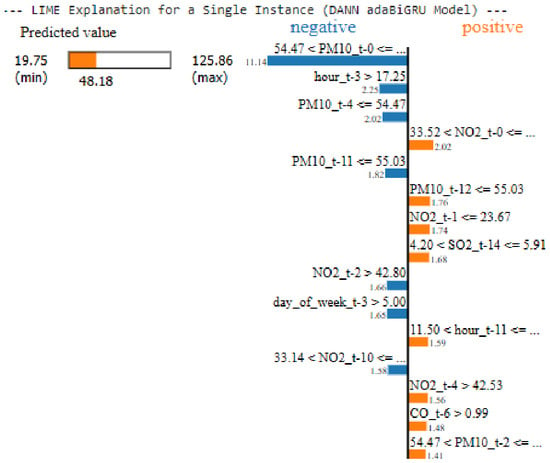
Integrating Explainability into an Adaptive Transfer Learning with Uncertainty Quantification for PM2.5 Prediction in the Data-Scarce Region of South Africa
by
Israel Edem Agbehadji and Ibidun Christiana Obagbuwa
Forecasting 2026, 8(4), 57; https://doi.org/10.3390/forecast8040057 - 4 Jul 2026
Abstract
►▼
Show Figures
South Africa faces significant challenges in monitoring air pollution from different provinces due to the sparse nature of the sensor network and heterogeneous pollutant sources. Notably, some provinces continue to record a limited amount of data on air pollution, thus making monitoring in
[...] Read more.
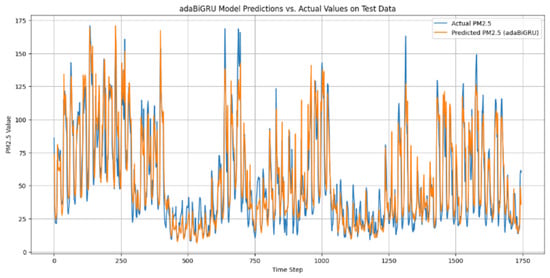
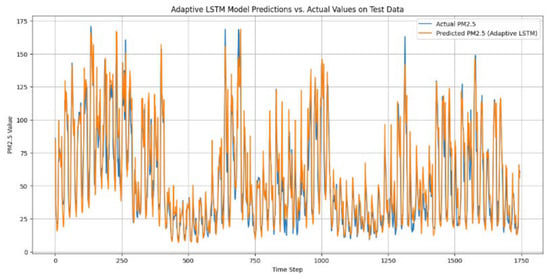
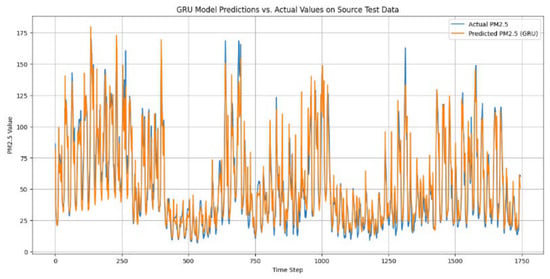
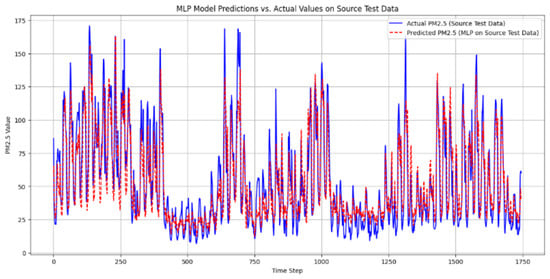
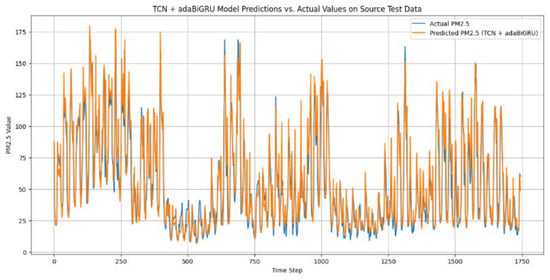
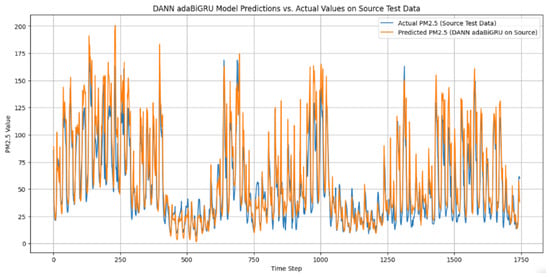
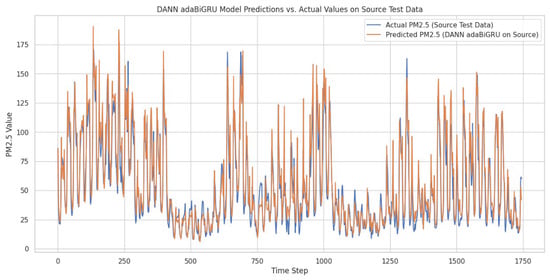
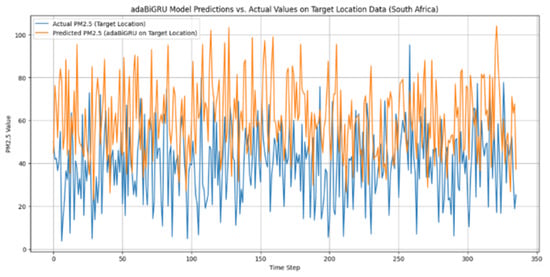
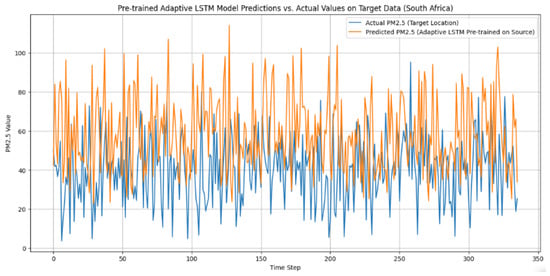
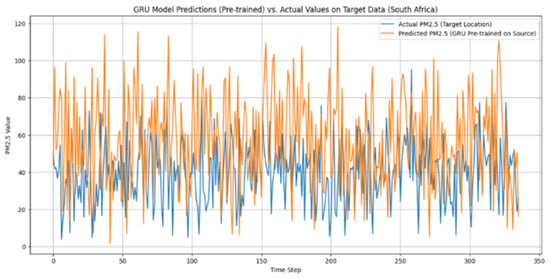
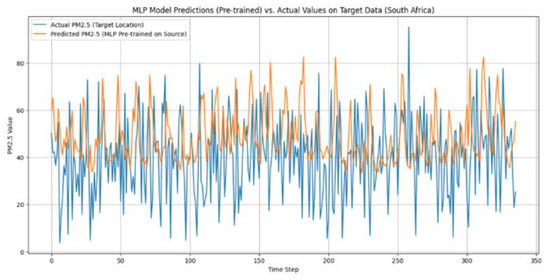
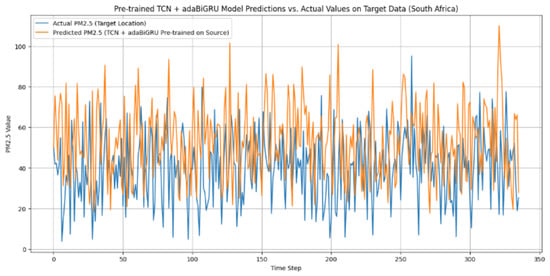
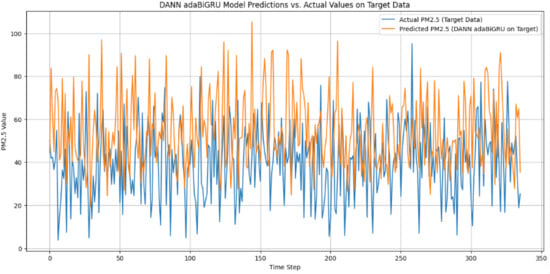
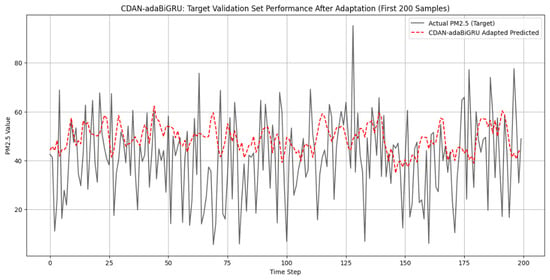
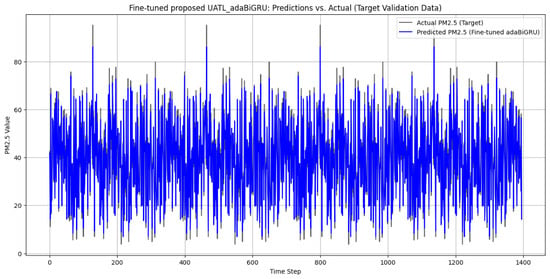
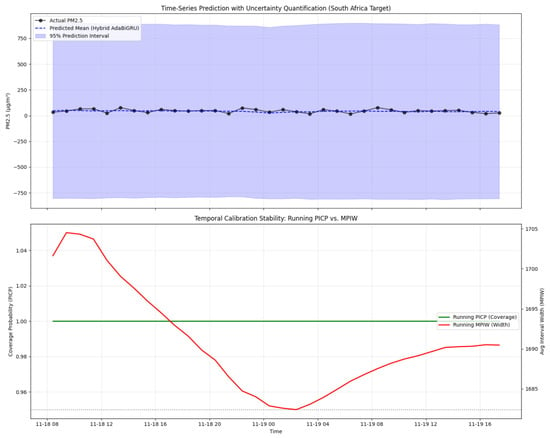
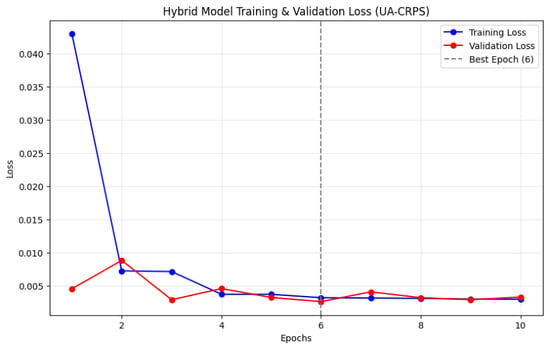
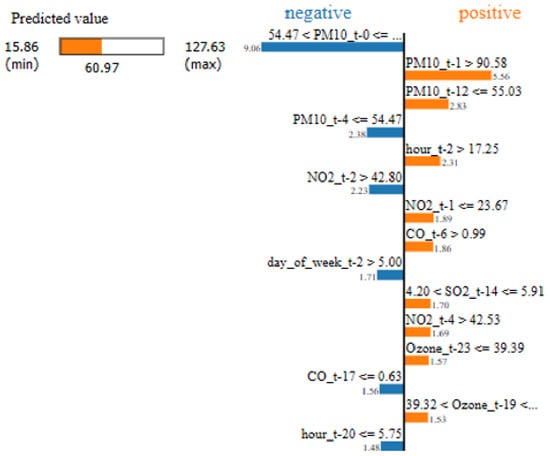
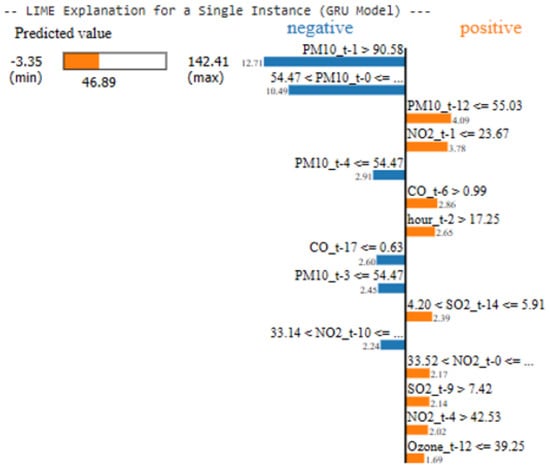
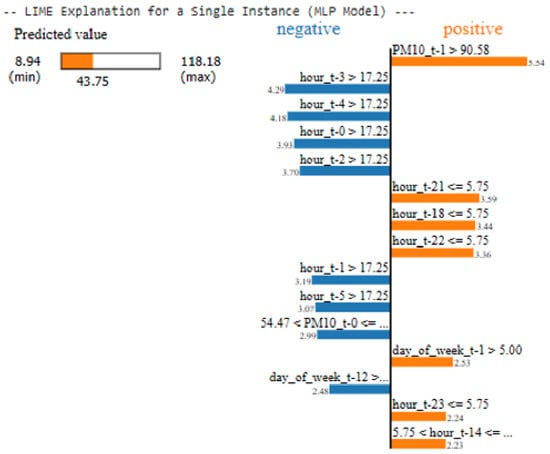
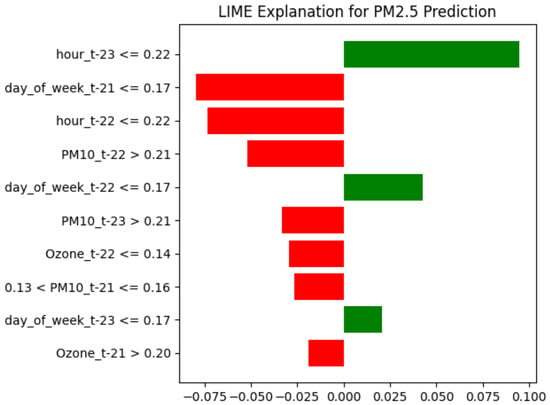
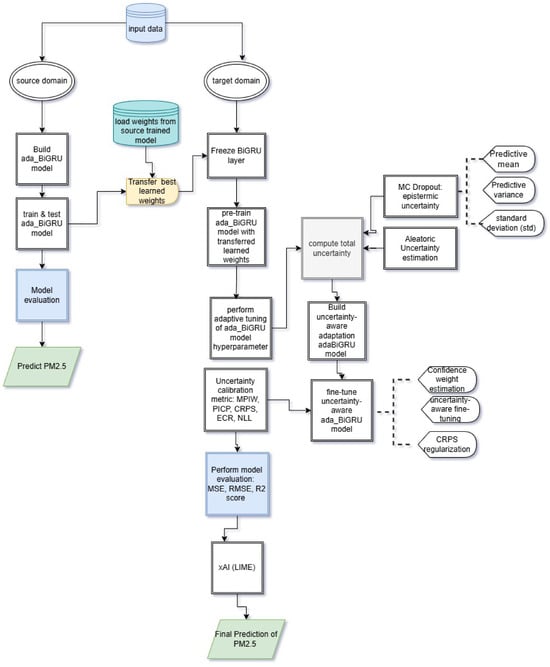
South Africa faces significant challenges in monitoring air pollution from different provinces due to the sparse nature of the sensor network and heterogeneous pollutant sources. Notably, some provinces continue to record a limited amount of data on air pollution, thus making monitoring in those locations problematic. Fortunately, the capabilities of deep learning models to facilitate effective monitoring in data-scarce locations have been highlighted by researchers; however, these models within the context of transfer learning still lack transparency and uncertainty quantification. Using air pollutants and meteorological factors, this study proposes a transfer learning model for particulate matter (PM2.5) prediction in a data-scarce region. This transfer learning (TL) model leverages an adaptive Bi-directional Gated Recurrent Unit (adaBiGRU) with explainable artificial intelligence (xAI) and uncertainty quantification (UQ) to provide a novel uncertainty-aware adaptation transfer learning (UATL_adaBiGRU) model for a data-scarce location. Variant models based on the adaBiGRU technique, such as the temporal convolution network adaBiGRU (TCN-adaBiGRU) and domain-adversarial neural network adaBiGRU (DANNadaBiGRU), are presented as comparative models. The performance evaluation metrics are root mean squared, R2 score and mean squared error. The R2 score of pre-trained models in source domain is adaBiGRU (0.888), DANN_adaBiGRU (0.7788) and TCN_adaBiGRU (0.876). Furthermore, other comparative TL models include GRU (0.898), MLP (0.802) and adaptive LSTM (0.886). Afterwards, the pre-trained baseline model (adaBiGRU) was fine-tuned in the target domain dataset and the unpromising result contributed to the proposition of the UATL_adaBiGRU model for a data-scarce location, with R2 score of 0.9618. Uncertainty assessment metrics results were also presented for the proposed model. Ablation assessment demonstrates that each component of the UATL_adaBiGRU contributes to enhancing the predictive performance. Again, the Diebold–Mariano (DM) test statistic demonstrates a statistically significant difference between baseline model and UATL_adaBiGRU model. Finally, the local interpretable model-agnostic explanation highlights multi-scaled features as contributing towards the prediction of PM2.5 in the target domain. In view of this result, model fine-tuning is strongly recommended to enhance the robustness of the proposed uncertainty-aware adaption model in data-limited regions in South Africa.
Full article

Figure 1

Open AccessArticle
Forecasting Intermittent Sales in Fashion Retail: A Two-Stage Machine Learning Approach
by
Betül Yılmaz Sucuoğlu, Ömer Faruk Beyca and Fuat Kosanoğlu
Forecasting 2026, 8(4), 56; https://doi.org/10.3390/forecast8040056 - 30 Jun 2026
Abstract
►▼
Show Figures
Intermittent sales patterns, prevalent in fast-fashion retail, pose a critical challenge for conventional forecasting methods. This study empirically compares one-stage and two-stage machine learning (ML) frameworks with classical benchmarks (Croston, SBA). The two-stage approach uses a Random Forest classifier for demand occurrence, followed
[...] Read more.
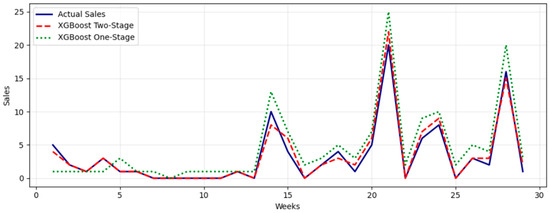
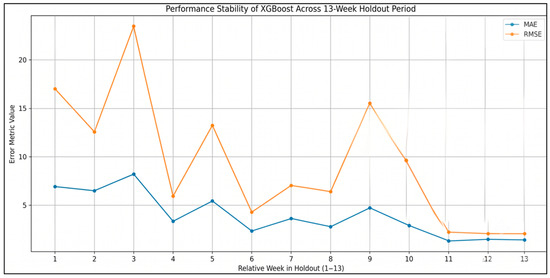
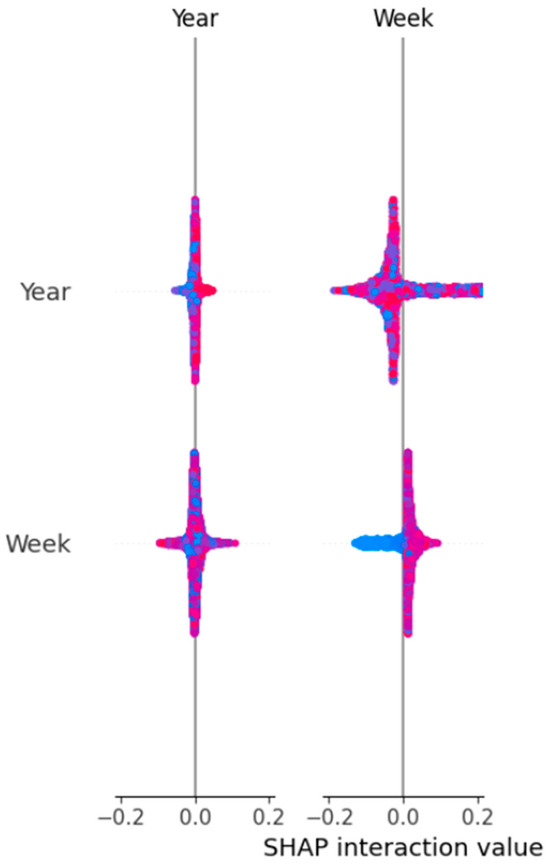
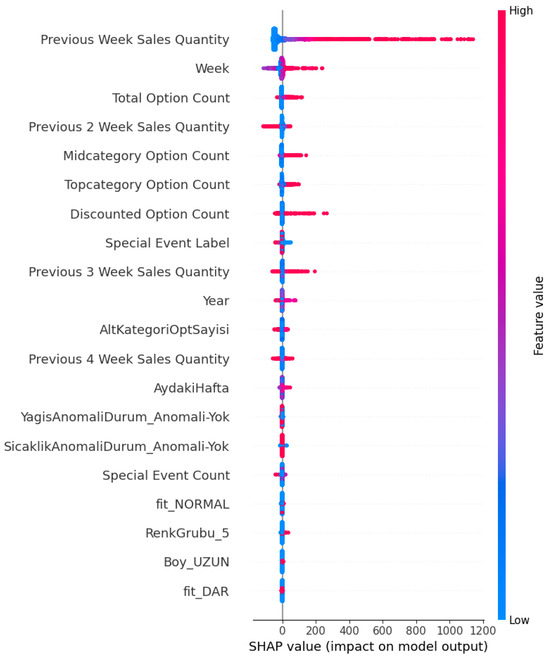
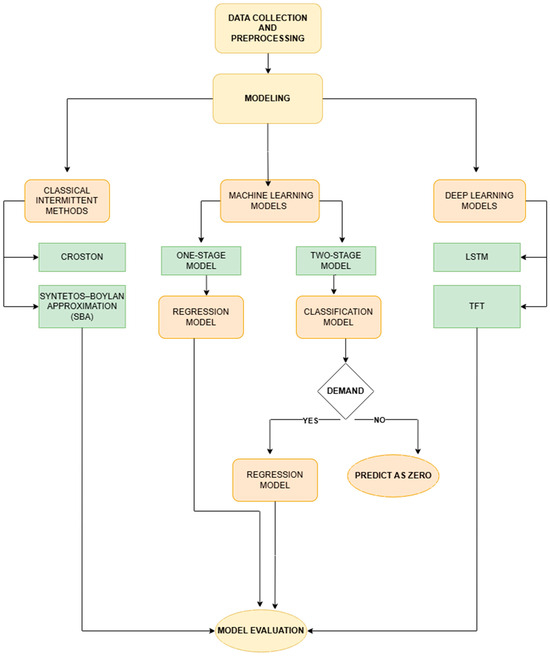
Intermittent sales patterns, prevalent in fast-fashion retail, pose a critical challenge for conventional forecasting methods. This study empirically compares one-stage and two-stage machine learning (ML) frameworks with classical benchmarks (Croston, SBA). The two-stage approach uses a Random Forest classifier for demand occurrence, followed by regression models (RF, GBM, XGBoost, LightGBM) for magnitude. Models are evaluated using weekly sales data from an Iraqi fashion retailer, incorporating rich exogenous features like product attributes, pricing, weather, and special events across 64 unique attribute-defined product group time series. Performance is assessed via a fixed 13-week holdout and rolling-origin cross-validation, with LSTM and Temporal Fusion Transformer (TFT) serving as deep learning benchmarks. Empirical findings show that machine learning configurations achieve superior WRMSSE accuracy, with two-stage models often outperforming one-stage counterparts, and both significantly surpassing classical and deep learning baselines. The Two-Stage XGBoost yielded the lowest WRMSSE, establishing the feature-engineered two-stage framework as the strongest overall for this intermittent retail setting. Furthermore, a detailed SHAP analysis elucidated the distinct feature contributions to demand occurrence versus demand magnitude, providing actionable insights for inventory management. This rigorous benchmarking analysis offers practical implications for inventory planning and demand management in volatile markets, highlighting the effectiveness of explicit demand occurrence modeling.
Full article

Figure 1

Highly Accessed Articles
Latest Books
E-Mail Alert
News
Topics
Topic in
Applied Sciences, Energies, Forecasting, Solar, Wind, Batteries
Solar and Wind Power and Energy Forecasting, 2nd Edition
Topic Editors: Emanuele Ogliari, Alessandro Niccolai, Sonia LevaDeadline: 31 July 2027
Topic in
Econometrics, Economies, JRFM, Forecasting
Modern Challenges and Innovations in Financial Econometrics
Topic Editors: Agnieszka Szmelter-Jarosz, Hamed NozariDeadline: 31 August 2027
Topic in
Electronics, Energies, Processes, Sci, Sustainability, Wind, Forecasting, Applied Sciences
Advanced Forecasting Methods for Sustainable Power Systems
Topic Editors: Cristina Ventura, Santi Agatino RizzoDeadline: 30 November 2027
Conferences
Special Issues
Special Issue in
Forecasting
Advanced Forecasting in an Era of Uncertainty and Its Impact on Strategic Investment Decisions
Guest Editors: Marek Nagy, Katarina ValaskovaDeadline: 30 November 2026
Special Issue in
Forecasting
Fire Weather in a Warming Climate: From Surface Indices to Atmospheric Dynamics
Guest Editors: Theodore M. Giannaros, Georgios PapavasileiouDeadline: 31 December 2026
Special Issue in
Forecasting
Forecasting Impacts of Air Pollution and Hydro-Meteorological Extremes: Models, Methods, and Applications
Guest Editors: Chibuike Chiedozie Ibebuchi, Richard DamoahDeadline: 31 December 2026
Special Issue in
Forecasting
Feature Papers of Forecasting 2026
Guest Editor: Sonia LevaDeadline: 31 December 2026
Topical Collections
Topical Collection in
Forecasting
Supply Chain Management Forecasting
Collection Editors: Gokhan Egilmez, Juan Ramón Trapero Arenas