1. Introduction
Storm-induced power outages pose significant operational and economic challenges for electric utilities, particularly in regions where aging infrastructure, dense vegetation, and complex terrain amplify grid vulnerability [
1,
2,
3,
4]. High-impact weather systems such as nor’easters, convective windstorms, and heavy precipitation events frequently damage overhead distribution networks and disrupt electric service [
5,
6,
7]. Between 2000 and 2023, weather-related events have caused 1755 major outages in the United States—each major outage defined as an event affecting at least 50,000 customers or 300 MW—accounting for 80% of all large-scale events [
8]. The annual frequency has nearly doubled in the last decade, and a separate analysis reported a 67% increase in weather-related outages between 2000 and 2020, with the northeast and southeast regions affected the most [
9]. Power outages disrupt critical services such as healthcare and communications, while threatening public safety and economic stability [
1,
10,
11,
12,
13,
14,
15].
Accurate storm outage prediction is an essential tool for utilities to pre-position crews, allocate equipment, and plan restoration activities [
2,
16]. However, a key challenge is the uncertainty of weather forecasting, which increases with lead time and propagates into outage predictions. While longer lead times provide utilities with more time to prepare, they also introduce greater forecast errors, leading to costly over-preparation or inadequate response [
17,
18,
19,
20]. In addition, studies on weather forecasting have shown that prediction errors grow systematically with lead time, affecting applications such as energy load forecasting [
21] and ensemble weather-based risk assessments [
22,
23]. Together, these factors highlight the need for a comprehensive assessment of forecast uncertainty in outage prediction systems.
Data-driven outage prediction models have provided utilities with a useful operational framework by linking meteorological inputs to trouble spot locations (outage counts) on the distribution grid [
24,
25,
26]. While machine learning methods such as random forests, gradient boosting, and Bayesian regression trees have demonstrated predictive skill across various storm types and different regions [
5,
27,
28], these advances are best viewed as tools that help quantify outage risk under the best available weather information—typically a weather analysis dataset. In an operational setting, these systems are compounded by the uncertainties from the weather forecasting data and the outage prediction model. The subject of this paper is to assess this error propagation through numerical studies of distribution grid outages caused by severe tropical and extratropical weather events in the New England area of the United States.
Despite its practical importance, relatively few studies have systematically examined the propagation of weather forecast uncertainty through outage prediction models across multiple lead times and evaluation setups. Yang et al. (2021) found that weather forecast errors—particularly for gusts and precipitation—are often the leading contributor to outage prediction uncertainty, exceeding model-related sources at longer lead times [
17].
Similarly, Quiring et al. (2014) demonstrated that errors in hurricane forecasts substantially degrade outage prediction accuracy in decision-support tools used by emergency planners [
18]. Arora and Ceferino (2023) highlighted that even advanced machine learning frameworks often lack robust mechanisms to quantify forecast-driven uncertainty, especially under rare or extreme conditions [
29]. This is consistent with findings from Yang et al. (2025), who showed that model performance varies considerably when trained on unbalanced storm datasets, particularly under severe storm scenarios [
25]. For high-impact tropical and extratropical storms in New England, this gap is especially critical considering the region’s vulnerability and the operational need to balance preparedness with reliability. Among different approaches, GBM-based outage prediction models are particularly suitable for this study because they can capture nonlinear relationships and interactions among meteorological, environmental, and infrastructure predictors while maintaining strong predictive performance in prior outage applications. We therefore use the GBM framework as the established OPM model developed in prior studies of our team at the Eversource Energy Center, allowing this paper to focus specifically on how uncertainty in WRF forecasting propagates into outage predictions.
This study addresses this gap through a numerical investigation that quantifies how weather forecast lead time affects outage prediction error. Using the Gradient Boosting Machine (GBM)-based outage prediction model (OPM) developed at the Eversource Energy Center [
26], we analyzed 66 high-impact extratropical storms with Weather Research and Forecasting (WRF) model inputs. Individual forecast lead times were merged into three categories, short (12 h–1 d), medium (2–3 d), and long (4–5 d), along with an analysis-based reference. We evaluate three scenarios—FFAP (forecast vs. analysis-based outage predictions), FFAO (forecast vs. actual outages), and LFAO (leave-one-storm-out forecast vs. actual outages)—to distinguish the effects of weather forecast degradation and model generalization error. By focusing on forecast-error propagation, this work extends outage prediction research toward a better understanding of how different forecast horizons influence prediction accuracy and provides utilities with practical guidance for lead-time-aware storm-response planning.
The remainder of this paper is organized as follows:
Section 2 presents the methodology, including a description of the datasets—historical storm events, weather model data, and ground station observations—as well as details of the outage prediction model (OPM), evaluation scenarios, and statistical performance metrics.
Section 3 reports the results, offering a comparative analysis of model predictions across different weather forecast lead times and forecast-error propagation.
Section 4 provides a detailed discussion of the findings, emphasizing the effects of weather forecast uncertainty on outage model performance and exploring implications for operational planning and decision making.
Section 5 concludes by summarizing key insights and suggestions for future research aimed at enhancing the robustness of outage prediction models under varying weather forecast lead times.
2. Methodology
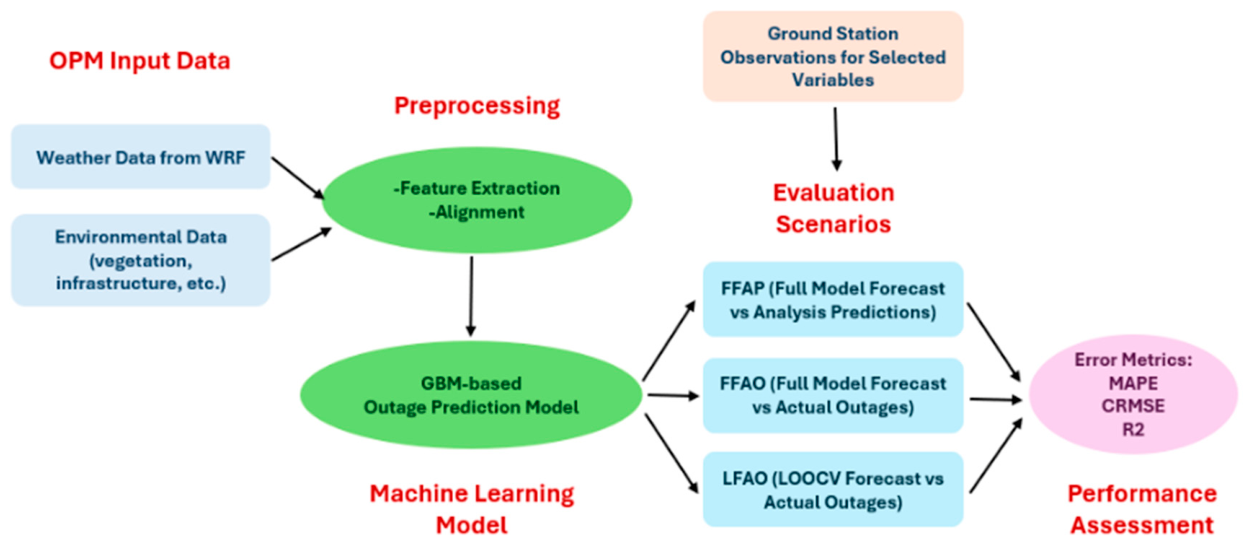
This study employs a structured framework to evaluate how weather forecast lead time affects the accuracy of storm-induced outage predictions. Multiple data sources—including weather forecasts [
30] and analysis data (from WRF), ground-based observations, infrastructure, outage data, and environmental data—were fed into a Gradient Boosting Machine (GBM)-based outage prediction model (OPM) originally developed by Watson et al. [
26]. Model performance was examined across three weather forecast lead-time categories and three evaluation scenarios, using Mean Absolute Percentage Error (MAPE), Centered Root-Mean-Square Error (CRMSE), and the coefficient of determination (R
2) as performance metrics (
Figure 1). These measures align with established practices in forecast verification for predictive modeling [
19,
31,
32,
33].
2.1. Study Area and Datasets
This study identified 66 high-impact extratropical storms (2015–2023) within the Eversource Energy service territory in Connecticut, Massachusetts, and New Hampshire, encompassing 45 automated surface observing system (ASOS) stations [
34]. High-impact storms were selected by examining outage records in each service territory and retaining events in the upper tail of the damage distribution (≈95th percentile), which isolates the relatively few storms that caused the largest system impacts while applying a consistent rule across territories with different infrastructure and risk profiles. Because the Eversource service territory includes four operational domains—CT, EMA, NH, and WMA—each storm may impact multiple domains; accordingly, the 66 storms were represented as 115 domain-specific events. To analyze intensity effects and maintain balance in comparisons, we computed a territory-normalized severity score for each event (within-territory percentile of 48 h trouble-spot counts), ordered all events by this score, and grouped them into low, middle, and high categories, with low and high constructed to be equal in size and middle containing the remaining events.
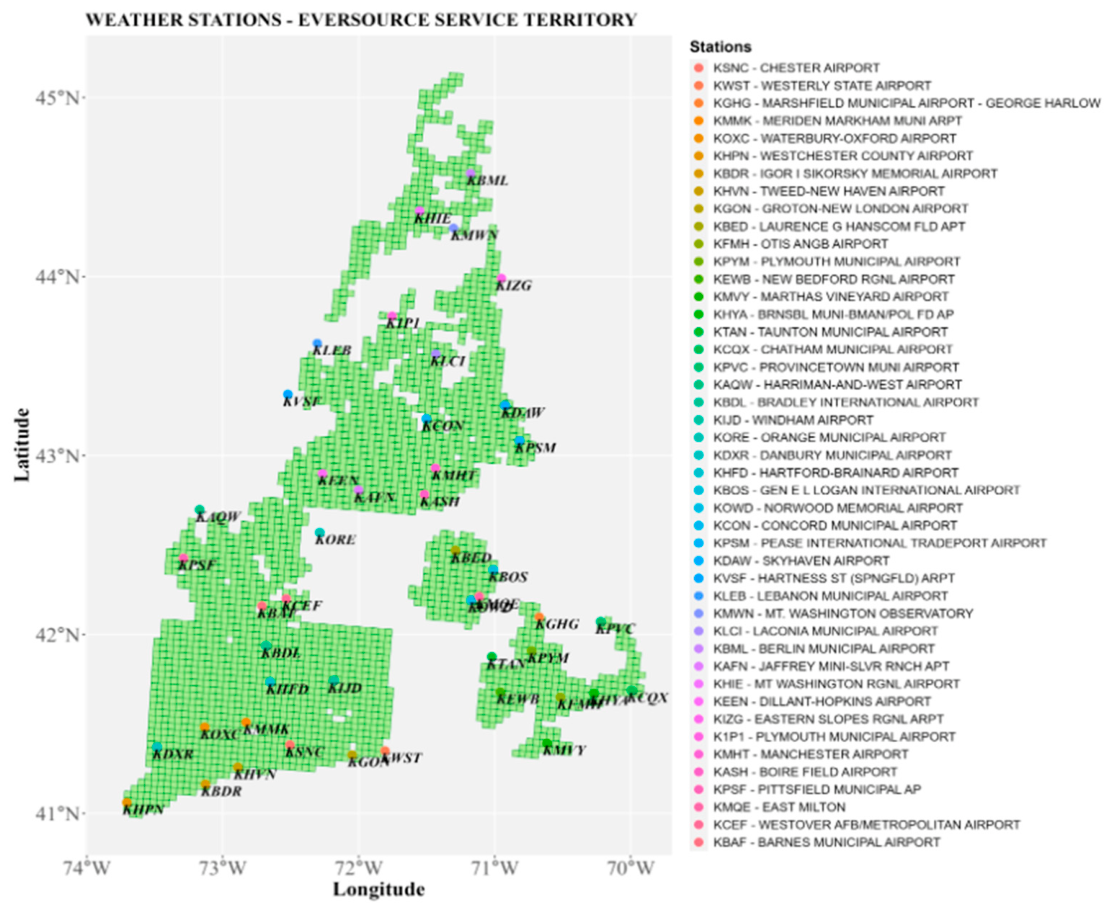
Figure 2 shows the WRF grids extracted for the New England Eversource service territories, together with the locations of the weather stations used in this study. Weather simulations were generated with the WRF model using a two-way nested configuration with two spatial domains at 12 km and 4 km grid spacing [
34]. Initial and boundary conditions were provided by the Global Forecast System (GFS) [
35].
Forecasts were first produced at individual lead times and then merged into three broader lead-time categories: short (12 h–1 d), medium (2–3 d), and long (4–5 d). This grouping was used to summarize model performance across operationally meaningful forecast windows while reducing variability associated with individual lead-time comparisons. WRF analysis data were used as the baseline, or “zero-lead-time”, input for the OPM, while ground-station observations for selected weather variables provided an independent reference for evaluating the accuracy of the WRF-based weather inputs. Although all three lead-time categories were evaluated in the analysis, the summary tables focus on the short and long categories because they represent the two operationally distinct ends of the forecast window. The medium category generally falls between these two and is shown in the figures to illustrate the intermediate progression of forecast-error effects.
The following weather variables were extracted for each storm as the key variables [
36]:
In addition, environmental variables—including land cover, vegetation density, and infrastructure characteristics—were incorporated to account for spatial variations in outage vulnerability [
24,
26,
36].
2.2. Weather Simulations
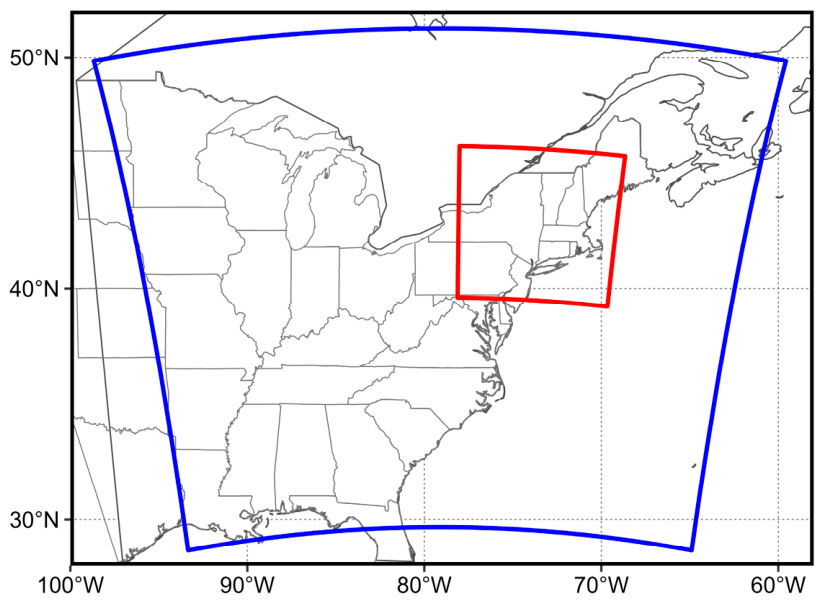
In this study, WRF version 4.2.2 was used to simulate forecast lead times and analysis-based historical weather conditions for each selected storm. Each WRF simulation covered a 54 h period, including a 6 h spin-up time. The simulations were performed using a two-way interactive nesting configuration with two domains at 12 km and 4 km grid spacing (
Figure 3). This setup was used to dynamically downscale the 0.5-degree Global Forecast System (GFS) product, generated by the National Centers for Environmental Prediction, over the New England region. The hourly output from the 4 km WRF inner domain was used to derive the meteorological variables analyzed in this study.
Table 1 summarizes the parameterization schemes used in the WRF simulations, including microphysics, radiation, planetary boundary layer, and convection schemes. The same WRF configuration was applied consistently across all simulated events so that differences in model performance could be attributed to forecast lead time and evaluation setup rather than changes in the weather simulation configuration.
WRF simulations and OPM evaluations were performed using institutional high-performance computing (HPC) resources at the University of Connecticut. The outage prediction analysis was conducted in the R statistical computing environment using the established GBM-based OPM framework described in Watson et al. [
26].
External data sources used in the workflow included GFS data for WRF initial and boundary conditions, ASOS station observations for independent weather-error evaluation, and utility-provided outage and infrastructure data. Model performance metrics and scenario-based comparisons were computed using the same computational workflow across all lead-time categories and evaluation scenarios.
2.3. Outage Prediction Model (OPM)
The outage prediction model (OPM) used in this study builds on the Gradient Boosting Machine (GBM)-based framework developed by Watson et al. [
26]. The model predicts trouble spots (TS), defined as unique locations where at least one utility crew was dispatched for storm-related repairs across the Eversource Energy distribution grid. In the original framework, predictions were generated at the grid scale and then aggregated across the affected service territory to evaluate event-level outages. The GBM-based OPM uses meteorological, infrastructure, vegetation, land-cover, and environmental predictors; detailed model development, tuning, and validation are described in Watson et al. [
26]. In the present study, we used the same established OPM framework across all evaluation scenarios. This allows changes in performance to be attributed to forecast lead time and evaluation setup, rather than changes in model architecture. Grid-level predicted and observed trouble spot counts were aggregated over each storm domain and 48 h event window to obtain event-level outage estimates. This aggregation allows us to evaluate how forecast lead time and model training setup affect outage prediction accuracy across multiple storms and service territories, consistent with regional-scale vulnerability modeling approaches [
37]. Two training approaches were implemented:
The OPM was trained using all 66 selected storms. Because all storms are included in the training dataset, this setup minimizes storm-level generalization error and provides a controlled framework for evaluating the effect of forecast degradation on model performance.
The OPM was trained on all storms except the storm being tested. This setup evaluates model performance on unseen storms and captures both forecast-error effects and model generalization error, making it the most realistic operational evaluation scenario.
Because a single storm can affect multiple Eversource service territories, the 66 storms correspond to 115 domain-specific events. To avoid data leakage, the LOOCV procedure was performed at the storm level rather than at the individual domain-event level. Specifically, when one storm was selected as the test case, all domain-specific records associated with that storm were removed from the training set and used only for testing. Therefore, no records originating from the same storm appeared simultaneously in both the training and test sets.
2.4. Evaluation Scenarios
Three evaluation scenarios were designed to isolate different components of prediction error (
Table 2):
The FULL model is trained on weather analysis data from 66 storms and then tested on weather forecast inputs for the same storms. Predictions are compared to the model’s own outputs on weather analysis data. This setup isolates the effect of forecast input degradation by holding the OPM model constant and excluding actual outage data.
The FULL model is trained over weather analysis data and then tested on weather forecast inputs, with predictions compared directly against observed outages. Because every storm is included in training, this scenario captures forecast uncertainty but not generalization error, representing a best-case benchmark for operational performance.
The LOOCV model is trained on weather analysis data from all storms except the target event and then tested on weather forecast inputs for the excluded storm and evaluated against observed outages. This scenario captures both forecast degradation and model generalization error, providing the most realistic estimate of operational performance under unseen conditions.
This multi-scenario design follows established practices in forecast model evaluation, where systematic comparisons of forecast inputs, reference analysis data, and observed outcomes are used to support scenario-based attribution of prediction errors [
17,
18,
37].
2.5. Error Metrics and Performance Assessment
Model performance was evaluated using three complementary measures:
where
n is the number of events,
Ai is the observed outage, and
Fi is the predicted outage.
- b.
Centered Root-Mean-Square Error (CRMSE):
where
and
denote the mean forecast and observed values, respectively.
- c.
Coefficient of determination (R2):
which measures the proportion of variance in observed outages explained by the model.
The three metrics were selected because they capture complementary aspects of model performance. MAPE provides a scale-independent measure of relative error, which is useful for comparing performance across storms with different outage magnitudes. CRMSE measures the centered magnitude of prediction error after removing mean bias, making it useful for evaluating variability and pattern agreement between predicted and reference outage values. R2 measures the proportion of observed outage variance explained by the model and provides an interpretable measure of predictive skill. Because outage events vary substantially in magnitude, no single metric fully describes model performance; therefore, all three metrics are reported together.
3. Results
This section presents the model performance across different lead times and evaluation scenarios. Metrics including MAPE, CRMSE, and R2 are compared to quantifying the relative contributions of weather forecast degradation with lead time and model generalization to prediction error. Because MAPE is sensitive to small observed outage totals, especially for low-impact events, the severity-based results are interpreted jointly using MAPE, CRMSE, and R2.
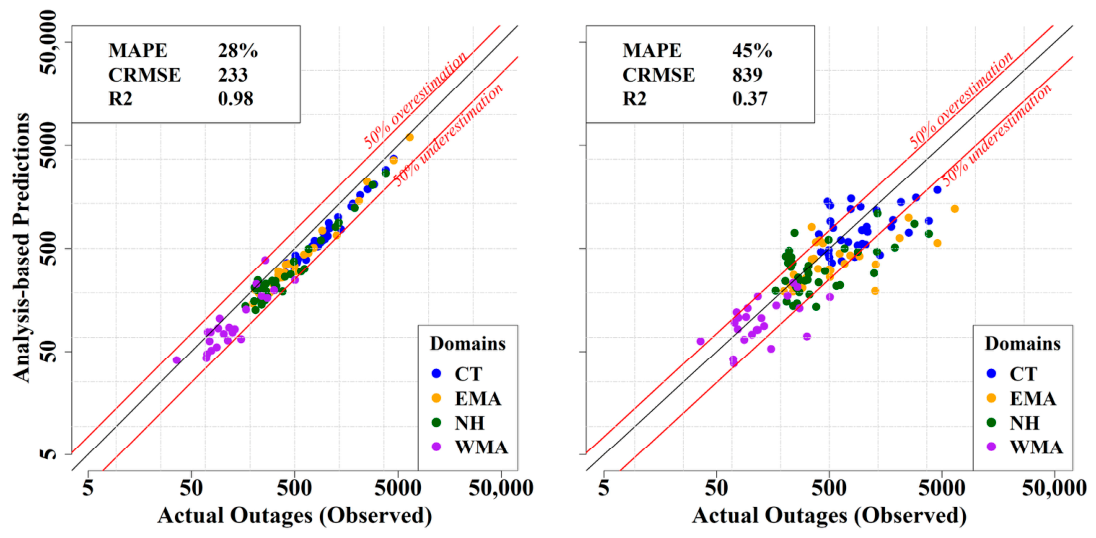
Baseline model performance under the FULL and LOOCV training is summarized in
Figure 4, which illustrates the trade-off between idealized OPM in the FULL setup and realistic operational performance under LOOCV.
3.1. Overall Model Performance Across Lead Times
Table 3 summarizes OPM performance for the short (12 h–1 d) and long (4–5 d) forecast lead-time categories across the three evaluation scenarios (FFAP, FFAO, and LFAO). These two categories represent the operationally distinct ends of the forecast window, while the medium lead-time category (2–3 d) generally falls between them and follows the overall lead-time-related degradation pattern shown in the figures.
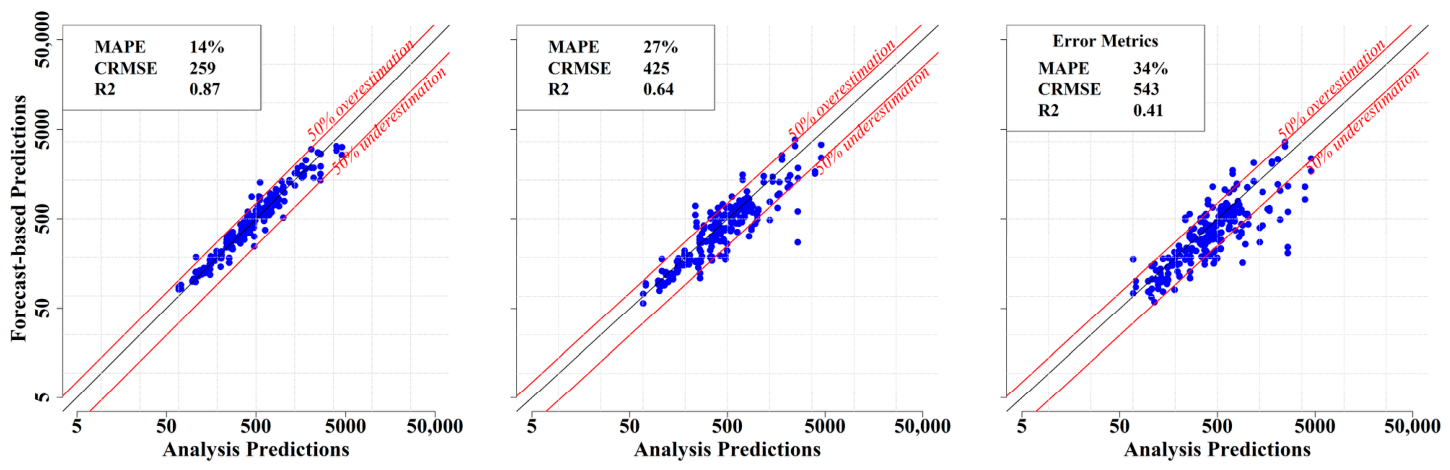
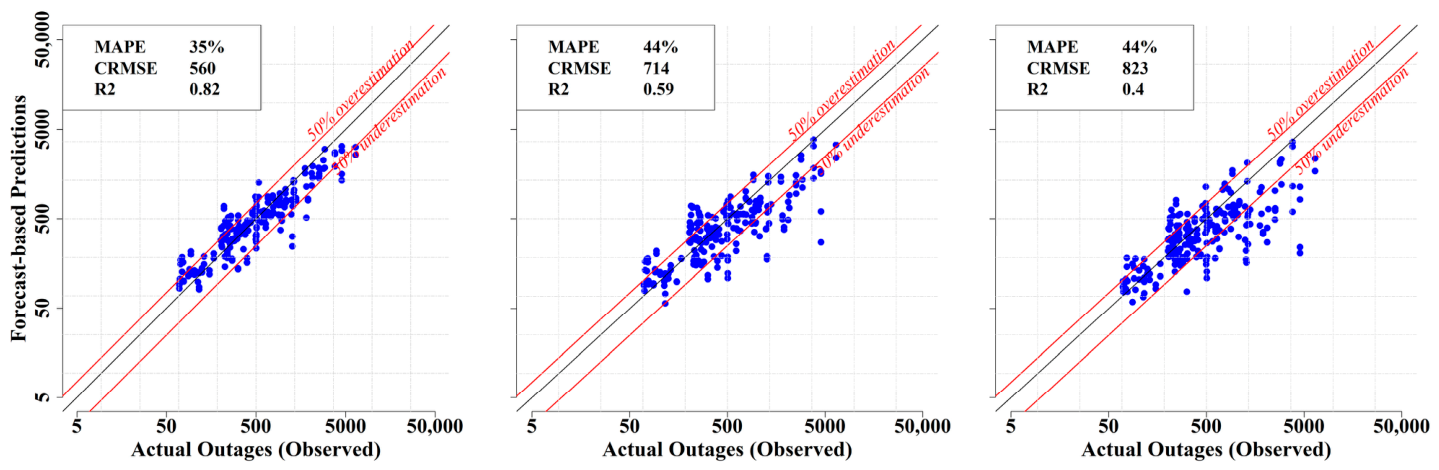
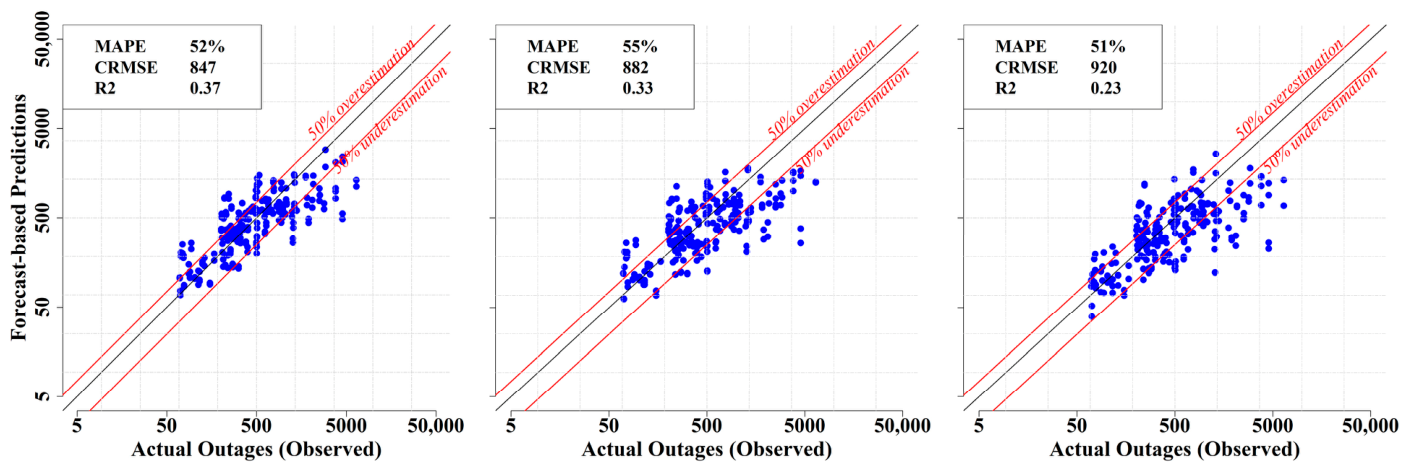
In the FFAP scenario, CRMSE increased by more than 100% from short to long lead times (259 → 543), confirming that weather forecast degradation alone substantially reduces prediction accuracy. By contrast, in the LFAO scenario—which reflects real-world conditions with unseen storms—CRMSE is already elevated at short lead times (847), more than three times higher than in FFAP. This highlights that model generalization error is the dominant source of uncertainty when predicting outages for unseen events. Within LFAO, CRMSE rises only ~9% from short to long lead times (847 → 920), suggesting that once generalization dominates, additional forecast degradation has a marginal effect. The FFAO scenario lies between these two extremes. At short lead times, LFAO CRMSE is 51% higher than FFAO (847 vs. 560), again emphasizing the impact of generalization error (
Table 4).
Overall, two key findings emerge:
Longer lead times consistently degrade weather forecast accuracy, particularly under controlled conditions.
Model generalization error is a major source of uncertainty, especially for previously unseen storm events.
3.2. Scenario-Based Performance Comparison
This section compares model performance across the three evaluation scenarios (FFAP, FFAO, and LFAO) to highlight how forecast-error effects and model generalization affect outage prediction.
3.2.1. FFAP Scenario (FULL Forecast-Analysis Predictions)
In FFAP, the model is tested with forecast inputs and compared against its own analysis-based predictions. Errors increased steadily with lead time, but overall performance remained relatively robust. At long lead times (4–5 d), MAPE rose to 34%, CRMSE to 543, and R
2 declined to 0.41 (
Figure 5). This scenario isolates the effect of degraded forecast inputs, offering a clean baseline for weather-induced uncertainty.
3.2.2. FFAO Scenario (FULL Forecast-Actual Outages)
In FFAO, the model is tested with forecast inputs and evaluated against observed outages for storms already included in the training dataset. Errors are lower than in LFAO but increase with lead time. At short lead times, CRMSE is 560 (MAPE 35%, R
2 0.82), while at long lead times CRMSE rises to 823 (MAPE 44%, R
2 0.40) (
Figure 6). These results demonstrate that forecast accuracy remains critical even for previously seen storms, showing that weather-input degradation can substantially reduce predictive skill even when model generalization error is minimized.
3.2.3. LFAO Scenario (LOOCV Forecast-Actual Outages)
LFAO represents the most realistic operational setting, where the model is tested on unseen storms using forecast inputs. At short lead times, CRMSE is 847 (MAPE 52%, R
2 0.37), increasing modestly to 920 (MAPE 51%, R
2 0.23) at long lead times (
Figure 7).
Errors were consistently highest across all lead times, underscoring the compounded effects of forecast degradation, model generalization, and residual observational or aggregation-related variability in real-world conditions.
Together, these comparisons show that FFAP isolates weather forecast degradation; FFAO captures forecast uncertainty without generalization, and LFAO reveals the combined challenges of forecasting outages for unseen events.
3.3. Impact of Storm Severity
To evaluate how storm intensity influences prediction accuracy, events were organized into low, middle, and high severity groups based on the territory-normalized severity score described in the
Section 2. The low and high groups contain an equal number of events, enabling a balanced comparison across intensity levels.
Table 5 shows that the impact of storm severity on prediction accuracy is strongly metric-dependent. In most scenarios, high-severity storms exhibit substantially larger absolute errors (higher CRMSE values) compared to low-severity storms, reflecting the larger outage counts associated with intense events. R
2 values for high-severity storms are also lower in several scenarios, particularly under LFAO, indicating greater unexplained variance when predicting the most damaging events. In contrast, low-severity storms show higher relative errors in some observed outage scenarios, particularly under LFAO, which is expected because smaller outage totals make percentage-based metrics more sensitive.
To further break down the sources of errors,
Table 6 groups all uncertainty sources that are not model error or lead-time error into a single category labeled “Noises”. This category includes any residual variability not explicitly separated in our scenario design, such as variability in reported outage counts, spatial/temporal aggregation differences, and other non-model random effects. Because the focus of this analysis is on model generalization error and forecast-lead-time degradation, we do not further partition these additional uncertainties and instead treat them collectively as “Noises”. Notably:
In FFAP, CRMSE increases sharply for low-impact (44%) and high-impact (102%) events, reflecting pure forecast degradation with a fixed model (no noise).
In FFAO, the increase is more moderate (+13% low, +46% high), since noise is included, but model generalization uncertainties are minimized.
In LFAO, where all uncertainty sources are present, the increase is smallest (+1% low, +8% high), suggesting that once generalization dominates, additional forecast degradation contributes relatively less to overall error growth.
These patterns highlight that storm severity interacts with forecast degradation and model generalization differently across error metrics.
3.4. Weather Forecast Input Error Analysis
Since the OPM relies on meteorological inputs, we examined how forecast errors in key weather drivers change with lead time. We analyzed five variables: maximum and average gust, maximum and average wind speed, and total precipitation. We focused on these because prior outage prediction studies in the northeast consistently identified wind/gust exposure and, when relevant in extratropical events, precipitation intensity/phase, as dominant drivers of power-distribution line failures [
25,
26], and because they allow a straightforward comparison between WRF forecasts, WRF analysis, and ground-station observations to quantify lead-time-dependent forecast degradation. The OPM itself still uses the full operational predictor set (meteorological, infrastructure, environmental variables); this weather-error assessment is a targeted diagnostic, not a restriction of OPM inputs.
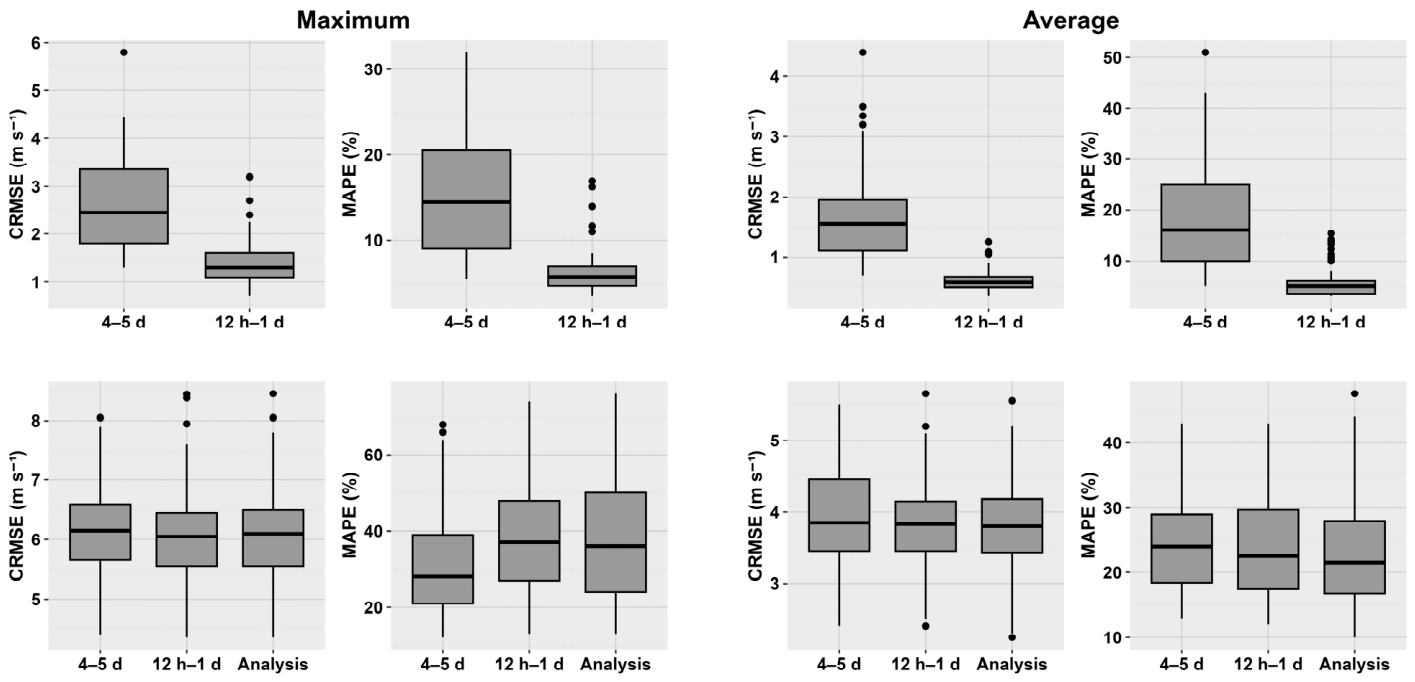
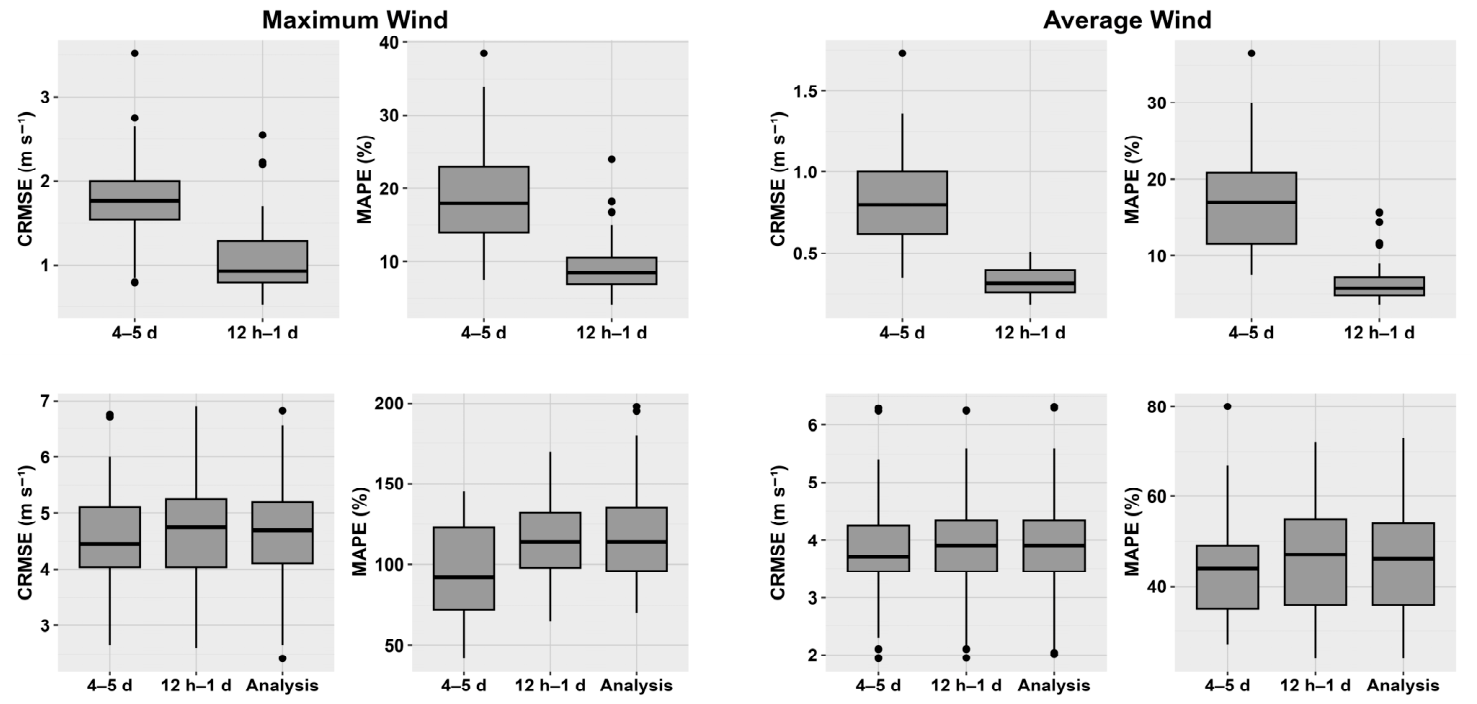
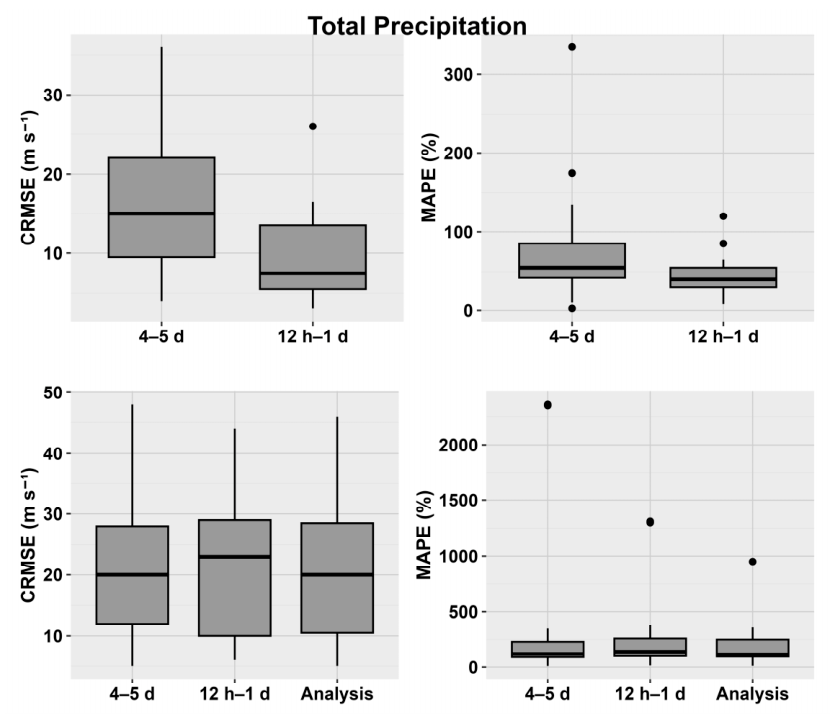
For each storm, we computed event-level forecast-error metrics—Centered RMSE (CRMSE) and Mean Absolute Percentage Error (MAPE)—between WRF forecasts and a reference (WRF analysis or ASOS observations), yielding one CRMSE and one MAPE value per storm for each variable and lead-time category.
Figure 8,
Figure 9 and
Figure 10 show box plots of per-storm CRMSE and MAPE distributions, allowing us to compare how event-level forecast errors vary across lead-time categories and reference datasets.
3.4.1. Maximum and Average Gust
Gust-related variables show the greatest sensitivity to lead time. At short lead times, the per-storm CRMSE distributions for both maximum and average gust remain compact when forecasts are verified against the WRF analysis. However, as lead time increases, these distributions widen substantially, with the most pronounced spread occurring for maximum gust when verified against ASOS station observations. This behavior reflects the inherent difficulty of capturing short-lived turbulent gust processes in mesoscale numerical weather models and highlights maximum gust as one of the most error-amplifying meteorological drivers within the outage prediction chain, consistent with prior findings that gust- and wind-related forecast uncertainty is a primary contributor to outage model error growth [
17,
18].
3.4.2. Maximum and Average Wind Speed
Wind speed forecast errors follow a similar trend but are generally narrower than gust errors. In the forecast-versus-analysis comparison, the per-storm CRMSE distributions for both maximum and average wind speed are tight at short lead times and widen steadily as lead time increases. When verified against station observations, the broadening becomes more pronounced, especially for maximum wind speed, which shows larger errors and more frequent outliers at longer horizons. Average wind speed remains comparatively stable, although its distribution also expands with lead time. These increasing wind speed errors contribute directly to the degradation in outage prediction skill at longer forecast lead times.
3.4.3. Total Precipitation
Precipitation errors also increase with lead time, although the effect is more moderate than for wind-related variables. The box plots of per-storm CRMSE and MAPE show that forecast-versus-analysis errors remain relatively compact at short lead times and increase gradually as the forecast horizon extends. When forecasts are verified against ASOS station observations, the spread becomes larger, reflecting the difficulty of predicting the magnitude and timing of precipitation in extratropical systems. Although precipitation errors are generally smaller than those associated with winds or gusts, precipitation can still influence outage risk by wetting vegetation or saturating soils, making it a meaningful secondary contributor to forecast-error propagation in the OPM framework (
Figure 10).
4. Discussion
This study shows that weather forecast lead time affects outage prediction accuracy, even when the OPM structure remains unchanged. By comparing FFAP, FFAO, and LFAO scenarios, we examined how forecast-error effects and model generalization contribute to prediction error under both controlled and more realistic operational settings. The goal of this work is not to introduce a new OPM architecture but to understand how forecast degradation propagates through an established GBM-based OPM [
26].
4.1. Meteorological Drivers of Forecast Error
The weather-error analysis shows that gust- and wind-related variables are the most sensitive to lead time. Maximum gust shows the largest spread and most frequent outliers, especially when forecasts are verified against ASOS observations rather than WRF analysis. This result is consistent with previous studies showing that wind and gust forecast errors are important contributors to outage prediction uncertainty and can increase with forecast lead time [
17,
18].
Wind speed errors follow a similar pattern, although they are generally less variable than gust errors. Average wind speed remains more stable, but its error still increases with lead time. Precipitation errors also grow with lead time, but the increase is more moderate than for wind and gust variables. Even so, precipitation can still contribute to outage risk by wetting vegetation or saturating soils, especially during rain–wind events [
7,
17].
Overall, these results show that degradation in key meteorological inputs, especially maximum gust and wind speed, is an important pathway through which forecast errors affect outage prediction. This also explains why forecast-driven errors become more visible at longer lead times, particularly when the model is evaluated against observed weather and outage conditions [
17,
18].
4.2. Role of Model Generalization
The scenario-based results show that forecast degradation and model generalization affect OPM performance in different ways. In FFAP, forecast-based predictions are compared with analysis-based predictions from the same FULL model. Because the model and storm set are fixed, this scenario mainly reflects the effect of replacing analysis inputs with forecast inputs.
In FFAO, forecast-based predictions are compared with observed outages for storms that were included in training. This setup minimizes storm-level generalization error but still includes forecast-input error and residual variability in observed outages. The results show that forecast accuracy remains important even for storms already seen by the model.
LFAO provides the most realistic evaluation because the model is tested on unseen storms. Errors are highest in this scenario, showing that model generalization adds a large baseline level of error. This agrees with earlier outage prediction studies emphasizing the importance of out-of-sample validation and careful treatment of model training uncertainty [
5,
25]. However, the increase from short to long lead times is smaller in LFAO than in FFAP, suggesting that once generalization error becomes dominant, additional forecast degradation contributes less to total error growth.
These scenarios should be interpreted as a practical scenario-based attribution framework, not as a formal statistical variance decomposition. They help show how prediction error changes such as forecast degradation, observed outage variability, and unseen storm testing are introduced step by step.
4.3. Influence of Storm Severity
Storm severity also affects model performance. High-impact storms generally have larger absolute errors because they produce larger outage totals and more widespread damage. However, larger outage signals do not always mean better model performance. In several cases, R2 is lower for high-impact storms, showing that the model still struggles to explain variability during the most damaging events.
Low-impact storms behave differently. Their outage totals are smaller and often more localized, so percentage-based errors such as MAPE can become more sensitive to small absolute differences. This is why low-severity events show higher relative errors in some observed outage scenarios, especially under LFAO. This pattern is consistent with previous studies showing that outage impacts depend not only on hazard intensity but also on spatially heterogeneous infrastructure, vegetation, and local vulnerability conditions [
3,
6,
37,
38,
39].
These findings highlight why CRMSE, MAPE, and R2 should be interpreted together. Each metric captures a different part of model performance, and relying on one metric alone can be misleading, especially when comparing low- and high-impact storms.
4.4. Operational Implications and Future Improvements
The results highlight an important operational challenge: outage predictions depend not only on the OPM itself but also on the reliability of the weather forecasts used as input. Short-lead forecasts generally provide more reliable outage estimates, while longer-lead forecasts give utilities more preparation time but come with larger forecast-error effects. This trade-off is important for emergency planning and resource allocation, where both timing and reliability matter [
17,
18].
Future improvements could include observation-informed bias correction for WRF inputs and lead-time-sensitive weighting of key predictors such as maximum gust and wind speed. These approaches could help the OPM adjust its sensitivity to weather inputs based on their expected reliability at different lead times. In addition, probabilistic outage forecasts or prediction intervals would better represent the range of possible outage outcomes, especially for longer lead times and unseen high-impact storms [
13,
29].
Because this study focuses on high-impact storms, the results should be interpreted within that context. These events are most important for preparedness and emergency response, but models focused on high-impact events should not be directly generalized to routine storms without calibration. Future work should include broader storm climatology, event-severity calibration, and probabilistic post-processing to improve reliability across the full range of storm conditions.
5. Conclusions
This study assessed how weather forecast lead time affects storm-induced outage prediction accuracy in New England using an established GBM-based outage prediction model. By comparing FFAP, FFAO, and LFAO scenarios, we separated the effects of weather forecast degradation from model generalization under both controlled and operationally realistic settings.
The results show that prediction error generally increases with lead time, especially when forecast inputs are compared against analysis-based or observation-based references. Gust and wind-speed variables were the most sensitive to lead time, with maximum gust showing the largest spread and most frequent outliers. These errors help explain why outage prediction skill decreases as the forecast horizon extends.
Model generalization was also a major source of errors. Under LFAO, where the model was tested on unseen storms, errors were consistently higher than in FFAP and FFAO. This shows the importance of evaluating outage models under unseen storm conditions rather than relying only on fully trained or in-sample performance.
Storm severity also influenced model performance. High-impact storms produced larger absolute errors, while low-impact storms were more sensitive to percentage-based metrics such as MAPE. This highlights the need to interpret CRMSE, MAPE, and R2 together when evaluating outage prediction skills across different storm severities.
Overall, the findings show that outage prediction reliability depends on both weather forecast quality and model generalization. Future work should focus on observation-informed bias correction, lead-time-sensitive reliability weighting of key weather predictors, and probabilistic prediction intervals to better support operational decision making.




 ,
,