


Highlights
What are the main findings?
- A GPU-based framework for multi-SKU demand forecasting is proposed.
- GPU computing accelerates probabilistic forecasting by factors ranging from 28× to 42×.
What are the implications of the main findings?
- Organizations managing large SKU portfolios can generate probabilistic forecasts much faster than with conventional CPU-based implementations.
- Reduced computational times make it feasible to update forecasts, safety stocks, and reorder points more frequently.
Abstract
High-performance computing based on general-purpose graphical processing units (GPUs) is a powerful tool for reducing computational time. In a context where big data is becoming increasingly relevant, GPUs may play a crucial role. This study analyzes the performance of GPUs by implementing probabilistic forecasts based on single exponential smoothing combined with simulated predictive distributions. In supply chain environments, companies must generate a large number of forecasts at the SKU level. Therefore, reducing computational time can provide a significant competitive advantage. Since forecasts are typically computed independently for each SKU, the problem is naturally parallelizable, making it well-suited for GPU computing. To the best of the authors’ knowledge, this is the first study to apply GPU computing to demand forecasting in a supply chain context. First, we show how to adapt typical probabilistic forecasting algorithms to a parallel computing framework. Then, real data from a manufacturing company are used to compare GPU and traditional CPU implementations.Theresults indicate that GPUs can deliver computational speedups ranging from 28 to 42 times relative to CPU-based implementations.
1. Introduction
The digitalization of the world is generating massive amounts of data from a wide range of sources [1]. In a supply chain context, these data sources include enterprise resource planning (ERP) systems, distributed manufacturing environments, logistics operations, social media, customer purchasing behavior, and technology-driven sources such as global positioning systems (GPSs), radio frequency identification (RFID), and mobile devices [2,3].
Handling such large and heterogeneous datasets challenges traditional data analysis methods [1,4]. As a result, organizations must deal with big data characterized by the well-known 4Vs: volume, velocity, variety, and value. More recently, a fifth dimension (veracity) has been introduced to account for data quality and governance issues [5,6]. Essentially, as data size increases, managing and analyzing them in order to extract useful business insights becomes more challenging.
One of the main benefits of big data is the potential to improve forecasting accuracy, leading to better customer service levels and lower inventory costs, waste, and working capital [7]. In this context, predictive analytics has been identified as a key tool for extracting value from large datasets [4]. Unlike traditional forecasting methods, predictive analytics tends to place less emphasis on statistical significance, as it operates in large-sample settings, and instead highlights the importance of computational efficiency.
Despite these advantages, there is still a lack of empirical studies addressing how forecasting methods should be adapted to big data environments. Nguyen et al. [8] show that only 3 out of 88 papers focus on demand forecasting within big data contexts.
Nikolopoulos and Petropoulos [9] aim to shed light on forecasting in big data environments by focusing on the optimization stage. Their results show that less complex routines do not significantly reduce forecasting accuracy, while improving computational speed. They also highlight the limited progress made in incorporating information and communication technologies into forecasting practice. Similarly, Seaman [10] emphasizes the importance of model parallelizability and computational infrastructure in large-scale forecasting applications. In the same vein, Zhong et al. [11] point out that traditional serial algorithms are inefficient for big data applications.
Demand planning and inventory management require probabilistic forecasts to support supply chain decisions, such as safety stock and reorder point calculations. These forecasts capture both expected demand and its associated uncertainty. Traditionally, these estimates are computed using serial methods.
Although probabilistic forecasts can be based on theoretical models [12], the uncertainty associated with parameter estimation is often neglected [13]. Simulation-based approaches, such as those based on predictive distributions, offer a solution to this limitation [14] (p. 77). In some complex models, simulation is the only available method [14] (p. 79). However, the main drawback of these approaches is their high computational cost.
This study aims to explore the use of GPUs to accelerate the computation of probabilistic forecasts based on simulated predictive distributions. Specifically, we illustrate our approach using single exponential smoothing for point forecasting and Monte Carlo simulation for uncertainty estimation. The methodology is implemented in MATLAB using built-in GPU-compatible functions, thus avoiding the need for CUDA programming. Real data from a manufacturing company are used to illustrate the proposed approach. Because the original dataset contains only 173 SKUs, a large-scale dataset was generated through SKU resampling. Therefore, the results should be interpreted as evidence obtained from an artificially expanded dataset rather than from a naturally occurring heterogeneous big data setting.
The rest of the paper is organized as follows. Section 2 explains the main characteristics of GPUs. Section 3 describes the forecasting methodology. Section 4 presents the evaluation metrics. Section 5 presents and discusses the experimental results. Finally, Section 6 summarizes the main conclusions.
2. What Can GPUs Do for Probabilistic Demand Forecasting?
GPUs were originally designed for graphical processing tasks characterized by repetitive but not necessarily complex computations. The key idea is to divide the problem into independent units, process each unit separately, and then combine the results.
With the introduction of CUDA, GPU computing has evolved towards general-purpose computing. GPUs are most effective when two conditions are met: (i) computations are computationally intensive, and (ii) tasks can be massively parallelized.
Demand forecasting satisfies both conditions. On the one hand, forecasts can be computed independently for each SKU, which makes the problem highly parallelizable. On the other hand, forecasting procedures often rely on Monte Carlo experiments with many replications, making them computationally demanding.
Therefore, GPU computing is expected to significantly reduce computation time, which may represent a competitive advantage in a big data-driven environment. However, parallel programming differs from traditional programming paradigms. Fortunately, tools such as MATLAB provide built-in functions that allow users to exploit GPU capabilities with minimal modifications to standard code.
GPUs are increasingly used in applications such as data mining [15], dynamic programming [16,17], graph problems [18], and genetic algorithms [19], although their application to predictive analytics remains limited [20,21].
3. Probabilistic Forecasts
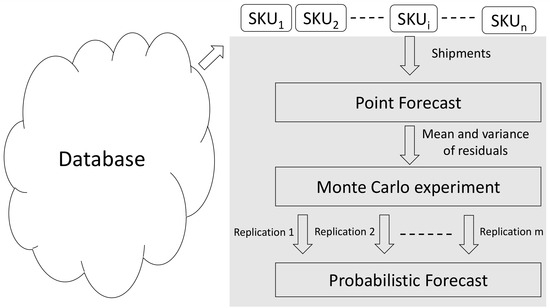
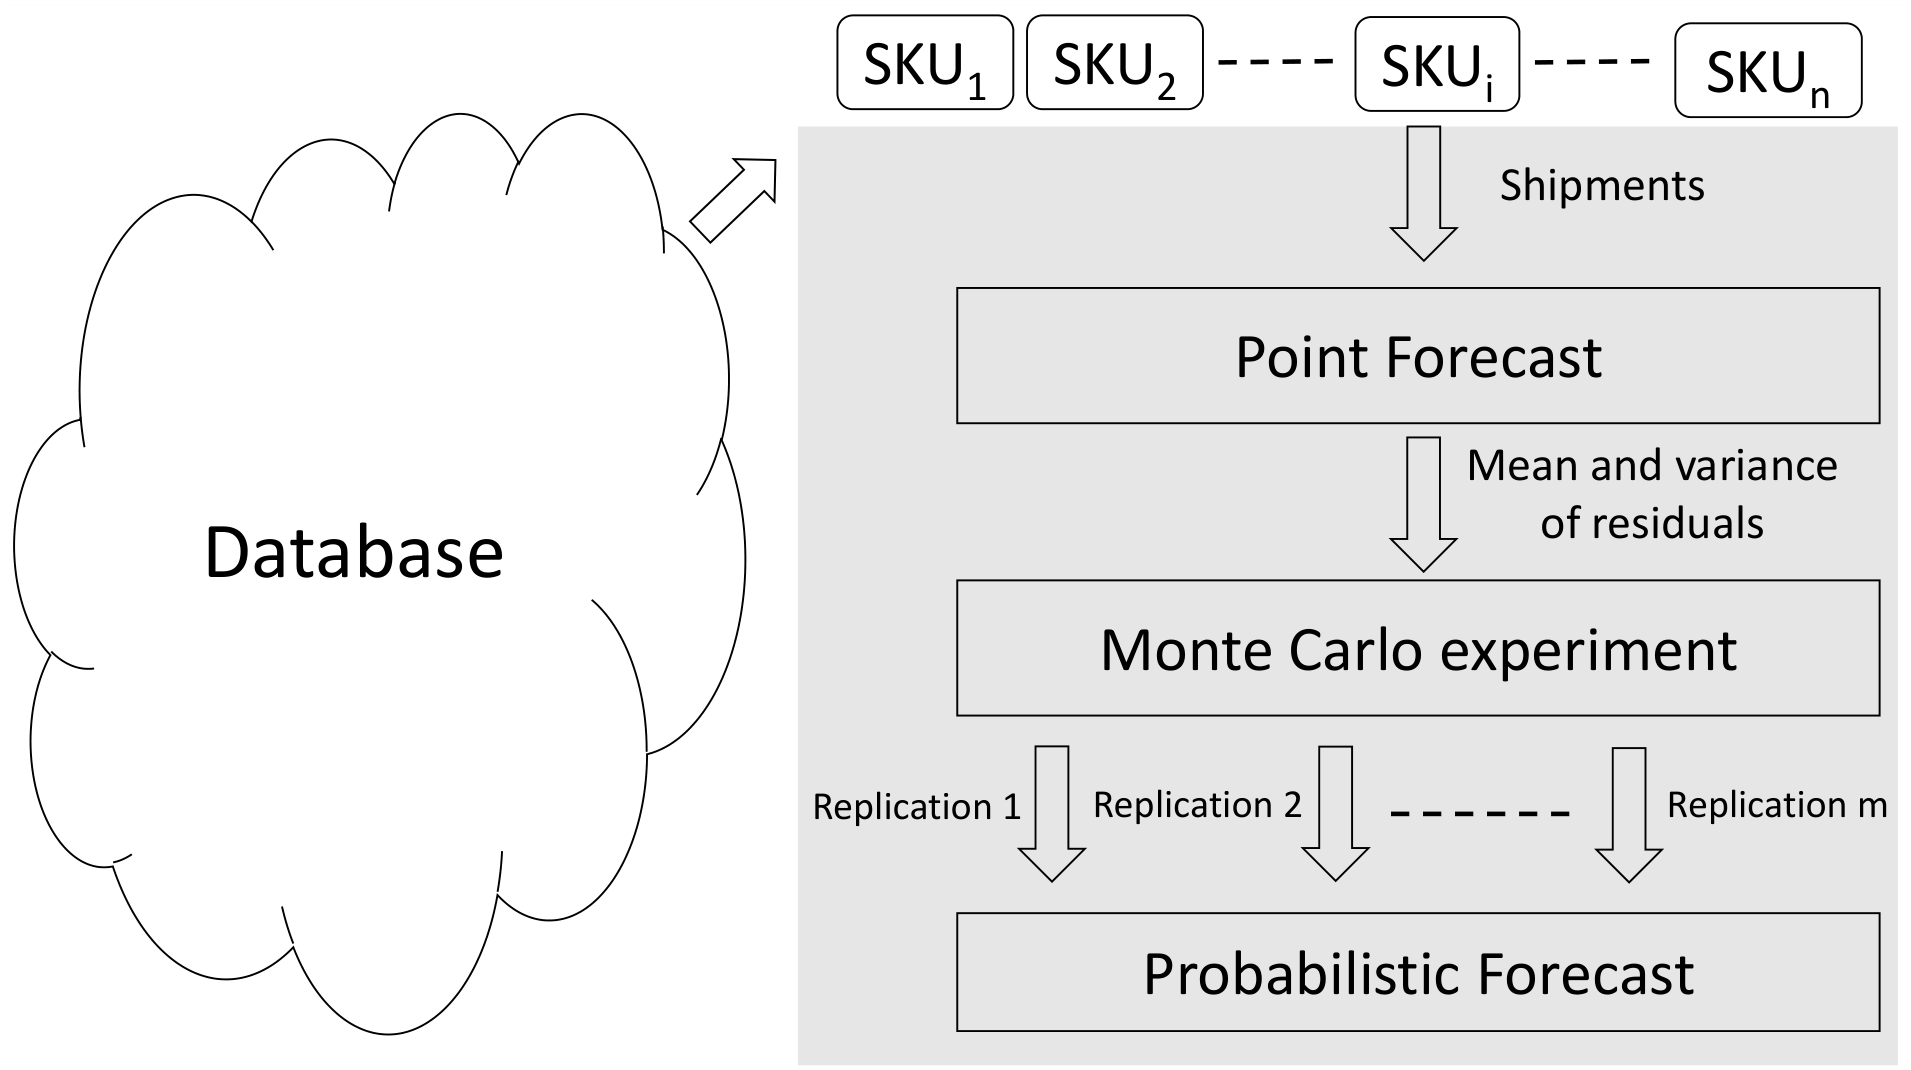
In this section, we describe how probabilistic forecasts are computed following the scheme shown in Figure 1, which is divided into three stages.
Figure 1.
Scheme of probabilistic forecasts calculation.
First, the shipment/sales data for n SKUs are obtained from the company database, and point forecasts are computed for each SKU. Second, based on these point forecasts, the mean and variance of the residuals are calculated and used as inputs for a Monte Carlo simulation that generates m replications. Third, probabilistic forecasts are obtained from these simulated replications. The following subsections describe each stage in detail.
3.1. Point Forecasting
3.1.1. Single Exponential Smoothing (SES)
Point forecasts are computed using SKU shipment data as input. The forecasting algorithm provides a measure of the central tendency of the predictive distribution.
Among the available forecasting methods, single exponential smoothing (SES) is selected for two reasons. First, SES is widely used in business applications [22,23]. Second, it reflects common practice, where companies often rely on simple models due to limited expertise or restricted software capabilities [24].
The SES model is defined as follows [25]:
where is the smoothing parameter, is the observed value, and is the h-step-ahead forecast at time t.
Due to the recursive nature of SES, the model must be initialized. We use , which is appropriate in large datasets where the impact of initialization is negligible [25].
The recursive formulation in Equation (1) poses challenges for GPU implementation, as it requires sequential computation through loops. Although this formulation is memory-efficient, as it does not require storing all past observations, it limits parallelization.
To overcome this limitation, SES can be expressed as a transfer function and implemented using MATLAB’s built-in filter function. The transfer function representation of SES is given by the following [26]:
where Z is the Z-transform, such as .
3.1.2. Optimization: Grid Search vs. Fmincon
The smoothing parameter is optimized using a grid search (also known as parameter sweep or exhaustive search) [9]. This method evaluates values of over the interval using a predefined number of grid points (), with step size .
For each value of , the Mean Squared Error (MSE) is computed as follows:
where N is the sample size used for training. The optimal is the one that minimizes the one-step-ahead MSE. Previous studies show that this simple approach achieves similar forecasting accuracy to more complex optimization methods, with significantly lower computational cost [9].
The optimization can be performed either serially (Algorithm 1) or in parallel (Algorithm 2). In the parallel implementation, the SES model is computed simultaneously for all SKUs by removing the outer loop present in the serial approach. This is particularly beneficial when .
| Algorithm 1 Grid search optimization (CPU serial computing) |
|
| Algorithm 2 Grid search optimization (GPU parallel computing across n SKUs) |
|
3.2. Monte Carlo Experiment
In addition to point forecasts, residuals are computed as the difference between forecasts and observed values in the test set. These residuals provide estimates of the forecast error distribution.
Monte Carlo simulations are then used to generate predictive distributions. The rationale behind these simulations is to incorporate the uncertainty associated to the smoothing constant () estimate, following the approach described in [14] (chapter 6.1). The j-th replication for SKU i is defined as follows:
where is a random variable generated from a Gaussian distribution with mean and variance estimated from the residuals.
The parameters of the distribution are computed using the test set to avoid underestimating forecast uncertainty. A total of m replications are generated for each SKU. In the later simulations, the value of m is set to 5000.
According to MATLAB 2018b, the Philox 4 × 32 random number generator is particularly well-suited for GPU implementations due to its efficiency in parallel environments. Therefore, it is used in this study with the following MATLAB command: gpurng(0, ’Philox4×32-10’).
Although alternative approaches such as bootstrapping or non-Gaussian distributions may be considered, these methods are not directly available as built-in GPU-compatible functions in MATLAB, and are therefore not used here.
3.3. Probabilistic Forecast
The m simulated replications are used to construct an empirical predictive distribution for each SKU. From this distribution, quantiles of interest can be obtained using the MATLAB function prctile.
In supply chain applications, the relevant quantile is determined by the Cycle Service Level (CSL) [27], which reflects the trade-off between stockout and holding costs.
Overall, the parallel implementation removes the computational bottlenecks associated with Monte Carlo simulations, enabling efficient probabilistic forecasting in large-scale environments (Algorithms 3 and 4).
| Algorithm 3 Calculation of probabilistic forecasts (CPU serial computing) |
|
| Algorithm 4 Calculation of probabilistic forecasts (GPU parallel computing across m replications) |
|
4. Evaluation Metrics
In this study, we evaluate two key aspects of forecasting performance: accuracy and computational efficiency.
Forecasting accuracy is measured using the Average Relative Mean Absolute Error (AvgRelMAE) [28]. This metric is defined as follows:
where
Here, denotes the Mean Absolute Error (MAE) obtained using SES for SKU i, while corresponds to the MAE of the Naïve benchmark method for the same SKU, both evaluated on the test set. The Naïve method uses the last observed value as the forecast for the next period. Therefore, indicates that SES outperforms the benchmark. Although other forecasting accuracy metrics, such as Mean Absolute Percentage Error (MAPE) and Median Absolute Percentage Error (MdAPE), may initially seem more intuitive, Davydenko and Fildes [28] discuss the limitations of these measures in multi-SKU supply chain forecasting and recommend the AvgRelMAE metric instead.
Computational efficiency is assessed using the speedup ratio [29], defined as follows:
This ratio quantifies the reduction in execution time achieved by GPU implementations relative to CPU-based approaches.
5. Experimental Results
In this section, we compare the computational performance of CPU and GPU implementations when computing probabilistic forecasts using a real-world dataset. The dataset corresponds to an international UK-based company operating in the personal care sector and has been previously analyzed by Barrow and Kourentzes [30].
The dataset consists of 173 SKUs, each with 229 observations. Shipment data are used as a proxy for demand, which is predominantly continuous, with relatively few zero values. The data are split into two subsets: a training set (hold-in sample) comprising 80% of the observations (183 data points), and a test set (hold-out sample) consisting of the remaining 46 observations.
The smoothing parameter is optimized using the training set, while forecasting accuracy (AvgRelMAE) is evaluated on the test set. The forecasting horizon is set to one step ahead ().
All experiments are conducted on a machine equipped with two Intel Xeon processors at 3.00 GHz and 128 GB of RAM. The commercially available GPU hardware used is a Quadro GP100 with 16 GB of memory and 3584 CUDA cores. The code supporting the findings of this study is available from the corresponding author upon reasonable request.
5.1. Analysis of Forecasting Accuracy
The computation of probabilistic forecasts requires the specification of the grid size parameter (), which determines the granularity of the grid search optimization.
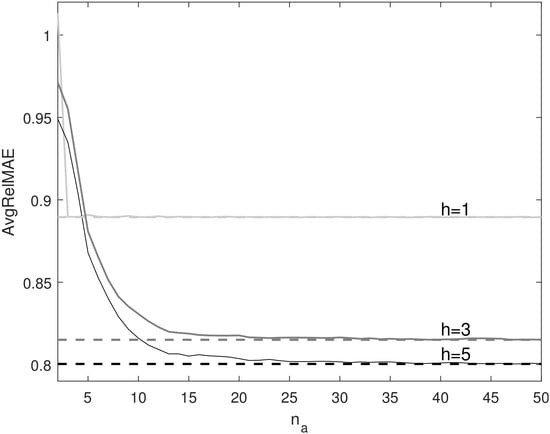
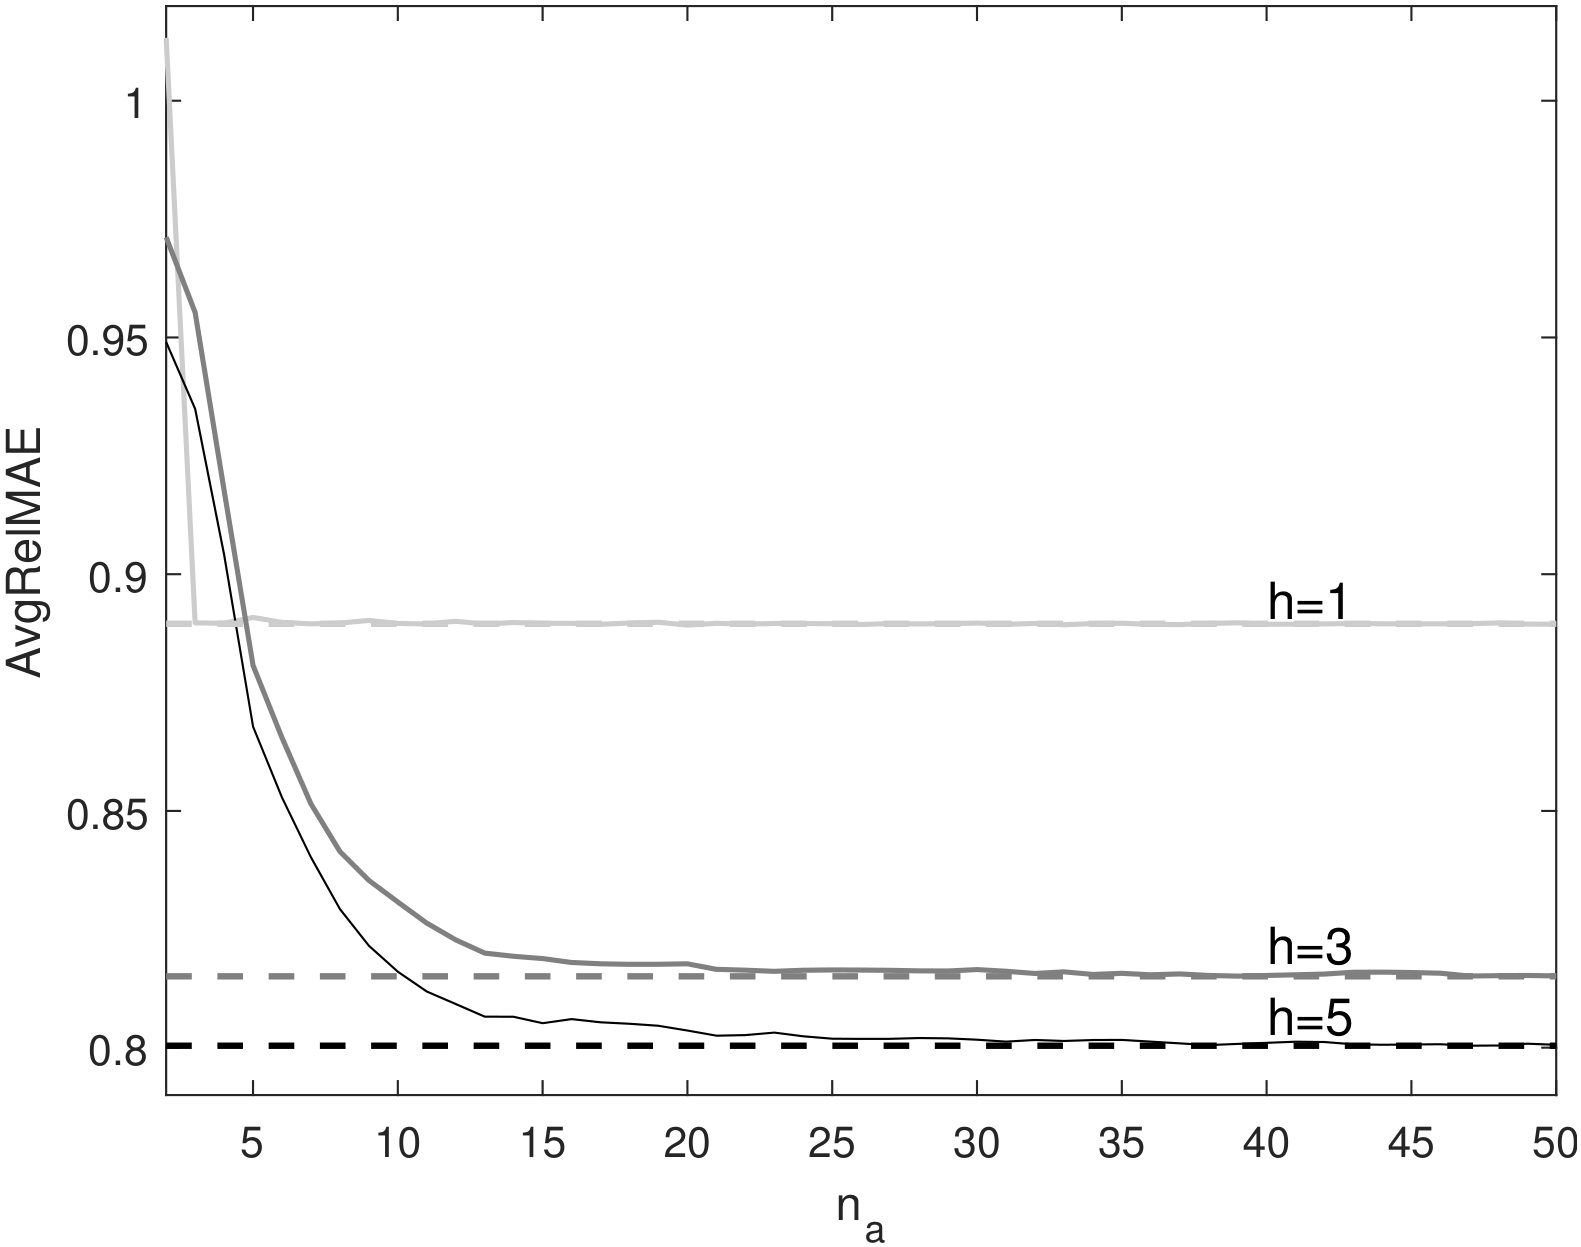
This section analyzes the influence of on forecasting accuracy. Figure 2 presents the AvgRelMAE obtained using SES for all 173 SKUs and multiple forecasting horizons (). The figure compares two optimization approaches: the standard MATLAB optimization routine (fmincon, represented by a dashed line) and the grid search method (solid line).
Figure 2.
AvgRelMAE versus grid size () obtained for both fmincon (dashed line) and grid search (solid line) optimization for , and across all SKUs.
The results show that the required value of to match the forecasting accuracy of fmincon depends on the forecasting horizon. Specifically, for , fewer than five grid points are sufficient to achieve comparable accuracy. For longer horizons, a grid size of approximately provides similar results.
These findings are consistent with [9,31], who report that relatively coarse grids can achieve competitive accuracy while significantly reducing computational complexity. Based on these results, a conservative value of is used in subsequent experiments.
5.2. Analysis of Computational Performance
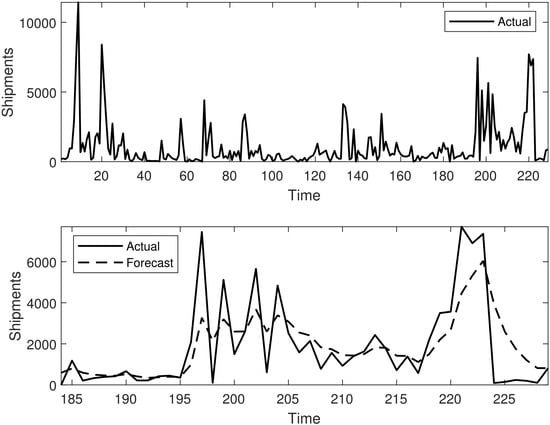
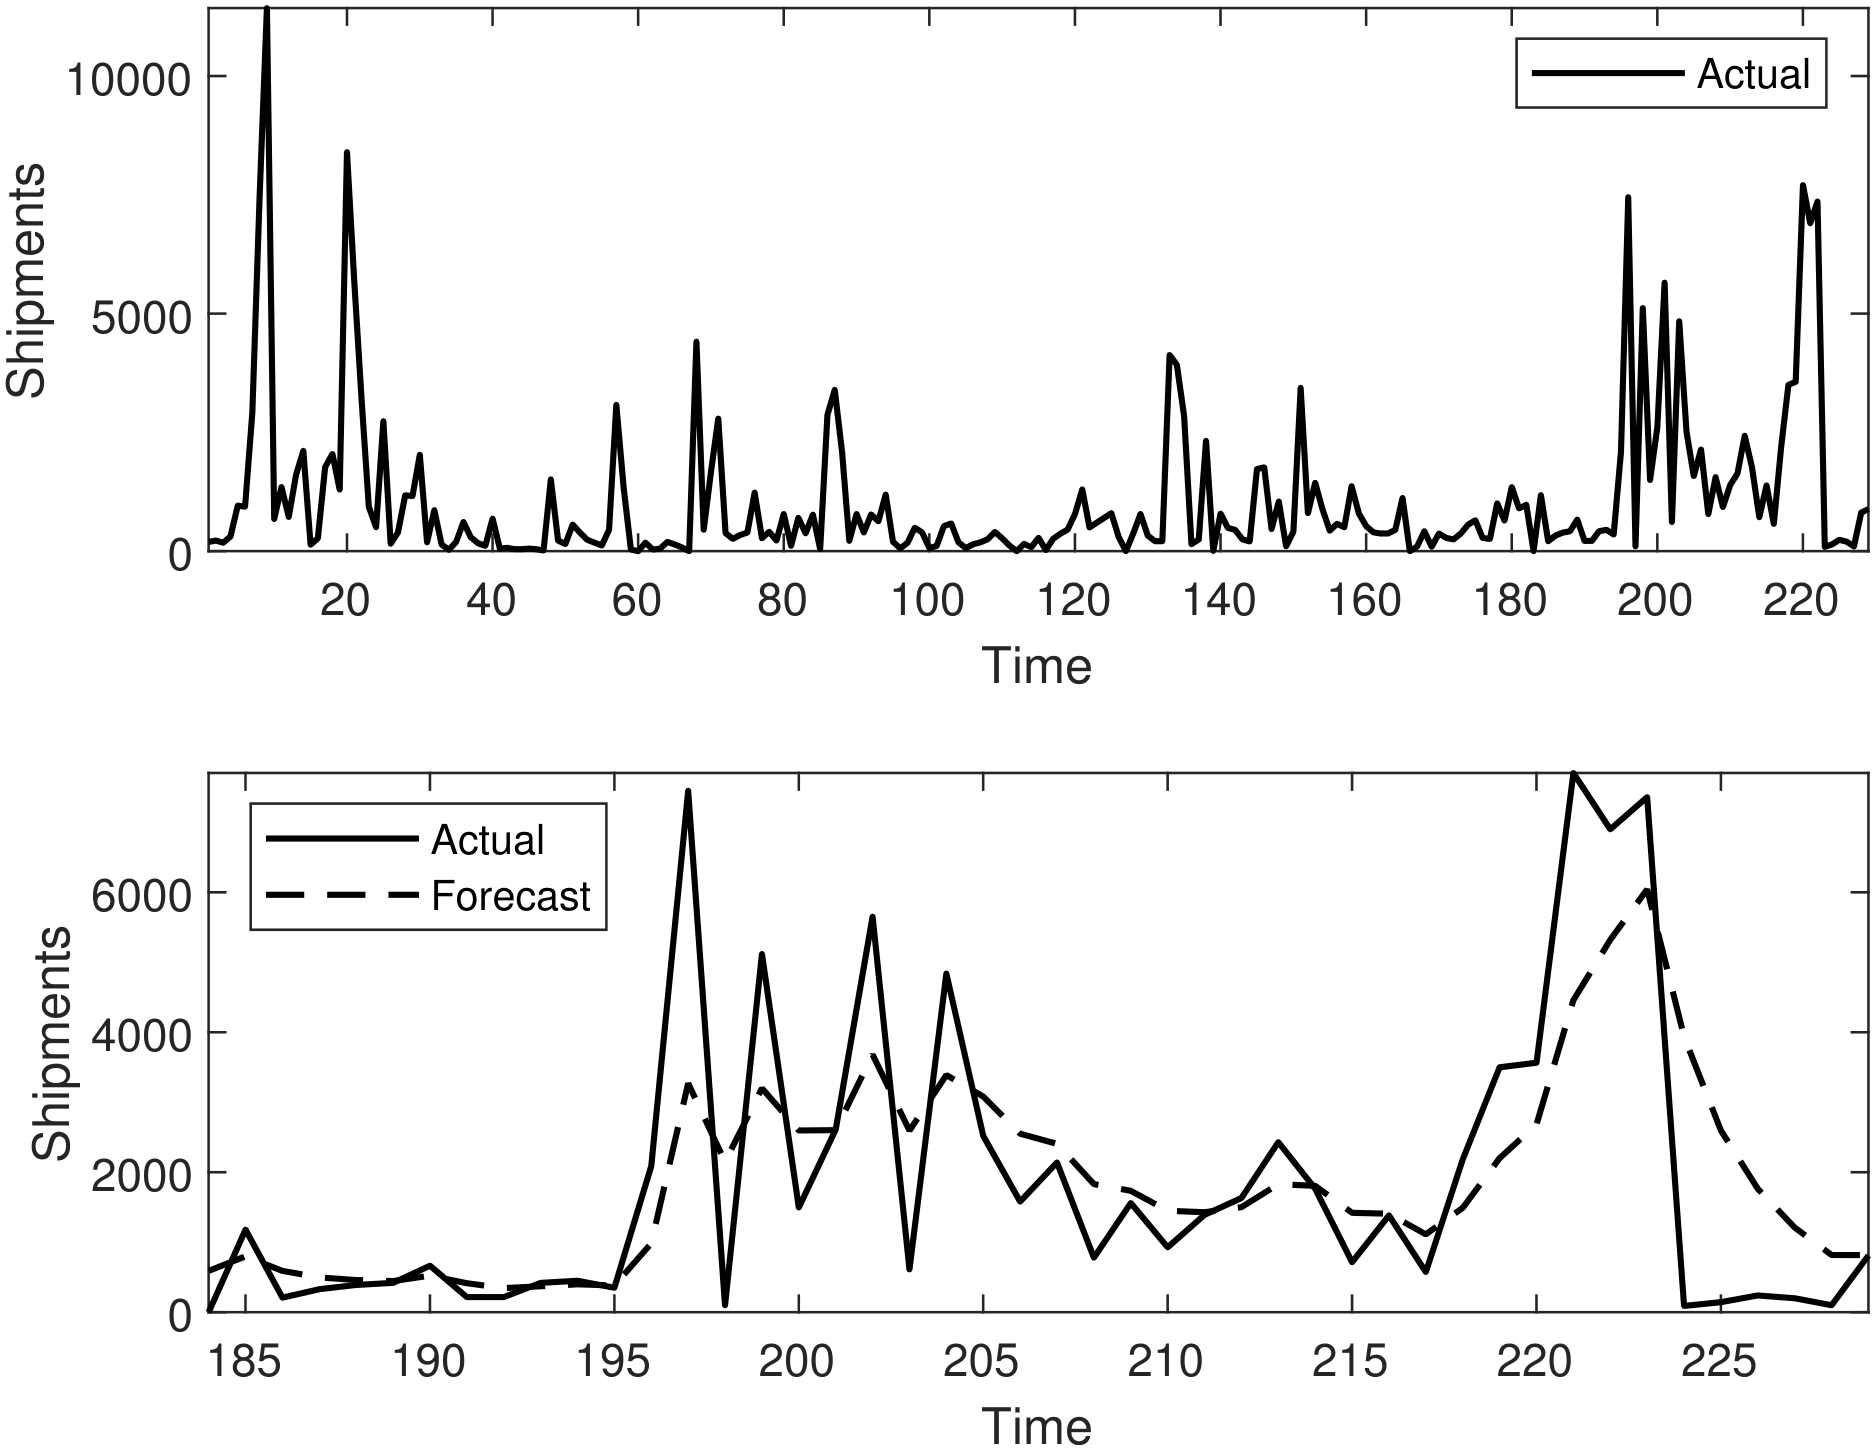
Figure 3 illustrates an example of shipments and forecasts for a representative SKU. The upper panel shows the full time series of shipments, while the lower panel presents forecasts and actual observations for the test set. Forecast errors are used to estimate the mean and standard deviation required for the Gaussian noise generation in the Monte Carlo simulation.
Figure 3.
Example of the shipments for a certain SKU. Upper panel shows all the observations. Lower panel shows the forecasts (dashed line) and actual observations (solid line) for the test set.
To evaluate scalability, the dataset is expanded through resampling with replacement, allowing us to analyze computational performance for larger numbers of SKUs.
Table 1 reports the speedup ratios obtained for different dataset sizes, ranging from 100 to 5000 SKUs. The first row compares the CPU implementation using fmincon with the GPU implementation based on grid search (). The results show that the GPU implementation is consistently faster than the CPU counterpart by a factor ranging from 32 to 42 times.
Table 1.
Speedup ratios calculated for different values of n and rounded to the nearest integer.
The second and third rows compare different grid sizes. In this case, both the CPU and GPU implementations use the same optimization routine (grid search) and the same value of . Again, the GPU achieves higher speedup ratios than its CPU counterpart. Additionally, higher values of n and smaller values of lead to higher speedup ratios, highlighting the importance of selecting an appropriate grid size.
An interesting observation is that the speedup ratio is maximized at approximately . This indicates that performance gains do not increase monotonically with dataset size, likely due to memory constraints and communication overhead between CPU and GPU.
These results have important implications for large-scale applications. When the number of SKUs becomes very large, memory limitations may require distributing computations across multiple GPUs.
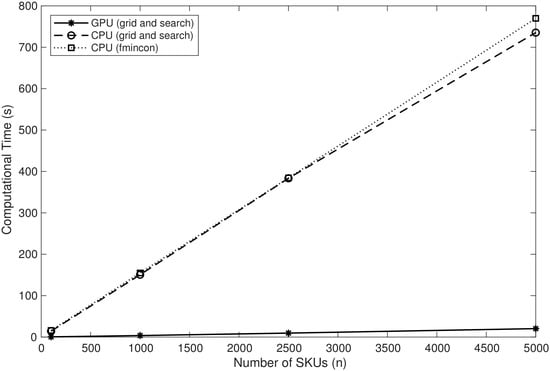
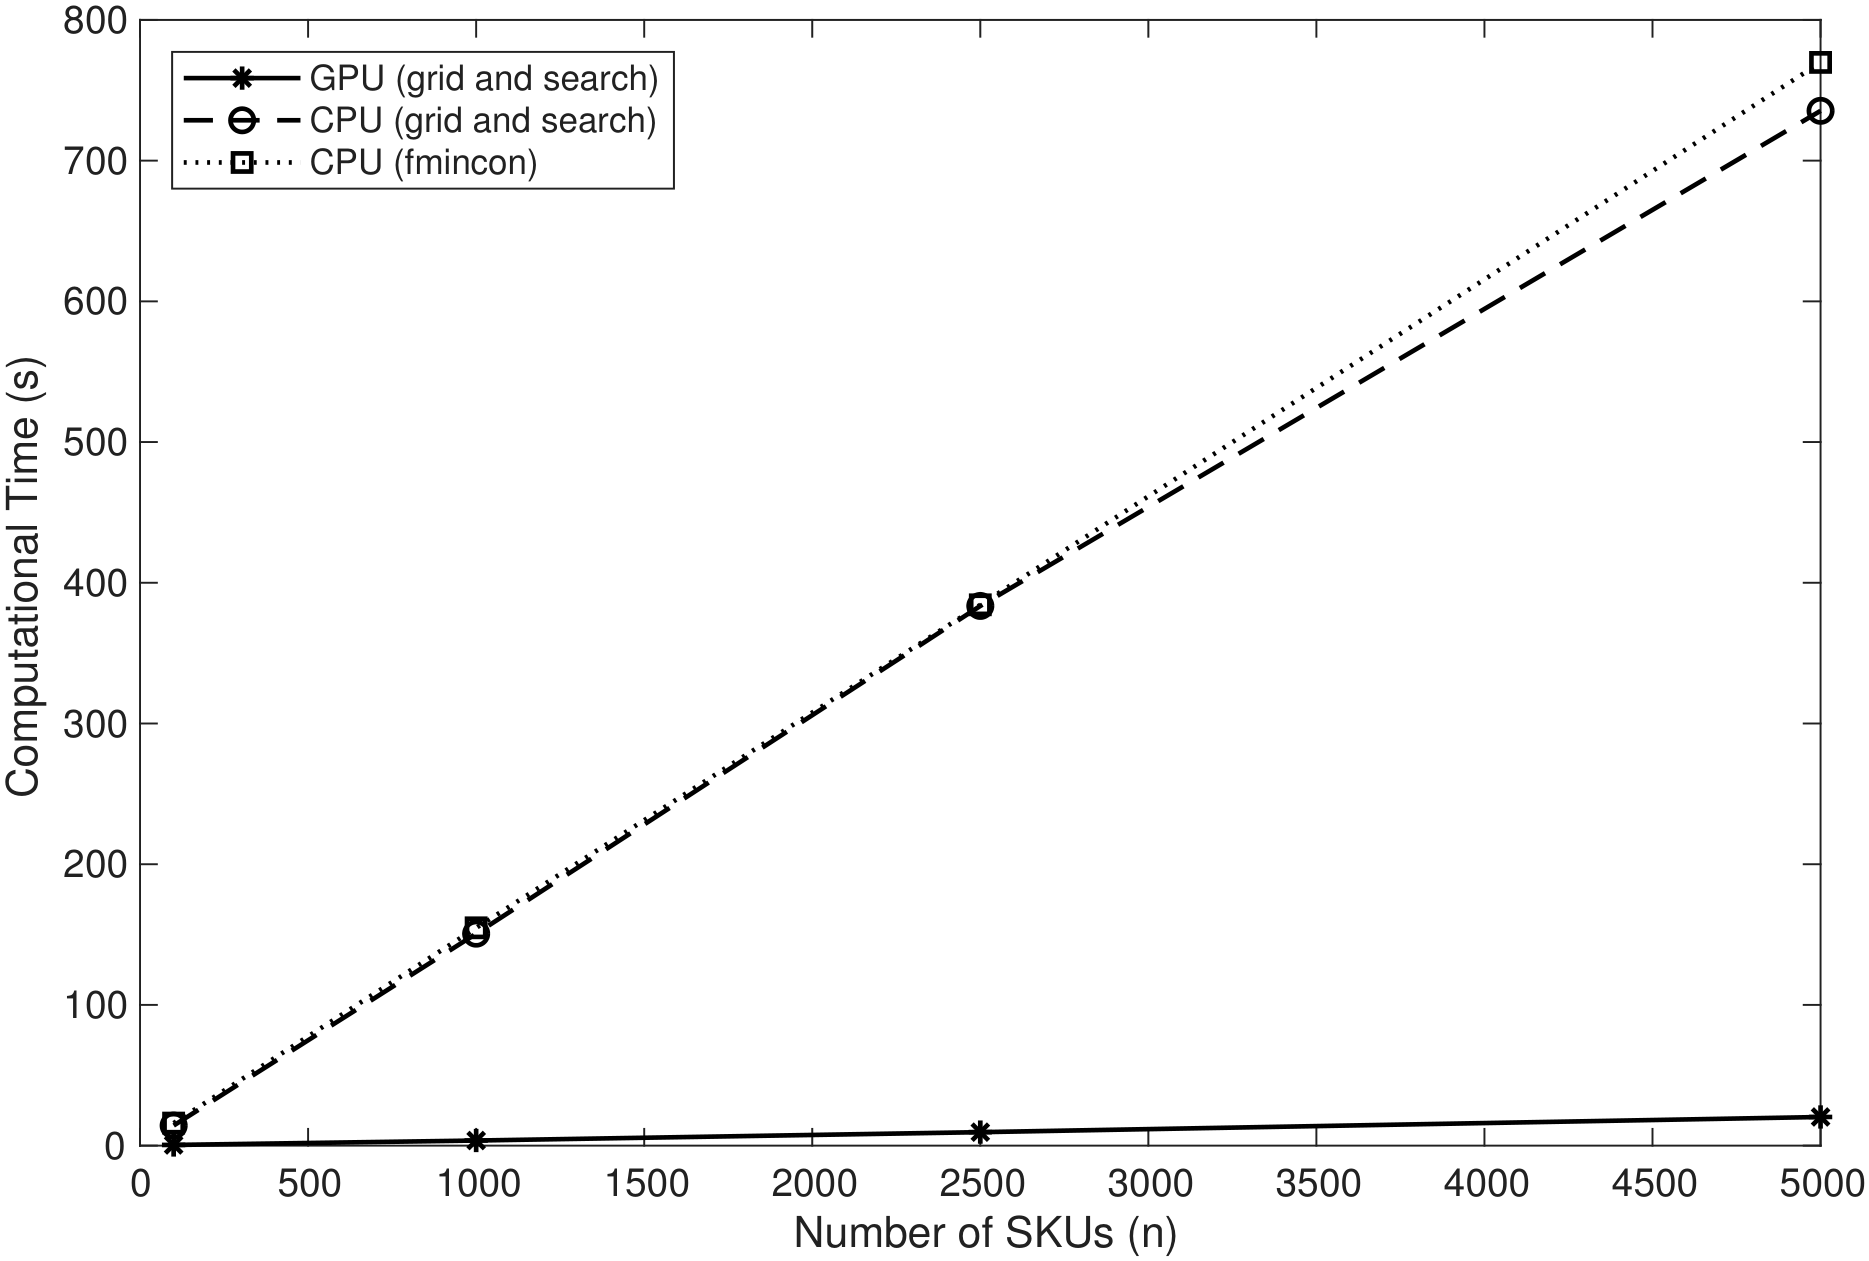
Figure 4 presents the computational time required to calculate probabilistic forecasts as a function of the number of SKUs. The results clearly show that GPU-based implementations significantly outperform CPU-based approaches, particularly as the dataset size increases. All GPU results are obtained using the grid search optimization method.
Figure 4.
Computational time required for calculating the probabilistic forecast for different number of SKUs (n).
Overall, the results demonstrate that GPU computing provides substantial improvements in computational efficiency while maintaining forecasting accuracy, making it a suitable approach for large-scale probabilistic forecasting in supply chain applications.
Figure 4 shows the computational time required to calculate the probabilistic forecasts when using the CPU and GPU. The results show that the GPU with a grid and search optimization is faster than the CPU, regardless of the optimization routine chosen. Moreover, that difference is greater when the number of SKUs (n) increases. Interestingly, the same figure shows that changing the optimization routine from fmincon to grid search on the CPU does not lead to a substantial reduction in computational time.
5.3. Discussion
In the previous experiments, the speedup ratios obtained for multi-SKU probabilistic forecasting ranged between 28× and 42×. These results are consistent with the speedup ratios reported in other GPU-accelerated combinatorial and operations-research problems that are subject to being designed under a parallel structure. For instance, Boyer et al. [16] for knapsack problems achieved a speedup factor of 26×, Nogueira and Pinheiro [18] for the maximum weight clique problem achieved an average speedup of up to 12×, and Lim and Ma [29] for the p-median problem, from which we also take the speedup definition used in Equation (6), achieved a speed gain ranging from 10× to 57×.
To the best of the authors’ knowledge, this is the first study to analyze GPU performance in a multi-SKU demand forecasting context, which is of paramount importance for supply chain management applications. Interestingly, beyond the improvements in execution times, a standard, non-CUDA business-forecasting methodology (SES + grid search + Monte Carlo, as commonly implemented in practice) can be reformulated for GPU execution using only built-in MATLAB functions, and doing so shifts the practical feasibility frontier of simulation-based probabilistic forecasting to catalogue sizes that were previously computationally prohibitive for many practitioners without HPC expertise.
It is also important to note the non-monotonic relationship between the size of the dataset (n) and the speedup ratio. Particularly, there is an optimal value of n which maximizes the speedup ratio. This result is critical for a company with a large volume of products to forecast because it provides the number of SKUs that should be distributed between multiple GPUs working in parallel to face the problem of communication overhead between CPU and GPU.
These improvements in computational times can enable more frequent re-forecasting and re-optimization of safety stocks and reorder points across full SKU portfolios, e.g., moving from weekly/monthly batch cycles to daily or intra-day updates. This will allow for a faster response to demand variations. These reductions in computational time are crucial for large-scale forecasting applications, such as those commonly found in the retail industry [10].
6. Conclusions
This study presents a methodology for implementing probabilistic forecasts on GPUs using parallel computing techniques. The main contribution of this study is computational rather than methodological. Essentially, we do not propose a new forecasting model, but a parallel computing architecture that removes the sequential bottleneck of simulation-based probabilistic forecasting, illustrated here with a deliberately standard forecasting procedure such as SES combined with grid search optimization and Gaussian Monte Carlo simulation.
The proposed implementation leverages GPU computing to substantially reduce the computational burden associated with simulation-based forecasting. The empirical results show that GPU implementations can achieve speedup ratios ranging from 28 to 42 times compared with standard CPU-based approaches, while maintaining the same forecasting accuracy. Note that these results were obtained with a single forecasting model (SES) on a single-GPU configuration and a real but moderately sized dataset expanded by resampling.
These findings demonstrate that GPU computing can make simulation-based probabilistic forecasting feasible in large-scale supply chain contexts, where the number of SKUs and computational requirements are substantial. From a managerial perspective, this enables more efficient and timely decision-making in inventory management, particularly when uncertainty must be explicitly incorporated into forecasting processes.
However, the proposed approach has some limitations. Performance gains achieved with GPUs depend on memory constraints and the size of the dataset. In large-scale applications, these limitations may require the use of multiple GPUs or distributed computing environments. In that context, the results indicate the existence of an optimal data size for each GPU of the pool that maximizes the GPU speedup ratio.
Future research should extend this framework in two directions. Firstly, with regard to point forecasts, more advanced forecasting models should be investigated, such as those incorporating trend and seasonality (e.g., Holt–Winters or ARIMA models). Note that part of the observed performance gains relies on MATLAB’s optimized built-in GPU functions. Therefore, if additional forecasting models can be expressed as filter/transfer functions analogous to Equation (2), they are expected to remain compatible with MATLAB’s GPU-enabled filter function and benefit from reduced computational times. However, optimizing multiple parameters through grid search may substantially increase the size of the search space, as all possible parameter combinations must be evaluated. In that case, it would be desirable to investigate how to reduce the search space. Secondly, regarding probabilistic forecasting, alternative computationally intensive simulation techniques should be explored, including non-Gaussian error distributions, bootstrap and bagging methods [32]. In this sense, a probabilistic forecast performance assessment should be included with metrics such as Continuous Rank Probability Score or pinball loss. Here, the main hurdle may lie in block or moving-block bootstrap schemes needed to preserve temporal dependence in the resampled series, which require more elaborate parallel sampling procedures than the current i.i.d. draws from the Philox generator.
Author Contributions
Conceptualization, J.R.T.; methodology, J.R.T. and E.H.d.F.; software, E.H.d.F.; validation, J.R.T., E.H.d.F. and F.R.; formal analysis, J.R.T. and E.H.d.F.; investigation, E.H.d.F.; resources, J.R.T.; data curation, E.H.d.F.; writing—original draft preparation, J.R.T. and E.H.d.F.; writing—review and editing, J.R.T. and F.R.; visualization, E.H.d.F.; supervision, J.R.T. and F.R.; project administration, J.R.T. All authors have read and agreed to the published version of the manuscript.
Funding
This work was supported by the Vicerrectorado de Investigación y Política Científica from UCLM through the research group fund program (PREDILAB; [2025-GRIN-38298]).
Institutional Review Board Statement
Not applicable. This study does not involve humans or animals; it uses anonymized, aggregated shipment/sales data provided by a manufacturing company.
Informed Consent Statement
Not applicable.
Data Availability Statement
The shipment data used in this study were provided by a third-party manufacturing company under a confidentiality agreement and are not publicly available. Restrictions apply to the availability of these data, which were used under license for the current study.
Acknowledgments
The authors would like to thank the company that provided the shipment data used in this study.
Conflicts of Interest
The authors declare no conflicts of interest.
Abbreviations
The following abbreviations are used in this manuscript:
| GPU | Graphics Processing Unit |
| CPU | Central Processing Unit |
| SKU | Stock Keeping Unit |
| SES | Single Exponential Smoothing |
| CUDA | Compute Unified Device Architecture |
| MSE | Mean Squared Error |
| MAE | Mean Absolute Error |
| AvgRelMAE | Average Relative Mean Absolute Error |
| CSL | Cycle Service Level |
| ERP | Enterprise Resource Planning |
| GPS | Global Positioning System |
| RFID | Radio Frequency Identification |
References
- Blazquez, D.; Domenech, J. Big Data sources and methods for social and economic analyses. Technol. Forecast. Soc. Change 2018, 130, 99–113. [Google Scholar] [CrossRef] [Scilit]
- Govindan, K.; Cheng, T.; Mishra, N.; Shukla, N. Big data analytics and application for logistics and supply chain management. Transp. Res. Part E Logist. Transp. Rev. 2018, 114, 343–349. [Google Scholar] [CrossRef] [Scilit]
- Tiwari, S.; Wee, H.; Daryanto, Y. Big data analytics in supply chain management between 2010 and 2016: Insights to industries. Comput. Ind. Eng. 2018, 115, 319–330. [Google Scholar] [CrossRef] [Scilit]
- Gandomi, A.; Haider, M. Beyond the hype: Big data concepts, methods, and analytics. Int. J. Inf. Manag. 2015, 35, 137–144. [Google Scholar] [CrossRef] [Scilit]
- Bello-Orgaz, G.; Jung, J.J.; Camacho, D. Social big data: Recent achievements and new challenges. Inf. Fusion 2016, 28, 45–59. [Google Scholar] [CrossRef] [Scilit] [PubMed]
- Addo-Tenkorang, R.; Helo, P.T. Big data applications in operations/supply-chain management: A literature review. Comput. Ind. Eng. 2016, 101, 528–543. [Google Scholar] [CrossRef] [Scilit]
- Chase, C.W. Using Big Data to Enhance Demand-Driven Forecasting and Planning. J. Bus. Forecast. 2013, 32, 27–32. [Google Scholar]
- Nguyen, T.; Zhou, L.; Spiegler, V.; Ieromonachou, P.; Lin, Y. Big data analytics in supply chain management: A state-of-the-art literature review. Comput. Oper. Res. 2018, 98, 254–264. [Google Scholar] [CrossRef] [Scilit]
- Nikolopoulos, K.; Petropoulos, F. Forecasting for big data: Does suboptimality matter? Comput. Oper. Res. 2017, 98, 322–329. [Google Scholar] [CrossRef] [Scilit]
- Seaman, B. Considerations of a retail forecasting practitioner. Int. J. Forecast. 2018, 34, 822–829. [Google Scholar] [CrossRef] [Scilit]
- Zhong, R.Y.; Newman, S.T.; Huang, G.Q.; Lan, S. Big Data for supply chain management in the service and manufacturing sectors: Challenges, opportunities, and future perspectives. Comput. Ind. Eng. 2016, 101, 572–591. [Google Scholar] [CrossRef] [Scilit]
- Trapero, J.R.; Cardós, M.; Kourentzes, N. Empirical safety stock estimation based on kernel and GARCH models. Omega 2019, 84, 199–211. [Google Scholar] [CrossRef] [Scilit]
- Prak, D.; Teunter, R. A general method for addressing forecasting uncertainty in inventory models. Int. J. Forecast. 2019, 35, 224–238. [Google Scholar] [CrossRef] [Scilit]
- Hyndman, R.J.; Koehler, A.B.; Ord, J.K.; Snyder, R.D. Forecasting with Exponential Smoothing: The State Space Approach; Springer: Berlin/Heidelberg, Germany, 2008. [Google Scholar]
- Nadungodage, C.H.; Xia, Y.; Lee, J.J.; Lee, M.; Park, C.S. GPU accelerated item-based collaborative filtering for big-data applications. In Proceedings of the 2013 IEEE International Conference on Big Data, Silicon Valley, CA, USA, 6–9 October 2013; pp. 175–180. [Google Scholar] [CrossRef] [Scilit]
- Boyer, V.; Baz, D.E.; Elkihel, M. Solving knapsack problems on GPU. Comput. Oper. Res. 2012, 39, 42–47. [Google Scholar] [CrossRef] [Scilit]
- Curtis, V.; Sanches, C. A low-space algorithm for the subset-sum problem on GPU. Comput. Oper. Res. 2017, 83, 120–124. [Google Scholar] [CrossRef] [Scilit]
- Nogueira, B.; Pinheiro, R.G. A CPU-GPU local search heuristic for the maximum weight clique problem on massive graphs. Comput. Oper. Res. 2018, 90, 232–248. [Google Scholar] [CrossRef] [Scilit]
- Cheng, J.R.; Gen, M. Accelerating genetic algorithms with GPU computing: A selective overview. Comput. Ind. Eng. 2019, 128, 514–525. [Google Scholar] [CrossRef] [Scilit]
- Coelho, I.M.; Coelho, V.N.; da S. Luz, E.J.; Ochi, L.S.; Guimarães, F.G.; Rios, E. A GPU deep learning metaheuristic based model for time series forecasting. Appl. Energy 2017, 201, 412–418. [Google Scholar] [CrossRef] [Scilit]
- Qi, J.; Wang, J.; Liang, X.; Xu, Z. User-Level Large Scale Load Forecasting Based on GPU. In Proceedings of the 2023 9th Annual International Conference on Network and Information Systems for Computers (ICNISC), Wuhan, China, 27–29 October 2023; pp. 282–286. [Google Scholar] [CrossRef] [Scilit]
- Gardner, E.S. Exponential smooothing: The state of the art. J. Forecast. 1985, 4, 1–28. [Google Scholar] [CrossRef] [Scilit]
- Gardner, E.S. Exponential smoothing: The state of the art, Part II. Int. J. Forecast. 2006, 22, 637–666. [Google Scholar] [CrossRef] [Scilit]
- Fildes, R. Research into Forecasting Practice. Foresight Int. J. Appl. Forecast. 2017, 39–46. [Google Scholar]
- Ord, J.K.; Fildes, R.; Kourentzes, N. Principles of Business Forecasting, 2nd ed.; Wessex Press Publishing Co.: New York, NY, USA, 2017. [Google Scholar]
- Disney, S.M.; Towill, D.R. On the bullwhip and inventory variance produced by an ordering policy. Omega 2003, 31, 157–167. [Google Scholar] [CrossRef] [Scilit]
- Silver, E.; Pyke, D.; Thomas, D. Inventory and Production Management in Supply Chains, 4th ed.; CRC Press: Boca Raton, FL, USA; Taylor and Francis Group: Abingdon, UK, 2017. [Google Scholar]
- Davydenko, A.; Fildes, R. Measuring forecasting accuracy: The case of judgmental adjustments to SKU-level demand forecasts. Int. J. Forecast. 2013, 29, 510–522. [Google Scholar] [CrossRef] [Scilit]
- Lim, G.J.; Ma, L. GPU-based parallel vertex substitution algorithm for the p-median problem. Comput. Ind. Eng. 2013, 64, 381–388. [Google Scholar] [CrossRef] [Scilit]
- Barrow, D.; Kourentzes, N. Distributions of forecasting errors of forecast combinations: Implications for inventory management. Int. J. Prod. Econ. 2016, 177, 24–33. [Google Scholar] [CrossRef] [Scilit]
- Petropoulos, F.; Spiliotis, E. The Trade-Offs between Forecasting Performance and Computational Cost. Foresight Int. J. Appl. Forecast. 2025, 19–24. [Google Scholar]
- Bergmeir, C.; Hyndman, R.J.; Benítez, J.M. Bagging exponential smoothing methods using STL decomposition and Box–Cox transformation. Int. J. Forecast. 2016, 32, 303–312. [Google Scholar] [CrossRef] [Scilit]

Disclaimer/Publisher’s Note: The statements, opinions and data contained in all publications are solely those of the individual author(s) and contributor(s) and not of MDPI and/or the editor(s). MDPI and/or the editor(s) disclaim responsibility for any injury to people or property resulting from any ideas, methods, instructions or products referred to in the content. |
© 2026 by the authors. Licensee MDPI, Basel, Switzerland. This article is an open access article distributed under the terms and conditions of the Creative Commons Attribution (CC BY) license.