

Atmosphere 2026, 17(5), 498; https://doi.org/10.3390/atmos17050498 (registering DOI) - 14 May 2026
Abstract
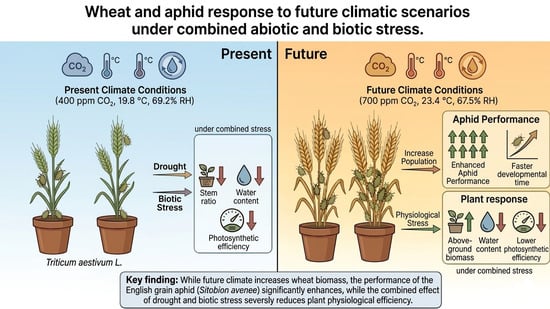
The study assessed the impact of climate change, aphid infestation and drought stress on winter wheat (Triticum aestivum L.) and the performance of English grain aphid (Sitobion avenae) under abiotic stress in controlled environmental conditions. To understand wheat and aphid
[...] Read more.
The study assessed the impact of climate change, aphid infestation and drought stress on winter wheat (Triticum aestivum L.) and the performance of English grain aphid (Sitobion avenae) under abiotic stress in controlled environmental conditions. To understand wheat and aphid interactions under different climatic condition, wheat plants were grown in controlled climatic chambers simulating present (400 ppm CO2, 19.8 °C, RH 69.2%) and future (700 ppm CO2, 23.4 °C, RH 67.5%) scenarios, combined with biotic stress (aphid) and abiotic stress (drought). Climate change effects combined with other stress factors are expected to alter crop physiology and insect biology. The results showed that aphid performance was significantly enhanced under future climatic conditions, with higher fecundity (56%), and a shortened or faster developmental time. As for wheat structural growth, above-ground biomass improved by up to 80% under future climate. However, its physiological efficiency, water content and photosynthetic efficiency were significantly reduced under the combined biotic and abiotic stresses. The study demonstrates that climate change may increase wheat plant growth under controlled conditions, yet it simultaneously boosts the shift in pest attacks and intensifies stress impacts, which eventually threaten wheat productivity. The findings emphasize the improvement of wheat varieties and pest-resistant strains capable of withstanding future climatic conditions.
Full article
(This article belongs to the Special Issue Agriculture, Ecosystems and Environment: Monitoring, Modeling and Mitigation Under Climate Change)
►
Show Figures
Graphical abstract


