
Characteristics of Hazardous Air Pollutants in Atmosphere for Complex Industrial Area at Southern Taiwan


Abstract
1. Introduction
2. Experimental
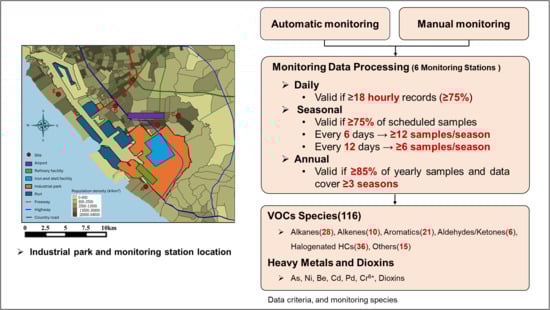
2.1. Monitoring Methods and Data Sources
2.2. Data Selection Criteria
2.2.1. Data Processing Principles
- Daily averages (automatic stations in special industrial zones): To maintain 24 h resolution, hourly observations were aggregated into daily means. A daily average was considered valid when at least 75% of the hourly data were available, corresponding to a minimum of 18 valid hourly measurements per day. Days not meeting this requirement were excluded from the daily mean calculation.
- Seasonal averages: A seasonal mean was calculated only when at least 75% of the scheduled samples within a season were valid. For example, under a sampling frequency of once every six days, a minimum of 12 valid samples per season was required; under a frequency of once every twelve days, at least 6 valid samples were necessary. Stations that failed to meet these thresholds were excluded from seasonal average computation.
- Annual averages: An annual mean was reported only when at least 85% of the scheduled yearly samples were valid and the data coverage extended across a minimum of three seasons. Stations that did not satisfy both criteria were excluded from annual average reporting.
2.2.2. Data Analysis
3. Results and Discussion
3.1. Analysis of TVOC (116 Compounds) Monitoring Data
- A—alkanes 47%, aldehydes/ketones 14%, aromatics 12%, alkenes 5%, halogenated hydrocarbons 5%, others 17%
- B—halogenated hydrocarbons 27%, alkanes 26%, aldehydes/ketones 16%, alkenes 6%, aromatics 1%, others 25%
- C—halogenated hydrocarbons 27%, alkanes 20%, aldehydes/ketones 14%, alkenes 6%, aromatics 2%, others 32%
- D—alkanes 27%, halogenated hydrocarbons 25%, aldehydes/ketones 14%, alkenes 6%, aromatics 2%, others 26%
- E—alkanes 37%, halogenated hydrocarbons 22%, aldehydes/ketones 15%, alkenes 5%, aromatics 1%, others 20%
- F—halogenated hydrocarbons 26%, alkanes 25%, aldehydes/ketones 15%, alkenes 5%, aromatics 2%, others 27%.

| Compound (%) | A | B | C | D | E | F |
|---|---|---|---|---|---|---|
| Alkanes | 47 | 26 | 20 | 27 | 37 | 25 |
| Alkenes | 5 | 6 | 6 | 6 | 5 | 5 |
| Aromatic hydrocarbons | 12 | 1 | 2 | 2 | 1 | 2 |
| Aldehydes and Ketones | 14 | 16 | 14 | 14 | 15 | 15 |
| Organohalogen compounds | 5 | 27 | 27 | 25 | 22 | 26 |
| Others | 17 | 25 | 32 | 26 | 20 | 27 |
| Total abundant (μg/m3) | 269.2 ± 15.4 | 157.0 ± 13.6 | 174.4 ± 18.6 | 166.6 ± 19.4 | 169.7 ± 12.5 | 154.8 ± 14.5 |
3.2. Analysis of Hazardous VOCs
3.3. Analysis of Particulate Matter Heavy Metals and Dioxin Monitoring Data
4. Conclusions
Supplementary Materials
Author Contributions
Funding
Institutional Review Board Statement
Informed Consent Statement
Data Availability Statement
Acknowledgments
Conflicts of Interest
References
- Ministry of Environment. Taiwan Emission Data System, TEDS 12.0. 2024. Available online: https://air.moenv.gov.tw/EnvTopics/AirQuality_6.aspx (accessed on 5 June 2025).
- Ministry of Environment. Special Industrial Zone Monitoring Network. 2025. Available online: https://aqmsopen.moenv.gov.tw/Default_EN.aspx#gsc.tab=0 (accessed on 5 June 2025).
- World Health Organization (WHO). Air Quality Guidelines for Europe World Health Organization Regional Office for Europe Copenhagen WHO Regional Publications, 2nd ed.; European Series, No. 91; World Health Organization: Geneva, Switzerland, 2000.
- World Health Organization (WHO). WHO Global Air Quality Guidelines: Particulate Matter (PM2.5 and PM10), Ozone, Nitrogen Dioxide, Sulfur Dioxide and Carbon Monoxide; World Health Organization: Geneva, Switzerland, 2021.
- Ministry of the Environment of Japan. Guideline Values for Hazardous Air Pollutants to Reduce Health Risks; Ministry of the Environment of Japan: Tokyo, Japan, 2006. [Google Scholar]
- Ministry of the Environment of Japan. Manual on Determination of Dioxins in Ambient Air; Ministry of the Environment of Japan: Tokyo, Japan, 2001. [Google Scholar]
- Texas Commission on Environmental Quality (TCEQ). Air Monitoring Comparison Values for Long-Term Health (AMCVs). 2017. Available online: https://www.tceq.texas.gov/cgi-bin/compliance/monops/agc_amcvs.pl (accessed on 5 June 2025).
- Lee, J.; Lee, S.J.; Kim, S.J.; Kim, S.H.; Lee, G.; Chang, L.S.; Choi, S.D. Pollution characteristics and secondary formation potential of volatile organic compounds in the multi-industrial city of Ulsan, Korea. Atmos. Environ. 2024, 319, 120313. [Google Scholar] [CrossRef]
- Xiong, Y.; Bari, M.A.; Xing, Z.; Du, K. Ambient volatile organic compounds (VOCs) in two coastal cities in western Canada: Spatiotemporal variation, source apportionment, and health risk assessment. Sci. Total Environ. 2020, 706, 135970. [Google Scholar] [CrossRef] [PubMed]
- Fukusaki, Y.; Kousa, Y.; Umehara, M.; Ishida, M.; Sato, R.; Otagiri, K.; Hoshi, J.; Nudejima, C.; Takahashi, K.; Nakai, S. Source region identification and source apportionment of volatile organic compounds in the Tokyo Bay coastal area. Jpn. Atmos. Environ. 2021, 9, 100103. [Google Scholar] [CrossRef]
- Zhang, Y.; Li, R.; Fu, H.; Zhou, D.; Chen, J. Observation and analysis of atmospheric volatile organic compounds in a typical petrochemical area in Yangtze River Delta, China. J. Environ. Sci. 2018, 71, 233–248. [Google Scholar] [CrossRef] [PubMed]
- Ledoux, F.; Kfoury, A.; Delmaire, G.; Roussel, G.; El Zein, A.; Courcot, D. Contributions of local and regional anthropogenic sources of metals in PM2.5 at an urban site in northern France. Chemosphere 2017, 181, 713–724. [Google Scholar] [CrossRef] [PubMed]
- Maestas, M.; Epstein, S.A.; Schulte, N.; Li, X.; Zhang, X.; Lee, S.M.; Polidori, A.; Low, J.; Ghosh, J.K. Trends in air toxics cancer risk in Southern California, 1998–2018. Environ. Res. Health 2024, 2, 025005. [Google Scholar] [CrossRef]
- Seibert, R.; Nikolova, I.; Volná, V.; Krejčí, B.; Hladký, D. Air pollution sources’ contribution to PM2.5 concentration in the northeastern part of the Czech Republic. Atmosphere 2020, 11, 522. [Google Scholar] [CrossRef]
- Alves, C.; Evtyugina, M.; Vicente, E.; Vicente, A.; Rienda, I.C.; de la Campa, A.S.; Duarte, I. PM2.5 chemical composition and health risks by inhalation near a chemical complex. J. Environ. Sci. 2023, 124, 860–874. [Google Scholar] [CrossRef] [PubMed]
- Taiwo, A.M.; Beddows, D.C.S.; Calzolai, G.; Harrison, R.M.; Lucarelli, F.; Nava, S.; Vecchi, R. Receptor modelling of airborne particulate matter in the vicinity of a major steelworks site. Sci. Total Environ. 2014, 490, 488–500. [Google Scholar] [CrossRef] [PubMed]
- Palmisani, J.; Di Gilio, A.; Franchini, S.A.; Cotugno, P.; Miniero, D.V.; D’Ambruoso, P.; de Gennaro, G. Particle-bound PAHs and elements in a highly industrialized city in Southern Italy: PM2.5 chemical characterization and source apportionment after the implementation of governmental measures for air pollution mitigation and control. Int. J. Environ. Res. Public Health 2020, 17, 4843. [Google Scholar] [CrossRef]
- Koukoulakis, K.G.; Kanellopoulos, P.G.; Chrysochou, E.; Costopoulou, D.; Vassiliadou, I.; Leondiadis, L.; Bakeas, E. Atmospheric concentrations and health implications of PAHs, PCBs and PCDD/Fs in the vicinity of a heavily industrialized site in Greece. Appl. Sci. 2020, 10, 9023. [Google Scholar] [CrossRef]
- Zhu, J.; Hsu, C.Y.; Chou, W.C.; Chen, M.J.; Chen, J.L.; Yang, T.T.; Chen, Y.C. PM2.5-and PM10-bound polycyclic aromatic hydrocarbons (PAHs) in the residential area near coal-fired power and steelmaking plants of Taichung City, Taiwan: In vitro-based health risk and source identification. Sci. Total Environ. 2019, 670, 439–447. [Google Scholar] [CrossRef] [PubMed]
- International Agency for Research on Cancer (IARC). List of Classifications. 2025. Available online: https://monographs.iarc.who.int/list-of-classifications/ (accessed on 5 November 2025).
- Tsai, J.-H.; Yeh, P.-C.; Huang, J.-J.; Chiang, H.-L. Characteristics of Air Toxics from Multiple Sources in the Kaohsiung Coastal Industrial Complex and Port Area. Atmosphere 2024, 15, 1547. [Google Scholar] [CrossRef]


| Name of Station | Station Code | Station Height (m) | Distance from Industrial Area (m) | Distance from the Road (m) | Monitoring (Categories) |
|---|---|---|---|---|---|
| Fonglin | A | 12 | 380 | 90 |
|
| Zhongshan | B | 12 | 420 | 285 | |
| Taiping | C | 9 | 1050 | 50 | |
| Mingzheng | D | 9 | 3000 | 250 | |
| Cijin | E | 6 | 7880 | 5 | |
| Erjia Village | F | 6 | 4300 | 20 |
| Region | Emission Source Characteristics | Benzene (B) | Toluene (T) | Ethylbenzene (E) | Xylene (X) | Styrene (S) | BTEX | T/B | E/B | X/B | T/X | X/E | |
|---|---|---|---|---|---|---|---|---|---|---|---|---|---|
| This study | A | Steel industry, Petroleum refining industry | 2.64 ± 0.19 | 8.60 ± 1.06 | 1.28 ± 0.67 | 6.55 ± 1.36 | 0.88 ± 0.24 | 18.34 | 3.26 | 0.78 | 2.25 | 1.45 | 2.89 |
| B | Steel industry, Petroleum refining industry, Traffic sources | 1.59 ± 0.17 | 8.81 ± 0.31 | 0.76 ± 0.74 | 3.55 ± 1.19 | 0.77 ± 0.21 | 14.06 | 5.39 | 0.80 | 1.82 | 2.95 | 2.28 | |
| C | Steel industry, Petroleum refining industry, Traffic sources | 1.67 ± 0.18 | 9.26 ± 1.34 | 0.54 ± 0.20 | 3.06 ± 0.21 | 0.65 ± 0.13 | 14.66 | 5.54 | 0.82 | 1.83 | 3.02 | 2.22 | |
| D | Steel industry, Petroleum refining industry, Aviation | 1.97 ± 0.29 | 9.80 ± 1.37 | 0.47 ± 0.14 | 2.92 ± 0.16 | 0.60 ± 0.15 | 15.35 | 4.99 | 0.70 | 1.47 | 3.39 | 2.11 | |
| E | Petroleum refining industry, Port activities | 1.77 ± 0.49 | 11.28 ± 1.42 | 0.34 ± 0.15 | 2.69 ± 0.22 | 1.93 ± 0.71 | 17.47 | 6.36 | 0.66 | 1.38 | 4.61 | 2.09 | |
| F | Traffic sources | 1.69 ± 0.24 | 9.97 ± 1.38 | 0.51 ± 0.22 | 2.90 ± 0.33 | 0.95 ± 0.19 | 15.48 | 5.91 | 0.77 | 1.72 | 3.44 | 2.24 | |
| Average of six monitoring stations | Steel industry, Petroleum refining industry | 1.89 ± 0.44 | 9.61 ± 1.40 | 0.65 ± 0.49 | 3.47 ± 1.55 | 0.96 ± 0.55 | 15.89 | 5.07 | 0.75 | 1.78 | 2.85 | 2.36 | |
| Korea [8] | Shipbuilding industry, Automotive industry, Petrochemical industry, and Non-ferrous metals industry | 1.30 | 8.13 | 7.98 | 22.59 | 0.57 | 40.00 | 6.25 | 6.14 | 17.38 | 0.36 | 0.35 | |
| Canada [9] | Refineries, Science and Technology Parks, and Integrated Industrial Zones | 0.60 | 2.74 | 0.52 | 2.31 | 0.20 | 6.17 | 4.57 | 0.87 | 3.85 | 1.19 | 0.23 | |
| 0.45 | 1.90 | 0.27 | 1.12 | 0.10 | 3.74 | 4.22 | 0.60 | 2.49 | 1.70 | 0.24 | |||
| Japan [10] | Petrochemical industry | 0.81 | 5.27 | 4.00 | 1.00 | 0.22 | 13.42 | 6.51 | 4.94 | 4.12 | 1.58 | 1.20 | |
| China [11] | Chemical plants (paint solvent plants, rubber factories, refineries, petrochemical plants) | 6.19 | 32.5 | 11.1 | 7.42 | 2.60 | 57.21 | 5.25 | 1.79 | 1.20 | 4.38 | 1.50 | |
| Country/Species | Industrial Zone Characteristics | As | Ni | Be | Cd | Pb | Cr6+ | Dioxin | B(a)P | |
|---|---|---|---|---|---|---|---|---|---|---|
| This study | A | Steel and refining industry | 1.49 ± 0.19 | 6.59 ± 0.71 | 0.02 ± 0.01 | 0.51 ± 0.13 | 21.80 ± 5.61 | 0.09 ± 0.02 | 0.06 ± 0.02 | 0.32 ± 0.15 |
| B | Steel, refining, transportation sources | 1.38 ± 0.19 | 4.16 ± 0.27 | 0.03 ± 0.01 | 0.34 ± 0.05 | 21.28 ± 4.55 | 0.10 ± 0.02 | 0.06 ± 0.04 | 0.11 ± 0.03 | |
| C | Steel, refining, transportation sources | 1.31 ± 0.15 | 3.99 ± 0.15 | 0.04 ± 0.01 | 0.31 ± 0.04 | 16.34 ± 1.5 | 0.11 ± 0.01 | 0.06 ± 0.03 | 0.10 ± 0.03 | |
| D | Steel, Refining, Aviation | 1.23 ± 0.18 | 4.49 ± 0.58 | 0.04 ± 0.01 | 0.26 ± 0.04 | 14.23 ± 1.94 | 0.10 ± 0.01 | 0.07 ± 0.04 | 0.08 ± 0.04 | |
| E | Refining industry, port activities | 1.16 ± 0.19 | 5.39 ± 0.81 | 0.03 ± 0.01 | 0.24 ± 0.01 | 13.11 ± 1.57 | 0.10 ± 0.02 | 0.07 ± 0.04 | 0.05 ± 0.02 | |
| F | Source of traffic | 1.21 ± 0.18 | 3.66 ± 0.28 | 0.03 ± 0.01 | 0.31 ± 0.05 | 14.24 ± 1.73 | 0.11 ± 0.02 | 0.06 ± 0.03 | 0.13 ± 0.04 | |
| 6 Range of stations | 1.16–1.49 | 3.66–6.59 | 0.02–0.04 | 0.24–0.51 | 13.11–21.80 | 0.09–0.11 | 1.16–1.49 | 0.05–0.32 | ||
| France [12] | Steelmaking, refinery | 1.35 | 2.91 | - | 0.51 | 18.2 | - | - | - | |
| France [13] | Steelmaking, refinery | 1.09 | 5.36 | - | 0.46 | 14.8 | - | - | - | |
| Czech Republic [14] | Steel mills, transportation sources | 1.04 | 1.06 | - | 0.24 | 0.00 | - | - | 2.11 | |
| Portugal [15] | Plastic (PVC) manufacturing plants, rubber products production. | 0.11 | 0.53 | ND | 0.06 | 3.78 | - | - | ||
| England [16] | Steelworks | - | 0.11–0.24 | - | 0.02–0.08 | 1.32–2.95 | - | - | ||
| Italy [17] | Steel, refinery, cement plant | 0.20–4.30 | 1.14–6.64 | - | 0.04–0.29 | 2.16–53.80 | - | - | ||
| Greece [18] | Refinery, metallurgical processing plants, cement plants, chemical plants and food production plants | - | - | - | - | - | - | - | 0.93 ± 0.66 | |
| Taiwan (Taichung) [19] | Coal-fired power plants and steel mills | - | - | - | - | - | - | - | 0.23 ± 0.17 | |
| Italy [17] | Steel, refinery, cement plant | - | - | - | - | - | - | - | 0.43–6.26 | |
| Species (ppb) | 2021 | 2022 | 2023 | 2024 | 4 Year Average |
|---|---|---|---|---|---|
| Benzene | 2.14 ± 0.39 (1.83~2.86) | 2.070.40 (1.61~2.69) | 1.70 ± 0.47 (1.35~2.60) | 1.67 ± 0.37 (1.37~2.41) | 1.89 ± 0.39 (1.59~2.64) |
| Vinyl chloride | 0.58 ± 0.57 (0.33~1.74) | 0.50 ± 0.26 (0.24~0.87) | 0.51 ± 0.39 (0.15~1.22) | 0.45 ± 0.33 (0.16~0.89) | 0.51 ± 0.28 (0.25~1.02) |
| 1,2-dichloroethane | 1.04 ± 0.89 (0.44~2.61) | 0.62 ± 0.23 (0.39~1.06) | 0.52 ± 0.26 (0.30~1.03) | 0.38 ± 0.19 (0.19~0.67) | 0.64 ± 0.36 (0.39~1.34) |
| Formaldehyde | 20.65 ± 6.08 (15.70~21.91) | 18.98 ± 4.14 (12.03~22.74) | 19.35 ± 2.46 (16.20~23.36) | 16.84 ± 3.00 (13.93~22.54) | 18.96 ± 2.03 (16.23~21.91) |
| Acrylonitrile | 0.03 ± 0.03 (0.00~0.08) | 0.01 ± 0.02 (0.00~0.05) | 0.02 ± 0.04 (0.00~0.09) | 0.03 ± 0.03 (0.00~0.10) | 0.02 ± 0.02 (0.01~0.07) |
| Chloroform | 0.10 ± 0.07 (0.02~0.20) | 0.15 ± 0.09 (0.02~0.31) | 0.08 ± 0.07 (0.00~0.16) | 0.14 ± 0.08 (0.04~0.26) | 0.12 ± 0.06 (0.02~0.17) |
| Species (ppb) | A | B | C | D | E | F |
|---|---|---|---|---|---|---|
| Benzene | 2.64 ± 0.19 (2.41~2.86) | 1.59 ± 0.17 (0.42~1.83) | 1.67 ± 0.18 (1.49~1.88) | 1.97 ± 0.29 (1.64~2.26) | 1.77 ± 0.49 (1.35~2.32) | 1.72 ± 0.24 (1.50~1.96) |
| Vinyl chloride | 0.55 ± 0.45 (0.24~1.22) | 0.35 ± 0.12 (0.18~0.46) | 0.32 ± 0.05 (0.24~0.35) | 0.25 ± 0.11 (0.15~0.35) | 1.02 ± 0.48 (0.69~1.74) | 0.59 ± 0.30 (0.32~0.87) |
| 1,2-dichloroethane | 1.34 ± 0.86 (0.67~2.61) | 0.48 ± 0.1 (0.38~0.57) | 0.47 ± 0.19 (0.19~0.60) | 0.39 ± 0.09 (0.30~0.49) | 0.66 ± 0.66 (0.19~1.63) | 0.50 ± 0.07 (0.44~0.59) |
| Formaldehyde | 20.67 ± 8.89 (12.03~31.94) | 17.99 ± 1.9 (16.21~20.09) | 21.91 ± 1.33 (19.92~22.63) | 18.29 ± 3.35 (15.71~22.74) | 16.23 ± 2.08 (13.93~18.97) | 18.64 ± 1.67 (17.32~20.95) |
| Acrylonitrile | 0.07 ± 0.04 (0.02~0.10) | 0.01 ± 0.01 (0.00~0.02) | 0.01 ± 0.01 (0.00~0.01) | 0.01 ± 0.01 (0.00~0.02) | 0.02 ± 0.04 (0.00~0.08) | 0.02 ± 0.02 (0.00~0.04) |
| Chloroform | 0.13 ± 0.09 (0.00~0.20) | 0.15 ± 0.03 (0.12~0.18) | 0.17 ± 0.1 (0.08~0.31) | 0.07 ± 0.04 (0.02~0.11) | 0.02 ± 0.02 (0.00~0.04) | 0.16 ± 0.07 (0.11~0.26) |
| Compounds | PC1 | PC2 | PC3 |
|---|---|---|---|
| Alkanes | 0.91 | ||
| Alkenes | |||
| Alkynes | |||
| Aromatics | 0.89 | ||
| Aldehydes/Ketones | |||
| Halogens-compounds | |||
| Esters | 0.87 | ||
| Others group VOCs | |||
| As | |||
| Ni | 0.85 | ||
| Be | −0.74 | ||
| Cd | 0.87 | ||
| Pb | |||
| Cr6+ | −0.71 | ||
| Variance (%) | 37.0 | 21.6 | 15.6 |
| Emission sources | Petrochemical, chemical industry | Metal refinery industry such as iron and steel industry | Chemical industry, Port activities |
Disclaimer/Publisher’s Note: The statements, opinions and data contained in all publications are solely those of the individual author(s) and contributor(s) and not of MDPI and/or the editor(s). MDPI and/or the editor(s) disclaim responsibility for any injury to people or property resulting from any ideas, methods, instructions or products referred to in the content. |
© 2025 by the authors. Licensee MDPI, Basel, Switzerland. This article is an open access article distributed under the terms and conditions of the Creative Commons Attribution (CC BY) license (https://creativecommons.org/licenses/by/4.0/).
Share and Cite
Tsai, J.-H.; Yeh, P.-C.; Lin, S.-Y.; Chiang, H.-L. Characteristics of Hazardous Air Pollutants in Atmosphere for Complex Industrial Area at Southern Taiwan. Atmosphere 2025, 16, 1369. https://doi.org/10.3390/atmos16121369
Tsai J-H, Yeh P-C, Lin S-Y, Chiang H-L. Characteristics of Hazardous Air Pollutants in Atmosphere for Complex Industrial Area at Southern Taiwan. Atmosphere. 2025; 16(12):1369. https://doi.org/10.3390/atmos16121369
Chicago/Turabian StyleTsai, Jiun-Horng, Pei-Chi Yeh, Shih-Yu Lin, and Hung-Lung Chiang. 2025. "Characteristics of Hazardous Air Pollutants in Atmosphere for Complex Industrial Area at Southern Taiwan" Atmosphere 16, no. 12: 1369. https://doi.org/10.3390/atmos16121369
APA StyleTsai, J.-H., Yeh, P.-C., Lin, S.-Y., & Chiang, H.-L. (2025). Characteristics of Hazardous Air Pollutants in Atmosphere for Complex Industrial Area at Southern Taiwan. Atmosphere, 16(12), 1369. https://doi.org/10.3390/atmos16121369