Abstract
This paper investigates wind speed, wind shear (), and turbulence intensity (TI) characteristics using measurements from meteorological mast data from three sites in the Geba Catchment, Tigray, Ethiopia: Dera, Hagere Selam, and Mayderhu. Wind speed analysis shows significant spatial and temporal variations, with Hagere Selam exhibiting the highest annual average wind speeds (8.0 m/s), while Dera showed the lowest (4.5 m/s). Diurnal and seasonal patterns indicated that wind speeds peak in the afternoon and vary with temperature, with Dera experiencing more pronounced vertical wind shear ( = 0.1–0.3) due to complex terrain interactions. In contrast, Hagere Selam and Mayderhu displayed lower shear ( = 0.0–0.1), suggesting smoother wind flow. Dera also showed pronounced diurnal variations linked to nighttime cooling. TI was highest at Dera (TI ≈ 0.5), particularly at night, while Hagere Selam and Mayderhu maintained more stable conditions (TI < 0.25). Across all locations, analysis of wind speed variability revealed that Dera experiences greater turbulence compared to the International Electrotechnical Commission (IEC) standards but remains within acceptable limits for wind turbine operations. Wind direction analysis highlighted the prevailing winds at Dera, predominantly from the north, northeast, and southeast, which correspond to higher and TI levels, emphasizing the role of local topography. Further, seasonal shifts were observed at Dera and Mayderhu, whereas Hagere Selam exhibited consistent northeasterly winds. The findings underscore the influence of topography and atmospheric stability on wind dynamics, providing critical insights for wind energy deployment in similar hilly terrains.
1. Introduction
Understanding turbulence intensity (TI) and wind shear exponent () characteristics at a site is crucial for accurately assessing wind energy resources and predicting power production. These parameters are not only critical for wind energy but are also fundamental to numerous fields, including atmospheric physics, aviation, and astronomy, where they dictate optical quality and the performance of adaptive systems [1,2]. The accurate characterization of turbulence and shear is therefore a cross-disciplinary challenge.
In wind energy, TI quantifies the relative magnitude of turbulent fluctuations and is defined as the ratio of the standard deviation of wind speed to the mean wind speed (), where and are standard deviation and mean wind speed. The wind shear exponent , characterizing the change in wind speed with height, is defined by the power law relationship , where and are the wind speeds at heights and , respectively. In this study, both parameters were calculated from 10-min time series, following standard practice for wind resource assessment.
The wind shear and turbulence intensity parameters have significant practical implications for wind energy applications. The wind shear exponent directly influences wind speed estimates at hub height, which in turn have a substantial impact on power output due to the cubic relationship between wind speed and power. Additionally, wind turbines are optimized to perform efficiently within specific wind speed ranges. Moreover, wind turbulence and shear can cause mechanical stress on wind turbine blades, reducing their lifespan and efficiency [3]. Studies conducted by [4,5,6,7] have established a strong influence of TI and on wind energy production. For instance, ref. [6] reported that the extrapolation error in theoretical energy yield decreased by approximately 50% to 70% on average for a lidar measurement, depending on the extrapolation height and distance. These studies highlight the importance of incorporating and turbulence factors into data analysis and site selection criteria.
The formation of atmospheric turbulence and wind shear is governed by the interplay of mechanical and thermal forcing. Mechanical turbulence is generated by vertical wind speed gradients (shear) and surface friction, while thermal turbulence arises from buoyancy effects due to solar heating or radiative cooling. The structure of the atmospheric boundary layer, including key metrics like the turbulence outer scale, is a direct result of this interplay [1,2]. In fact, advanced models in other fields, such as astrophysics for telescope siting, have successfully parameterized optical turbulence strength directly from vertical profiles of wind speed and outer scale [1]. This underscores the fundamental role of wind shear not just as a parameter of interest but as a primary generator of atmospheric turbulence. In the context of wind energy, accurately characterizing this relationship is paramount, as turbulent fluctuations and shear-induced loads directly impact turbine performance and longevity [3,8].
TI and depend on various local conditions, including atmospheric stability, surface roughness, and terrain type. Understanding these dependencies is the first step towards predicting their behavior. Recent research has demonstrated that, while turbulent wind speed itself is stochastic, statistical measures like the turbulence standard deviation are predictable within short-term horizons, offering a pathway to forecast these critical fluctuations [8]. Furthermore, integrating real-time turbulence intensity features into forecasting models has been shown to significantly improve the accuracy of multi-step wind speed predictions, especially for longer time horizons [9]. A review by [10] explored methods to identify commonly used parameters for defining atmospheric stability. This review highlighted key indicators, including the and TI, as effective metrics for characterizing stability conditions in the atmospheric boundary layer. The relationships described above become significantly more complex in non-flat terrain. In complex environments, such as the hilly terrain of the Geba Catchment, standard models and stability classifications derived from homogeneous sites often fail. Thermal stratification further complicates wind behavior, especially under stable conditions, where cooler, dense air near the surface resists upward movement. This alters velocity profiles, TI, and wind flow around obstacles, affecting wind turbine performance and energy output. Accurate modeling of stratified wind behavior is crucial for optimizing wind farm siting and operation [11,12,13].
Table 1 summarizes the atmospheric stability classifications reported in various studies, demonstrating general agreement except for the reported by [5]. These higher values of are attributed to the specific focus on dense forest conditions. In this classification, strongly stable conditions are identified when is greater than 0.3 and the TI is less than 0.1. These conditions usually represent a strong resistance to vertical air movement, often observed during night-time radiative cooling. Stable conditions are classified when falls between 0.2 and 0.3, with TI remaining below 0.1, indicating reduced but still significant resistance to vertical mixing, often found in the early evening or late morning hours. Moving to neutral atmospheric conditions, ranges between 0.1 and 0.2, and the TI exceeds 0.2. Neutral conditions generally indicate little resistance to vertical movement and can be associated with cloudy skies or windy days, where thermal stratification is minimal. Convective conditions are characterized by values between 0.0 and 0.1, with TI ranging from 0.1 to 0.2. This classification typically indicates weak atmospheric stratification, promoting vertical air movement, which is common on sunny days with moderate ground heating. Lastly, strongly convective conditions are identified when is less than 0.0 and TI is less than 0.2. These conditions are indicative of strong buoyancy forces driving turbulent mixing, often observed during daytime hours with significant solar heating.

Table 1.
Atmospheric stability classification based on TI and according to different sources. Atmospheric conditions are categorized into five stability classes: strongly stable, stable, neutral, convective, and strongly convective. Each class is defined by specific ranges of TI and (), illustrating the degrees of resistance to vertical air movement and the associated meteorological phenomena.
However, it is important to note that different researchers have reported varying ranges for these classifications. For example, some studies have suggested alternative thresholds for and TI, reflecting differences in geographical locations, measurement techniques, and specific atmospheric conditions. This variability in the reported ranges highlights the complex and context-dependent nature of the atmospheric stability classification [10,15,16]. Numerous studies have documented these parameters, with a focus on various site locations and terrain types. Table 2 presents a summary of some of these studies, highlighting key characteristics such as site location, type of terrain, TI, and . The TI and values reported in Table 2 are based on measurements taken at various heights, typically ranging from 10 m to 80 m using wind masts, while, in reference [17], lidar measurements extending up to 200 m were used.
Table 2.
Summary of TI and from various studies. This table highlights key characteristics such as site location, terrain type, and the corresponding TI and values. The data predominantly focus on flat terrain sites but also address the challenges posed by complex terrain. Notably, a distinct diurnal pattern in and TI values is observed, with higher at night and increased daytime turbulence due to atmospheric conditions. An exception is noted in a study from the Fiji Islands, where higher TI occurs at night, influenced by local factors.
Most of the available literature predominantly addresses flat terrain sites, which are easier to model and are often used in wind energy assessments. However, complex terrain, characterized by features such as mountains, valleys, or forests, poses additional challenges in both measurement and modeling, and thus, data for such areas remain scarce. A consistent pattern emerges from these studies, where the tends to be higher during night-time hours, with values typically ranging from 0.2 to 0.4. This nocturnal increase in can be attributed to the development of stable atmospheric layers that suppress vertical mixing, leading to a stronger vertical gradient in wind speed. In contrast, during the daytime, when the atmosphere is often more convective, values are generally lower, ranging from 0.0 to 0.2. Similarly, TI follows a recognizable diurnal pattern, with lower TI values at night due to the stable atmospheric conditions that inhibit turbulence. However, daytime turbulence is usually more pronounced due to solar heating and the subsequent destabilization of the atmosphere. Interestingly, a study by [22] focusing on the Fiji Islands reported a contrasting trend (refer Table 2). Here, higher TI was observed during the night-time, with values ranging from 0.25 to 0.45, compared to daytime values of 0.2 to 0.25. This anomalous behavior could be influenced by local factors such as oceanic influences, complex terrain, or specific climatic conditions unique to the islands, which might contribute to higher nocturnal turbulence. This deviation from the typical diurnal cycle emphasizes the need for localized studies to account for unique environmental and geographical factors.
While advanced predictive models and high-resolution reanalysis data [1] are becoming more common, their application requires local validation, particularly in data-scarce regions. Ethiopia possesses significant wind energy potential, largely due to its diverse topography and frequent strong winds. Effectively harnessing this potential, however, requires a comprehensive understanding of wind characteristics, particularly in complex terrains such as the Geba Catchment in the Tigray region. Despite this need, detailed wind assessments remain limited in Ethiopia, where weather station coverage is sparse, measurement heights often fall below international standards, and temporal resolution is generally low [23].
Previous studies have conducted wind resource assessments across various regions of Ethiopia, identifying promising areas for wind energy development [24,25,26,27]. These assessments have provided valuable insights and laid the groundwork for future wind energy projects. However, many of these investigations relied on meteorological data originally collected for purposes unrelated to wind energy—such as aviation, river catchment management, drought monitoring, and agricultural planning [28]. While such datasets can offer reasonable accuracy at localized scales, they are often insufficient for capturing wind patterns at the elevations and spatial resolutions required for utility-scale wind energy planning.
For example, ref. [25] estimated power output at turbine hub height using a simplified power law for wind shear using surface roughness. However, subsequent studies [17] have shown that more accurate wind shear exponents are obtained when wind speeds are measured at two or more different heights, underscoring the limitations of relying on single-height measurements for resource assessment.
Therefore, effectively harnessing this potential requires a comprehensive understanding of wind characteristics, particularly in complex terrains like the Geba Catchment in Tigray, Ethiopia. The Geba Catchment exhibits significant wind energy potential, as identified by [29] and supported by ground-based observational data analysis and resource mapping. This region’s unique topography contributes to favorable wind conditions, making it a viable candidate for wind energy projects. The presence of hills and valleys creates obstacles that disrupt airflow, leading to increased TI and variation in wind speed and direction. These variations must be thoroughly analyzed to identify suitable locations for wind energy projects.
This study addresses these critical factors by analyzing the TI and characteristics within the hilly terrain of the Geba Catchment. By quantifying these variations, we aim to achieve the following: 1. Identify how TI and profiles differ across the catchment’s diverse topography. 2. Assess the impact of these variations on the suitability of different locations for wind energy projects. 3. Compare the observed TI and characteristics with existing models for hilly terrain, evaluating their accuracy in representing the complex wind patterns of the Geba Catchment. The findings of this study will contribute valuable information for the characterization of wind energy potential in the Geba Catchment and similar hilly regions.
2. Methodology
2.1. Description of the Sites
The study sites are located within the Geba Catchment in the Tigray region of northern Ethiopia. As shown in Figure 1, these sites are positioned in relation to two significant geographical features: the Red Sea and the Rift Valley escarpment. The proximity of these features plays a critical role in shaping the local wind characteristics and broader atmospheric dynamics. The air distances from the Dera, Hagere Selam, and Mayderhu sites to the Red Sea are approximately 140 km, 200 km, and 230 km, respectively. Notably, the Dera site is the closest to the Rift Valley escarpment, with a mere 10 km air distance, while Hagere Selam and Mayderhu are located 180 km and 70 km to the west of the escarpment, respectively. The Red Sea influences regional wind patterns due to its role as a thermal contrast zone between land and sea. These variations contribute to the complexity of the wind characteristics in the area. The Rift Valley escarpment, with its steep topography, further modulates the wind behavior. The escarpment acts as a barrier, influencing wind flow patterns through orographic effects, where winds are accelerated or deflected along the slope. The proximity of the Dera site to the escarpment subjects it to turbulent winds due to these orographic influences. These geographical influences underscore the importance of site-specific wind assessments in understanding the local atmospheric dynamics across the Geba Catchment.
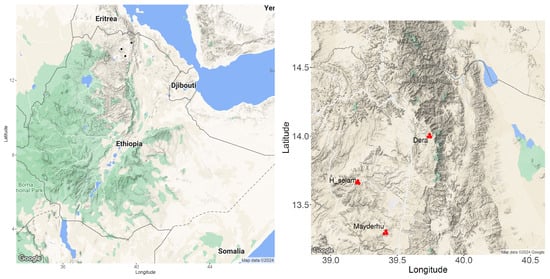
Figure 1.
The dots in the left map indicate the three study sites within the Geba Catchment, Tigray region, northern Ethiopia. The catchment is strategically positioned between two key geographical features: the Red Sea and the Rift Valley escarpment. The right panel shows enlarged maps of each location. The terrain features were visualized using Google Earth [30].
Figure 2 presents a detailed map of the Dera site and its surrounding valleys and mountains. The terrain map, sourced from Google Earth [30], highlights the town of Atsbi Dera located to the northeast of the site, along with the surrounding mountains. Additionally, the contour map, generated using QGIS (version 3.28, QGIS Development Team, www.qgis.org) [31], illustrates the altitudinal variations within the region, with elevations ranging from 2775 m to approximately 3000 m above sea level. Both maps cover an area of approximately 6 km by 4 km, providing a consistent scale and a clear representation of the topography.
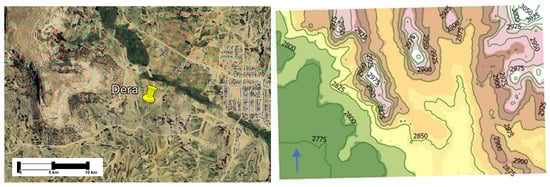
Figure 2.
Terrain map of the Dera site and its surrounding valleys and mountains. The terrain features were visualized using data sourced from Google Earth [30] and QGIS [31]. The map highlights the town of Atsbi Dera to the northeast and the prominent mountainous landscape surrounding the site. The blue arrow indicates north.
Figure 3 displays the terrain and contour maps of the area surrounding the Hagere Selam site. The location of the wind mast is marked on the top of a hill on both maps. The town of Hagere Selam is visible in the northwest corner of the terrain map. The nearby valleys and mountain peaks around the wind mast vary in elevation, ranging from 2250 to 2725 m above sea level. Similarly, Figure 4 illustrates the terrain and contour maps of the Mayderhu site. The town of Hintalo is located to the west of the site on the terrain map. The elevations of the nearby valleys and mountain peaks range from 2250 to 2700 m above sea level.
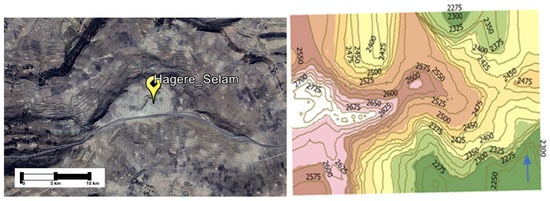
Figure 3.
Terrain and contour maps of the Hagere Selam site, with the wind mast marked on an elevated hill. The town of Hagere Selam appears in the northwest quadrant of the map. Elevations in the area range from approximately 2250 to 2725 m. The blue arrow indicates north. The maps were generated and visualized using QGIS [31] and Google Earth [30].
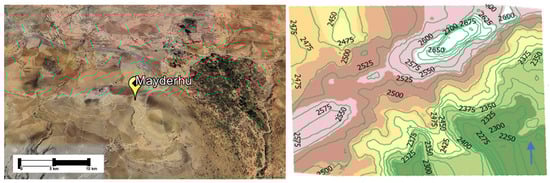
Figure 4.
Terrain and contour maps of the Mayderhu site, with the town of Hintalo located to the west. Elevations of nearby valleys and surrounding mountain peaks range from approximately 2250 to 2700 m. The blue arrow indicates north. The maps were produced using terrain data sourced from QGIS [31] and Google Earth [30].
2.2. Measurement Mast and Instruments
A wind and solar energy resource assessment study was conducted by Mekelle University between 2010 and 2012 at four measurement sites in the Geba Catchment area. For the current analysis of TI and , data recorded from three remaining sites during 2011 and 2012 were used. Table 3 provides details on the locations of the masts and the instruments used.
Table 3.
Summary of site characteristics, including latitude, longitude, and elevation above sea level. The table also lists the wind measurement instruments deployed at each site, including the DIR21+ wind vane (±3° accuracy, 0–360° range) and the MAX40+ cup anemometer (±0.1 m/s accuracy, Measuring Network of Wind Energy Institutes (MEASNET)-calibrated).
The meteorological masts were constructed as freestanding tubular towers. To ensure data quality and minimize flow distortion, sensors were mounted on horizontal booms extending approximately 1.5 m from the mast center. The anemometers and wind vanes were positioned on the side of the prevailing wind to minimize mast interference. Site exposure was characterized by open terrain at all locations. The Dera mast was situated on a hilltop with the nearest significant obstacles (low vegetation) located over 100 m away. The Hagere Selam and Mayderhu masts were also installed on elevated terrain with minimal vegetation within 50–80 m, satisfying the standard requirement for unobstructed flow.
The wind measurement system consisted of a potentiometer-based wind vane and a high-precision cup anemometer. The wind vane provided directional measurements over a full 0° to 360° range with an accuracy of ±3°, while the anemometer, designed for professional use, featured UV-resistant, non-corrosive Lexan housing, modified Teflon self-lubricating bearings, and delivered wind speed data with an accuracy of ±0.1 m/s via a 4–20 mA current loop. Both instruments comply with World Meteorological Organization (WMO) and IEC standards.
Data were acquired at a sampling rate of one measurement every three seconds over ten-minute intervals, resulting in 200 samples per interval. For each ten-minute period, the maximum, minimum, average, and standard deviation of wind speeds at 10 m and 30 m above ground level were recorded. Wind direction data were also collected, ranging from 0° to 360°, with 0° (or 360°) indicating north, measured in the clockwise direction.
This study employs a two-height measurement approach (10 m and 30 m), which is standard for regional wind assessment but inherently simplifies the vertical wind profile structure. The cup anemometers provide turbulence statistics (standard deviation and turbulence intensity) calculated from 10-min time series, following IEC guidelines for wind energy resource assessment [32]. The EKOPOWER instruments (EKOPOWER B.V., Daalakkersweg 2-92, 5641 JA Eindhoven, The Netherlands) have a manufacturer-specified distance constant of 2.9 m, which results in a low-pass filtering effect that makes them insensitive to turbulent eddies smaller than this scale (typically 10–100 cm).
However, the two-height measurement approach, while standard for wind assessment, inherently simplifies the vertical wind profile structure. Detailed multi-height studies using LiDAR systems have demonstrated significant vertical variations that two-point measurements cannot capture. For instance, ref. [33] observed wind shear exponents of 0.0468—substantially lower than the typical 0.14 value—with complex diurnal patterns and negative values during daytime conditions. Their measurements also showed turbulence intensity decreasing from 13.1% at 20 m to 9.2% at 200 m, highlighting the vertical gradient that two-height configurations approximate but cannot fully resolve. On the other hand, validation studies comparing mast-based measurements with reference systems further support the reliability of this approach, reporting strong correlations (0.90–0.97) [34]. These findings collectively contextualize the inherent limitations of our methodology while demonstrating that it follows established practices for regional wind assessment with well-characterized uncertainty ranges. Future studies incorporating higher-resolution vertical profiling are recommended.
2.3. Wind Data Characteristics and Quality Control
The quality and continuity of wind speed measurements form the foundation of this turbulence analysis. Figure 5 presents representative 10-min average wind speed time series at 10 m and 30 m heights from the 2011–2012 study period, demonstrating the comprehensive data coverage achieved across all three sites. The distinct temporal patterns visible in these raw measurements, including diurnal cycles, vertical gradients, and site-specific variability, provide the essential input data for the turbulence intensity and wind shear calculations discussed in the following sections. All subsequent analyses build upon this continuous, high-resolution dataset.
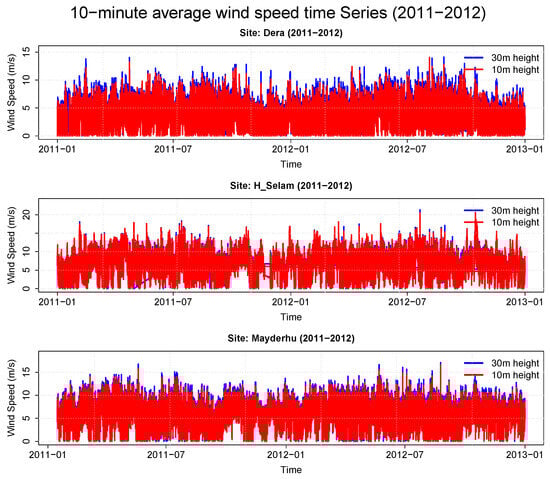
Figure 5.
Ten-minute average wind speed time series at 10 m and 30 m heights for (top) Dera, (center) Hagere Selam, and (bottom) Mayderhu sites during the 2011–2012 measurement period.
2.4. Wind Data Analysis
To support the analysis, we used the R programming language (version 4.3.2; R Core Team, 2023) for statistical computations and data visualization [35], QGIS for generating elevation and spatial distribution maps [31], Microsoft Excel for supplementary data processing and plotting [36], and Google Earth for producing terrain and site location maps [30].
The data processing followed a structured workflow comprising six sequential steps, as illustrated in Figure 6: (1) raw data quality control to remove physically impossible values and sensor error flags; (2) outlier filtering using the 3-sigma rule; (3) time alignment to consistent 10-min intervals; (4) gap analysis excluding periods with gaps exceeding 1 h and requiring >80% data availability per 10-minute interval; (5) parameter calculation of wind shear exponent () and turbulence intensity (TI) for each valid interval using Equations (1) and (2); and (6) statistical aggregation across hourly, daily, and yearly timescales for comprehensive analysis of atmospheric stability patterns.
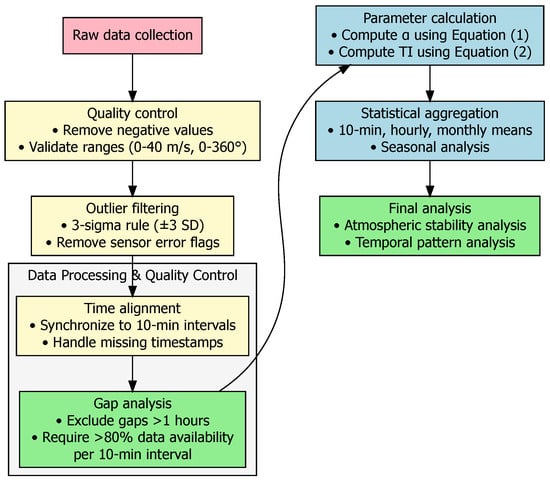
Figure 6.
Data processing workflow diagram illustrating the six sequential steps applied to wind measurement data, from raw data collection through final analysis. The workflow ensures comprehensive quality control and systematic parameter calculation for atmospheric stability assessment.
Data preprocessing involved cleaning for outliers, synchronizing time-series data, and averaging wind speeds over standardized intervals—hourly, daily, and monthly time scales. Wind roses were generated to visualize the frequency and distribution of wind directions, identifying the prevailing wind patterns and their seasonal variations. Wind direction variation was examined using wind roses, which were based on data from ten-min intervals categorized into eight compass directions: N, NE, E, SE, S, SW, W, and NW.
was determined using the power law wind profile, which relates wind speeds ( and ) at two different heights ( and ), as described by Equation (1).
The values of were calculated at each ten-minute interval and averaged hourly for the wind speeds measured at m and m.
For the calculation of both and TI, the complete dataset without minimum wind speed filtering was utilized. This approach aligns with the study’s objective of comprehensive atmospheric characterization across all stability conditions in complex terrain. While wind energy applications often apply minimum wind speed thresholds (typically 3 m/s) for power performance assessment, the use of full data including low wind speeds enables complete analysis of diurnal patterns, atmospheric stability transitions, and terrain-induced turbulence effects that occur across the entire wind speed spectrum.
TI was calculated as the ratio of the standard deviation () of wind speed to the mean wind speed (), providing a measure of wind variability at different heights and locations. Vertical profiles of TI were developed by analyzing data at the elevations of 10 m and 30 m, revealing how turbulence changes with altitude. For the ten-minute wind speed measurements, TI was computed using Equation (2), with the 30 m height values used for the data analysis.
3. Results and Discussion
3.1. Wind Speed Characteristics
The wind speed distribution analysis indicated a wide range of characteristics throughout the Geba Catchment, with mean wind speeds varying between 4.5 and 8.0 m/s at a height of 10 m. The highest mean wind speeds were recorded at the Hagere Selam site with an annual average wind speed of 8.0 m/s. In contrast, lower wind speeds, around 4.5 m/s, were observed at the Dera site. The region’s wind speed and temperature characteristics, as analyzed across the three sites, Dera, Hagere Selam, and Mayderhu (Figure 7), exhibit distinct yet interconnected patterns. The temperature trend consistently peaks in the afternoon, around 15:00, which correlates with increased wind speed. At Dera, wind speeds range from 2 m/s to 6 m/s, with a broad period of higher wind speeds occurring between 10:00 and 16:00. The maximum wind speed at 30 m is approximately 6 m/s, and the difference in wind speed between 10 m and 30 m is notably wider compared to the other sites. This suggests that Dera may experience more variable wind conditions with height, which could be influenced by local topography or thermal dynamics. In contrast, Hagere Selam and Mayderhu both exhibit a sharper increase in wind speed later in the day, with Hagere Selam peaking around 18:00 and Mayderhu around 19:00 (Figure 7). Both sites have maximum wind speeds of about 8 m/s at 30 m, indicating stronger winds than Dera. However, the difference in wind speed between 10 and 30 m is relatively small at Hagere Selam, suggesting a more stable wind profile with height. Mayderhu, while similar in trend to Hagere Selam, shows a slightly wider variation in wind speed with height, but still less pronounced than at Dera. Overall, the wind speed characteristics indicate that Dera may be more affected by local factors, while Hagere Selam and Mayderhu demonstrate stronger and more consistent winds, likely making them more favorable for wind energy applications.
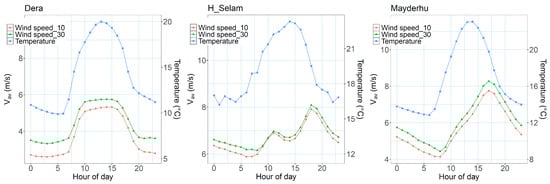
Figure 7.
Wind speed and temperature patterns at Dera, Hagere Selam, and Mayderhu show interconnected trends. Dera experiences variable wind conditions, with speeds ranging from 2 to 6 m/s and a significant difference between heights of 10 m and 30 m. In contrast, Hagere Selam and Mayderhu exhibit stronger, more consistent winds, peaking around 18:00 and 19:00, making them favorable for wind energy applications.
The seasonal wind speed characteristics of the region reveal a close relationship between temperature and wind speed variations throughout the year (Figure 8). At Dera, temperatures rise from a low of 8 °C in December to a peak of 17 °C in June, mirroring the wind speed pattern. Wind speeds at Dera are lowest in December, increase steadily until June, dip slightly in July, and then peak again in August before decreasing back to December levels. Wind speeds generally range from 3 m/s to 5 m/s, indicating moderate wind conditions that fluctuate seasonally with temperature.
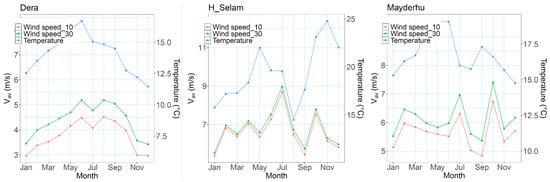
Figure 8.
Seasonal wind speed patterns at Dera, Hagere Selam, and Mayderhu closely follow temperature variations. Dera experiences moderate winds (3–5 m/s) peak in June and August, while Hagere Selam and Mayderhu show dual temperature peaks with stronger winds, particularly at Hagere Selam (5–9 m/s).
Hagere Selam and Mayderhu show more complex seasonal patterns (Figure 8), with temperatures peaking twice: once in May (22 °C for Hagere Selam and 19 °C for Mayderhu) and again in November (25 °C for Hagere Selam and 17 °C for Mayderhu). The lowest temperatures at these sites occur in January and August for Hagere Selam, and in December and August for Mayderhu. Correspondingly, wind speeds at both sites also show dual peaks, with Hagere Selam reaching its maximum wind speed in July and its lowest in September. Mayderhu follows a similar trend, though its wind speeds are slightly lower overall, ranging between 5 m/s and 7.5 m/s, compared to Hagere Selam’s 5 m/s to 9 m/s. This seasonal analysis highlights that Hagere Selam generally experiences stronger winds than Mayderhu, while Dera sees more moderate winds that align more closely with temperature changes.
3.2. Wind Direction Characteristics
The wind direction characteristics of the region, based on data from Dera, Hagere Selam, and Mayderhu, reveal both stability and variability depending on the site and season. At Dera, the wind direction predominantly follows a southeasterly flow for most of the year (Figure 9), but a significant shift to a northerly direction occurs in the summer (Figure 10). This seasonal change suggests that Dera is influenced by larger atmospheric circulation patterns or local topographic effects [37,38,39,40], which alter the prevailing winds during certain times of the year. The clear seasonal variability at Dera indicates a dynamic wind environment that responds to broader regional influences, possibly making it more challenging to predict wind patterns consistently throughout the year.
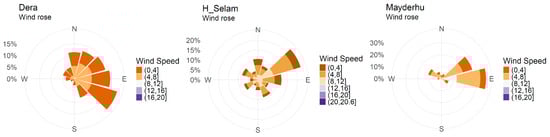
Figure 9.
Wind direction characteristics at Dera are such that the region predominantly experiences southeasterly winds with seasonal shifts, Hagere Selam shows stable northeasterly winds year-round, and Mayderhu has predominantly easterly winds with marked seasonal changes.
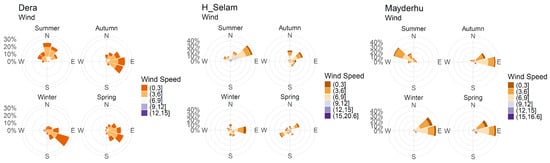
Figure 10.
The wind at Dera shifts from southeasterly to northeasterly winds in summer, Hagere Selam shows a slight southwesterly deviation in spring, and Mayderhu transitions from easterly to northwesterly winds during the summer.
In contrast, Hagere Selam exhibits more stable wind direction characteristics, with little change observed throughout the year. The prevailing winds remain consistently from the northeast (Figure 9), with only a slight deviation to a southwesterly direction during spring (Figure 10). This stability suggests that Hagere Selam is less influenced by seasonal atmospheric changes compared to the other sites. Mayderhu has predominantly easterly winds. Mayderhu, similar to Dera, experiences a marked seasonal shift in wind direction, with easterly winds becoming northwesterly during the summer months (Figure 10). This shift points to similar regional influences affecting both Dera and Mayderhu, potentially related to monsoonal patterns or other large-scale weather systems. Overall, while Hagere Selam’s wind direction remains steady, the more pronounced seasonal shifts at Dera and Mayderhu highlight the diverse wind dynamics within the region.
Further analysis of daily wind direction patterns reveals that, while slight changes occur between morning and afternoon (Figure 11), stronger winds generally prevail in the afternoon across the region. In particular, in Mayderhu, the afternoon winds consistently shift to a purely easterly direction, aligning with similar observations at Dera, where the wind direction also becomes easterly during this time. In contrast, Hagere Selam shows minimal variation in wind direction between morning and afternoon, maintaining a consistent pattern throughout the day. This indicates that, while Dera and Mayderhu experience daily fluctuations in wind direction, particularly in the afternoon, Hagere Selam remains more stable in its wind patterns across different times of the day.
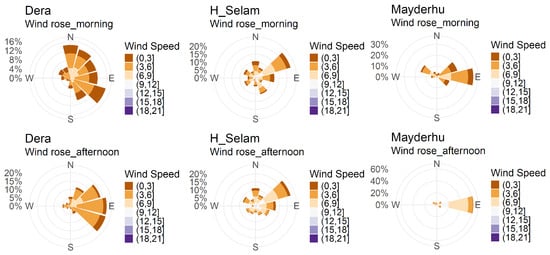
Figure 11.
Daily wind direction patterns across the region. Afternoon winds generally shift to easterly directions in Dera and Mayderhu, while Hagere Selam maintains a consistent wind direction throughout the day.
3.3. Characteristics in
At the Dera site, located at 2870 m with nearby mountains reaching 3050 m elevation, the varied between 0.1 and 0.3 (refer Figure 12), indicating strong wind gradients. A clear diurnal pattern is observed, where the is lower during the day (around 0.1) and higher at night (around 0.3). During the day, convective atmosphere conditions are observed, while the high at night (0.1–0.3) indicates a neutral to stable atmospheric condition that is active during the night, due to cooling processes that enhance temperature gradients and [41].
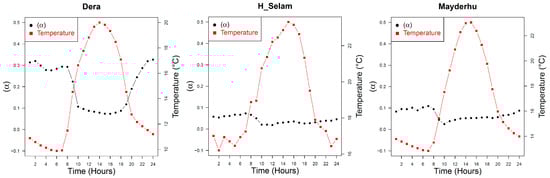
Figure 12.
at the Dera site, varying between 0.1 and 0.3, indicating strong wind gradients due to the steep terrain. The diurnal pattern shows lower during the day and higher at night, suggesting active convective conditions.
In contrast, the Hagere Selam and Mayderhu sites, at slightly lower elevations (2628 m and 2512 m, respectively), exhibited much lower values (0.0 to 0.1) conforming to convective atmospheric conditions. This indicates relatively smoother wind flow.
The yearly analysis corroborates these findings, with the Dera site showing erratic sinusoidal variations in (Figure 13), further highlighting the complex interaction between wind and mountainous terrain. However, the Hagere Selam and Mayderhu sites maintained a more stable low-wind shear pattern throughout the year.
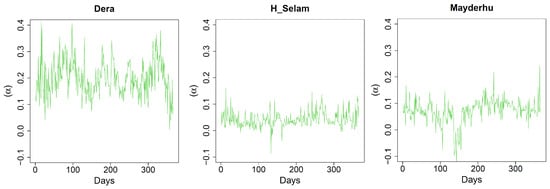
Figure 13.
Yearly variations at Dera, exhibiting erratic sinusoidal patterns due to complex terrain interactions. Hagere Selam and Mayderhu show more stable low-wind shear patterns, reflecting smoother terrain and less diurnal variation.
The strong negative correlation between temperature and at Dera also underscores the role of atmospheric conditions in shaping wind profiles. In contrast, while there is a strong correlation during night-time at Mayderhu, there is a lack of correlation between temperature and wind speed at the Hagere Selam sites. This suggests a more complex interplay of factors influencing wind dynamics in different environments.
3.4. Variation in TI
At the Dera site, the highest TI of 0.5 was recorded 10 m above ground level (Figure 14). The significant diurnal variation in TI, with lower values during the day (around 0.25) and higher values at night (up to 0.5), points to dynamic atmospheric conditions. This pattern, where the turbulence minimum coincides with the period of maximum surface heating, is a recognized characteristic of complex terrain and deviates from the classic flat-terrain paradigm [42,43]. This observed complexity is consistent with recent regional-scale findings; for instance, a sparse measurement network analysis highlighted the Afar region’s exceptional wind complexity, with stations like Assaita exhibiting rapidly shifting, multi-directional wind regimes [44]. Specifically, the suppression of midday turbulence at Dera can be attributed to the development of steady, organized upslope winds driven by daytime heating. As described by [45], these thermally-driven flows become laminar and channeled, thereby reducing small-scale turbulent mixing. Conversely, at night, increased temperature gradients and mechanically-driven katabatic flows enhance turbulence. While Dera shows greater TI at night, due to increased temperature gradients, Hagere Selam and Mayderhu display slightly higher TI during the day, with values around 0.25. At Dera, the smaller gap between the turbulence intensities at 10 m and 30 m during the day further supports the presence of well-mixed conditions associated with organized upslope flow, which reduces vertical shear. This contrast highlights the profound influence of local topography, as the distinct scales and configurations of valleys and slopes lead to fundamentally different wind regimes and turbulence characteristics [46].
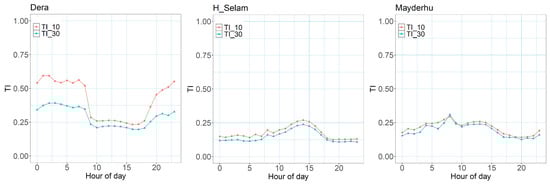
Figure 14.
At the Dera site, TI peaks at 0.5 at 10 m above ground. Significant diurnal variations are observed. Mayderhu and Hagereselam exhibit similar TI values below 0.25.
The yearly TI at Dera indicated higher values, approximately 0.4, with a significant difference observed between the turbulence intensities at 10 m and 30 m (Figure 15). In contrast, the Hagere Selam site exhibited much lower yearly turbulence intensities around 0.12. Similarly, at the Mayderhu site, TI was slightly higher, close to 0.2, but still exhibited more stable patterns than Dera.
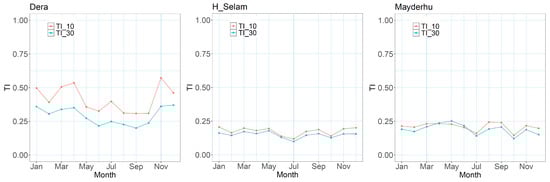
Figure 15.
Yearly TI comparisons showing Dera with higher values (approximately 0.4) and greater differences between heights of 10 m and 30 m. Hagere Selam and Mayderhu show lower and more stable turbulence intensities, indicating smoother wind flow due to flatter and less rugged terrain.
These findings align with existing research that highlights the critical role of terrain complexity in influencing wind behavior in mountain areas [47,48]. They provide a clear, observed confirmation that “traditional boundary-layer scaling approaches cannot simply be applied over highly complex topography” [42]. The localized increase in TI, particularly at sites like Dera, emphasizes the need for careful consideration of topographical features when assessing wind energy potential and understanding atmospheric processes in such regions. Variability in TI also suggests that wind conditions in hilly terrains are highly dynamic, necessitating detailed site-specific studies to capture the full range of wind behavior.
3.5. Stability Analysis
This study investigates atmospheric stability dynamics at the Dera, Hagere Selam, and Mayderhu sites through analysis of diurnal wind shear and turbulence intensity variations. The Dera site exhibits turbulent/unstable conditions during early morning hours, with peak wind shear ( = 0.33) occurring at 2 a.m., followed by maximum turbulence intensity (TI = 0.38) at 3 a.m. The high TI value (>0.3) and moderate-to-strong shear ( > 0.2) indicate significant mechanical mixing, disrupting atmospheric stability. The one-hour lag between shear and turbulence peaks suggests shear-driven instability transitioning into fully developed turbulence. This pattern implies nocturnal turbulence, likely influenced by boundary-layer dynamics (e.g., low-level jets or radiative cooling effects).
The Hagere Selam site demonstrates predominantly stable atmospheric conditions, characterized by weak wind shear (peak = 0.09 overnight from 2–8 a.m.) and moderate daytime turbulence (max TI = 0.25 at 2 p.m.). The very low wind shear ( < 0.1) suppresses mechanical turbulence generation, particularly during nighttime stable layers, while the daytime TI of 0.25—just below the high-turbulence threshold (TI > 0.3)—suggests only mild mixing likely driven by thermal convection rather than shear. This pattern indicates a stable nocturnal boundary layer with minimal turbulence risk and neutral-to-slightly turbulent daytime conditions, making the site suitable for operations sensitive to turbulence, such as low-wind energy harvesting or precision meteorological measurements.
Observations in Mayderhu reveal distinct diurnal patterns, with peak turbulence (TI = 0.27) occurring at 08:00 a.m. alongside maximum wind shear ( = 0.12), indicating shear-driven mechanical mixing during morning transition periods. Daytime stabilization is evidenced by diminishing turbulence (TI = 0.14 by 08:00 p.m.) and minimal wind shear ( = 0.03 at noon), reflecting strong thermal stratification. The site demonstrates characteristic boundary-layer evolution, with morning instability giving way to afternoon/evening stability. These findings have implications for air quality modeling, wind energy operations, and aviation safety in similar topographic settings. The consistent diurnal stability transition suggests predictable turbulence windows, though further investigation incorporating thermal gradient data could enhance stability characterization through Richardson number analysis.
3.6. Wind Turbulence Class
To evaluate the turbulence generated by winds, the wind speed standard deviation was plotted at 10 m and 30 m heights as a function of mean wind speed for three sites: Dera, Mayderhu, and Hagere Selam (Figure 16). The resulting scatter plots, differentiated by color, illustrate the relationship between wind speed variability and average wind speeds. The solid lines represent the theoretical models for turbulence classes A, B, and C as defined by the International Electrotechnical Commission (IEC) 61400-1 standard [32], which are based on a linear relationship between standard deviation and mean wind speed.
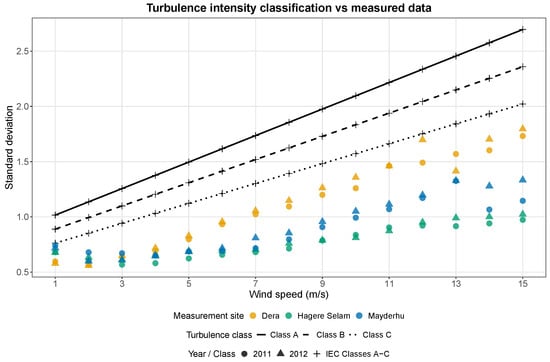
Figure 16.
Wind speed standard deviation as a function of mean wind speed at 10 m and 30 m heights for the Dera (D2011, D2012), Mayderhu (M2011, M2012), and Hagere Selam (H2011, H2012) sites, with turbulence classes of “A”, “B”, and “C” from IEC standards as benchmarks. All sites generally exhibit standard deviations below IEC specifications, indicating acceptable turbulence levels for turbine operations. Dera shows higher variability in wind speeds compared to Mayderhu and Hagere Selam.
The measured data from all sites show a generally increasing trend, where higher wind speeds correspond to greater variability, though with natural scatter due to changing atmospheric conditions. While the standard deviation at all sites generally falls below the IEC specifications, indicating that turbulence levels are within IEC Class C, the Dera site (D2011, D2012) exhibits a higher standard deviation compared to Mayderhu (M2011, M2012) and Hagere Selam (H2011, H2012). This suggests that Dera experiences more variability in wind speeds, although still within the tolerable range.
The lower standard deviation at Mayderhu and Hagere Selam implies more stable wind conditions, which could result in smoother turbine operations and reduced wear and tear. Therefore, while all three sites have conditions of IEC Class C, Dera’s relatively higher TI warrants further attention, particularly for turbine design and maintenance strategies.
3.7. The Influence of Prevailing Wind Against TI and
The influence of the prevailing wind against the TI and exponent is depicted in Figure 17. At the Dera site, the wind speed analysis reveals that the highest wind speeds, exceeding 6 m/s, predominantly originate from the north, northeast, and southeast. This directional pattern suggests that these areas are the primary contributors to significant wind energy at the site. In addition, the , which indicates the rate at which the wind speed changes with height, is observed to be higher in the east and southeast prevailing wind directions. This suggests that these directions experience more pronounced vertical wind speed gradients.
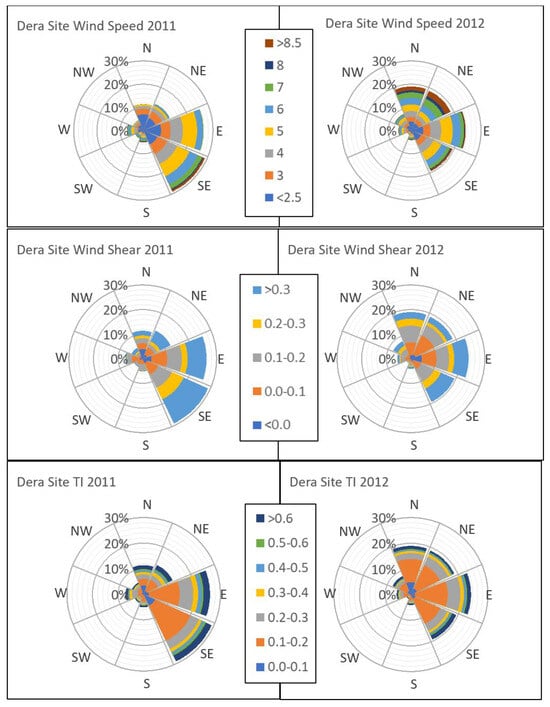
Figure 17.
Influence of prevailing wind direction on TI and at the Dera site. The highest wind speeds, over 6 m/s, originate primarily from the north, northeast, and southeast, with the east and southeast showing higher , indicating stronger vertical wind gradients. Additionally, TI is highest from the north to southeast, with the most turbulent winds (intensity > 0.6) coming from the east and southeast.
In terms of TI, which reflects the degree of chaotic fluctuations in wind speed, the highest values are recorded from the north to the southeast, following a clockwise pattern. This indicates that winds from these directions are more prone to instability, due to interactions with obstacles or varying thermal conditions. However, it is notable that the most turbulent winds, with TI exceeding 0.6, predominantly come from the east and southeast. This suggests that these directions not only experience higher but also more significant turbulence, which could have implications for wind energy harvesting and structural safety.
The combination of high wind speeds, increased shear exponents, and elevated TI from the east and southeast highlights the importance of these directions in shaping the wind dynamics at the Dera site. For applications such as wind energy, special attention should be paid to mitigating the potential impacts of high turbulence while maximizing the benefits of strong winds from these prevailing directions.
4. Conclusions
This study comprehensively analyzed wind shear, turbulence intensity, and atmospheric stability across three sites in the Geba Catchment, Ethiopia, revealing distinct wind characteristics influenced by local topography and seasonal dynamics. Key findings include the following:
- Wind speed and shear variations: Hagere Selam exhibited the strongest and most consistent winds (8.0 m/s), favorable for wind energy, while Dera showed lower speeds (4.5 m/s) and higher wind shear (–0.3), attributed to terrain-induced turbulence. Mayderhu displayed intermediate behavior, with moderate wind speeds and shear.
- Turbulence intensity (TI): Dera recorded the highest TI (0.5), particularly at night, due to temperature inversions and mechanical mixing. Hagere Selam and Mayderhu had lower TI (<0.25), indicating more stable conditions.
- Wind direction and seasonality: Dera and Mayderhu experienced seasonal wind shifts, likely linked to monsoonal patterns, whereas Hagere Selam maintained stable northeasterly winds year-round.
- Atmospheric stability: Dera’s nocturnal turbulence and high shear contrasted with Hagere Selam’s stable regime, highlighting the role of boundary-layer dynamics. Mayderhu exhibited transitional stability, with morning turbulence subsiding by evening.
- Implications for wind energy: While all sites met IEC Class C turbulence standards, Dera’s higher variability necessitates robust turbine designs. Hagere Selam’s strong, steady winds make it the most suitable for wind farms, whereas Mayderhu offers moderate potential.
These findings emphasize the need for site-specific wind assessments in hilly regions, where terrain and stability significantly impact wind resource viability. Future studies should incorporate additional meteorological parameters (e.g., Richardson numbers) to refine stability predictions and optimize energy harvesting strategies.
Author Contributions
Conceptualization, M.B.K.; methodology, M.B.K. and P.G.E.; software, M.B.K. and P.G.E.; validation, M.B.K., P.G.E., H.A.K., F.F.N. and A.M.M.; formal analysis, M.B.K. and P.G.E.; writing—original draft preparation, M.B.K.; writing—review and editing, M.B.K., P.G.E., H.A.K., F.F.N. and A.M.M.; visualization, M.B.K. and P.G.E. All authors have read and agreed to the published version of the manuscript.
Funding
The wind measurement campaign was supported by: the EnPe programme (Norwegian Programme for Capacity Development in Higher Education and Research for Development within Energy and Petroleum), funded by the Norwegian Agency for Development Cooperation (Norad); the VLIR-UOS Programme for Institutional University Cooperation (IUC) with Mekelle University (Flemish Interuniversity Council); and the Ethiopian National Agricultural Research Fund (NARF). The APC was covered through the NORHED II–funded collaborative project titled Energy Technology Project ENET.
Institutional Review Board Statement
Not applicable.
Informed Consent Statement
Not applicable.
Data Availability Statement
The R code used for data processing, statistical analysis, and visualization, along with the processed datasets supporting this study, are available upon request from the corresponding author. Raw measurement data can be made available subject to data sharing agreements with Mekelle University.
Conflicts of Interest
The authors declare no conflicts of interest.
References
- Shikhovtsev, A.Y. Reference optical turbulence characteristics at the Large Solar Vacuum Telescope site. Publ. Astron. Soc. Jpn. 2024, 76, 538–549. [Google Scholar] [CrossRef]
- Shikhovtsev, A.Y.; Kovadlo, P.G.; Lezhenin, A.A.; Gradov, V.S.; Zaiko, P.O.; Khitrykau, M.A.; Kirichenko, K.E.; Driga, M.B.; Kiselev, A.V.; Russkikh, I.V.; et al. Simulating Atmospheric Characteristics and Daytime Astronomical Seeing Using Weather Research and Forecasting Model. Appl. Sci. 2023, 13, 6354. [Google Scholar] [CrossRef]
- Patil, A.; Thosar, A. Fault Simulation and Severity Analysis in Wind Energy System. In Proceedings of the 2020 International Conference on Industry 4.0 Technology (I4Tech), Pune, India, 13–15 February 2020; pp. 7–12. [Google Scholar] [CrossRef]
- St. Martin, C.M.; Lundquist, J.K.; Clifton, A.; Poulos, G.S.; Schreck, S.J. Wind turbine power production and annual energy production depend on atmospheric stability and turbulence. Wind Energy Sci. 2016, 1, 221–236. [Google Scholar] [CrossRef]
- Kim, D.Y.; Kim, Y.H.; Kim, B.S. Changes in wind turbine power characteristics and annual energy production due to atmospheric stability, turbulence intensity, and wind shear. Energy 2021, 214, 119051. [Google Scholar] [CrossRef]
- Basse, A.; Pauscher, L.; Callies, D. Improving Vertical Wind Speed Extrapolation Using Short-Term Lidar Measurements. Remote Sens. 2020, 12, 1091. [Google Scholar] [CrossRef]
- Asadi, M.; Pourhossein, K. Wind farm site selection considering turbulence intensity. Energy 2021, 236, 121480. [Google Scholar] [CrossRef]
- Ren, G.R.; Liu, J.F.; Wan, J.; Guo, Y.F.; Hu, Q.H.; Yu, D.R. Prediction of the Standard Deviation of Wind Speed Turbulence. J. Environ. Inform. 2018, 32, 1–13. [Google Scholar] [CrossRef]
- Li, F.; Ren, G.; Lee, J. Multi-step wind speed prediction based on turbulence intensity and hybrid deep neural networks. Energy Convers. Manag. 2019, 186, 306–322. [Google Scholar] [CrossRef]
- Pérez Albornoz, C.; Escalante Soberanis, M.A.; Ramírez Rivera, V.; Rivero, M. Review of atmospheric stability estimations for wind power applications. Renew. Sustain. Energy Rev. 2022, 163, 112505. [Google Scholar] [CrossRef]
- Meldau, L.F.; Li, B.; McKenna Neuman, C.; Cooper, J.R. Constant stress layer characteristics in simulated stratified air flows: Implications for aeolian transport. Aeolian Res. 2023, 63–65, 100888. [Google Scholar] [CrossRef]
- Cen, H.; Zhou, Q.; Korobenko, A. Isogeometric variational multiscale modeling of stably stratified flow over complex terrains. Math. Model. Methods Appl. Sci. 2022, 32, 2371–2399. [Google Scholar] [CrossRef]
- Letzgus, P.; Guma, G.; Lutz, T. Computational fluid dynamics studies on wind turbine interactions with the turbulent local flow field influenced by complex topography and thermal stratification. Wind Energy Sci. 2022, 7, 1551–1573. [Google Scholar] [CrossRef]
- Resen, A.K.; Khamees, A.B.; Yaseen, S.F. Determination of Wind Shear Coefficients and Conditions of Atmospheric Stability for Three Iraqi Sites. IOP Conf. Ser. Mater. Sci. Eng. 2020, 881, 012161. [Google Scholar] [CrossRef]
- Radünz, W.C.; Sakagami, Y.; Haas, R.; Petry, A.P.; Passos, J.C.; Miqueletti, M.; Dias, E. Influence of atmospheric stability on wind farm performance in complex terrain. Appl. Energy 2021, 282, 116149. [Google Scholar] [CrossRef]
- Radünz, W.C.; Sakagami, Y.; Haas, R.; Petry, A.P.; Passos, J.C.; Miqueletti, M.; Dias, E. The variability of wind resources in complex terrain and its relationship with atmospheric stability. Energy Convers. Manag. 2020, 222, 113249. [Google Scholar] [CrossRef]
- Gautam, A.; Warudkar, V.; Bhagoria, J.L. A comparative analysis of wind characteristics for distinct terrains of India. Sustain. Energy Technol. Assess. 2022, 52, 102089. [Google Scholar] [CrossRef]
- Rehman, S.; Al-Abbadi, N.M. Wind shear coefficient, turbulence intensity and wind power potential assessment for Dhulom, Saudi Arabia. Renew. Energy 2008, 33, 2653–2660. [Google Scholar] [CrossRef]
- Ren, G.; Liu, J.; Wan, J.; Li, F.; Guo, Y.; Yu, D. The analysis of turbulence intensity based on wind speed data in onshore wind farms. Renew. Energy 2018, 123, 756–766. [Google Scholar] [CrossRef]
- Lopez-Villalobos, C.A.; Rodriguez-Hernandez, O.; Campos-Amezcua, R.; Hernandez-Cruz, G.; Jaramillo, O.A.; Mendoza, J.L. Wind Turbulence Intensity at La Ventosa, Mexico: A Comparative Study with the IEC61400 Standards. Energies 2018, 11, 3007. [Google Scholar] [CrossRef]
- Albani, A.; Ibrahim, M.Z.; Yong, K.H. Wind shear data at two different terrain types. Data Brief 2019, 25, 104306. [Google Scholar] [CrossRef]
- Kutty, S.S.; Khan, M.G.M.; Ahmed, M.R.; Kutty, S.S.; Khan, M.G.M.; Ahmed, M.R. Estimation of different wind characteristics parameters and accurate wind resource assessment for Kadavu, Fiji. AIMS Energy 2019, 7, 760–791. [Google Scholar] [CrossRef]
- Asress, M.B.; Simonovic, A.; Komarov, D.; Stupar, S. Wind energy resource development in Ethiopia as an alternative energy future beyond the dominant hydropower. Renew. Sustain. Energy Rev. 2013, 23, 366–378. [Google Scholar] [CrossRef]
- Bekele, G.; Palm, B. Feasibility study for a standalone solar–wind-based hybrid energy system for application in Ethiopia. Appl. Energy 2010, 87, 487–495. [Google Scholar] [CrossRef]
- Bekele, G.; Boneya, G. Design of a Photovoltaic-Wind Hybrid Power Generation System for Ethiopian Remote Area. Energy Procedia 2012, 14, 1760–1765. [Google Scholar] [CrossRef]
- Woldegiyorgis, T.A.; Terefe, E.A. Wind Energy potential Estimation Using Weibull and Rayleigh Distribution Models and surface measured data at Debre Birehan, Ethiopia. Appl. J. Environ. Eng. Sci. 2020, 6, 244–262. [Google Scholar] [CrossRef]
- Yitayew, B.; Bogale, W. Wind Energy Data Analysis and Resource Mapping of Dangla, Gojjam, Ethiopia. Energy Eng. 2022, 119, 2513–2532. [Google Scholar] [CrossRef]
- Bekele, M.F.; Tesfaye, M.Y.; Bekele, R.M.L. Revised Meteorological Station Network Master Plan Preparation. Available online: https://www.ethiomet.gov.et/publications/revised-meteorological-station-network-master-plan-for-2021-2030 (accessed on 23 August 2025).
- Bayray, M.; Mustefa, A.; Yohannes, F.; Kiros, H.; Haileslasie, A.; Gebray, P.; Hayelom, M.; Dagne, A. Wind Energy Data Analysis and Resource Mapping of Geba Catchment, North Ethiopia. Wind Eng. 2013, 37, 333–345. [Google Scholar] [CrossRef]
- Google LLC. Google. 2023. Available online: https://www.google.com (accessed on 30 April 2025).
- QGIS Development Team. QGIS Geographic Information System [Software]; Open Source Geospatial Foundation Project: Washington, DC, USA, 2023; Available online: https://qgis.org (accessed on 30 April 2025).
- IEC 61400-1; Wind Energy Generation Systems—Part 1: Design Requirements. International Electrotechnical Commission: Geneva, Switzerland, 2019. Available online: https://www.iec.ch (accessed on 30 April 2025).
- Grima, G. Investigating Wind Variations Within the Atmospheric Boundary Layer: A Maltese Case Study Using LiDAR. Master’s Thesis, University of Malta, Valletta, Malta, 2024. Available online: https://www.um.edu.mt/library/oar/handle/123456789/130603 (accessed on 30 April 2025).
- Waars, N.D. Lidar and MCP in Wind Resource Estimations Above Measurement-Mast Height. Master’s Thesis, Delft University of Technology and DTU, Delft, The Netherlands, 2017. Available online: https://repository.tudelft.nl/record/uuid:a5ff5e5c-8d1d-48d7-afde-dcd165cd5d07 (accessed on 30 April 2025).
- R Core Team. R: A Language and Environment for Statistical Computing; R Foundation for Statistical Computing: Vienna, Austria, 2023. [Google Scholar]
- Microsoft Corporation. Microsoft Excel. 2018. Available online: https://www.microsoft.com/en-us/microsoft-365/excel (accessed on 30 April 2025).
- Tucker, M.R.; Pedgley, D.E. Summer winds around the southern Red Sea. Arch. Meteorol. Geophys. Bioklimatol. Ser. B 1977, 25, 221–231. [Google Scholar] [CrossRef]
- Segele, Z.T.; Lamb, P.J. Characterization and variability of Kiremt rainy season over Ethiopia. Meteorol. Atmos. Phys. 2005, 89, 153–180. [Google Scholar] [CrossRef]
- Segele, Z.T.; Lamb, P.J.; Leslie, L.M. Large-scale atmospheric circulation and global sea surface temperature associations with Horn of Africa June–September rainfall. Int. J. Climatol. 2009, 29, 1075–1100. [Google Scholar] [CrossRef]
- Diro, G.T.; Grimes, D.I.F.; Black, E. Teleconnections between Ethiopian summer rainfall and sea surface temperature: Part I—observation and modelling. Clim. Dyn. 2011, 37, 103–119. [Google Scholar] [CrossRef]
- Hans, A.C.; Brandt, P.; Gasparin, F.; Claus, M.; Cravatte, S.; Horstmann, J.; Reverdin, G. Observed Diurnal Cycles of Near-Surface Shear and Stratification in the Equatorial Atlantic and Their Wind Dependence. J. Geophys. Res. Ocean. 2024, 129, e2023JC020870. [Google Scholar] [CrossRef]
- Rotach, M.W.; Zardi, D. On the boundary-layer structure over highly complex terrain: Key findings from MAP. Q. J. R. Meteorol. Soc. 2007, 133, 937–948. [Google Scholar] [CrossRef]
- Serafin, S.; Adler, B.; Cuxart, J.; De Wekker, S.F.J.; Gohm, A.; Grisogono, B.; Kalthoff, N.; Kirshbaum, D.J.; Rotach, M.W.; Schmidli, J.; et al. Exchange Processes in the Atmospheric Boundary Layer Over Mountainous Terrain. Atmosphere 2018, 9, 102. [Google Scholar] [CrossRef]
- Enday, P.G.; Kahsay, M.B.; Nyssen, J.; Van Ginderachter, M.; Termonia, P.; Van Schaeybroeck, B. Validation of the wind climatology from the ALARO-0 model at different resolutions over Ethiopia. Theor. Appl. Climatol. 2024, 155, 3297–3312. [Google Scholar] [CrossRef]
- Marchio, M. Dynamics of Thermally-Driven Upslope Winds. Ph.D. Thesis, Università degli Studi di Trento, Trento, Italy, 2023. Available online: https://tesidottorato.depositolegale.it/handle/20.500.14242/178403 (accessed on 30 April 2025).
- Oldroyd, H.J.; Pardyjak, E.R.; Higgins, C.W.; Parlange, M.B. Buoyant Turbulent Kinetic Energy Production in Steep-Slope Katabatic Flow. Bound.-Layer Meteorol. 2016, 161, 405–416. [Google Scholar] [CrossRef]
- Barber, S.; Schubiger, A.; Koller, S.; Eggli, D.; Radi, A.; Rumpf, A.; Knaus, H. The wide range of factors contributing to wind resource assessment accuracy in complex terrain. Wind Energy Sci. 2022, 7, 1503–1525. [Google Scholar] [CrossRef]
- Negash, E.; Van Schaeybroeck, B.; Termonia, P.; Van Ginderachter, M.; Van Weverberg, K.; Nyssen, J. Topoclimate and diurnal cycle of summer rain over the Ethiopian highlands in a convection-permitting simulation. Int. J. Climatol. 2024, 44, 406–427. [Google Scholar] [CrossRef]
Disclaimer/Publisher’s Note: The statements, opinions and data contained in all publications are solely those of the individual author(s) and contributor(s) and not of MDPI and/or the editor(s). MDPI and/or the editor(s) disclaim responsibility for any injury to people or property resulting from any ideas, methods, instructions or products referred to in the content. |
© 2025 by the authors. Licensee MDPI, Basel, Switzerland. This article is an open access article distributed under the terms and conditions of the Creative Commons Attribution (CC BY) license (https://creativecommons.org/licenses/by/4.0/).