
Skip to Content
  • 3.4
    Impact Factor
  • 9.0
    CiteScore
  • 22 days
    Submission to First Decision
  • 5 days
    Acceptance to Publication

Applied System Innovation

Applied System Innovation (ASI) is an international, peer-reviewed, open access journal on integrated engineering and technology, published monthly online. It is the official journal of the International Institute of Knowledge Innovation and Invention (IIKII). 

Get Alerted

Add your email address to receive forthcoming issues of this journal.

All Articles (1,046)

  • Article
  • Open Access

Generative-AI systems are increasingly trained on datasets containing AI-generated content, creating recursive feedback that may cause progressive losses of tail mass, diversity, and effective variance in learned distributions–a phenomenon commonly associated with model collapse. Existing analyses are primarily empirical or based on discrete-generation mixture models, motivating the development of a continuous-time dynamical framework. We develop a SIRS-type compartmental model, in which a normalized training-data pool is divided into clean, AI-polluted, and flagged/recovered fractions, with synthetic seeding (σ) and real-data preservation (ρ). We establish well-posedness, positivity, boundedness, and positive invariance; derive the equilibria and an explicit contamination threshold governing the clean equilibrium in the unseeded system; and analyze local stability and global convergence using planar dynamical-systems methods. Numerical simulations and parameter sweeps illustrate the resulting dynamics. In addition, a proof-of-concept fit of the reduced contamination–seeding subsystem to independently reported web-content prevalence data reproduces the observed post-2022 growth trend (R2=0.977). Contamination (β) and synthetic seeding (σ) increase equilibrium pollution, whereas detection (γ) and real-data preservation (ρ) reduce it. Within the parameter ranges investigated, increasing the cleaning rate (α) can indirectly increase equilibrium pollution by returning more data to the clean compartment, where it is again exposed to contamination. These results identify continuous real-data preservation and effective detection as key mechanisms for limiting synthetic-data pollution in generative-AI training ecosystems.

Appl. Syst. Innov.

2 November 2026
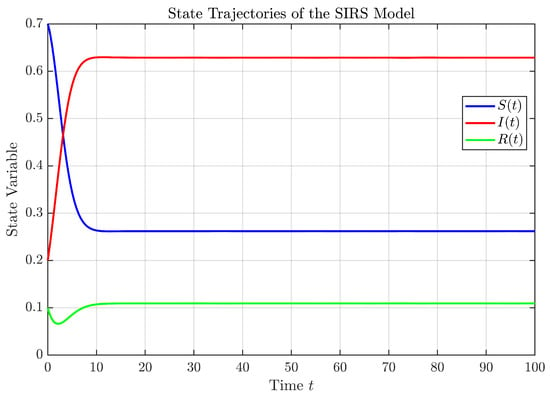
Time evolution of the SIRS model representing clean data 
  
    S
    (
    t
    )
  
, AI-polluted data 
  
    I
    (
    t
    )
  
, and recovered data 
  
    R
    (
    t
    )
  
.
  • Article
  • Open Access

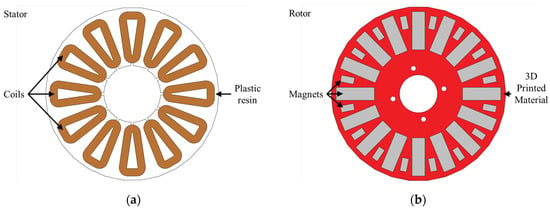
The paper develops a dynamic model for ironless axial-flux permanent-magnet synchronous machines (AFPMSMs) fabricated using 3D-printing techniques. The model employs lumped parameters determined through an efficient two-dimensional (2D) magnetic-field analysis. The proposed methodology is based on the machine’s state differential equations, enabling an overall dynamic representation through time-stepping simulations in software defined by the corresponding block diagrams. The state equations of the electrical subsystem are formulated in the time domain using a per-phase lumped-parameter equivalent circuit of the stator winding. The mechanical subsystem is represented by modeling the rotor motion equation as the dynamics of a rotating concentrated mass. The lumped parameters of the dynamic model are then evaluated, including the flux linkage, the resistance and inductance of the electrical subsystem, and the inertia and damping coefficients of the mechanical subsystem. The electrical parameters are computed using finite element analysis (FEA) with a specifically developed, computationally efficient 2D representation. The accuracy of this approach is verified through comparison with a corresponding three-dimensional (3D) analysis, which requires substantially greater computational resources. Although ironless machines exhibit increased leakage magnetic-field components owing to the 3D field distribution in the end regions, these components primarily affect the inductance terms and contribute negligibly to the electromagnetic forces. Finally, the mechanical parameters—such as the moment of inertia and the damping coefficients—are evaluated using classical formulas. The calculated parameters are further validated through experimental measurements performed on a prototype machine.

Appl. Syst. Innov.

31 October 2026

Prototype AFPMSM configuration; (a) Stator disc; (b) Rotor disc.
  • Article
  • Open Access

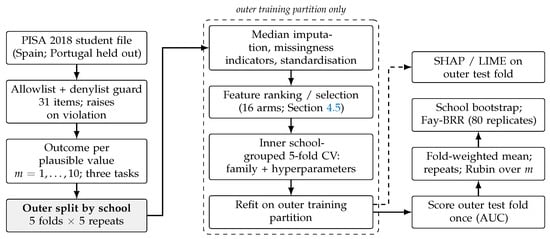
Educational data mining (EDM) often reports classifiers and feature selectors fitted to large-scale assessments without respecting how these surveys are designed. This study specifies an evaluation protocol for such data—a published predictor allowlist enforced in code, school-grouped nested cross-validation, outcome categories derived from each of ten plausible values and combined by Rubin’s rules, and design-based standard errors from replicate weights for the fitted prediction rules—and uses it to benchmark variable-length particle swarm optimisation (VLPSO) against fifteen alternatives on the Spanish sample of PISA 2018 (29,786 students, 1087 schools). Mathematics proficiency bands were discriminated with an area under the curve of 0.8850 (Low vs. High), 0.7520 (Low vs. Medium) and 0.6963 (Medium vs. High); a label-permutation null averaged 0.4989, and measurement error contributed about half of the variance. Across 12,000 matched selector fits, no method improved on the full predictor set. VLPSO retained four to six of 31 items at a cost of 0.0257–0.0368 in AUC, did not differ from binary swarm optimisation, and was less stable than most filter and embedded selectors. SHAP rankings were concordant across 50 models per task, and models transferred to Portugal without loss. VLPSO compresses predictors at a measurable cost; it does not improve prediction.

Appl. Syst. Innov.

30 October 2026

The evaluation protocol. The outer split by school precedes every step that learns from the data; steps inside the dashed box are refitted within each outer training partition, and never see the outer test fold. The procedure is repeated for each of the ten plausible values, five repeats, and five outer folds; the results are combined as described in Section 4.2.
  • Article
  • Open Access

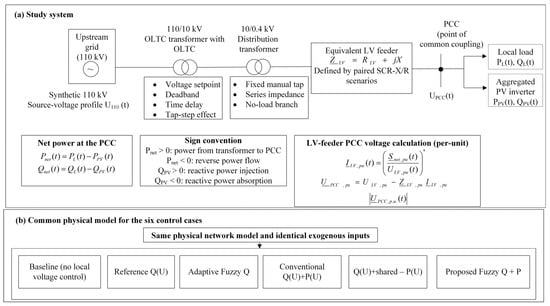
Smart-inverter Volt–Var and Volt–Watt control is established practice, but the relative merits of local controller architectures depend on network conditions and inverter capability. This simulation-based study evaluates a reactive-power-priority adaptive Fuzzy Q + P controller against fixed Q(U), conventional Q(U) + P(U), and Q(U) with the same selective P(U) decision mechanism, together with the Fuzzy Q-only and uncontrolled cases. All six cases were assessed under 400 matched 48 h scenarios using a balanced three-phase quasi-steady-state equivalent. Relative to Q(U), Fuzzy Q + P reduced exposure above 1.11 p.u. by 2.20% and modelled voltage-protection trips by 3.98%, with 48.33% greater reactive-power effort and 0.23% less generated PV energy. Against conventional Q(U) + P(U), the critical-overvoltage duration was 1.17% shorter, but trips were 1.59% more frequent, generated PV energy was 0.57% lower, and reactive-power effort was 46.89% higher. Direct P(U) curtailment occurred in 113 of the 400 scenarios. An uncalibrated equivalent feeder-voltage calculation was separately assessed against 81,951 synchronized real-site samples (RMSE 0.001038 p.u.); this does not experimentally validate the controllers. The time-step convergence assessment did not meet its predefined acceptance criteria; therefore, protection-related results should be interpreted as numerical indicators within the implemented model. The findings therefore indicate a scenario-dependent voltage-security–energy–reactive-effort trade-off, not universal superiority over established combined control.

Appl. Syst. Innov.

30 October 2026

Study system and PCC voltage calculation framework. (a) Balanced three-phase equivalent of the modelled 110/10/0.4 kV supply system, equivalent LV feeder, PCC, local load, and aggregated PV inverter, including the adopted power-flow sign convention and PCC voltage calculation. (b) Common physical network model used for all six control cases: Baseline, reference Q(U), conventional Q(U) + P(U), Q(U) + shared-P(U), adaptive Fuzzy Q, and proposed Fuzzy Q + P. In panel (a), the overlapping white circles denote transformers, the solid lines denote electrical connections, the arrows indicate the reference direction in the schematic, and the superscript asterisk (*) denotes the complex conjugate.

Featured Articles of Last Quarter

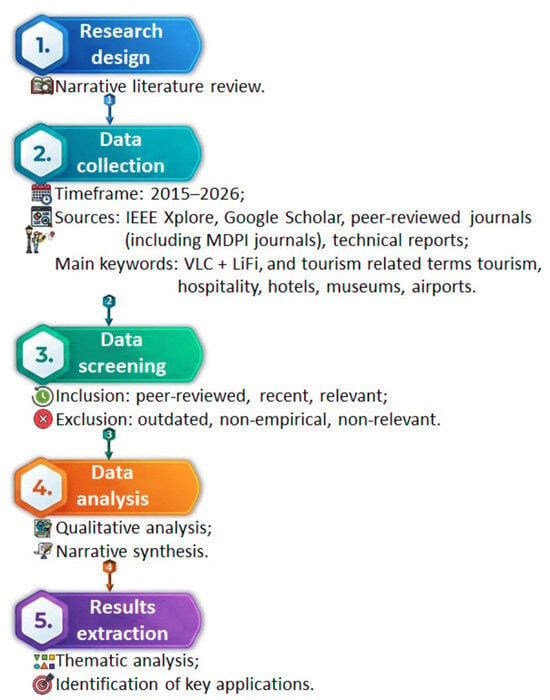
Flowchart of the literature selection process and methodological approach.
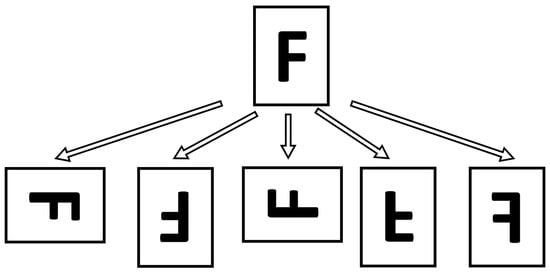
Original simple image (above) and five new derived: three rotations and two flips.

Highly Accessed Articles

News & Conferences

Latest Issues

Open for Submission

Journal Sections

XFacebookLinkedIn
Appl. Syst. Innov. - ISSN 2571-5577