

Journal Description
Analytics
Analytics
is an international, peer-reviewed, open access journal on methodologies, technologies, and applications of analytics, published quarterly online by MDPI.
- Open Access— free for readers, with article processing charges (APC) paid by authors or their institutions.
- High Visibility: indexed within Scopus and other databases.
- Journal Rank: CiteScore - Q1 (Analysis)
- Rapid Publication: manuscripts are peer-reviewed and a first decision is provided to authors approximately 24.2 days after submission; acceptance to publication is undertaken in 5.7 days (median values for papers published in this journal in the first half of 2026).
- Recognition of Reviewers: APC discount vouchers, optional signed peer review, and reviewer names published annually in the journal.
- Analytics is a companion journal of Mathematics.
- Journal Cluster of Information Systems and Technology: Analytics, Applied System Innovation, Cryptography, Data, Digital, Informatics, Information, Journal of Cybersecurity and Privacy and Multimedia.
Latest Articles
Structural Inequities and Mathematics Achievement in Alabama Public Schools
Analytics 2026, 5(3), 23; https://doi.org/10.3390/analytics5030023 - 5 Jul 2026
Abstract
►
Show Figures
Demographic disparities in mathematics proficiency have been a persistent issue in the United States public schools for the entire history of the public school system. Previous research suggests that schools serving predominantly minority students often face challenges related to fewer certified teachers and
[...] Read more.
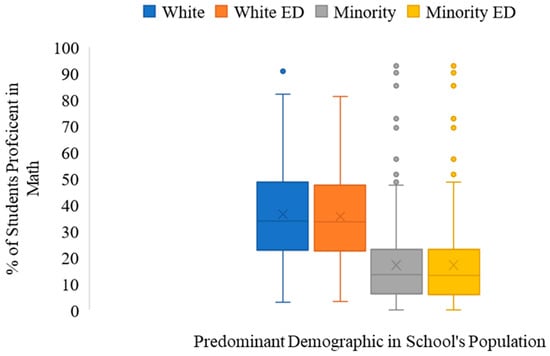
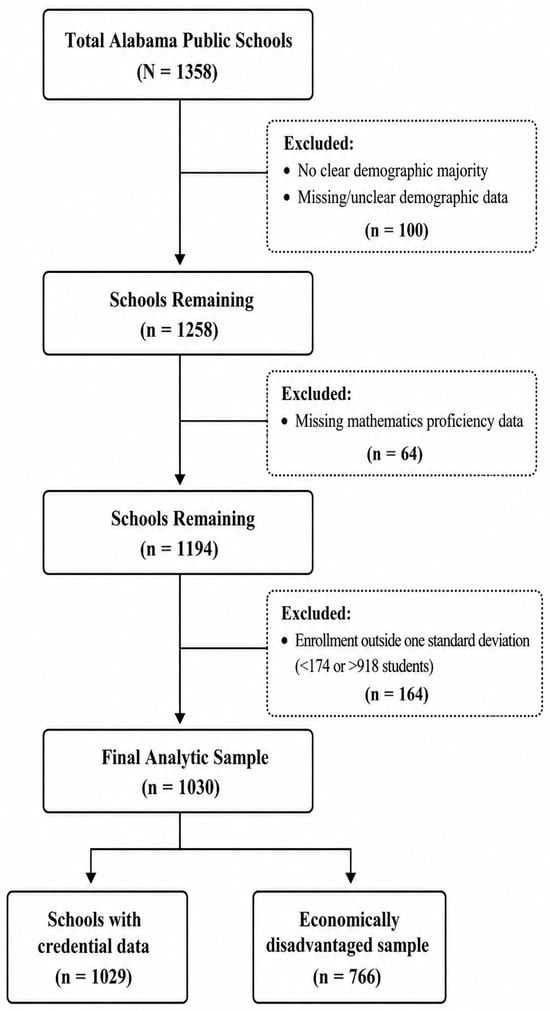
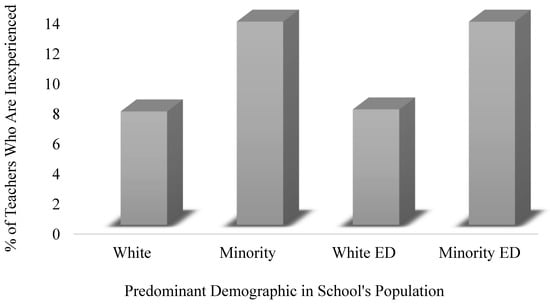
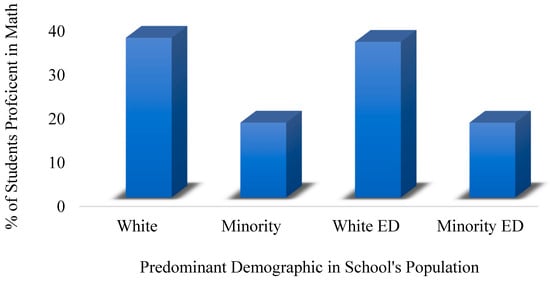
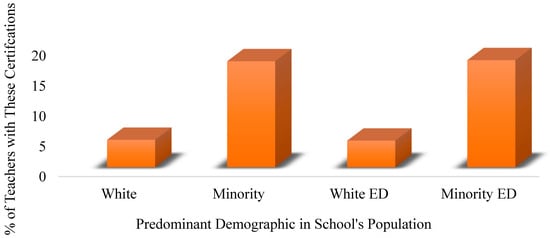
Demographic disparities in mathematics proficiency have been a persistent issue in the United States public schools for the entire history of the public school system. Previous research suggests that schools serving predominantly minority students often face challenges related to fewer certified teachers and lower mathematical achievement levels. This paper investigates how school demographic composition and socioeconomic conditions are associated with differences in mathematics achievement across Alabama public schools. Focusing on the relationship between school demographics and teacher qualifications, it examines how racial composition and economic disadvantage impact student outcomes. Data on mathematics proficiency, teacher certification, experience, and school demographics were analyzed. T-test results revealed significant differences in mathematics achievement between students attending predominantly white schools and those attending predominantly schools serving historically marginalized populations, including schools serving large proportions of economically disadvantaged students. Although linear regression showed a weak overall correlation between teacher experience and proficiency, the relationship between teacher certification and student performance was significantly different from zero, suggesting a meaningful connection.
Full article
Open AccessArticle
A Unified Benchmark of Machine Learning and Deep Neural Networks for Tennis Match Prediction
by
Khem Poudel, Lilly-Sophie Schmidt, Clifford N. Jones, Saroj Baral, Thuan Nhan, Satish Wagle and Jorge Vargas
Analytics 2026, 5(3), 22; https://doi.org/10.3390/analytics5030022 - 3 Jul 2026
Abstract
►▼
Show Figures
Tennis match prediction has been studied extensively, yet the literature offers no controlled comparison of Elo ratings, classical machine learning, and deep neural networks under identical experimental conditions, leaving practitioners without clear guidance on model selection. We address this gap with a unified
[...] Read more.
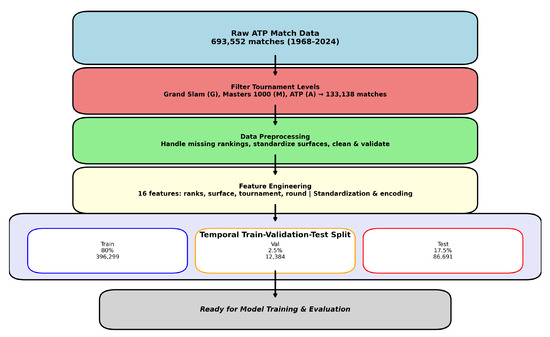
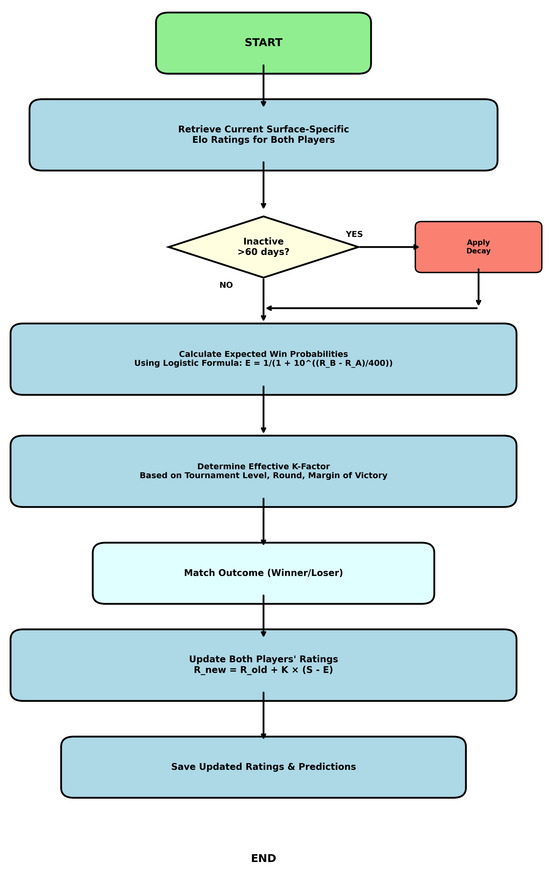
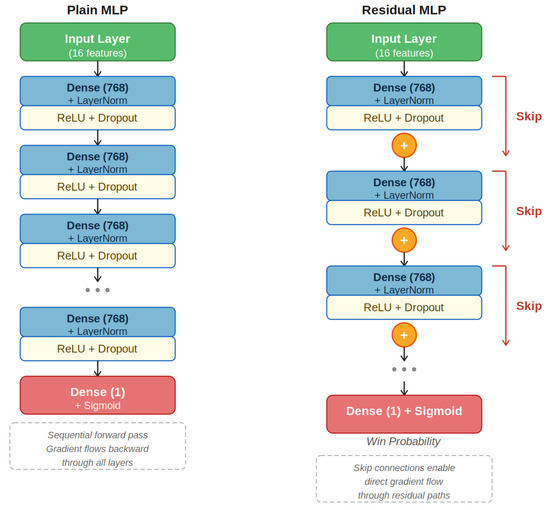
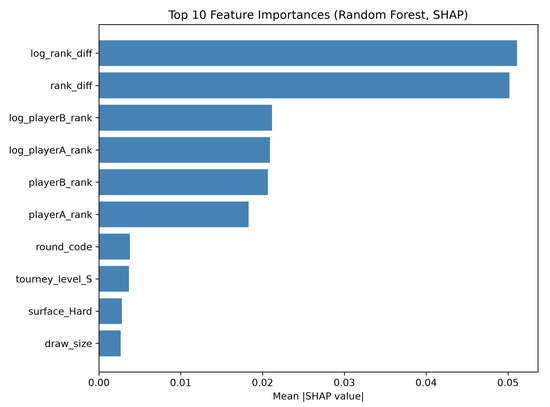
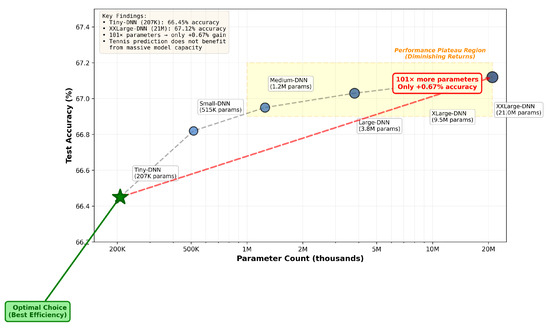
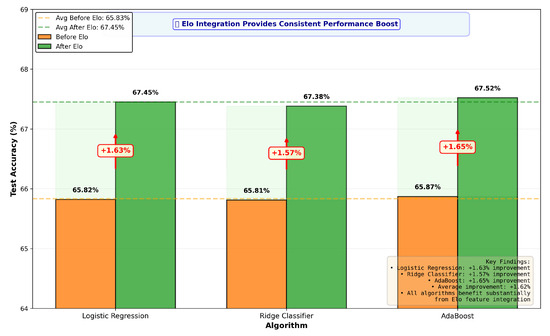
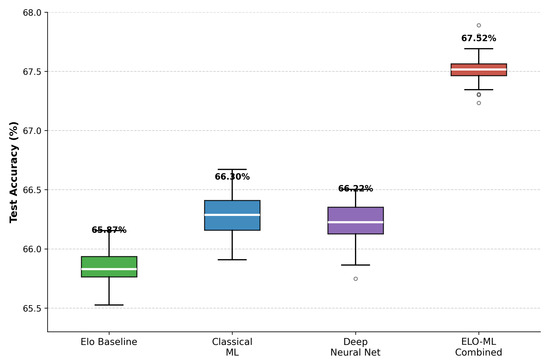
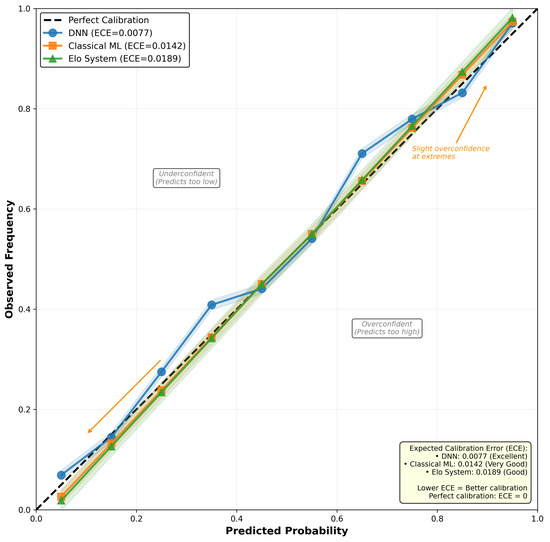
Tennis match prediction has been studied extensively, yet the literature offers no controlled comparison of Elo ratings, classical machine learning, and deep neural networks under identical experimental conditions, leaving practitioners without clear guidance on model selection. We address this gap with a unified empirical study on 133,138 professional men’s tennis matches from the Association of Tennis Professionals tour (1968–2024). Four approaches are evaluated on the same temporally split data with a common 16-feature set and an aligned evaluation protocol: an enhanced Elo rating system, ten classical machine learning algorithms, seventeen deep neural network configurations spanning 207,000 to 21,000,000 parameters, and a hybrid Elo–machine learning (ELO-ML) approach that augments classical learners with three Elo-derived features. A tuned Elo baseline alone reaches 65.87% accuracy, the best of ten classical machine learning algorithms reaches 66.30%, seventeen deep neural network configurations cluster at 66.15–66.22%, and the hybrid ELO-ML approach reaches 67.52% (McNemar’s test, for all ELO-ML pairwise comparisons). All four approaches sit within a 1.65 pp band whose upper edge lies below the 70–72% accuracy commonly cited for bookmaker odds, indicating that pre-match prediction under universally available features is a difficult task in which Elo alone already captures most of the predictable signal and algorithmic sophistication adds only marginal headroom. Deep neural networks deliver substantially better probability calibration than the other approaches (Expected Calibration Error 0.0077 vs. 0.0142). Model capacity exhibits sharply diminishing returns: all seventeen network configurations, spanning a 100-fold range in parameter count (207,000 to 21,000,000), fall within a 0.07 pp accuracy band. The study establishes a controlled benchmark for tour-level tennis prediction, quantifies how narrow the headroom above Elo actually is, provides modest but consistent empirical support for the statistically enhanced learning framework, and supplies deployment-ready operating points for sports analytics practitioners.
Full article

Figure 1
Open AccessArticle
The Information Entropy Performance Indicator (IEPI): A Deterministic BPMN Analytics Artifact for Routing-Uncertainty Diagnostics and Viability Assessment
by
Apostolos Mouzakitis
Analytics 2026, 5(3), 21; https://doi.org/10.3390/analytics5030021 - 1 Jul 2026
Abstract
►▼
Show Figures
Business Process Management (BPM) process models represent routing behaviour through control-flow constructs, yet BPMN 2.0 does not provide a native mechanism for quantifying uncertainty associated with routing decisions. This study presents the Information Entropy Performance Indicator (IEPI) as a deterministic BPMN analytics artifact
[...] Read more.
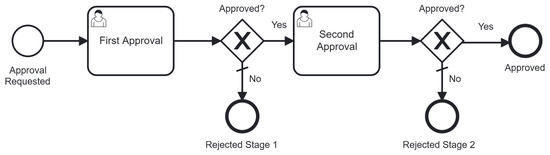
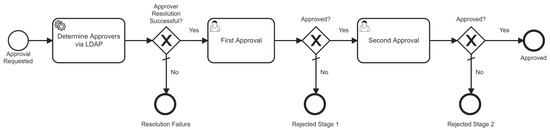
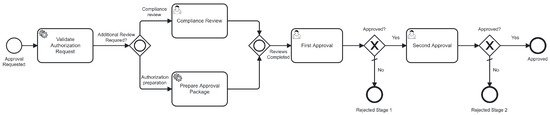
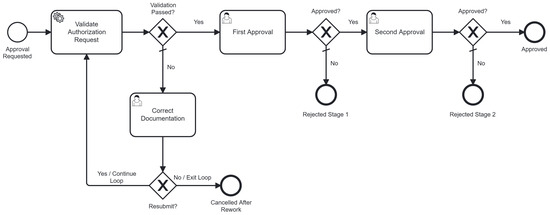
Business Process Management (BPM) process models represent routing behaviour through control-flow constructs, yet BPMN 2.0 does not provide a native mechanism for quantifying uncertainty associated with routing decisions. This study presents the Information Entropy Performance Indicator (IEPI) as a deterministic BPMN analytics artifact for evaluating routing uncertainty under externally specified routing probabilities. The IEPI framework integrates construct-level routing diagnostics, viability assessment, diagnostic flagging, compositional uncertainty propagation, and process-level reporting within a unified analytical workflow. The IEPI engine accepts as input a BPMN 2.0 process representation, a routing-probability map, and analyst-specified viability thresholds. It computes (i) construct-level diagnostics based on normalized entropy and responsiveness, (ii) block-level uncertainty and responsiveness quantities using fixed composition rules for XOR, OR, and LOOP routing constructs, and (iii) a bounded process-level viability-band reporting index. The framework is evaluated using four analytically constructed BPMN authorisation workflows designed to exercise the complete routing-construct taxonomy supported by the artifact. Results demonstrate that construct-level classifications, propagated uncertainty quantities, and process-level IEPI values are well defined and reproducible under fixed inputs. Threshold sensitivity analysis shows that local viability classifications and aggregate reporting outputs vary deterministically with threshold settings and remain consistent with the underlying routing diagnostics. The findings highlight the distinction between uncertainty propagation and viability-band compliance. While propagated uncertainty quantities characterize the accumulation of routing uncertainty within a process structure, the IEPI score provides a reporting-oriented assessment of aggregate compliance with analyst-defined viability criteria. The proposed artifact offers a reproducible and extensible analytical framework for routing-uncertainty evaluation in BPMN-based process models.
Full article

Figure 1
Open AccessArticle
Modeling Community Resilience Under Prolonged Disruption: An Agent-Based Framework Integrating Social Connectivity, Migration, and Policy-Driven Allocation
by
Joshua Hatfield, Sudipta Chowdhury and Ammar Alzarrad
Analytics 2026, 5(3), 20; https://doi.org/10.3390/analytics5030020 - 29 Jun 2026
Abstract
►▼
Show Figures
Communities under prolonged disruptions operate as interconnected socio-technical systems in which the effectiveness of any response depends not only on local conditions but also on the structural relationships that link communities to one another. This study introduces an agent-based response framework for evaluating
[...] Read more.
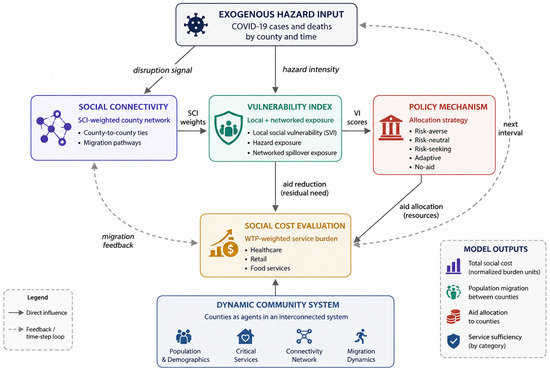
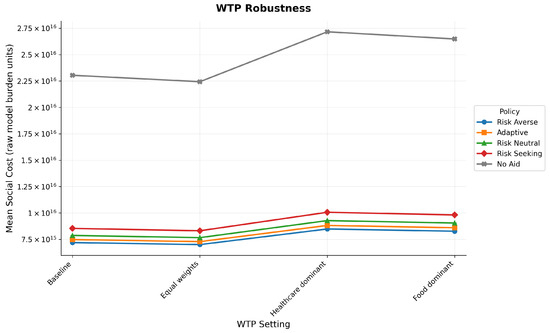
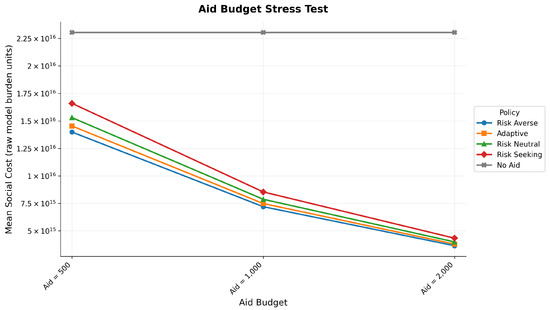
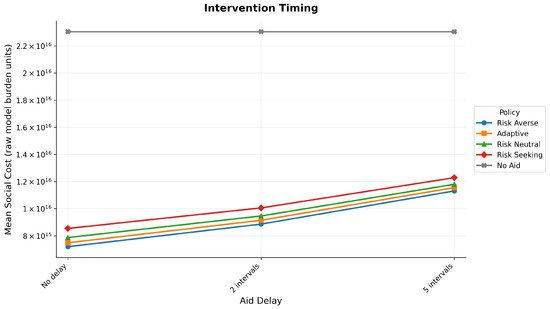
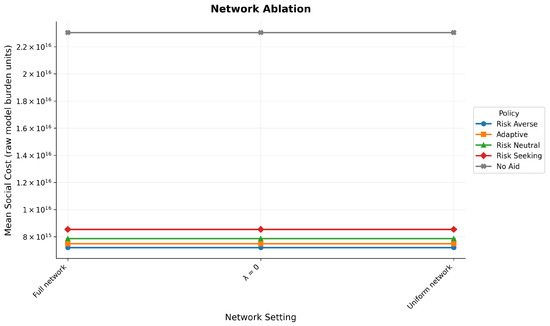
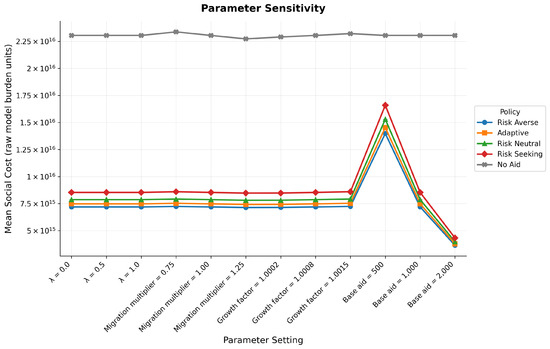
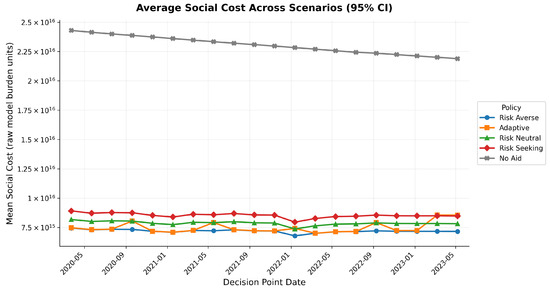
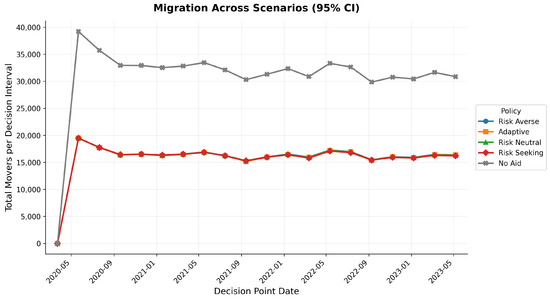
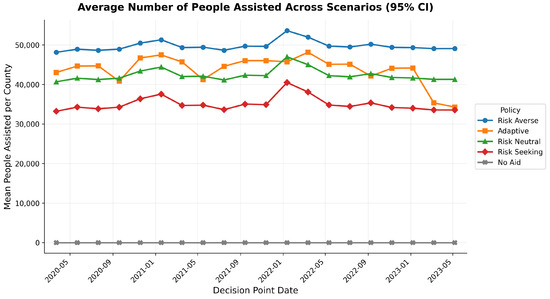
Communities under prolonged disruptions operate as interconnected socio-technical systems in which the effectiveness of any response depends not only on local conditions but also on the structural relationships that link communities to one another. This study introduces an agent-based response framework for evaluating policy-driven intervention strategies across such systems. Each community is described by its population, economic conditions, and access to critical services, and is linked to other communities through a social connectivity network that defines the pathways for population movement and channels the spread of disruption stress between regions. The agent-based model then tracks how vulnerable each community is by combining its local conditions with the conditions of the communities it is most connected to, and it measures the toll of any disruption through a single social cost metric that weighs lost access to healthcare, retail, and food services. The framework is instantiated using county-level COVID-19 data for Illinois, treated as an exogenous hazard input, and evaluated through Monte Carlo simulation across risk-averse, risk-neutral, risk-seeking, adaptive, and no-aid policy regimes. Compared with the no-aid baseline, the highest-intensity (risk-averse) regime produced the lowest social cost and the highest level of assistance, while all intervention regimes resulted in lower migration. Adaptive managerial decision-making was shown to offer no consistent advantage over simple proactive rules, suggesting that consistency and speed of allocation, rather than sophistication, drive system-wide outcomes.
Full article

Figure 1
Open AccessArticle
Configuration-Aware Bayesian Shelf Inference for Mobile RFID Library Inventory
by
Sherzod Mukhammadjonov, Marat Rakhmatullayev and Husniya Boysunova
Analytics 2026, 5(2), 19; https://doi.org/10.3390/analytics5020019 - 17 Jun 2026
Abstract
►▼
Show Figures
Mobile RFID inventory in libraries must be planned and evaluated under noisy observations, configuration-dependent read regimes, and incomplete supervision. This paper presents an uncertainty-aware analytics framework for robot-assisted RFID inventory using the public RFID Location dataset. The framework has three phases. Phase 1
[...] Read more.
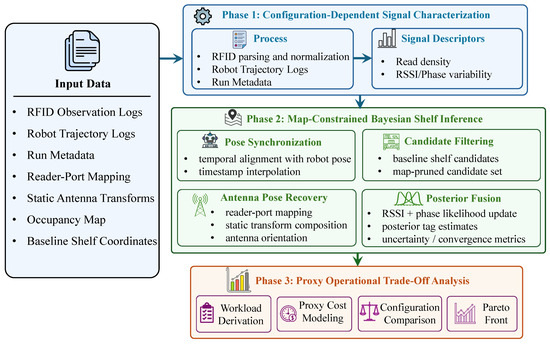
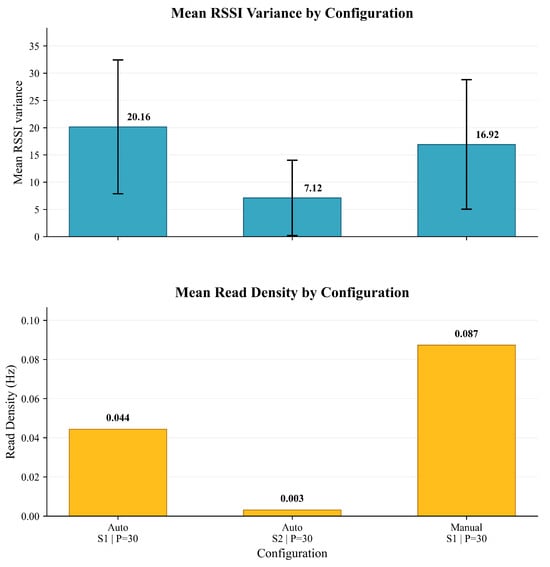
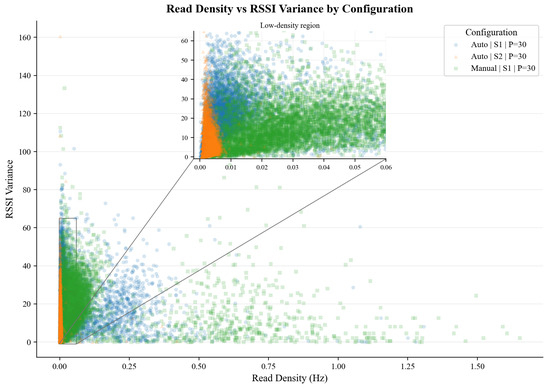
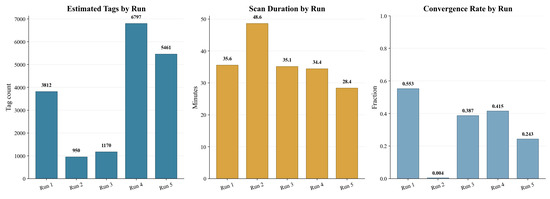
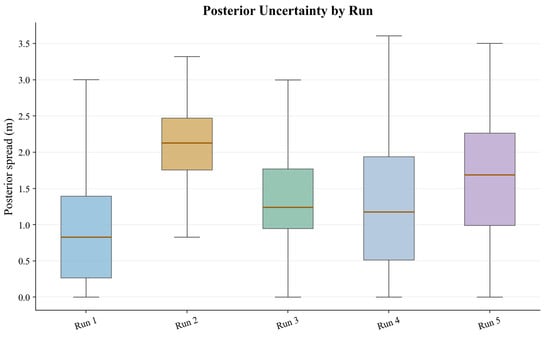
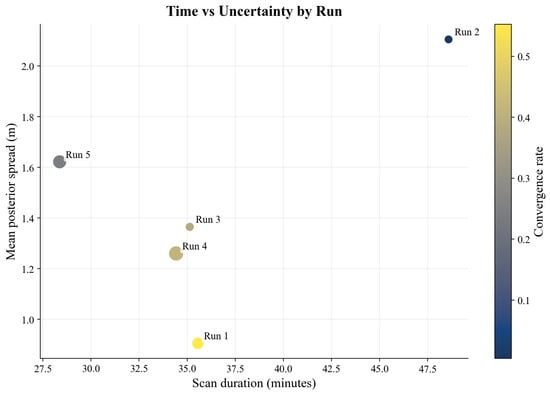
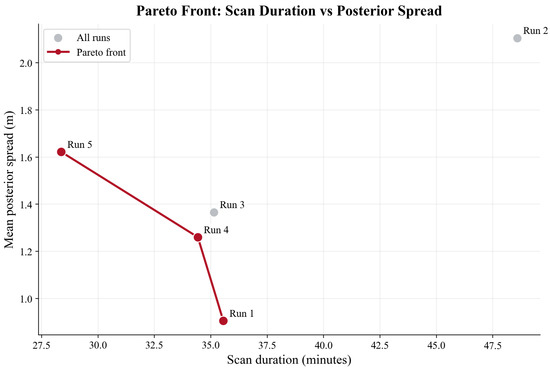
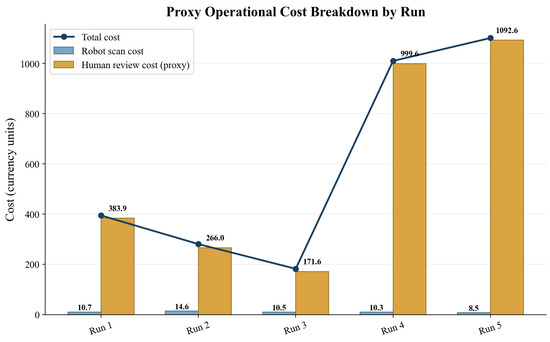
Mobile RFID inventory in libraries must be planned and evaluated under noisy observations, configuration-dependent read regimes, and incomplete supervision. This paper presents an uncertainty-aware analytics framework for robot-assisted RFID inventory using the public RFID Location dataset. The framework has three phases. Phase 1 converts irregular list-encoded logs into atomic RFID events and quantifies how operating configuration changes read density and signal variability. Phase 2 performs map-constrained Bayesian shelf inference by synchronizing RFID reads with robot trajectory and antenna geometry and by fusing RSSI and carrier phase over feasible shelf candidates. Phase 3 translates posterior spread and non-convergence into proxy review workload and cost, enabling configuration comparison and certainty–throughput trade-off analysis when strict EPC-to-item linkage is unavailable. Across 688,073 aligned RFID observations, the pipeline produces 18,190 posterior tag estimates from five inventory runs. The empirical results show strong run dependence: the best run achieves a mean posterior spread of 0.906 m with a convergence rate of 0.553, whereas a degraded run reaches only 0.004 convergence with a mean spread above 2.1 m. Because EPC-to-item linkage is unavailable, these values are posterior concentration and workload indicators rather than ground-truthed localization-accuracy metrics. A saved phase-weight ablation further shows that adding phase information substantially sharpens posterior concentration relative to an RSSI-only baseline. Under the proxy workload model, autonomous-S1-P30 provides the most favorable balance among posterior certainty, scan effort, and implied review burden.
Full article

Figure 1
Open AccessArticle
The Knowledge-Coherence Framework for Narrative Extraction: An Empirical Study on Scientific Literature
by
Brian Keith-Norambuena and Carolina Flores-Bustos
Analytics 2026, 5(2), 18; https://doi.org/10.3390/analytics5020018 - 4 May 2026
Abstract
►▼
Show Figures
Narrative extraction builds coherent ordered sequences of documents that trace how concepts develop over time, and is a growing area of information retrieval. In this work we focus on scientific literature, using a corpus of 3549 IEEE visualization research papers (1990–2022). A natural
[...] Read more.
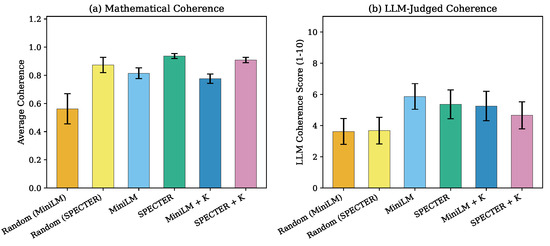
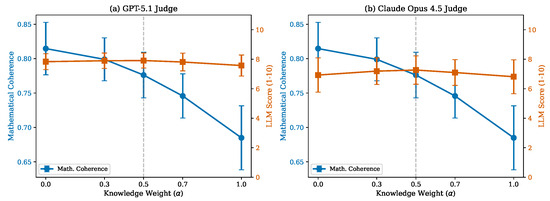
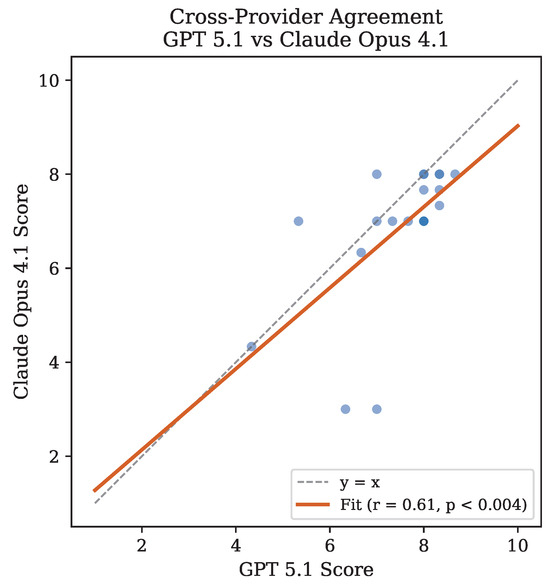
Narrative extraction builds coherent ordered sequences of documents that trace how concepts develop over time, and is a growing area of information retrieval. In this work we focus on scientific literature, using a corpus of 3549 IEEE visualization research papers (1990–2022). A natural hypothesis is that augmenting embedding-based pathfinding with explicit domain knowledge should improve narrative quality. We present the Knowledge-Coherence Framework (KCF), which integrates structured metadata from OpenAlex into narrative extraction (building on the Narrative Trails algorithm), and conduct a systematic empirical investigation along three axes: (1) the effect of embedding model choice (MiniLM vs. SPECTER), (2) the effect of knowledge augmentation (with and without, plus sensitivity to the knowledge weight ), and (3) the reliability of LLM-based evaluation (cross-agreement among 13 large language models). Throughout, mathematical coherence denotes the geometric mean of angular and topic similarity between consecutive documents along a path—an automatic, model-computed quantity inherited from Narrative Maps and Narrative Trails—while narrative quality refers to the LLM-judged construct. Using up to 600 evaluation pairs, we find that embedding model choice has a large effect on mathematical coherence (SPECTER: 0.94 vs. MiniLM: 0.81) and that, contrary to expectations, knowledge augmentation does not improve LLM-judged narrative quality—it slightly decreases it for both embeddings. Notably, the two notions dissociate: SPECTER produces the most mathematically coherent paths, yet MiniLM paths receive the highest LLM narrative-quality scores (5.87 vs. 5.36 out of 10). Alpha sensitivity analysis over five values ( , 500 pairs) confirms that LLM scores remain essentially flat while mathematical coherence steadily declines with increasing knowledge weight. Cross-model evaluation with 13 LLM judges shows high inter-model agreement (median Pearson ), supporting evaluation reliability. The main practical takeaways are that (i) embedding model choice, not knowledge augmentation, is the more consequential design decision, and (ii) mathematical coherence and LLM-judged narrative quality are distinct optimization targets that practitioners should not conflate.
Full article

Figure 1
Open AccessArticle
Analytics and Business Survival—Critical Success Factors and the Demise of HP Bulmer Ltd.
by
Martin Wynn and Catherine Reed
Analytics 2026, 5(2), 17; https://doi.org/10.3390/analytics5020017 - 27 Apr 2026
Abstract
►▼
Show Figures
This article examines the requirements for the successful deployment of business analytics in industry and uses this as a framework to provide a business intelligence perspective on the demise of a case study company, drinks manufacturer HP Bulmer Ltd., resulting in the collapse
[...] Read more.
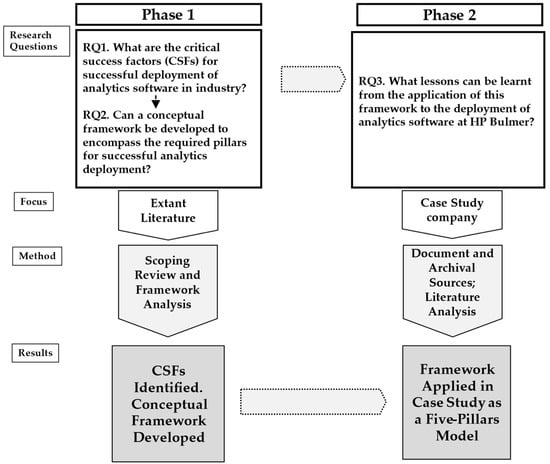
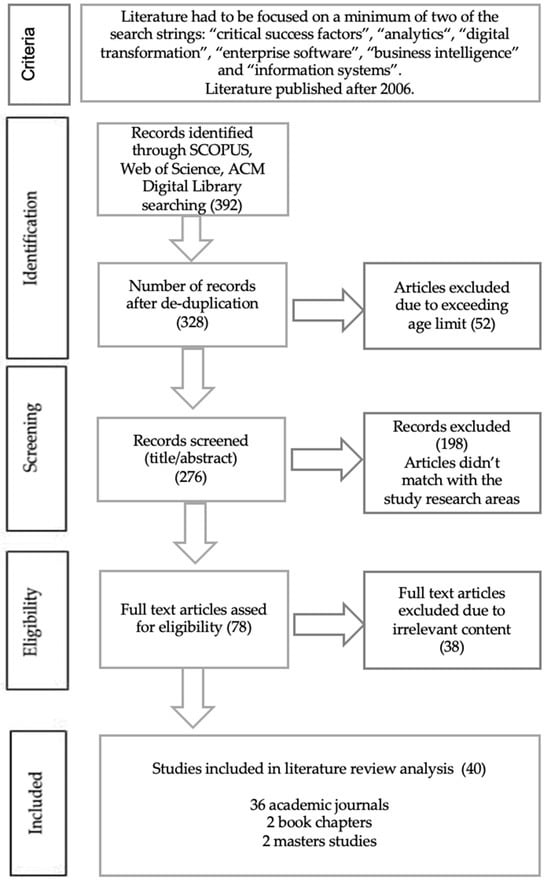
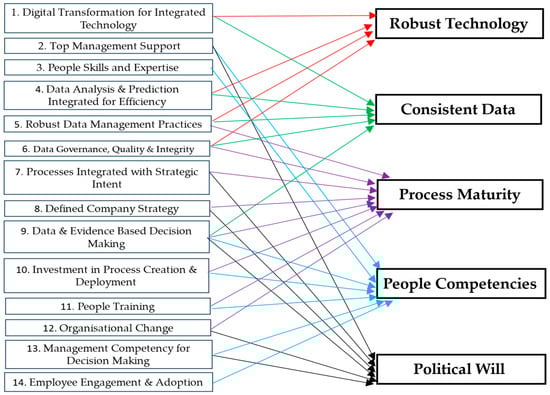
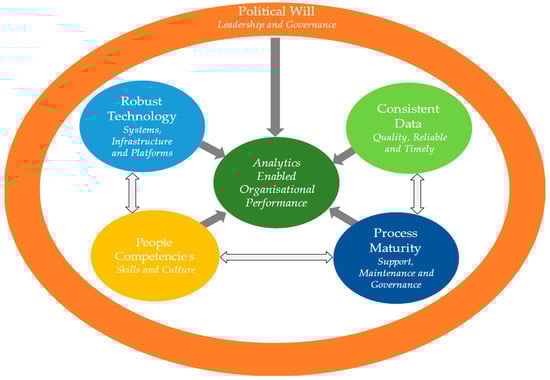
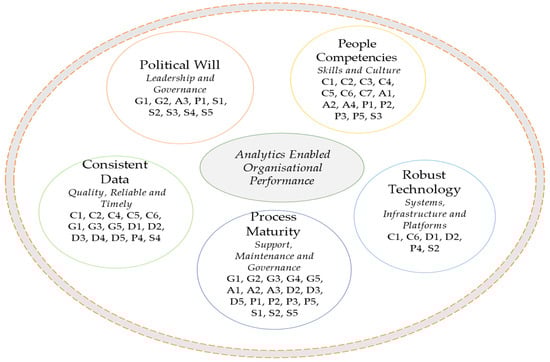
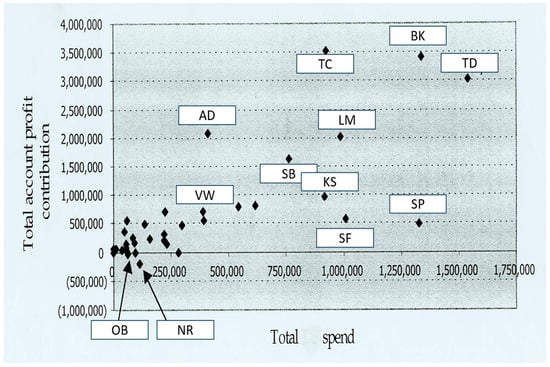
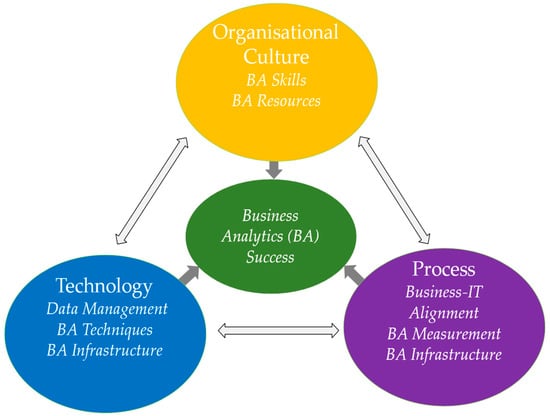
This article examines the requirements for the successful deployment of business analytics in industry and uses this as a framework to provide a business intelligence perspective on the demise of a case study company, drinks manufacturer HP Bulmer Ltd., resulting in the collapse and takeover of the company in 2003. Based on a scoping literature review and a qualitative interpretivist approach, the article investigates the critical success factors for business analytics software projects and classifies these into five main organisational pillars that are required for successful analytics deployment. Then, using documents available in the public domain, the article examines the case study of HP Bulmer Ltd., which used analytics software in the 1990s and early 2000s as the company attempted to establish itself as a global drinks manufacturer. The article reports on how the company struggled to put the necessary pillars in place for successful use of their analytics systems, but having finally achieved this, then failed to take the necessary decisions to steer the company towards profitability as opposed to rapid growth in turnover. The article uses the case study to reflect on the key aspects of analytics technology deployment and the wider field of digitalisation and digital transformation, and points to the critical importance of political will to formulate and steer data-informed strategy. The research contributes to the development of theory regarding analytics deployment and will be of value to practitioners faced with the challenges of implementing analytics systems in industry.
Full article

Figure 1
Open AccessArticle
Impacting Brand Awareness and Emotions in Retail Consumer Decision-Making Within a Digital Context
by
Hiba Jbara, Sam El Nemar, Wael Bakhit, Demetris Vrontis and Alkis Thrassou
Analytics 2026, 5(2), 16; https://doi.org/10.3390/analytics5020016 - 30 Mar 2026
Cited by 2
Abstract
►▼
Show Figures
This study explores the intricate behavioral consumer psychology dynamics of how certain elements—color, price, gender differences, and the concept of the frequency illusion—affect emotions, brand awareness, and consumer decision-making in a digital environment. Going beyond conventional analyses, this study also explores the intersection
[...] Read more.
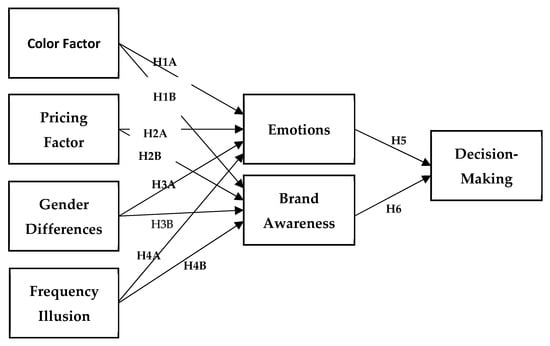
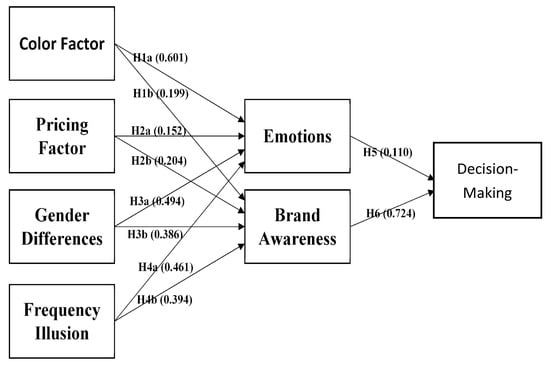
This study explores the intricate behavioral consumer psychology dynamics of how certain elements—color, price, gender differences, and the concept of the frequency illusion—affect emotions, brand awareness, and consumer decision-making in a digital environment. Going beyond conventional analyses, this study also explores the intersection of sustainable business practices, elucidating the potential for ethical, environmentally conscious, and business-sustainable decision-making. Utilizing a quantitative method and survey data from 207 respondents, this research contributes to a more profound level of understanding of consumer decision-making in the Lebanese retail sector, offering strategic insights for organizations seeking to enhance brand recognition, while aligning with responsible and sustainable practices in today’s dynamic and competitive environment. The study found that psychological cues—color, price, gender differences, and frequency illusion—significantly influence emotions, brand awareness, and consumer decision-making in retail. Future research should examine the tensions in consumer decision-making, where brand awareness and emotional cues can simultaneously facilitate and bias choices, with effects contingent on exposure, demographic characteristics, digital fluency, and cultural context.
Full article

Figure 1
Open AccessArticle
Visualizing the Machine Learning Process in Multichannel Time Series Classification
by
Edgar Acuña and Roxana Aparicio
Analytics 2026, 5(1), 15; https://doi.org/10.3390/analytics5010015 - 12 Mar 2026
Abstract
►▼
Show Figures
This paper uses visualization techniques to analyze the learning process of six machine learning classifiers for multichannel time series classification (MTSC), including five deep learning models—1D CNN, CNN-LSTM, ResNet, InceptionTime, and Transformer—and one non-deep learning method, ROCKET. Sixteen datasets from the University of
[...] Read more.
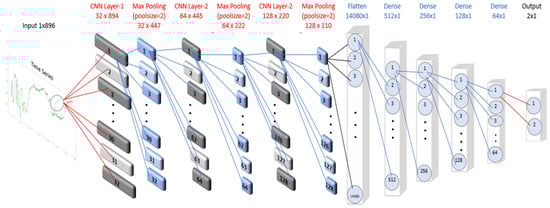
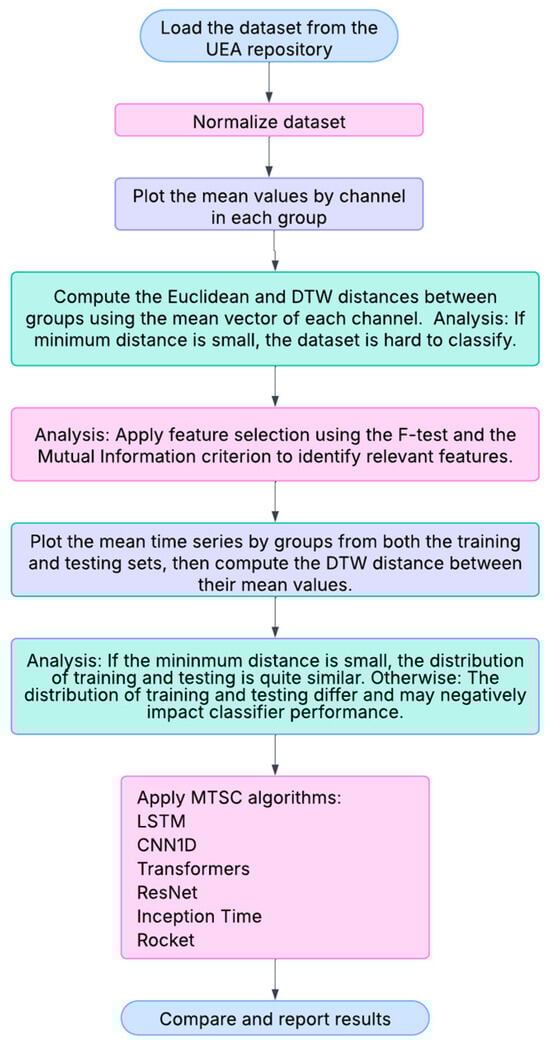
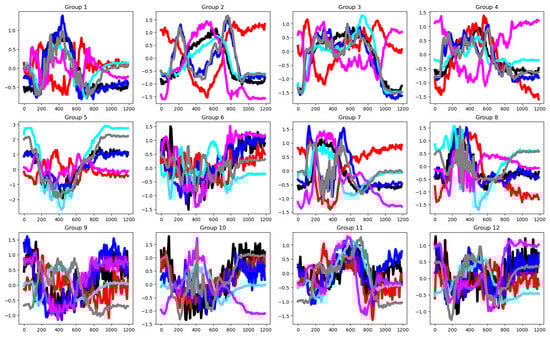
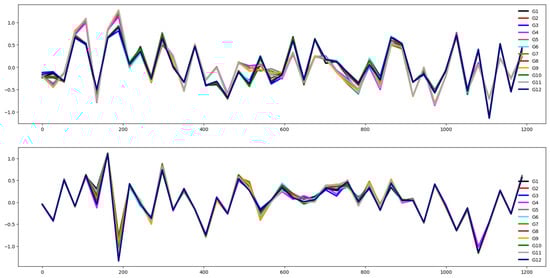
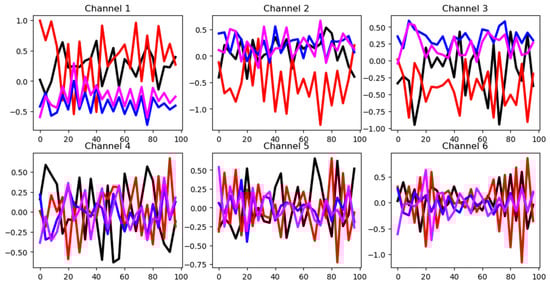
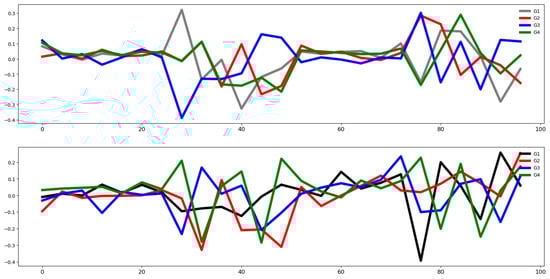
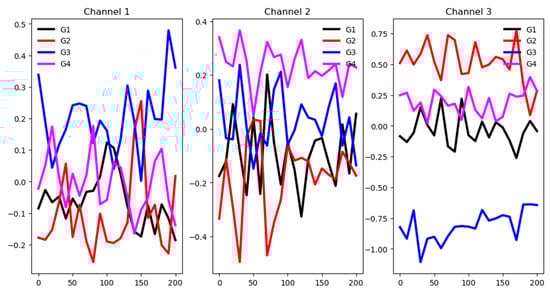
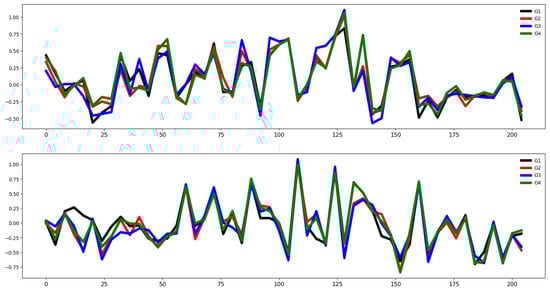
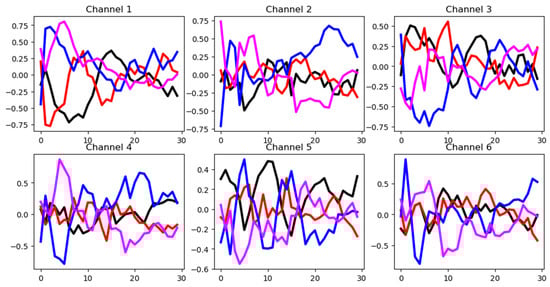
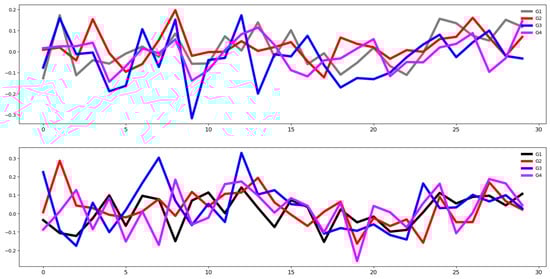
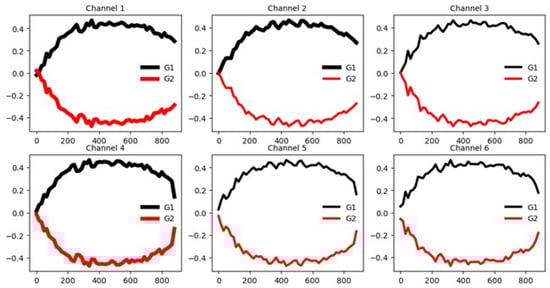
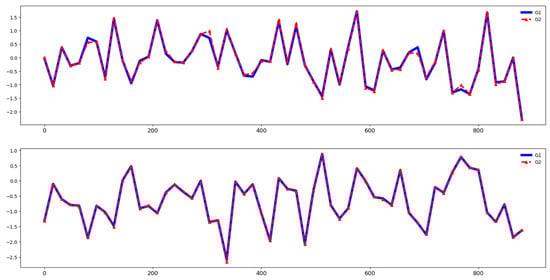
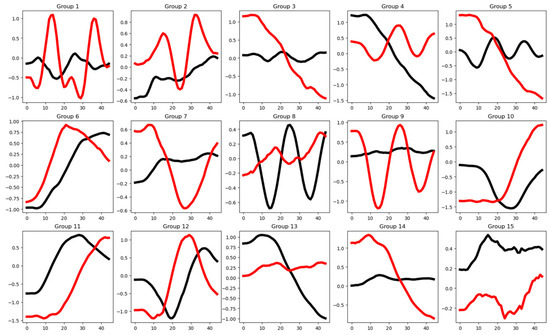
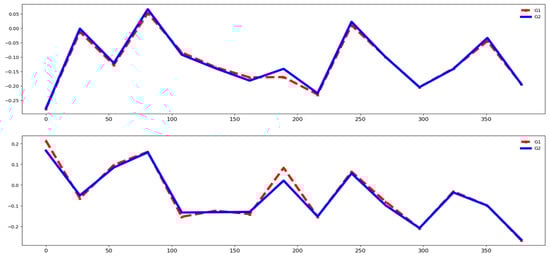
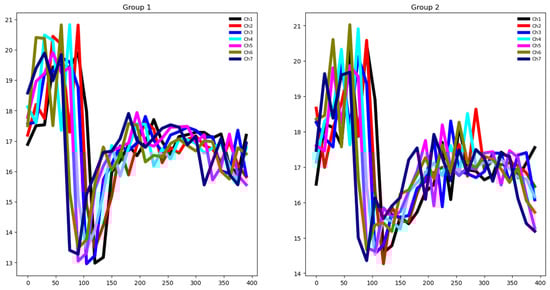
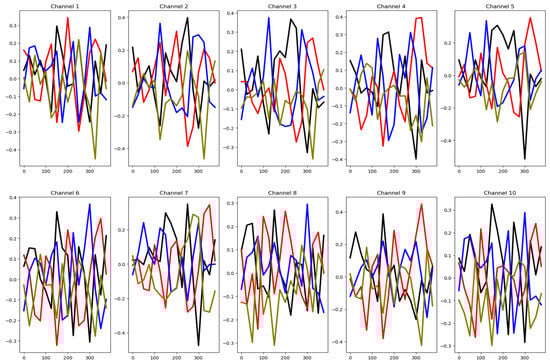
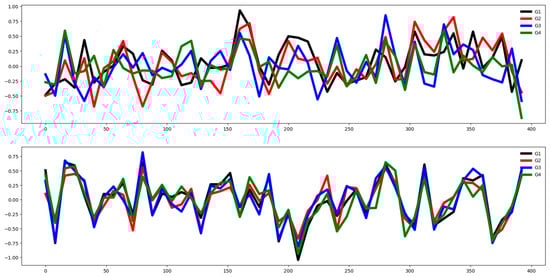
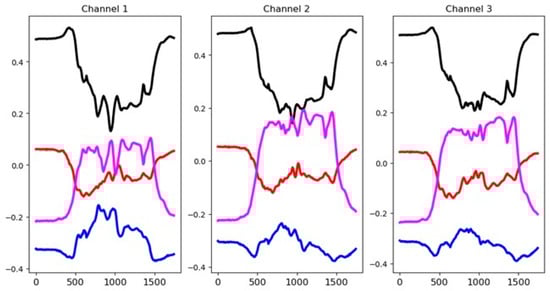
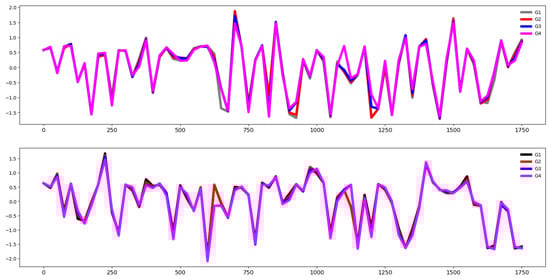
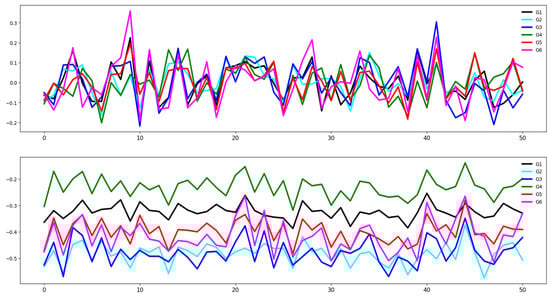
This paper uses visualization techniques to analyze the learning process of six machine learning classifiers for multichannel time series classification (MTSC), including five deep learning models—1D CNN, CNN-LSTM, ResNet, InceptionTime, and Transformer—and one non-deep learning method, ROCKET. Sixteen datasets from the University of East Anglia (UEA) multivariate time series repository were employed to assess and compare classifier performance. To explore how data characteristics influence accuracy, we applied channel selection, feature selection, and similarity analysis between training and testing sets. Visualization techniques were used to examine the temporal and structural patterns of each dataset, offering insight into how feature relevance, channel informativeness, and group separability affect model performance. The experimental results show that ROCKET achieves the most consistent accuracy across datasets, although its performance decreases with a very large number of channels. Conversely, the Transformer model underperforms in datasets with limited training instances per class. Overall, the findings highlight the importance of visual exploration in understanding MTSC behavior and indicate that channel relevance and data separability have a greater impact on classification accuracy than feature-level patterns.
Full article

Figure 1
Open AccessArticle
A Decade of Evolution: Evaluating Student Preferences for Degree Selection in the Spanish Public University System Through Directional Community Analysis (2014–2023)
by
José-Miguel Montañana, Antonio Hervás and Pedro-Pablo Soriano-Jiménez
Analytics 2026, 5(1), 14; https://doi.org/10.3390/analytics5010014 - 11 Mar 2026
Abstract
►▼
Show Figures
The Spanish Public University System (SUPE) assigns student placements through a multi-step application process governed by legal criteria. Analyzing how students move between different degree programs during this process is crucial for universities to optimize and plan their academic offerings. This paper analyzes
[...] Read more.
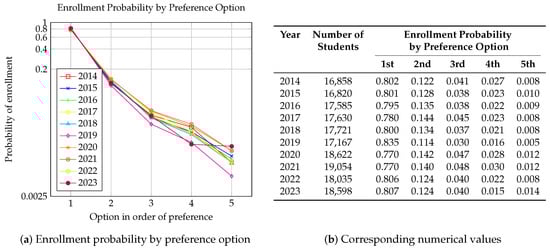
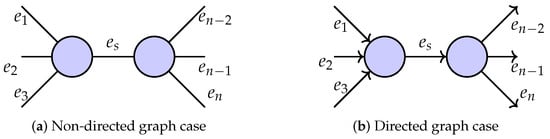
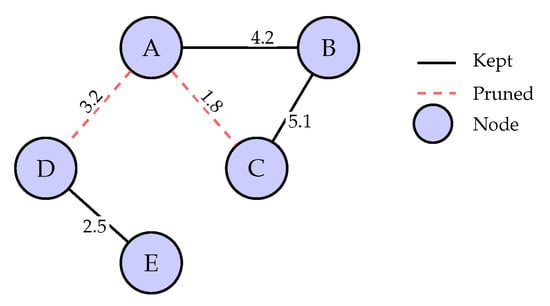
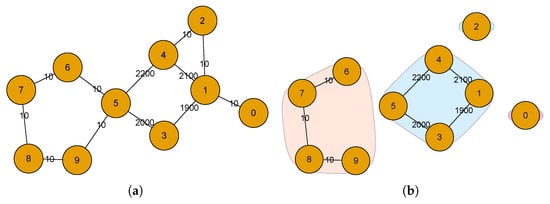
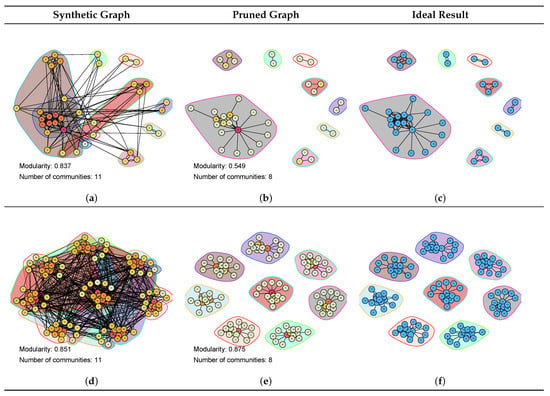
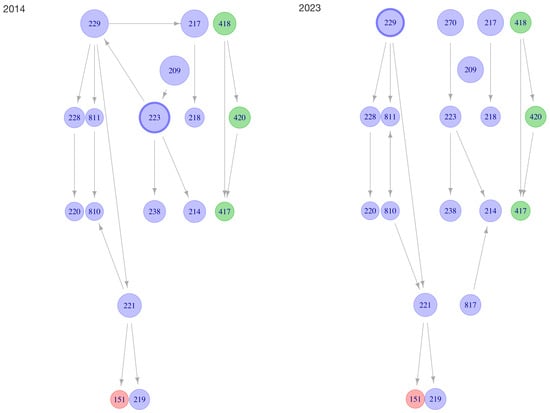
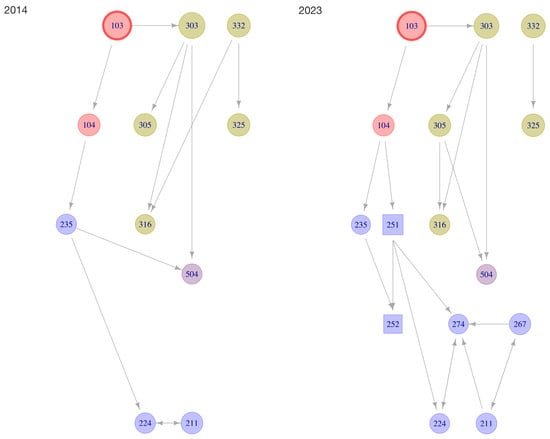
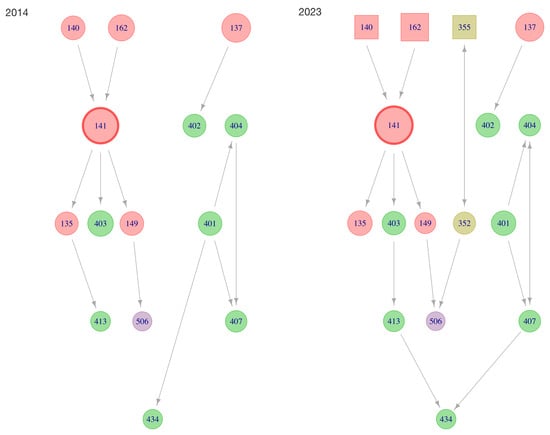
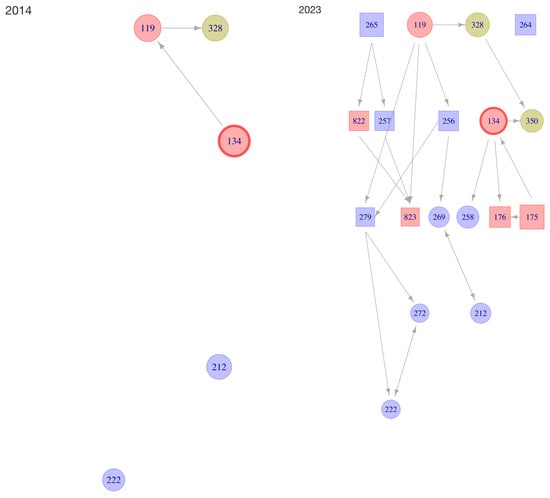
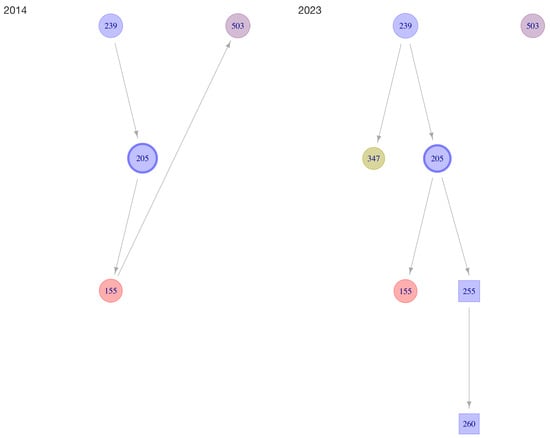
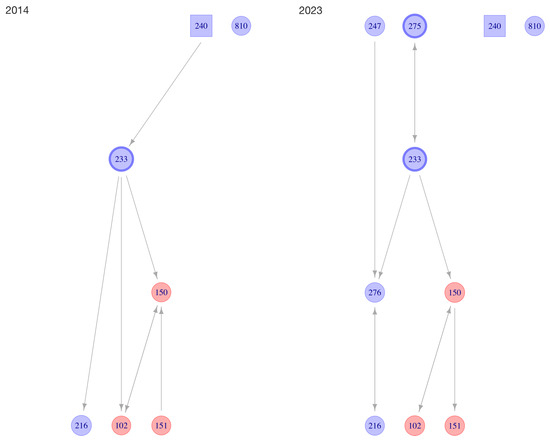
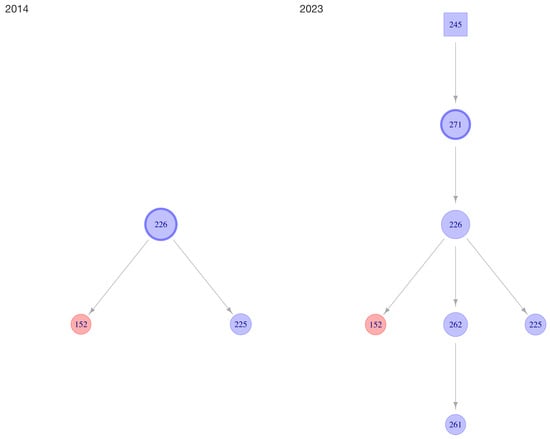
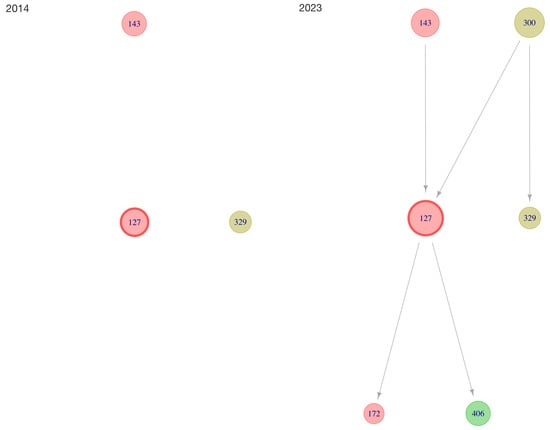
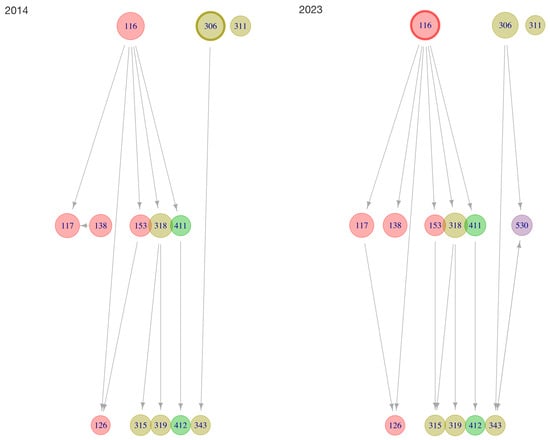
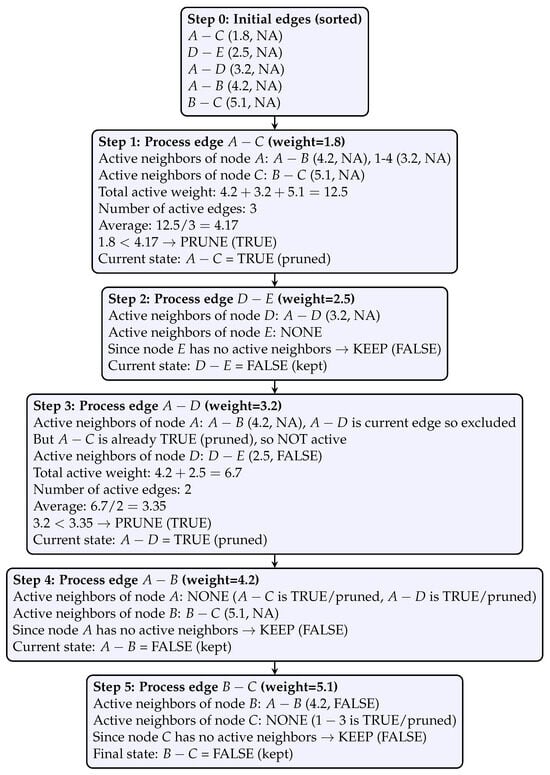
The Spanish Public University System (SUPE) assigns student placements through a multi-step application process governed by legal criteria. Analyzing how students move between different degree programs during this process is crucial for universities to optimize and plan their academic offerings. This paper analyzes a decade of student pre-registration data (2014–2023) to track evolving preferences and mobility between degrees. We model this process as a directed graph, mapping student traffic and studying the formation of directional communities within the degree network. A significant challenge is the weakly connected and poorly conditioned nature of these graphs, which impedes standard community detection algorithms. Extending prior work that relied on manually set thresholds for pruning edges, we propose a novel adaptive pruning algorithm that requires no manual intervention. Applying this method to annual data improves community detection performance and reveals gradual shifts in student preferences and demand, particularly in response to new degrees. These insights provide a valuable decision-making tool for higher education institutions, helping them refine their degree offerings in response to evolving trends.
Full article

Figure 1
Open AccessArticle
Distributed Orders Management in Make-to-Order Supply Chain Networks Using Game-Based Alternating Direction Method of Multipliers
by
Amirhosein Gholami, Nasim Nezamoddini and Mohammad T. Khasawneh
Analytics 2026, 5(1), 13; https://doi.org/10.3390/analytics5010013 - 9 Mar 2026
Abstract
►▼
Show Figures
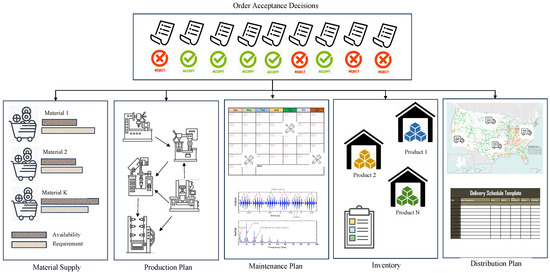
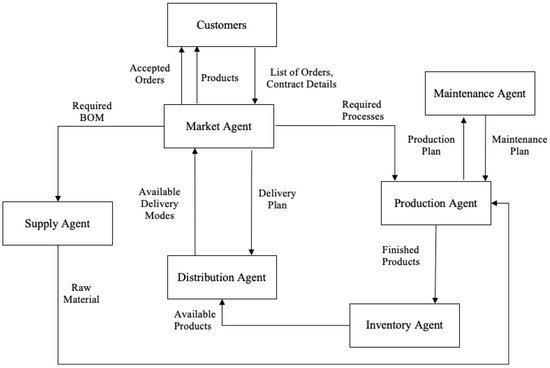
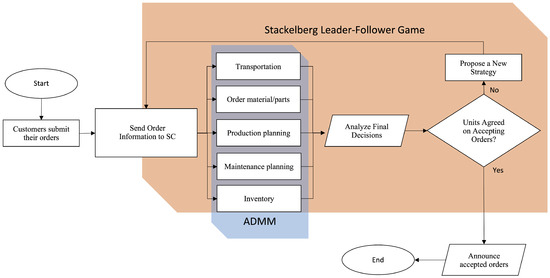
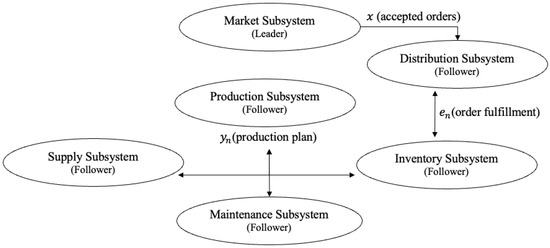
Operations scheduling of mass customized products is vital in the modern make-to-order (MTO) supply chains. In these systems, order acceptance decisions should be coordinated with available capacity in different sections of the supply chain while considering their potential correlations and interactions. One of
[...] Read more.
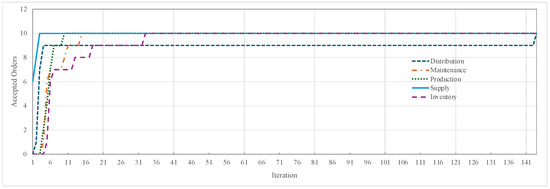
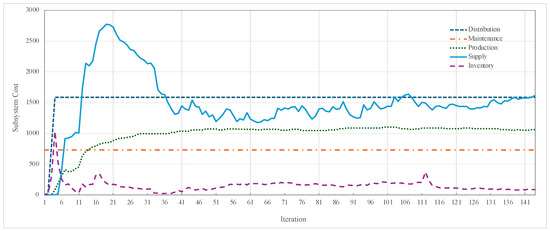
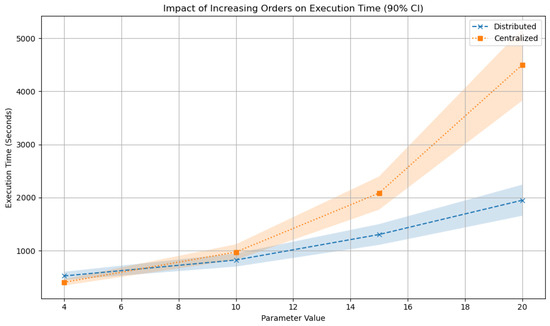
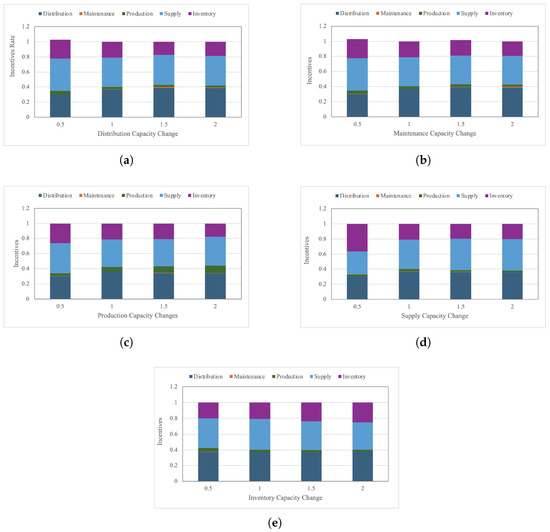
Operations scheduling of mass customized products is vital in the modern make-to-order (MTO) supply chains. In these systems, order acceptance decisions should be coordinated with available capacity in different sections of the supply chain while considering their potential correlations and interactions. One of the fundamental challenges in optimization of these systems is the computation time of solving models with multiple coupling constraints between supply chain units. This paper addresses this issue by proposing a game-based framework that decomposes the related mixed integer programming mathematical model and it is coordinated and solved using integrated game-based Alternating Direction Method of Multipliers (ADMM). The proposed Stackelberg Leader-Follower game optimizes order acceptance decisions while considering the requirements in supply, production planning, maintenance, inventory, and distribution units. To validate the efficiency of the proposed framework, the model is tested with a simulated four-layer supply chain. The results of experiments proved that decompositions of the model to smaller subsections and solving it in a distributed manner not only optimizes supply chain participating units but also coordinate their movements to achieve the global optimal solution. The proposed framework offers managers a practical decision layer that preserve local autonomy of the supply chain units and reduce their data sharing and computation burdens and concerns.
Full article

Figure 1
Open AccessArticle
Operationalising CTT and IRT in Spreadsheets: A Methodological Demonstration for Classroom Assessment
by
António Faria and Guilhermina Lobato Miranda
Analytics 2026, 5(1), 12; https://doi.org/10.3390/analytics5010012 - 24 Feb 2026
Abstract
►▼
Show Figures
The evaluation of student performance often relies on basic spreadsheet outputs that provide limited insight into item functioning. This study presents a methodological demonstration showing how widely available spreadsheet software can be transformed into a practical environment for psychometric analysis. Using a simulated
[...] Read more.
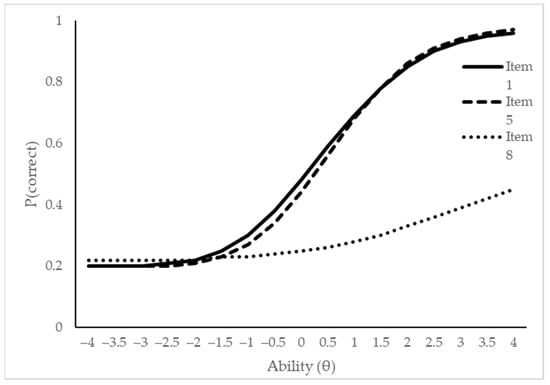
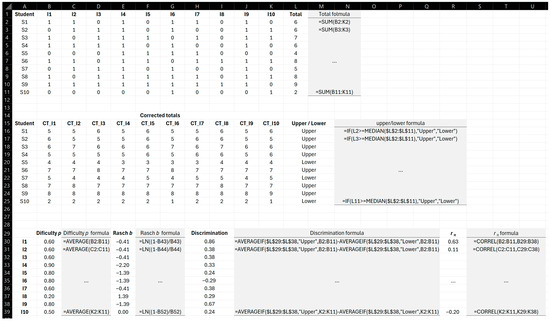
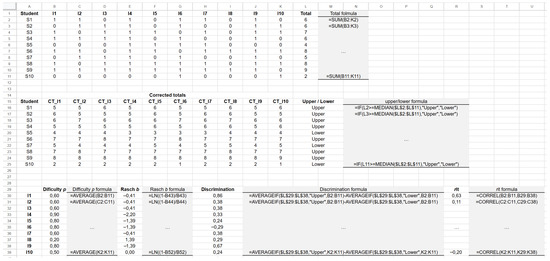
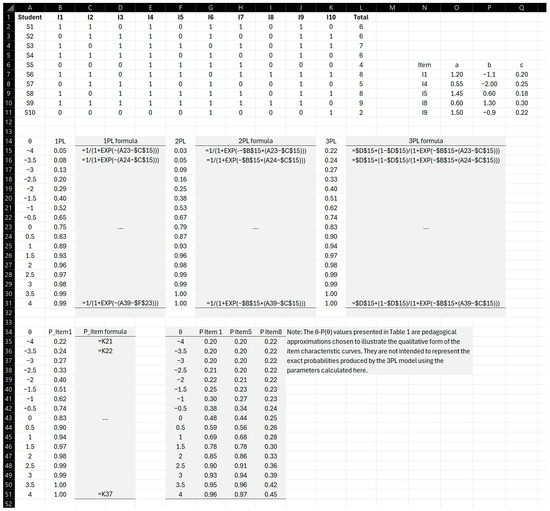
The evaluation of student performance often relies on basic spreadsheet outputs that provide limited insight into item functioning. This study presents a methodological demonstration showing how widely available spreadsheet software can be transformed into a practical environment for psychometric analysis. Using a simulated dataset of 40 students responding to 20 dichotomous items, spreadsheet formulas were developed to compute descriptive statistics and Classical Test Theory (CTT) indices, including item difficulty, discrimination, and corrected item–total correlations. The demonstration was extended to Item Response Theory (IRT) through the implementation of 1PL, 2PL, and 3PL logistic models using forward-calculated item parameters. A smaller dataset of 10 students and 10 items was used to illustrate the interpretability of the indices and the generation of Item Characteristic Curves (ICCs). Results show that spreadsheets can support teachers in in-terpreting test data beyond total scores, enabling the identification of weak items, refinement of distractors, and construction of small-scale item banks aligned with competence-based curricula. The approach contributes to Sustainable Development Goal 4 (SDG 4) by promoting accessible, equitable, and high-quality assessment practices. Limitations include the instability of IRT parameter estimation in small samples and the need for teacher training. Future research should apply the approach to real classroom data, explore automation within spreadsheet environments, and examine the integration of artificial intelligence for adaptive assessment.
Full article

Figure 1
Open AccessArticle
Integrating Deep Learning Nodes into an Augmented Decision Tree for Automated Medical Coding
by
Spoorthi Bhat, Veda Sahaja Bandi, Haiping Xu and Joshua Carberry
Analytics 2026, 5(1), 11; https://doi.org/10.3390/analytics5010011 - 12 Feb 2026
Abstract
►▼
Show Figures
Accurate assignment of International Classification of Diseases (ICD) codes is essential for healthcare analytics, billing, and clinical research. However, manual coding remains time-consuming and error-prone due to the scale and complexity of the ICD taxonomy. While hierarchical deep learning approaches have improved automated
[...] Read more.
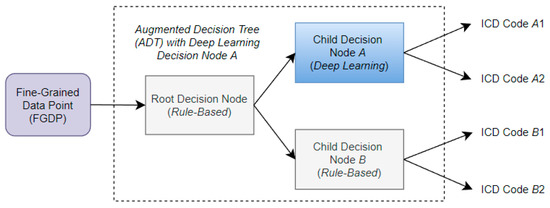
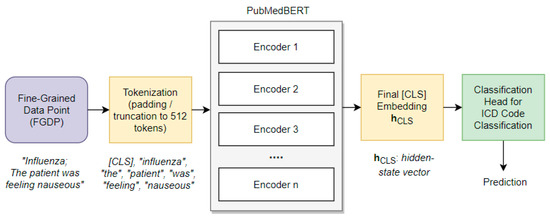
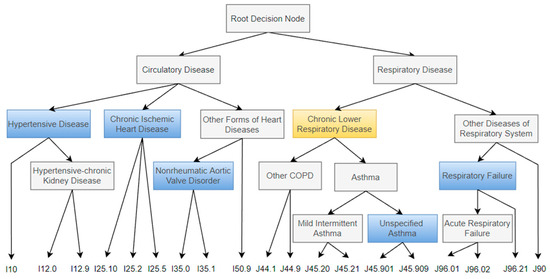
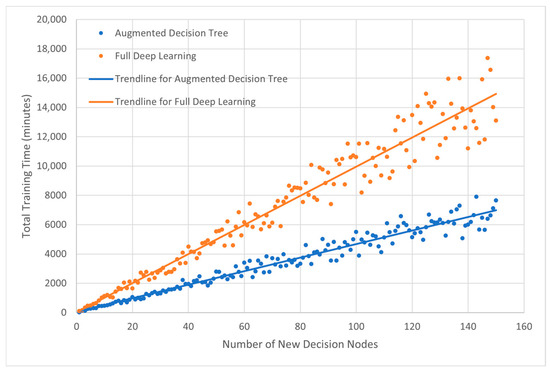
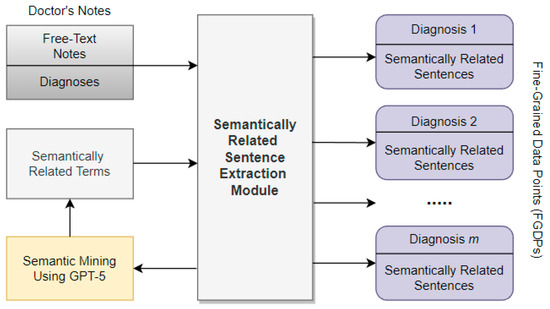
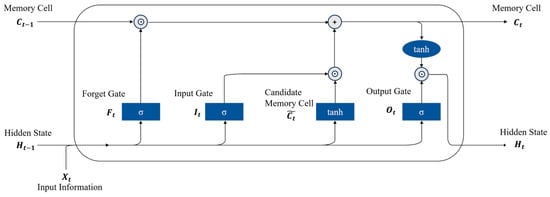
Accurate assignment of International Classification of Diseases (ICD) codes is essential for healthcare analytics, billing, and clinical research. However, manual coding remains time-consuming and error-prone due to the scale and complexity of the ICD taxonomy. While hierarchical deep learning approaches have improved automated coding, their deployment across large taxonomies raises scalability and efficiency concerns. To address these limitations, we introduce the Augmented Decision Tree (ADT) framework, which integrates deep learning with symbolic rule-based logic for automated medical coding. ADT employs an automated lexical screening mechanism to dynamically select the most appropriate modeling strategy for each decision node, thereby minimizing manual configuration. Nodes with high keyword distinctiveness are handled by symbolic rules, while semantically ambiguous nodes are assigned to deep contextual models fine-tuned from PubMedBERT. This selective design eliminates the need to train a deep learning model at every node, significantly reducing computational cost. A case study demonstrates that this hybrid and adaptive ADT approach supports scalable and efficient ICD coding. Experimental results show that ADT outperforms a pure decision tree baseline and achieves accuracy comparable to that of a full deep learning-based decision tree, while requiring substantially less training time and computational resources.
Full article

Figure 1
Open AccessArticle
Site Selection for Solar Photovoltaic Power Plant Using MCDM Method with New De-i-Fuzzification Technique
by
Kamal Hossain Gazi, Asesh Kumar Mukherjee, Shashi Bajaj Mukherjee, Sankar Prasad Mondal, Soheil Salahshour and Arijit Ghosh
Analytics 2026, 5(1), 10; https://doi.org/10.3390/analytics5010010 - 9 Feb 2026
Cited by 3
Abstract
Choosing sites for solar photovoltaic (PV) power plants in developing countries like India is a crucial task while considering multiple conflicting factors and sub-factors simultaneously. Multi-criteria decision-making (MCDM) is an optimisation method that provides a framework for handling such situations in an intuitionistic
[...] Read more.
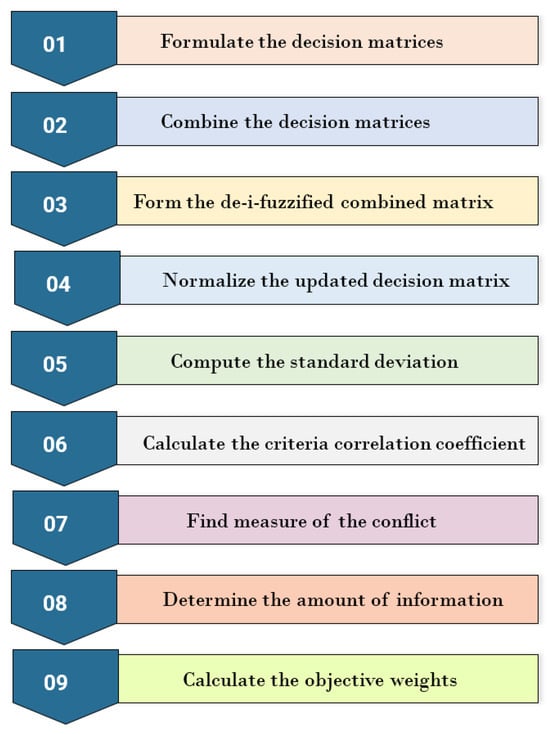
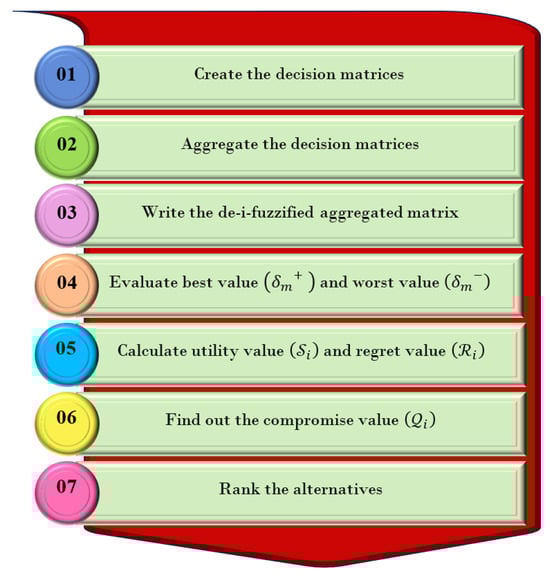
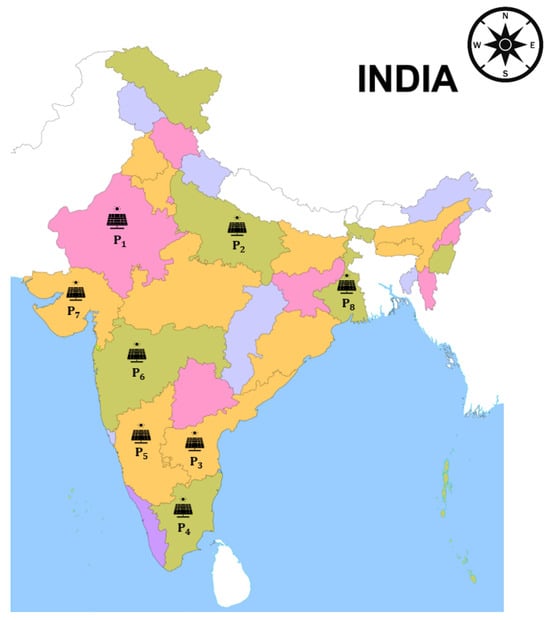
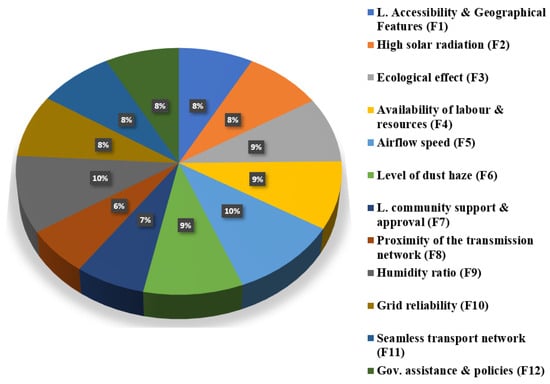
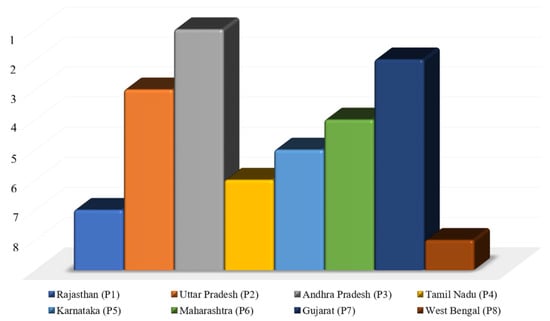
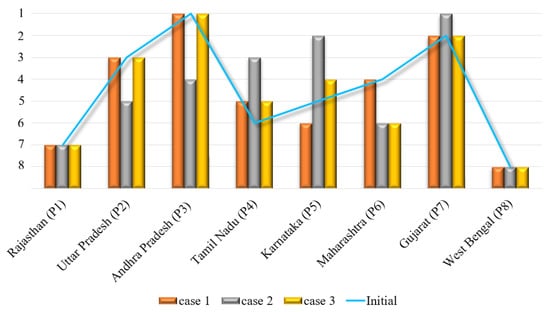
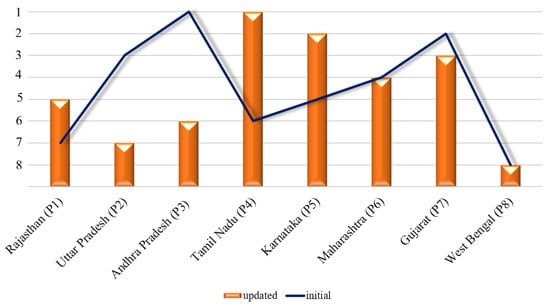
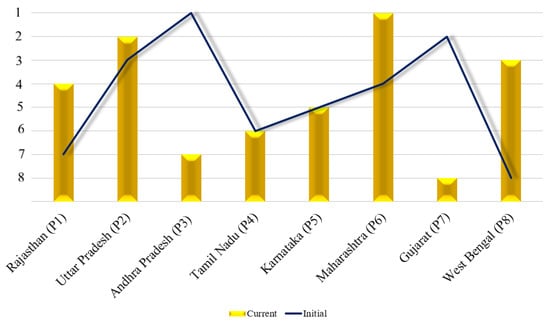
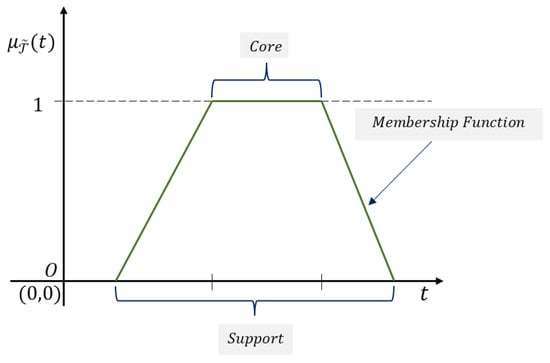
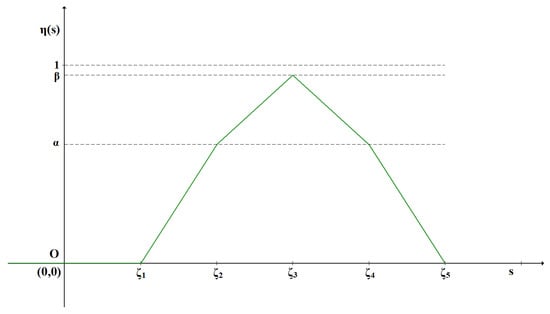
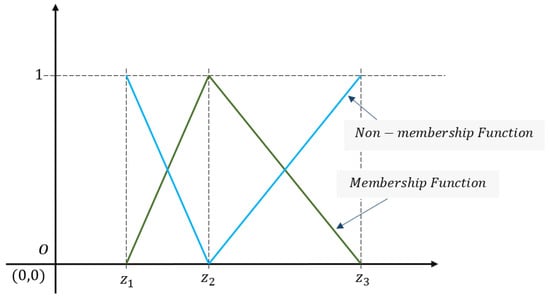
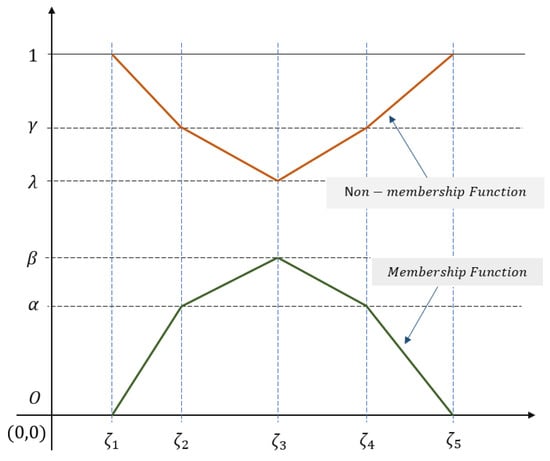
Choosing sites for solar photovoltaic (PV) power plants in developing countries like India is a crucial task while considering multiple conflicting factors and sub-factors simultaneously. Multi-criteria decision-making (MCDM) is an optimisation method that provides a framework for handling such situations in an intuitionistic fuzzy environment. The complexity and uncertainty associated with the site selection model are dealt with professionally. The Criteria Importance Through Intercriteria Correlation (CRITIC) method is applied to determine the relative importance of the criteria, identifying airflow speed as the most influential factor, followed by humidity ratio, level of dust haze, availability of labour and resources, and ecological effects. This shows that airflow speed plays an important role in the power plant’s efficiency and performance. The Vlse Kriterijumska Optimizacija I Kompromisno Rešenje (VIKOR) method is then used to prioritise the alternatives as potential locations for setting up a solar PV power plant in India. A new de-i-fuzzification method based on the relative difference between two real numbers is also proposed. Sensitivity analyses and comparative studies are conducted to assess the robustness and effectiveness of the framework. Overall, the results demonstrate that the proposed framework is useful and effective for optimising site selection for solar power plants in India.
Full article
(This article belongs to the Topic Data Intelligence and Computational Analytics)
►▼
Show Figures

Figure 1
Open AccessArticle
Denoising Stock Price Time Series with Singular Spectrum Analysis for Enhanced Deep Learning Forecasting
by
Carol Anne Hargreaves and Zixian Fan
Analytics 2026, 5(1), 9; https://doi.org/10.3390/analytics5010009 - 27 Jan 2026
Abstract
►▼
Show Figures
Aim: Stock price prediction remains a highly challenging task due to the complex and nonlinear nature of financial time series data. While deep learning (DL) has shown promise in capturing these nonlinear patterns, its effectiveness is often hindered by the low signal-to-noise ratio
[...] Read more.
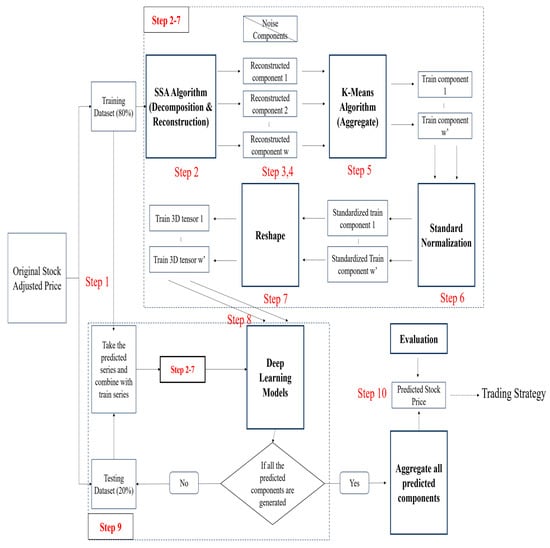
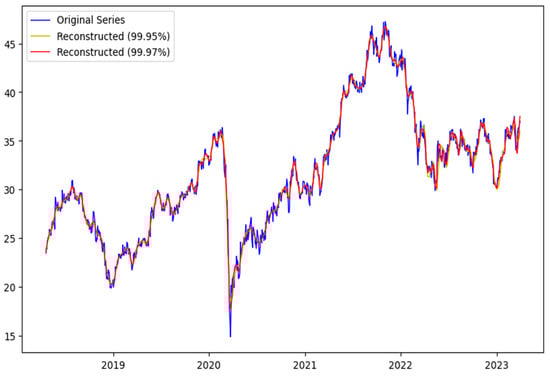
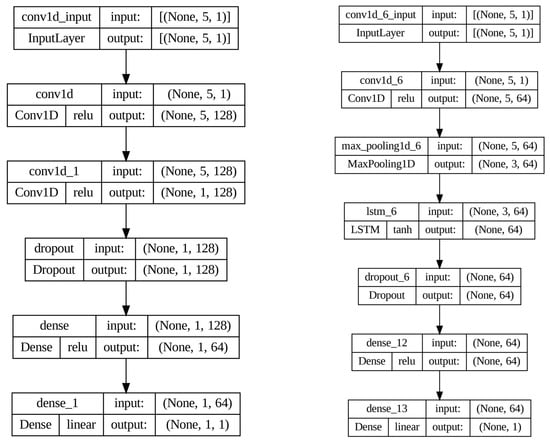
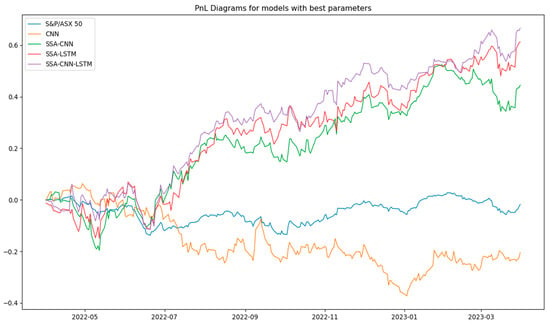
Aim: Stock price prediction remains a highly challenging task due to the complex and nonlinear nature of financial time series data. While deep learning (DL) has shown promise in capturing these nonlinear patterns, its effectiveness is often hindered by the low signal-to-noise ratio inherent in market data. This study aims to enhance the stock predictive performance and trading outcomes by integrating Singular Spectrum Analysis (SSA) with deep learning models for stock price forecasting and strategy development on the Australian Securities Exchange (ASX)50 index. Method: The proposed framework begins by applying SSA to decompose raw stock price time series into interpretable components, effectively isolating meaningful trends and eliminating noise. The denoised sequences are then used to train a suite of deep learning architectures, including Convolutional Neural Networks (CNN), Long Short-Term Memory (LSTM), and hybrid CNN-LSTM models. These models are evaluated based on their forecasting accuracy and the profitability of the trading strategies derived from their predictions. Results: Experimental results demonstrated that the SSA-DL framework significantly improved the prediction accuracy and trading performance compared to baseline DL models trained on raw data. The best-performing model, SSA-CNN-LSTM, achieved a Sharpe Ratio of 1.88 and a return on investment (ROI) of 67%, indicating robust risk-adjusted returns and effective exploitation of the underlying market conditions. Conclusions: The integration of Singular Spectrum Analysis with deep learning offers a powerful approach to stock price prediction in noisy financial environments. By denoising input data prior to model training, the SSA-DL framework enhanced signal clarity, improved forecast reliability, and enabled the construction of profitable trading strategies. These findings suggested a strong potential for SSA-based preprocessing in financial time series modeling.
Full article

Figure 1
Open AccessArticle
From Models to Metrics: A Governance Framework for Large Language Models in Enterprise AI and Analytics
by
Darshan Desai and Ashish Desai
Analytics 2026, 5(1), 8; https://doi.org/10.3390/analytics5010008 - 11 Jan 2026
Abstract
Large language models (LLMs) and other foundation models are rapidly being woven into enterprise analytics workflows, where they assist with data exploration, forecasting, decision support, and automation. These systems can feel like powerful new teammates: creative, scalable, and tireless. Yet they also introduce
[...] Read more.
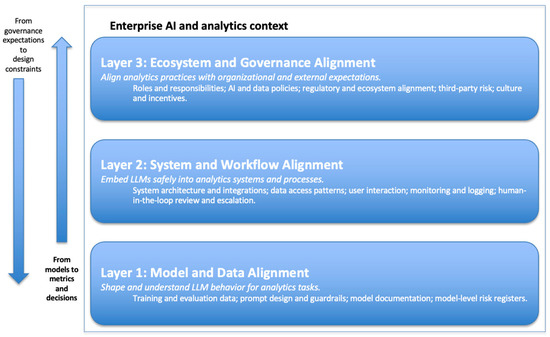
Large language models (LLMs) and other foundation models are rapidly being woven into enterprise analytics workflows, where they assist with data exploration, forecasting, decision support, and automation. These systems can feel like powerful new teammates: creative, scalable, and tireless. Yet they also introduce distinctive risks related to opacity, brittleness, bias, and misalignment with organizational goals. Existing work on AI ethics, alignment, and governance provides valuable principles and technical safeguards, but enterprises still lack practical frameworks that connect these ideas to the specific metrics, controls, and workflows by which analytics teams design, deploy, and monitor LLM-powered systems. This paper proposes a conceptual governance framework for enterprise AI and analytics that is explicitly centered on LLMs embedded in analytics pipelines. The framework adopts a three-layered perspective—model and data alignment, system and workflow alignment, and ecosystem and governance alignment—that links technical properties of models to enterprise analytics practices, performance indicators, and oversight mechanisms. In practical terms, the framework shows how model and workflow choices translate into concrete metrics and inform real deployment, monitoring, and scaling decisions for LLM-powered analytics. We also illustrate how this framework can guide the design of controls for metrics, monitoring, human-in-the-loop structures, and incident response in LLM-driven analytics. The paper concludes with implications for analytics leaders and governance teams seeking to operationalize responsible, scalable use of LLMs in enterprise settings.
Full article
(This article belongs to the Special Issue Critical Challenges in Large Language Models and Data Analytics: Trustworthiness, Scalability, and Societal Impact)
►▼
Show Figures

Figure 1
Open AccessArticle
Predicting ESG Scores Using Machine Learning for Data-Driven Sustainable Investment
by
Sanskruti Patel, Abhay Nath and Pranav Desai
Analytics 2026, 5(1), 7; https://doi.org/10.3390/analytics5010007 - 9 Jan 2026
Cited by 3
Abstract
►▼
Show Figures
Environmental, social and governance (ESG) metrics increasingly inform sustainable investment yet suffer from inter-rater heterogeneity and incomplete reporting, limiting their utility for forward-looking allocation. In this study, we developed and validated a two-level stacked-ensemble machine-learning framework to predict total ESG risk scores for
[...] Read more.
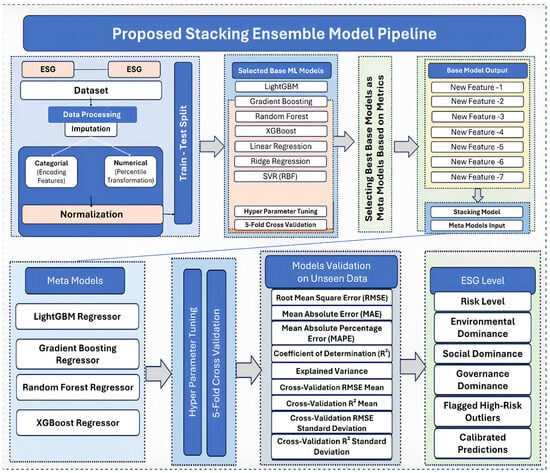
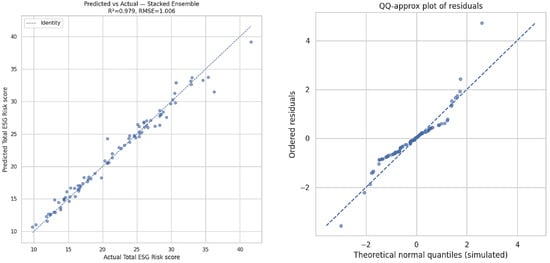
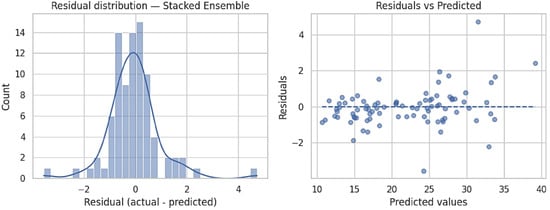
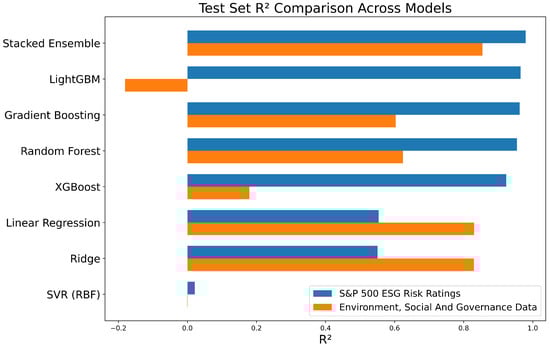
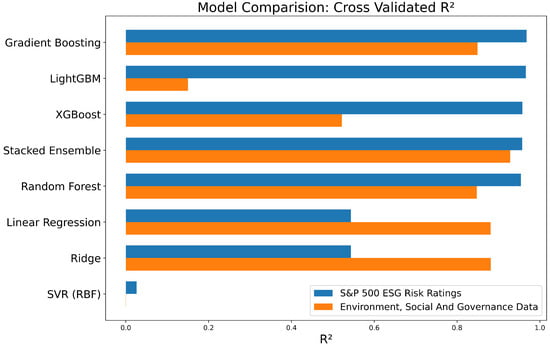
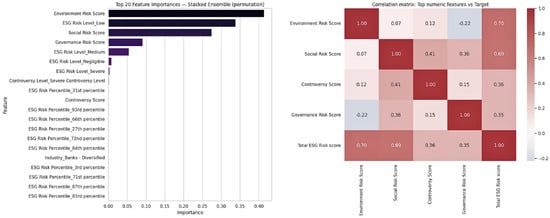
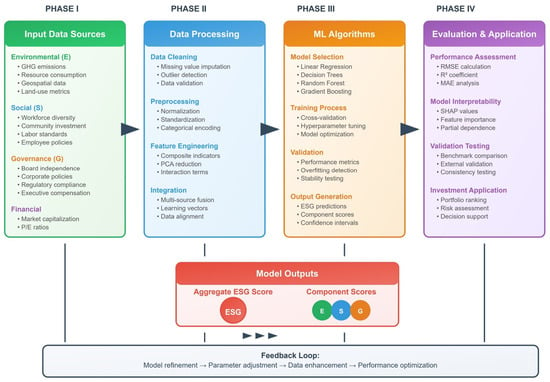
Environmental, social and governance (ESG) metrics increasingly inform sustainable investment yet suffer from inter-rater heterogeneity and incomplete reporting, limiting their utility for forward-looking allocation. In this study, we developed and validated a two-level stacked-ensemble machine-learning framework to predict total ESG risk scores for S&P 500 firms using a comprehensive feature set comprising pillar sub-scores, controversy measures, firm financials, categorical descriptors and geospatial environmental indicators. Data pre-processing combined median/mean imputation, one-hot encoding, normalization and rigorous feature engineering; models were trained with an 80:20 train–test split and hyperparameters tuned by k-fold cross-validation. The stacked ensemble substantially outperformed single-model baselines (RMSE = 1.006, MAE = 0.664, MAPE = 3.13%, = 0.979, CV_RMSE_Mean = 1.383, CV_R2_Mean = 0.957), with LightGBM and gradient boosting as competitive comparators. Permutation importance and correlation analysis identified environmental and social components as primary drivers (environmental importance = 0.41; social = 0.32), with potential multicollinearity between component and aggregate scores. This study concludes that ensemble-based predictive analytics can produce reliable, actionable ESG estimates to enhance screening and prioritization in sustainable investment, while recommending human review for extreme predictions and further work to harmonize cross-provider score divergence.
Full article

Figure 1
Open AccessArticle
Interference-Driven Scaling Variability in Burst-Based Loopless Invasion Percolation Models of Induced Seismicity
by
Ian Baughman and John B. Rundle
Analytics 2026, 5(1), 6; https://doi.org/10.3390/analytics5010006 - 6 Jan 2026
Abstract
►▼
Show Figures
Many fluid-injection sequences display burst-like seismicity with approximate power-law event-size distributions whose exponents drift between catalogs. Classical percolation models instead predict fixed, dimension-dependent exponents and do not specify which geometric mechanisms could underlie such b-value variability. We address this gap using two
[...] Read more.
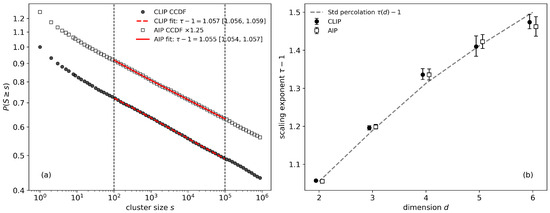
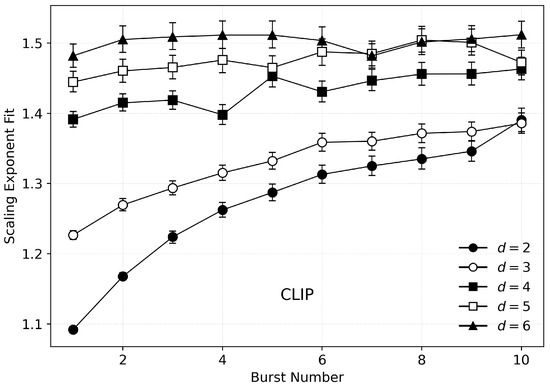
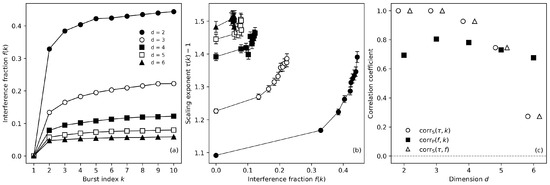
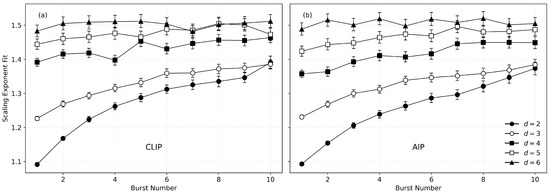
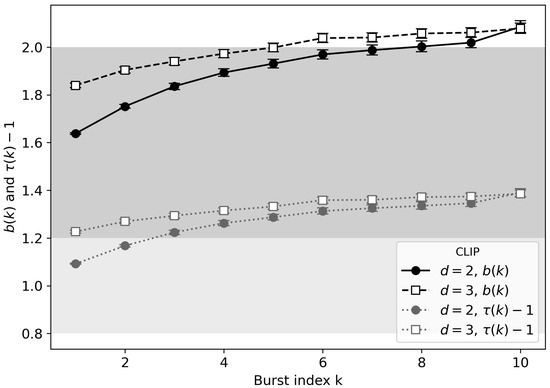
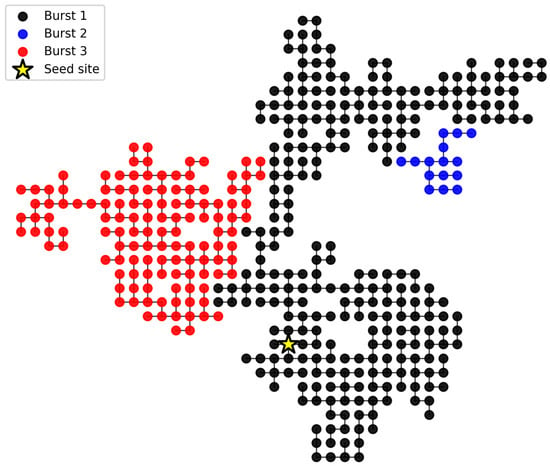
Many fluid-injection sequences display burst-like seismicity with approximate power-law event-size distributions whose exponents drift between catalogs. Classical percolation models instead predict fixed, dimension-dependent exponents and do not specify which geometric mechanisms could underlie such b-value variability. We address this gap using two loopless invasion percolation variants—the constrained Leath invasion percolation (CLIP) and avalanche invasion percolation (AIP) models—to generate synthetic burst catalogs and quantify how burst geometry modifies size–frequency statistics. For each model we measure burst-size distributions and an interference fraction, defined as the proportion of attempted growth steps that terminate on previously activated bonds. Single-burst clusters recover the Fisher exponent of classical percolation, whereas multi-burst sequences show systematic, dimension-dependent drift of the effective exponent with a burst number that is strongly correlated with the interference fraction. CLIP and AIP are indistinguishable under these diagnostics, indicating that interference-driven exponent drift is a generic feature of burst growth rather than a model-specific artifact. Mapping the size-distribution exponent to an equivalent Gutenberg–Richter b-value shows that increasing interference suppresses large bursts and produces b value ranges comparable to those reported for injection-induced seismicity, supporting the interpretation of interference as a geometric proxy for mechanical inhibition that limits the growth of large events in real fracture networks.
Full article

Figure 1

Open AccessArticle
PSYCH—Psychometric Assessment of Large Language Model Characters: An Exploration of the German Language
by
Nane Kratzke, Niklas Beuter, André Drews and Monique Janneck
Analytics 2026, 5(1), 5; https://doi.org/10.3390/analytics5010005 - 6 Jan 2026
Cited by 2
Abstract
Background: Existing evaluations of large language models (LLMs) largely emphasize linguistic and factual performance, while their psychometric characteristics and behavioral biases remain insufficiently examined, particularly beyond English-language contexts. This study presents a systematic psychometric screening of LLMs in German using the validated Big
[...] Read more.
Background: Existing evaluations of large language models (LLMs) largely emphasize linguistic and factual performance, while their psychometric characteristics and behavioral biases remain insufficiently examined, particularly beyond English-language contexts. This study presents a systematic psychometric screening of LLMs in German using the validated Big Five Inventory-2 (BFI-2). Methods: Thirty-two contemporary commercial and open-source LLMs completed all 60 BFI-2 items 60 times each (once with and once without having to justify their answers), yielding over 330,000 responses. Models answered independently, under male and female impersonation, and with and without required justifications. Responses were compared to German human reference data using Welch’s t-tests ( ) to assess deviations, response stability, justification effects, and gender differences. Results: At the domain level, LLM personality profiles broadly align with human means. Facet-level analyses, however, reveal systematic deviations, including inflated agreement—especially in Agreeableness and Aesthetic Sensitivity—and reduced Negative Emotionality. Only a few models show minimal deviations. Justification prompts significantly altered responses in 56% of models, often increasing variability. Commercial models exhibited substantially higher response stability than open-source models. Gender impersonation affected up to 25% of BFI-2 items, reflecting and occasionally amplifying human gender differences. Conclusions: This study introduces a reproducible psychometric framework for benchmarking LLM behavior against validated human norms and shows that LLMs produce stable yet systematically biased personality-like response patterns. Psychometric screening could therefore complement traditional LLM evaluation in sensitive applications.
Full article
(This article belongs to the Special Issue Critical Challenges in Large Language Models and Data Analytics: Trustworthiness, Scalability, and Societal Impact)
►▼
Show Figures

Figure 1
Open AccessArticle
GSM: An Integrated GAM–SHAP–MCDA Framework for Stroke Risk Assessment
by
Rilwan Mustapha, Ashiribo Wusu, Olusola Olabanjo and Bamidele Adetunji
Analytics 2026, 5(1), 4; https://doi.org/10.3390/analytics5010004 - 29 Dec 2025
Abstract
►▼
Show Figures
This study proposes GSM, an interpretable and operational GAM-SHAP-MCDA framework for stroke risk stratification by integrating generalized additive models (GAMs), a point-based clinical scoring system, SHAP-based explainability, and multi-criteria decision analysis (MCDA). Using a publicly available dataset of individuals (
[...] Read more.
This study proposes GSM, an interpretable and operational GAM-SHAP-MCDA framework for stroke risk stratification by integrating generalized additive models (GAMs), a point-based clinical scoring system, SHAP-based explainability, and multi-criteria decision analysis (MCDA). Using a publicly available dataset of individuals ( stroke prevalence), a GAM was fitted to capture nonlinear effects of key physiological predictors, including age, average blood glucose level, and body mass index (BMI), together with linear effects for hypertension, heart disease, and categorical covariates. The estimated smooth functions revealed strong age-related risk acceleration beyond 60 years, threshold behavior for glucose levels above approximately , and a non-monotonic BMI association with peak risk at moderate BMI ranges. In a comparative evaluation, the GAM achieved superior discrimination and calibration relative to classical logistic regression, with a mean AUC of versus and a lower Brier score ( vs. ). A calibration analysis yielded an intercept of and a slope of , indicating near-ideal agreement between the predicted and observed risks. While high-capacity ensemble models such as XGBoost achieved slightly higher AUC values ( ), the GAM attained near-upper-bound performance while retaining full interpretability. To enhance clinical usability, the GAM smooth effects were discretized into clinically interpretable bands and converted into an additive point-based risk score ranging from 0 to 42, which was subsequently calibrated to absolute stroke probability. The calibrated probabilities were incorporated into the TOPSIS and VIKOR MCDA frameworks, producing transparent and robust patient prioritization rankings. A SHAP analysis confirmed age, glucose, and cardiometabolic factors as dominant global contributors, aligning with the learned GAM structure. Overall, the proposed GAM–SHAP–MCDA framework demonstrates that near-state-of-the-art predictive performance can be achieved alongside transparency, calibration, and decision-oriented interpretability, supporting ethical and practical deployment of medical artificial intelligence for stroke risk assessment.
Full article

Figure 1
Highly Accessed Articles
Latest Books
E-Mail Alert
News
Topics
Topic in
Applied Sciences, Future Internet, AI, Analytics, BDCC
Data Intelligence and Computational Analytics
Topic Editors: Carson K. Leung, Fei Hao, Xiaokang ZhouDeadline: 30 November 2026
Topic in
Analytics, Clean Technol., Economies, Energies, JMSE, Resources, Sustainability, Sci
Towards Green and Energy Transitions: Techno-Economic Analysis, Optimization, and Innovation Pathways for Sustainability
Topic Editors: Konstantinos Aravossis, Eleni StrantzaliDeadline: 30 April 2027
Topic in
Information, Healthcare, Informatics, Digital, Analytics, Platforms
Digital Platform Analytics for Societal Development Across Sectors
Topic Editors: Ivy Shiue, Timo KoivumäkiDeadline: 31 May 2027

Special Issues
Special Issue in
Analytics
Critical Challenges in Large Language Models and Data Analytics: Trustworthiness, Scalability, and Societal Impact
Guest Editors: Oluwaseun Ajao, Bayode Ogunleye, Hemlata SharmaDeadline: 31 July 2026
Special Issue in
Analytics
Business Analytics and Applications, 2nd Edition
Guest Editor: Tatiana ErmakovaDeadline: 30 September 2026
Special Issue in
Analytics
Reviews on Data Analytics and Its Applications
Guest Editor: Carson K. LeungDeadline: 28 February 2027