Next Issue
Volume 8, December
Previous Issue
Volume 8, October
 
 
remotesensing-logo

Journal Browser

Journal Browser

Remote Sens., Volume 8, Issue 11 (November 2016) – 91 articles

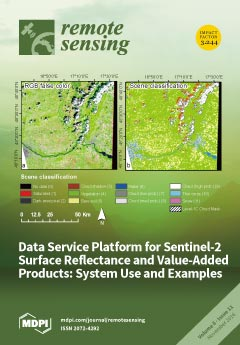
Cover Story (view full-size image): The first operational Sentinel-2 data service platform for obtaining atmospherically-corrected images and generating value-added products, such as maps of leaf area index (LAI). Using the European Space Agency’s (ESA) Sen2Cor algorithm, the platform processes ESA’s Level-1C top-of-atmosphere reflectance to atmospherically-corrected bottom-of-atmosphere (BoA) reflectance (Level-2A). The processing runs on-demand on the Earth Observation Data Centre (EODC), which is a public–private collaborative IT infrastructure in Austria for archiving, processing, and distributing earth observation data. Users can submit processing requests and access the results via a user-friendly web page or use an application programming interface (API). View this paper
  • Issues are regarded as officially published after their release is announced to the table of contents alert mailing list.
  • You may sign up for e-mail alerts to receive table of contents of newly released issues.
  • PDF is the official format for papers published in both, html and pdf forms. To view the papers in pdf format, click on the "PDF Full-text" link, and use the free Adobe Reader to open them.
Order results
Result details
Section
Select all
Export citation of selected articles as:
19 pages, 2019 KiB  
Article
Citizen Bio-Optical Observations from Coast- and Ocean and Their Compatibility with Ocean Colour Satellite Measurements
by Julia A. Busch 1,2,*, Raul Bardaji 3, Luigi Ceccaroni 4, Anna Friedrichs 1, Jaume Piera 3, Carine Simon 3, Peter Thijsse 5, Marcel Wernand 6, Hendrik J. Van der Woerd 7 and Oliver Zielinski 1
1 Institute for Chemistry and Biology of the Marine Environment, University of Oldenburg, Schleusenstraße 1, Wilhelmshaven 26382, Germany
2 Life Sciences and Chemistry, Jacobs University, Campus Ring 1, Bremen 28759, Germany
3 Institue of Marine Sciences, Spanish National Research Council (ICM-CSIC), Passeig Maritim de la Barceloneta, Barcelona 08003, Spain
4 1000001 Labs, Alzina 52, Barcelona 08024, Spain
5 MARIS, Kon. Julianalaan 345A, Voorburg 2273 JJ, The Netherlands
6 Royal Netherlands Institute for Sea Research (NIOZ), P.O. Box 59, Den Burg/Texel 1790 AB, The Netherlands
7 Institute for Environmental Studies (IVM), VU University Amsterdam, De Boelelaan 1087, Amsterdam 1081 HV, The Netherlands
Remote Sens. 2016, 8(11), 879; https://doi.org/10.3390/rs8110879 - 25 Oct 2016
Cited by 47 | Viewed by 10491
Abstract
Marine processes are observed with sensors from both the ground and space over large spatio-temporal scales. Citizen-based contributions can fill observational gaps and increase environmental stewardship amongst the public. For this purpose, tools and methods for citizen science need to (1) complement existing [...] Read more.
Marine processes are observed with sensors from both the ground and space over large spatio-temporal scales. Citizen-based contributions can fill observational gaps and increase environmental stewardship amongst the public. For this purpose, tools and methods for citizen science need to (1) complement existing datasets; and (2) be affordable, while appealing to different user and developer groups. In this article, tools and methods developed in the 7th Framework Programme of European Union (EU FP 7) funded project Citclops (citizens’ observatories for coast and ocean optical monitoring) are reviewed. Tools range from a stand-alone smartphone app to devices with Arduino and 3-D printing, and hence are attractive to a diversity of users; from the general public to more specified maker- and open labware movements. Standardization to common water quality parameters and methods allows long-term storage in regular marine data repositories, such as SeaDataNet and EMODnet, thereby providing open data access. Due to the given intercomparability to existing remote sensing datasets, these tools are ready to complement the marine datapool. In the future, such combined satellite and citizen observations may set measurements by the engaged public in a larger context and hence increase their individual meaning. In a wider sense, a synoptic use can support research, management authorities, and societies at large. Full article
(This article belongs to the Special Issue Citizen Science and Earth Observation)
Show Figures

Graphical abstract

20 pages, 1803 KiB  
Article
Vocalization Source Level Distributions and Pulse Compression Gains of Diverse Baleen Whale Species in the Gulf of Maine
by Delin Wang, Wei Huang, Heriberto Garcia and Purnima Ratilal *
Laboratory for Ocean Acoustics and Ecosystem Sensing, Northeastern University, Boston, MA 02115, USA
Remote Sens. 2016, 8(11), 881; https://doi.org/10.3390/rs8110881 - 25 Oct 2016
Cited by 24 | Viewed by 6635
Abstract
The vocalization source level distributions and pulse compression gains are estimated for four distinct baleen whale species in the Gulf of Maine: fin, sei, minke and an unidentified baleen whale species. The vocalizations were received on a large-aperture densely-sampled coherent hydrophone array system [...] Read more.
The vocalization source level distributions and pulse compression gains are estimated for four distinct baleen whale species in the Gulf of Maine: fin, sei, minke and an unidentified baleen whale species. The vocalizations were received on a large-aperture densely-sampled coherent hydrophone array system useful for monitoring marine mammals over instantaneous wide areas via the passive ocean acoustic waveguide remote sensing technique. For each baleen whale species, between 125 and over 1400 measured vocalizations with significantly high Signal-to-Noise Ratios (SNR > 10 dB) after coherent beamforming and localized with high accuracies (<10% localization errors) over ranges spanning roughly 1 km–30 km are included in the analysis. The whale vocalization received pressure levels are corrected for broadband transmission losses modeled using a calibrated parabolic equation-based acoustic propagation model for a random range-dependent ocean waveguide. The whale vocalization source level distributions are characterized by the following means and standard deviations, in units of dB re 1 μ Pa at 1 m: 181.9 ± 5.2 for fin whale 20-Hz pulses, 173.5 ± 3.2 for sei whale downsweep chirps, 177.7 ± 5.4 for minke whale pulse trains and 169.6 ± 3.5 for the unidentified baleen whale species downsweep calls. The broadband vocalization equivalent pulse-compression gains are found to be 2.5 ± 1.1 for fin whale 20-Hz pulses, 24 ± 10 for the unidentified baleen whale species downsweep calls and 69 ± 23 for sei whale downsweep chirps. These pulse compression gains are found to be roughly proportional to the inter-pulse intervals of the vocalizations, which are 11 ± 5 s for fin whale 20-Hz pulses, 29 ± 18 for the unidentified baleen whale species downsweep calls and 52 ± 33 for sei whale downsweep chirps. The source level distributions and pulse compression gains are essential for determining signal-to-noise ratios and hence detection regions for baleen whale vocalizations received passively on underwater acoustic sensing systems, as well as for assessing communication ranges in baleen whales. Full article
(This article belongs to the Special Issue Underwater Acoustic Remote Sensing)
Show Figures

Graphical abstract

15 pages, 6037 KiB  
Article
Mapping Distinct Forest Types Improves Overall Forest Identification Based on Multi-Spectral Landsat Imagery for Myanmar’s Tanintharyi Region
by Grant Connette 1,*, Patrick Oswald 2, Melissa Songer 1 and Peter Leimgruber 1
1 Conservation Ecology Center/Myanmar Program, Smithsonian Conservation Biology Institute, 1500 Remount Road, Front Royal, VA 22630, USA
2 Fauna & Flora International, 35 Shan Kone Street, San Chaung Township, Yangon 11111, Myanmar
Remote Sens. 2016, 8(11), 882; https://doi.org/10.3390/rs8110882 - 25 Oct 2016
Cited by 50 | Viewed by 14056
Abstract
We investigated the use of multi-spectral Landsat OLI imagery for delineating mangrove, lowland evergreen, upland evergreen and mixed deciduous forest types in Myanmar’s Tanintharyi Region and estimated the extent of degraded forest for each unique forest type. We mapped a total of 16 [...] Read more.
We investigated the use of multi-spectral Landsat OLI imagery for delineating mangrove, lowland evergreen, upland evergreen and mixed deciduous forest types in Myanmar’s Tanintharyi Region and estimated the extent of degraded forest for each unique forest type. We mapped a total of 16 natural and human land use classes using both a Random Forest algorithm and a multivariate Gaussian model while considering scenarios with all natural forest classes grouped into a single intact or degraded category. Overall, classification accuracy increased for the multivariate Gaussian model with the partitioning of intact and degraded forest into separate forest cover classes but slightly decreased based on the Random Forest classifier. Natural forest cover was estimated to be 80.7% of total area in Tanintharyi. The most prevalent forest types are upland evergreen forest (42.3% of area) and lowland evergreen forest (21.6%). However, while just 27.1% of upland evergreen forest was classified as degraded (on the basis of canopy cover <80%), 66.0% of mangrove forest and 47.5% of the region’s biologically-rich lowland evergreen forest were classified as degraded. This information on the current status of Tanintharyi’s unique forest ecosystems and patterns of human land use is critical to effective conservation strategies and land-use planning. Full article
Show Figures

Graphical abstract

16 pages, 6459 KiB  
Article
Sentinel-2A MSI and Landsat 8 OLI Provide Data Continuity for Geological Remote Sensing
by Harald Van der Werff * and Freek Van der Meer
Faculty of Geo-information Science and Earth Observation, University of Twente, Drienerlolaan 5, 7522 NB Enschede, The Netherlands
Remote Sens. 2016, 8(11), 883; https://doi.org/10.3390/rs8110883 - 25 Oct 2016
Cited by 157 | Viewed by 22167
Abstract
Sentinel-2A MSI is the Landsat-like spatial resolution (10–60 m) super-spectral instrument of the European Space Agency (ESA), aimed at additional data continuity for global land surface monitoring with Landsat and Satellite Pour l’Observation de la Terre (SPOT) missions. Several simulation studies have been [...] Read more.
Sentinel-2A MSI is the Landsat-like spatial resolution (10–60 m) super-spectral instrument of the European Space Agency (ESA), aimed at additional data continuity for global land surface monitoring with Landsat and Satellite Pour l’Observation de la Terre (SPOT) missions. Several simulation studies have been conducted in the last several years to show the potential of Sentinel-2A MSI (MultiSpectral Instrument). Now that real data are available, the first confirmations of this potential and comparisons with other operational systems are being made. This paper aims at evaluating Sentinel-2A MSI band ratio products that are relevant for geological remote sensing. A Sentinel-2A MSI and a Landsat 8 OLI (Operational Land Imager) scene were processed from their respective levels L1C and L1T to level L2A (bottom of atmosphere reflectance). Then, three band ratios originally defined for Landsat TM (Thematic Mapper) were used to map mineralogy associated with a hydrothermal alteration system in southeast Spain. The results obtained with Sentinel-2A MSI were compared with those obtained with Landsat 8 OLI and a simulated Sentinel-2A MSI dataset that was used before actual data were released. Results show that the images appear similar to the human eye having a correlation of approximately 0.8 and higher, but that the associated data ranges differ significantly. The resulting products are also compared to a published geologic map of the study area, and it is shown that the resulting maps correspond with the conceptual geologic model of the epithermal deposit. Full article
Show Figures

Graphical abstract

15 pages, 15590 KiB  
Article
The RUNE Experiment—A Database of Remote-Sensing Observations of Near-Shore Winds
by Rogier Floors *, Alfredo Peña, Guillaume Lea, Nikola Vasiljević, Elliot Simon and Michael Courtney
DTU Wind Energy, Technical University of Denmark, Risø Campus, Roskilde 4000, Denmark
Remote Sens. 2016, 8(11), 884; https://doi.org/10.3390/rs8110884 - 26 Oct 2016
Cited by 30 | Viewed by 7505
Abstract
We present a comprehensive database of near-shore wind observations that were carried out during the experimental campaign of the RUNE project. RUNE aims at reducing the uncertainty of the near-shore wind resource estimates from model outputs by using lidar, ocean, and satellite observations. [...] Read more.
We present a comprehensive database of near-shore wind observations that were carried out during the experimental campaign of the RUNE project. RUNE aims at reducing the uncertainty of the near-shore wind resource estimates from model outputs by using lidar, ocean, and satellite observations. Here, we concentrate on describing the lidar measurements. The campaign was conducted from November 2015 to February 2016 on the west coast of Denmark and comprises measurements from eight lidars, an ocean buoy and three types of satellites. The wind speed was estimated based on measurements from a scanning lidar performing PPIs, two scanning lidars performing dual synchronized scans, and five vertical profiling lidars, of which one was operating offshore on a floating platform. The availability of measurements is highest for the profiling lidars, followed by the lidar performing PPIs, those performing the dual setup, and the lidar buoy. Analysis of the lidar measurements reveals good agreement between the estimated 10-min wind speeds, although the instruments used different scanning strategies and measured different volumes in the atmosphere. The campaign is characterized by strong westerlies with occasional storms. Full article
(This article belongs to the Special Issue Remote Sensing of Wind Energy)
Show Figures

Graphical abstract

16 pages, 12874 KiB  
Article
Lake Level Estimation Based on CryoSat-2 SAR Altimetry and Multi-Looked Waveform Classification
by Franziska Göttl *, Denise Dettmering, Felix L. Müller and Christian Schwatke
Deutsches Geodätisches Forschungsinstitut, Technische Universität München, Arcisstraße 21, 80333 Munich, Germany
Remote Sens. 2016, 8(11), 885; https://doi.org/10.3390/rs8110885 - 26 Oct 2016
Cited by 31 | Viewed by 7046
Abstract
In this study, reliable water levels for four lakes are estimated based on an innovative processing strategy using a semi-automatic CryoSat-2 Synthetic Aperture Radar (SAR) multi-looked waveform classification. The selection of valid water returns is an essential step in inland altimetry applications. In [...] Read more.
In this study, reliable water levels for four lakes are estimated based on an innovative processing strategy using a semi-automatic CryoSat-2 Synthetic Aperture Radar (SAR) multi-looked waveform classification. The selection of valid water returns is an essential step in inland altimetry applications. In order to identify reliable observations allowing for an accurate retracking, an unsupervised classification method for CryoSat-2 SAR multi-looked waveforms has been developed based on the k-mean algorithm. With this approach, changes in the water surface extent or surrounding inundation areas can be taken into account. In addition, a modified version of the Improved Threshold Retracker is developed in order to obtain optimal results for the lake heights. The used method is based on the identification of the optimal sub-waveform by employing height thresholds. The validation of the derived CryoSat-2 SAR time series with in-situ gauging data yields root mean square (RMS) differences between 3 and 90 cm for the different lakes. Compared to modeled CryoSat-2 water heights derived according to the approach used in the AltWater database our water level time series are slightly improved in terms of RMS accuracy but they contain more gaps due to the lack of reliable observations. In comparison with classical radar altimeter missions such as Envisat or Jason-2, the SAR-based time series show smaller RMS differences for the small lakes but larger RMS differences for the large lakes covered by multiple repeat missions. The presented innovative processing strategy can be easily adopted to other satellite altimetry SAR data such as from the new Sentinel-3 mission. Full article
Show Figures

Graphical abstract

26 pages, 5154 KiB  
Article
Forest Fragmentation in the Lower Amazon Floodplain: Implications for Biodiversity and Ecosystem Service Provision to Riverine Populations
by Vivian Renó 1,*, Evlyn Novo 1 and Maria Escada 2
1 Remote Sensing Division (DSR), Brazilian Institute for Space Research (INPE), Av. dos Astronautas 1758, São José dos Campos 12227-010, São Paulo, Brazil
2 Image Processing Division (DPI), Brazilian Institute for Space Research (INPE), Av. dos Astronautas 1758, São José dos Campos 12227-010, São Paulo, Brazil
Remote Sens. 2016, 8(11), 886; https://doi.org/10.3390/rs8110886 - 27 Oct 2016
Cited by 39 | Viewed by 9958
Abstract
This article analyzes the process of forest fragmentation of a floodplain landscape of the Lower Amazon over a 30-year period and its implications for the biodiversity and the provision of ecosystem services to the riverine population. To this end, we created a multi-temporal [...] Read more.
This article analyzes the process of forest fragmentation of a floodplain landscape of the Lower Amazon over a 30-year period and its implications for the biodiversity and the provision of ecosystem services to the riverine population. To this end, we created a multi-temporal forest cover map based on Landsat images, and then analyzed the fragmentation dynamics through landscape metrics. From the analyses of the landscape and bibliographic information, we made inferences regarding the potential impacts of fragmentation on the biodiversity of trees, birds, mammals and insects. Subsequently, we used data on the local populations’ environmental perception to assess whether the inferred impacts on biodiversity are perceived by these populations and whether the ecosystem services related to the biodiversity of the addressed groups are compromised. The results show a 70% reduction of the forest habitat as well as important changes in the landscape structure that constitute a high degree of forest fragmentation. The perceived landscape alterations indicate that there is great potential for compromise of the biodiversity of trees, birds, mammals and insects. The field interviews corroborate the inferred impacts on biodiversity and indicate that the ecosystem services of the local communities have been compromised. More than 95% of the communities report a decreased variety and/or abundance of animal and plant species, 46% report a decrease in agricultural productivity, and 19% confirm a higher incidence of pests during the last 30 years. The present study provides evidence of an accelerated process of degradation of the floodplain forests of the Lower Amazon and indicate substantial compromise of the ecosystem services provision to the riverine population in recent decades, including reductions of food resources (animals and plants), fire wood, raw material and medicine, as well as lower agricultural productivity due to probable lack of pollination, impoverishment of the soil and an increase of pests. Full article
(This article belongs to the Special Issue Monitoring of Land Changes)
Show Figures

Graphical abstract

21 pages, 4860 KiB  
Article
Earthquake-Induced Building Damage Detection with Post-Event Sub-Meter VHR TerraSAR-X Staring Spotlight Imagery
by Lixia Gong 1,2, Chao Wang 3, Fan Wu 3,*, Jingfa Zhang 1, Hong Zhang 3 and Qiang Li 1
1 Institute of Crustal Dynamics, China Earthquake Administration, Beijing 100085, China
2 School of Civil Engineering and Geosciences, Newcastle University, Newcastle Upon Tyne NE1 7RU, UK
3 Key Laboratory of Digital Earth Science, Institute of Remote Sensing and Digital Earth, Chinese Academy of Sciences, Beijing 100094, China
Remote Sens. 2016, 8(11), 887; https://doi.org/10.3390/rs8110887 - 27 Oct 2016
Cited by 88 | Viewed by 9045
Abstract
Compared with optical sensors, Synthetic Aperture Radar (SAR) can provide important damage information due to its ability to map areas affected by earthquakes independently from weather conditions and solar illumination. In 2013, a new TerraSAR-X mode named staring spotlight (ST), whose azimuth resolution [...] Read more.
Compared with optical sensors, Synthetic Aperture Radar (SAR) can provide important damage information due to its ability to map areas affected by earthquakes independently from weather conditions and solar illumination. In 2013, a new TerraSAR-X mode named staring spotlight (ST), whose azimuth resolution was improved to 0.24 m, was introduced for various applications. This data source made it possible to extract detailed information from individual buildings. In this paper, we present a new concept for individual building damage assessment using a post-event sub-meter very high resolution (VHR) SAR image and a building footprint map. With the building footprint map, the original footprints of buildings can be located in the SAR image. Based on the building imaging analysis of a building in the SAR image, the features in the building footprint can be extracted to identify standing and collapsed buildings. Three machine learning classifiers, including random forest (RF), support vector machine (SVM) and K-nearest neighbor (K-NN), are used in the experiments. The results show that the proposed method can obtain good overall accuracy, which is above 80% with the three classifiers. The efficiency of the proposed method is demonstrated based on samples of buildings using descending and ascending sub-meter VHR ST images, which were all acquired from the same area in old Beichuan County, China. Full article
(This article belongs to the Special Issue Earth Observations for Geohazards)
Show Figures

Graphical abstract

24 pages, 2885 KiB  
Article
Rapid Land Cover Map Updates Using Change Detection and Robust Random Forest Classifiers
by Konrad J. Wessels 1,2,*, Frans Van den Bergh 1, David P. Roy 3, Brian P. Salmon 4, Karen C. Steenkamp 1, Bryan MacAlister 1, Derick Swanepoel 1 and Debbie Jewitt 5
1 Remote Sensing Research Unit, CSIR-Meraka, P.O. Box 395, Pretoria 0001, South Africa
2 Centre for Geoinformation Science, Department of Geography, Geoinformatics and Meteorology, University of Pretoria, Pretoria 0028, South Africa
3 Geospatial Sciences Center of Excellence, South Dakota State University, Brookings, SD 57007, USA
4 School of Engineering and ICT, University of Tasmania, Churchill Avenue, Hobart TAS 7005, Australia
5 Biodiversity Research and Assessment, Ezemvelo KZN Wildlife, P.O. Box 13053, Cascades 3202, South Africa
Remote Sens. 2016, 8(11), 888; https://doi.org/10.3390/rs8110888 - 28 Oct 2016
Cited by 94 | Viewed by 10843
Abstract
The paper evaluated the Landsat Automated Land Cover Update Mapping (LALCUM) system designed to rapidly update a land cover map to a desired nominal year using a pre-existing reference land cover map. The system uses the Iteratively Reweighted Multivariate Alteration Detection (IRMAD) to [...] Read more.
The paper evaluated the Landsat Automated Land Cover Update Mapping (LALCUM) system designed to rapidly update a land cover map to a desired nominal year using a pre-existing reference land cover map. The system uses the Iteratively Reweighted Multivariate Alteration Detection (IRMAD) to identify areas of change and no change. The system then automatically generates large amounts of training samples (n > 1 million) in the no-change areas as input to an optimized Random Forest classifier. Experiments were conducted in the KwaZulu-Natal Province of South Africa using a reference land cover map from 2008, a change mask between 2008 and 2011 and Landsat ETM+ data for 2011. The entire system took 9.5 h to process. We expected that the use of the change mask would improve classification accuracy by reducing the number of mislabeled training data caused by land cover change between 2008 and 2011. However, this was not the case due to exceptional robustness of Random Forest classifier to mislabeled training samples. The system achieved an overall accuracy of 65%–67% using 22 detailed classes and 72%–74% using 12 aggregated national classes. “Water”, “Plantations”, “Plantations—clearfelled”, “Orchards—trees”, “Sugarcane”, “Built-up/dense settlement”, “Cultivation—Irrigated” and “Forest (indigenous)” had user’s accuracies above 70%. Other detailed classes (e.g., “Low density settlements”, “Mines and Quarries”, and “Cultivation, subsistence, drylands”) which are required for operational, provincial-scale land use planning and are usually mapped using manual image interpretation, could not be mapped using Landsat spectral data alone. However, the system was able to map the 12 national classes, at a sufficiently high level of accuracy for national scale land cover monitoring. This update approach and the highly automated, scalable LALCUM system can improve the efficiency and update rate of regional land cover mapping. Full article
Show Figures

Graphical abstract

33 pages, 21470 KiB  
Article
Exploiting Differential Vegetation Phenology for Satellite-Based Mapping of Semiarid Grass Vegetation in the Southwestern United States and Northern Mexico
by Dennis G. Dye 1,*, Barry R. Middleton 1, John M. Vogel 1, Zhuoting Wu 2 and Miguel Velasco 3
1 Western Geographic Science Center, U.S. Geological Survey, 2255 N. Gemini Drive, Flagstaff, AZ 86001, USA
2 Land Remote Sensing Program, U.S. Geological Survey, 12201 Sunrise Valley Drive, Reston, VA 20192, USA
3 Astrogeology Science Center, U.S. Geological Survey, 2255 N. Gemini Drive, Flagstaff, AZ 86001, USA
Remote Sens. 2016, 8(11), 889; https://doi.org/10.3390/rs8110889 - 28 Oct 2016
Cited by 15 | Viewed by 7321
Abstract
We developed and evaluated a methodology for subpixel discrimination and large-area mapping of the perennial warm-season (C4) grass component of vegetation cover in mixed-composition landscapes of the southwestern United States and northern Mexico. We describe the methodology within a general, conceptual [...] Read more.
We developed and evaluated a methodology for subpixel discrimination and large-area mapping of the perennial warm-season (C4) grass component of vegetation cover in mixed-composition landscapes of the southwestern United States and northern Mexico. We describe the methodology within a general, conceptual framework that we identify as the differential vegetation phenology (DVP) paradigm. We introduce a DVP index, the Normalized Difference Phenometric Index (NDPI) that provides vegetation type-specific information at the subpixel scale by exploiting differential patterns of vegetation phenology detectable in time-series spectral vegetation index (VI) data from multispectral land imagers. We used modified soil-adjusted vegetation index (MSAVI2) data from Landsat to develop the NDPI, and MSAVI2 data from MODIS to compare its performance relative to one alternate DVP metric (difference of spring average MSAVI2 and summer maximum MSAVI2), and two simple, conventional VI metrics (summer average MSAVI2, summer maximum MSAVI2). The NDPI in a scaled form (NDPIs) performed best in predicting variation in perennial C4 grass cover as estimated from landscape photographs at 92 sites (R2 = 0.76, p < 0.001), indicating improvement over the alternate DVP metric (R2 = 0.73, p < 0.001) and substantial improvement over the two conventional VI metrics (R2 = 0.62 and 0.56, p < 0.001). The results suggest DVP-based methods, and the NDPI in particular, can be effective for subpixel discrimination and mapping of exposed perennial C4 grass cover within mixed-composition landscapes of the Southwest, and potentially for monitoring of its response to drought, climate change, grazing and other factors, including land management. With appropriate adjustments, the method could potentially be used for subpixel discrimination and mapping of grass or other vegetation types in other regions where the vegetation components of the landscape exhibit contrasting seasonal patterns of phenology. Full article
Show Figures

Graphical abstract

23 pages, 14402 KiB  
Article
Integrating Data of ASTER and Landsat-8 OLI (AO) for Hydrothermal Alteration Mineral Mapping in Duolong Porphyry Cu-Au Deposit, Tibetan Plateau, China
by Tingbin Zhang 1,2,3, Guihua Yi 1,2,*, Hongmei Li 1, Ziyi Wang 1, Juxing Tang 4,5, Kanghui Zhong 1, Yubin Li 6, Qin Wang 1 and Xiaojuan Bie 1,2
1 College of Earth Sciences, Chengdu University of Technology (CDUT), Chengdu 610059, China
2 Key Laboratory of Geoscience Spatial Information Technology, Ministry of Land and Resources of the People’s Republic of China, Chengdu 610059, China
3 The Engineering& Technical College of Chengdu University of Technology, Leshan 614000, China
4 Institute of Mineral Resources, Chinese Academy of Geological Sciences (CAGS), Beijing 100037, China
5 Key Laboratory of Metallogeny and Mineral Assessment, Ministry of Land and Resources of the People’s Republic of China, Beijing 100037, China
6 Tibet Bureau of Geology and Mineral Exploration and Development, Lhasa 850000, China
Remote Sens. 2016, 8(11), 890; https://doi.org/10.3390/rs8110890 - 28 Oct 2016
Cited by 93 | Viewed by 11657
Abstract
One of the most important characteristics of porphyry copper deposits (PCDs) is the type and distribution pattern of alteration zones which can be used for screening and recognizing these deposits. Hydrothermal alteration minerals with diagnostic spectral absorption properties in the visible and near-infrared [...] Read more.
One of the most important characteristics of porphyry copper deposits (PCDs) is the type and distribution pattern of alteration zones which can be used for screening and recognizing these deposits. Hydrothermal alteration minerals with diagnostic spectral absorption properties in the visible and near-infrared (VNIR) through the shortwave infrared (SWIR) regions can be identified by multispectral and hyperspectral remote sensing data. Six Advanced Spaceborne Thermal Emission and Reflection Radiometer (ASTER) bands in SWIR have been shown to be effective in the mapping of Al-OH, Fe-OH, Mg-OH group minerals. The five VNIR bands of Landsat-8 (L8) Operational Land Imager (OLI) are useful for discriminating ferric iron alteration minerals. In the absence of complete hyperspectral coverage area, an opportunity, however, exists to integrate ASTER and L8-OLI (AO) to compensate each other’s shortcomings in covering area for mineral mapping. This study examines the potential of AO data in mineral mapping in an arid area of the Duolong porphyry Cu-Au deposit(Tibetan Plateau in China) by using spectral analysis techniques. Results show the following conclusions: (1) Combination of ASTER and L8-OLI data (AO) has more mineral information content than either alone; (2) The Duolong PCD alteration zones of phyllic, argillic and propylitic zones are mapped using ASTER SWIR bands and the iron-bearing mineral information is best mapped using AO VNIR bands; (3) The multispectral integration data of AO can provide a compensatory data of ASTER VNIR bands for iron-bearing mineral mapping in the arid and semi-arid areas. Full article
(This article belongs to the Special Issue Multi-Sensor and Multi-Data Integration in Remote Sensing)
Show Figures

Graphical abstract

17 pages, 8686 KiB  
Article
The Potential of Forest Biomass Inversion Based on Vegetation Indices Using Multi-Angle CHRIS/PROBA Data
by Qiang Wang 1,2,3,*, Yong Pang 4, Zengyuan Li 4, Guoqing Sun 5, Erxue Chen 4 and Wenge Ni-Meister 3
1 Harbin Institute of Technology, School of Electronics Information Engineering, Harbin 150001, China
2 Department of Surveying Engineering, Heilongjiang Institute of Technology, Harbin 150040, China
3 Department of Geography, Hunter College of CUNY, New York, NY 10065, USA
4 Institute of Forest Resource Information Techniques, Chinese Academy of Forestry, Beijing 100091, China
5 Department of Geography, University of Maryland, College Park, MD 20742, USA
Remote Sens. 2016, 8(11), 891; https://doi.org/10.3390/rs8110891 - 28 Oct 2016
Cited by 16 | Viewed by 5569
Abstract
Multi-angle remote sensing can either be regarded as an added source of uncertainty for variable retrieval, or as a source of additional information, which enhances variable retrieval compared to traditional single-angle observation. However, the magnitude of these angular and band effects for forest [...] Read more.
Multi-angle remote sensing can either be regarded as an added source of uncertainty for variable retrieval, or as a source of additional information, which enhances variable retrieval compared to traditional single-angle observation. However, the magnitude of these angular and band effects for forest structure parameters is difficult to quantify. We used the Discrete Anisotropic Radiative Transfer (DART) model and the Zelig model to simulate the forest canopy Bidirectional Reflectance Distribution Factor (BRDF) in order to build a look-up table, and eight vegetation indices were used to assess the relationship between BRDF and forest biomass in order to find the sensitive angles and bands. Further, the European Space Agency (ESA) mission, Compact High Resolution Imaging Spectrometer onboard the Project for On-board Autonomy (CHRIS-PROBA) and field sample measurements, were selected to test the angular and band effects on forest biomass retrieval. The results showed that the off-nadir vegetation indices could predict the forest biomass more accurately than the nadir. Additionally, we found that the viewing angle effect is more important, but the band effect could not be ignored, and the sensitive angles for extracting forest biomass are greater viewing angles, especially around the hot and dark spot directions. This work highlighted the combination of angles and bands, and found a new index based on the traditional vegetation index, Atmospherically Resistant Vegetation Index (ARVI), which is calculated by combining sensitive angles and sensitive bands, such as blue band 490 nm/−55°, green band 530 nm/55°, and the red band 697 nm/55°, and the new index was tested to improve the accuracy of forest biomass retrieval. This is a step forward in multi-angle remote sensing applications for mining the hidden relationship between BRDF and forest structure information, in order to increase the utilization efficiency of remote sensing data. Full article
(This article belongs to the Special Issue Remote Sensing of Above Ground Biomass)
Show Figures

Graphical abstract

12 pages, 6600 KiB  
Article
Investigation of Snow Cover Effects and Attenuation Correction of Gamma Ray in Aerial Radiation Monitoring
by Azusa Ishizaki 1,*, Yukihisa Sanada 2, Airi Mori 1, Mitsuo Imura 2, Mutsushi Ishida 2 and Masahiro Munakata 1
1 Nuclear Safety Research Center, Japan Atomic Energy Agency, 2-4 Shirane Shirakata, Tokai-mura, Naka-gun, Ibaraki 319-1195, Japan
2 Fukushima Environmental Safety Center, Japan Atomic Energy Agency, 45-169 Sukakeba, Kayahama-aza, Haramachi, Minamisoma, Fukushima 975-0036, Japan
Remote Sens. 2016, 8(11), 892; https://doi.org/10.3390/rs8110892 - 28 Oct 2016
Cited by 6 | Viewed by 4807
Abstract
In aerial radiation monitoring (ARM), the air dose rate cannot be appropriately estimated under snowy conditions due to attenuation of gamma rays by the snow layer. A technique to address this issue is required for ARM to obtain enough signals for air dose [...] Read more.
In aerial radiation monitoring (ARM), the air dose rate cannot be appropriately estimated under snowy conditions due to attenuation of gamma rays by the snow layer. A technique to address this issue is required for ARM to obtain enough signals for air dose rates. To develop this technique, we investigated the relationship between snow depth and ARM measurement results using ARM, laser imaging detection and ranging, and ground measurement before and after snowfall. From the measured data, the results obtained using three different correction factors were examined and compared. An appropriate correction improved the underestimation of the air dose rate. However, further improvement in the accuracy of the analysis requires accurate estimation of the snow water equivalent. Full article
Show Figures

Graphical abstract

21 pages, 6307 KiB  
Article
Self-Calibration Method Based on Surface Micromaching of Light Transceiver Focal Plane for Optical Camera
by Jin Li 1,2,3,4,*, Yuan Zhang 5, Si Liu 6 and ZhengJun Wang 1,2,3
1 Department of Precision Instrument, Tsinghua University, Beijing 100084, China
2 State Key Laboratory of Precision Measurement Technology and Instruments, Beijing 100084, China
3 Collaborative Innovation Center for Micro/Nano Fabrication, Device and System, Beijing 100084, China
4 Photonics and Sensors Group, Department of Engineering, University of Cambridge, 9 JJ Thomson Avenue, Cambridge CB3 0FA, UK
5 Chuangchun Institute of Optics, Fine Mechanics and Physics, Chinese Academy of Sciences, Changchun 130033, China
6 School of Engineering and Information Technology, University of New South Wales, Canberra 2610, Australia
Remote Sens. 2016, 8(11), 893; https://doi.org/10.3390/rs8110893 - 29 Oct 2016
Cited by 11 | Viewed by 6940
Abstract
In remote sensing photogrammetric applications, inner orientation parameter (IOP) calibration of remote sensing camera is a prerequisite for determining image position. However, achieving such a calibration without temporal and spatial limitations remains a crucial but unresolved issue to date. The accuracy of IOP [...] Read more.
In remote sensing photogrammetric applications, inner orientation parameter (IOP) calibration of remote sensing camera is a prerequisite for determining image position. However, achieving such a calibration without temporal and spatial limitations remains a crucial but unresolved issue to date. The accuracy of IOP calibration methods of a remote sensing camera determines the performance of image positioning. In this paper, we propose a high-accuracy self-calibration method without temporal and spatial limitations for remote sensing cameras. Our method is based on an auto-collimating dichroic filter combined with a surface micromachining (SM) point-source focal plane. The proposed method can autonomously complete IOP calibration without the need of outside reference targets. The SM procedure is used to manufacture a light transceiver focal plane, which integrates with point sources, a splitter, and a complementary metal oxide semiconductor sensor. A dichroic filter is used to fabricate an auto-collimation light reflection element. The dichroic filter, splitter, and SM point-source focal plane are integrated into a camera to perform an integrated self-calibration. Experimental measurements confirm the effectiveness and convenience of the proposed method. Moreover, the method can achieve micrometer-level precision and can satisfactorily complete real-time calibration without temporal or spatial limitations. Full article
Show Figures

Figure 1

30 pages, 7300 KiB  
Article
Spatial-Temporal Sub-Pixel Mapping Based on Swarm Intelligence Theory
by Da He 1,2, Yanfei Zhong 1,2,*, Ruyi Feng 3 and Liangpei Zhang 1,2
1 State Key Laboratory of Information Engineering in Surveying, Mapping, and Remote Sensing, Wuhan University, Wuhan 430079, China
2 Collaborative Innovation Center of Geospatial Technology, Wuhan University, Wuhan 430079, China
3 School of Computer Science, China University of Geosciences, Wuhan 430074, China
Remote Sens. 2016, 8(11), 894; https://doi.org/10.3390/rs8110894 - 29 Oct 2016
Cited by 31 | Viewed by 5425
Abstract
In the past decades, sub-pixel mapping algorithms have been extensively developed due to the large number of different applications. However, most of the sub-pixel mapping algorithms are based on single-temporal images, and the results are usually compromised without auxiliary information due to the [...] Read more.
In the past decades, sub-pixel mapping algorithms have been extensively developed due to the large number of different applications. However, most of the sub-pixel mapping algorithms are based on single-temporal images, and the results are usually compromised without auxiliary information due to the ill-posed problem of sub-pixel mapping. In this paper, a novel spatial-temporal sub-pixel mapping algorithm based on swarm intelligence theory is proposed for multitemporal remote sensing imagery. Swarm intelligence theory involves clonal selection sub-pixel mapping (CSSM), which evolves the solution by emulating the biological advantage of the human immune system, and differential evolution sub-pixel mapping (DESM), which optimizes the solution by intelligent operations and heuristic searching in the solution pool. In addition, considering the under-determined problem of sub-pixel mapping, the spatial-temporal sub-pixel mapping method is used to obtain the distribution information at a fine spatial resolution from the bitemporal image pair, which exactly regularizes the ill-posed problem. Furthermore, the short-interval temporal information and the fine spatial distribution information within the bitemporal image pair can be integrated for further use, such as timely and detailed land-cover change detection (LCCD). To verify the validation of the swarm intelligence theory based spatial-temporal sub-pixel mapping algorithm, the proposed algorithm was compared with several traditional sub-pixel mapping algorithms, in both synthetic and real image experiments. The experimental results confirm that the proposed algorithm outperforms the traditional approaches, achieving a better sub-pixel mapping result both qualitatively and quantitatively, as well as improving the subsequent LCCD performance. Full article
Show Figures

Figure 1

24 pages, 6636 KiB  
Article
Spaceborne Sun-Induced Vegetation Fluorescence Time Series from 2007 to 2015 Evaluated with Australian Flux Tower Measurements
by Abram F. J. Sanders 1,2,*,†, Willem W. Verstraeten 1,3,4,*,†, Maurits L. Kooreman 1, Thomas C. Van Leth 1, Jason Beringer 5 and Joanna Joiner 6
1 Royal Netherlands Meteorological Institute (KNMI), R & D Satellite Observations, Utrechtseweg 297, De Bilt 3731 GA, The Netherlands
2 Institut für Umweltphysik (IUP), Universität Bremen, Otto-Hahn-Allee 1, Bremen 28359, Germany
3 Royal Meteorological Institute (KMI), Ringlaan 3, Ukkel B-1180, Belgium
4 Meteorology and Air Quality Group, Wageningen University, Droevendaalsesteeg 4, Wageningen 6708 PB, The Netherlands
5 School of Earth and Environment, The University of Western Australia, 35 Stirling Highway, Crawley WA 6009, Australia
6 NASA Goddard Space Flight Center, Greenbelt, MD 20771, USA
These authors contributed equally to this work.
Remote Sens. 2016, 8(11), 895; https://doi.org/10.3390/rs8110895 - 29 Oct 2016
Cited by 47 | Viewed by 7712
Abstract
A global, monthly averaged time series of Sun-induced Fluorescence (SiF), spanning January 2007 to June 2015, was derived from Metop-A Global Ozone Monitoring Experiment 2 (GOME-2) spectral measurements. Far-red SiF was retrieved using the filling-in of deep solar Fraunhofer lines and atmospheric absorption [...] Read more.
A global, monthly averaged time series of Sun-induced Fluorescence (SiF), spanning January 2007 to June 2015, was derived from Metop-A Global Ozone Monitoring Experiment 2 (GOME-2) spectral measurements. Far-red SiF was retrieved using the filling-in of deep solar Fraunhofer lines and atmospheric absorption bands based on the general methodology described by Joiner et al, AMT, 2013. A Principal Component (PC) analysis of spectra over non-vegetated areas was performed to describe the effects of atmospheric absorption. Our implementation (SiF KNMI) is an independent algorithm and differs from the latest implementation of Joiner et al, AMT, 2013 (SiF NASA, v26), because we used desert reference areas for determining PCs (as opposed to cloudy ocean and some desert) and a wider fit window that covers water vapour and oxygen absorption bands (as opposed to only Fraunhofer lines). As a consequence, more PCs were needed (35 as opposed to 12). The two time series (SiF KNMI and SiF NASA, v26) correlate well (overall R of 0.78) except for tropical rain forests. Sensitivity experiments suggest the strong impact of the water vapour absorption band on retrieved SiF values. Furthermore, we evaluated the SiF time series with Gross Primary Productivity (GPP) derived from twelve flux towers in Australia. Correlations for individual towers range from 0.37 to 0.84. They are particularly high for managed biome types. In the de-seasonalized Australian SiF time series, the break of the Millennium Drought during local summer of 2010/2011 is clearly observed. Full article
(This article belongs to the Special Issue Remote Sensing of Vegetation Structure and Dynamics)
Show Figures

Graphical abstract

24 pages, 4147 KiB  
Article
Long-Range WindScanner System
by Nikola Vasiljević 1,*, Guillaume Lea 1, Michael Courtney 1, Jean-Pierre Cariou 2, Jakob Mann 1 and Torben Mikkelsen 1
1 DTU Wind Energy, Frederiksborgvej 399, 4000 Roskilde, Denmark
2 Leosphere, 14-16 Rue Jean Rostand, Orsay 91400, France
Remote Sens. 2016, 8(11), 896; https://doi.org/10.3390/rs8110896 - 29 Oct 2016
Cited by 68 | Viewed by 11523
Abstract
The technical aspects of a multi-Doppler LiDAR instrument, the long-range WindScanner system, are presented accompanied by an overview of the results from several field campaigns. The long-range WindScanner system consists of three spatially-separated, scanning coherent Doppler LiDARs and a remote master computer that [...] Read more.
The technical aspects of a multi-Doppler LiDAR instrument, the long-range WindScanner system, are presented accompanied by an overview of the results from several field campaigns. The long-range WindScanner system consists of three spatially-separated, scanning coherent Doppler LiDARs and a remote master computer that coordinates them. The LiDARs were carefully engineered to perform user-defined and time-controlled scanning trajectories. Their wireless coordination via the master computer allows achieving and maintaining the LiDARs’ synchronization within ten milliseconds. The long-range WindScanner system measures the wind field by emitting and directing three laser beams to intersect, and then scanning the beam intersection over a region of interest. The long-range WindScanner system was developed to tackle the need for high-quality observations of wind fields on scales of modern wind turbine and wind farms. It has been in operation since 2013. Full article
(This article belongs to the Special Issue Remote Sensing of Wind Energy)
Show Figures

Figure 1

15 pages, 17858 KiB  
Article
Shallow Off-Shore Archaeological Prospection with 3-D Electrical Resistivity Tomography: The Case of Olous (Modern Elounda), Greece
by Kleanthis Simyrdanis, Nikos Papadopoulos * and Gianluca Cantoro
Laboratory of Geophysical Satellite Remote Sensing and Archaeoenvironment (GeoSat ReSeArch Lab), Institute for Mediterranean Studies (IMS), Foundation for Research and Technology (FORTH), Nik. Foka 130, 74 100 Rethymno, Greece
Remote Sens. 2016, 8(11), 897; https://doi.org/10.3390/rs8110897 - 29 Oct 2016
Cited by 28 | Viewed by 8940
Abstract
It is well known that nowadays as well as in the past the vast majority of human habitation and activities are mainly concentrated in littoral areas. Thus the increased attention to coastal zone management contributed to the development and implementation of shallow-water mapping [...] Read more.
It is well known that nowadays as well as in the past the vast majority of human habitation and activities are mainly concentrated in littoral areas. Thus the increased attention to coastal zone management contributed to the development and implementation of shallow-water mapping approaches for capturing current environmental conditions. During the last decade, geophysical imaging techniques like electrical resistivity tomography (ERT) have been used in mapping onshore buried antiquities in a non-destructive manner, contributing to cultural heritage management. Despite its increased implementation in mapping on-shore buried archaeological remains, ERT has minimal to non-existent employment for the understanding of the past dynamics in littoral and shallow off-shore marine environments. This work presents the results of an extensive ERT survey in investigating part of the Hellenistic to Byzantine submerged archaeological site of Olous, located on the north-eastern coast of Crete, Greece. A marine area of 7100 m2 was covered with 178 densely spaced ERT lines having a cumulative length of 8.3 km. A combination of submerged static and moving survey modes were used to document potential buried and submerged structures. The acquired data from the marine environment were processed with two-dimensional and three-dimensional inversion algorithms. A real time kinematic global navigation satellite system was used to map the visible submerged walls and compile the bathymetry model of the bay. The adaptation of ERT in reconstructing the underwater archaeological remains in a shallow marine environment presented specific methodological and processing challenges. The in situ experience from the archaeological site of Olous showed that ERT provided a robust method for mapping the submerged archaeological structures related to the ancient built environment (walls, buildings, roads), signifying at the same time the vertical stratigraphy of the submerged sediments. The inherent limitation of employing ERT in a conductive environment is counterbalanced by the incorporation of precise knowledge for the conductivity and bathymetry of the saline water in the modelling and inversion procedure. Although the methodology definitely needs further refinement, the overall outcomes of this work underline the potential of ERT imaging being integrated into wider shallow marine projects for the mapping of archaeological sites in similar environmental regimes. Full article
(This article belongs to the Special Issue Archaeological Prospecting and Remote Sensing)
Show Figures

Graphical abstract

22 pages, 4065 KiB  
Article
Long-Term Post-Disturbance Forest Recovery in the Greater Yellowstone Ecosystem Analyzed Using Landsat Time Series Stack
by Feng R. Zhao 1,*, Ran Meng 2, Chengquan Huang 1, Maosheng Zhao 1, Feng A. Zhao 1, Peng Gong 3, Le Yu 3 and Zhiliang Zhu 4
1 Department of Geographical Sciences, University of Maryland, College Park, MD 20742, USA
2 Environmental and Climate Sciences Department, Brookhaven National Laboratory, Bldg. 490A, Upton, NY 11973, USA
3 Ministry of Education Key Laboratory for Earth System Modeling, Center for Earth System Science, Tsinghua University, Haidian, Beijing 10083, China
4 U.S. Geological Survey, Reston, VA 20192, USA
Remote Sens. 2016, 8(11), 898; https://doi.org/10.3390/rs8110898 - 29 Oct 2016
Cited by 43 | Viewed by 10660
Abstract
Forest recovery from past disturbance is an integral process of ecosystem carbon cycles, and remote sensing provides an effective tool for tracking forest disturbance and recovery over large areas. Although the disturbance products (tracking the conversion from forest to non-forest type) derived using [...] Read more.
Forest recovery from past disturbance is an integral process of ecosystem carbon cycles, and remote sensing provides an effective tool for tracking forest disturbance and recovery over large areas. Although the disturbance products (tracking the conversion from forest to non-forest type) derived using the Landsat Time Series Stack-Vegetation Change Tracker (LTSS-VCT) algorithm have been validated extensively for mapping forest disturbances across the United States, the ability of this approach to characterize long-term post-disturbance recovery (the conversion from non-forest to forest) has yet to be assessed. In this study, the LTSS-VCT approach was applied to examine long-term (up to 24 years) post-disturbance forest spectral recovery following stand-clearing disturbances (fire and harvests) in the Greater Yellowstone Ecosystem (GYE). Using high spatial resolution images from Google Earth, we validated the detectable forest recovery status mapped by VCT by year 2011. Validation results show that the VCT was able to map long-term post-disturbance forest recovery with overall accuracy of ~80% for different disturbance types and forest types in the GYE. Harvested areas in the GYE have higher percentages of forest recovery than burned areas by year 2011, and National Forests land generally has higher recovery rates compared with National Parks. The results also indicate that forest recovery is highly related with forest type, elevation and environmental variables such as soil type. Findings from this study can provide valuable insights for ecosystem modeling that aim to predict future carbon dynamics by integrating fine scale forest recovery conditions in GYE, in the face of climate change. With the availability of the VCT product nationwide, this approach can also be applied to examine long-term post-disturbance forest recovery in other study regions across the U.S. Full article
(This article belongs to the Special Issue Remote Sensing of Forest Health)
Show Figures

Graphical abstract

18 pages, 15567 KiB  
Article
Using a Kalman Filter to Assimilate TRMM-Based Real-Time Satellite Precipitation Estimates over Jinghe Basin, China
by Jiaqi Chen 1,2, Bin Yong 1,*, Liliang Ren 1, Weiguang Wang 1, Bo Chen 1, Jianan Lin 2, Zhongbo Yu 1 and Ning Li 3
1 State Key Laboratory of Hydrology-Water Resources and Hydraulic Engineering, Hohai University, Nanjing 210098, China
2 College of Computer and Information Engineering, Hohai University, Nanjing 210098, China
3 Department of Space Microwave Remote Sensing System, Institute of Electronics, Chinese Academy of Sciences, Beijing 100190, China
Remote Sens. 2016, 8(11), 899; https://doi.org/10.3390/rs8110899 - 2 Nov 2016
Cited by 7 | Viewed by 5783
Abstract
In this study, efforts are focused on the comparison and validation of standard Tropical Rainfall Measuring Mission (TRMM) Multisatellite Precipitation Analysis (TMPA) products—Version-7 3B42RT estimates before and after assimilation by using a Kalman filter with independent rain gauge networks located within the Jinghe [...] Read more.
In this study, efforts are focused on the comparison and validation of standard Tropical Rainfall Measuring Mission (TRMM) Multisatellite Precipitation Analysis (TMPA) products—Version-7 3B42RT estimates before and after assimilation by using a Kalman filter with independent rain gauge networks located within the Jinghe basin of China. Generally, the direct comparison of TMPA precipitation estimates to 200 collocated rain gauges from 2006 to 2008 demonstrate that the spatial and temporal rainfall characteristics over the region are well captured by the assimilation estimates. Especially, results also show that using Kalman filter to assimilate TRMM-based multi-satellite real-time precipitation estimates tends to perform well over regions, where gauge network is rather sparse. Last, this study highlights that accurate detection and estimation of precipitation in the summer season by Kalman filter, particularly for nonlinear convective precipitation events, is still a challenging task for the future development of assimilation technique for improving the satellite-based precipitation accuracy. Full article
(This article belongs to the Special Issue Uncertainties in Remote Sensing)
Show Figures

Graphical abstract

22 pages, 20979 KiB  
Article
Direct Measurements of Bedrock Incision Rates on the Surface of a Large Dip-slope Landslide by Multi-Period Airborne Laser Scanning DEMs
by Yu-Chung Hsieh 1,2, Yu-Chang Chan 3,*, Jyr-Ching Hu 2, Yi-Zhong Chen 4,5, Rou-Fei Chen 5 and Mien-Ming Chen 1
1 Central Geological Survey, Ministry of Economic Affairs, Taipei 235, Taiwan
2 Department of Geosciences, National Taiwan University, Taipei 106, Taiwan
3 Institute of Earth Sciences, Academia Sinica, Taipei 115, Taiwan
4 Department of Earth Sciences, National Cheng Kung University, Tainan 701, Taiwan
5 Department of Geology, Chinese Culture University, Taipei 111, Taiwan
Remote Sens. 2016, 8(11), 900; https://doi.org/10.3390/rs8110900 - 29 Oct 2016
Cited by 15 | Viewed by 6872
Abstract
This study uses three periods of airborne laser scanning (ALS) digital elevation model (DEM) data to analyze the short-term erosional features of the Tsaoling landslide triggered by the 1999 Chi-Chi earthquake in Taiwan. Two methods for calculating the bedrock incision rate, the equal-interval [...] Read more.
This study uses three periods of airborne laser scanning (ALS) digital elevation model (DEM) data to analyze the short-term erosional features of the Tsaoling landslide triggered by the 1999 Chi-Chi earthquake in Taiwan. Two methods for calculating the bedrock incision rate, the equal-interval cross section selection method and the continuous swath profiles selection method, were used in the study after nearly ten years of gully incision following the earthquake-triggered dip-slope landslide. Multi-temporal gully incision rates were obtained using the continuous swath profiles selection method, which is considered a practical and convenient approach in terrain change studies. After error estimation and comparison of the multi-period ALS DEMs, the terrain change in different periods can be directly calculated, reducing time-consuming fieldwork such as installation of erosion pins and measurement of topographic cross sections on site. The gully bedrock incision rate calculated by the three periods of ALS DEMs on the surface of the Tsaoling landslide ranged from 0.23 m/year to 3.98 m/year. The local gully incision rate in the lower part of the landslide surface was found to be remarkably faster than that of the other regions, suggesting that the fast incision of the toe area possibly contributes to the occurrence of repeated landslides in the Tsaoling area. Full article
Show Figures

Graphical abstract

16 pages, 6496 KiB  
Article
Differential Heating in the Indian Ocean Differentially Modulates Precipitation in the Ganges and Brahmaputra Basins
by Md Shahriar Pervez 1,* and Geoffrey M. Henebry 2
1 Arctic Slope Regional Corporation Federal InuTeq, Contractor to U.S. Geological Survey, Earth Resources Observation and Science Center, 47914 252nd Street, Sioux Falls, SD 57198, USA
2 Geospatial Sciences Center of Excellence, South Dakota State University, 1021 Medary Ave., Wecota Hall 506B, Brookings, SD 57007, USA
Remote Sens. 2016, 8(11), 901; https://doi.org/10.3390/rs8110901 - 31 Oct 2016
Cited by 5 | Viewed by 7429
Abstract
Indo-Pacific sea surface temperature dynamics play a prominent role in Asian summer monsoon variability. Two interactive climate modes of the Indo-Pacific—the El Niño/Southern Oscillation (ENSO) and the Indian Ocean dipole mode—modulate the amount of precipitation over India, in addition to precipitation over Africa, [...] Read more.
Indo-Pacific sea surface temperature dynamics play a prominent role in Asian summer monsoon variability. Two interactive climate modes of the Indo-Pacific—the El Niño/Southern Oscillation (ENSO) and the Indian Ocean dipole mode—modulate the amount of precipitation over India, in addition to precipitation over Africa, Indonesia, and Australia. However, this modulation is not spatially uniform. The precipitation in southern India is strongly forced by the Indian Ocean dipole mode and ENSO. In contrast, across northern India, encompassing the Ganges and Brahmaputra basins, the climate mode influence on precipitation is much less. Understanding the forcing of precipitation in these river basins is vital for food security and ecosystem services for over half a billion people. Using 28 years of remote sensing observations, we demonstrate that (i) the tropical west-east differential heating in the Indian Ocean influences the Ganges precipitation and (ii) the north-south differential heating in the Indian Ocean influences the Brahmaputra precipitation. The El Niño phase induces warming in the warm pool of the Indian Ocean and exerts more influence on Ganges precipitation than Brahmaputra precipitation. The analyses indicate that both the magnitude and position of the sea surface temperature anomalies in the Indian Ocean are important drivers for precipitation dynamics that can be effectively summarized using two new indices, one tuned for each basin. These new indices have the potential to aid forecasting of drought and flooding, to contextualize land cover and land use change, and to assess the regional impacts of climate change. Full article
Show Figures

Graphical abstract

18 pages, 7338 KiB  
Article
Multi-Instrument Inter-Calibration (MIIC) System
by Chris Currey 1,*, Aron Bartle 2, Constantine Lukashin 1, Carlos Roithmayr 1 and James Gallagher 3
1 NASA Langley Research Center, Mail Stop 420, Hampton, VA 23681, USA
2 Mechdyne Corporation, Virginia Beach, VA 23462, USA
3 OPeNDAP, Inc., Butte, MT 59701, USA
Remote Sens. 2016, 8(11), 902; https://doi.org/10.3390/rs8110902 - 3 Nov 2016
Cited by 2 | Viewed by 5059
Abstract
In order to have confidence in the long-term records of atmospheric and surface properties derived from satellite measurements it is important to know the stability and accuracy of the actual radiance or reflectance measurements. Climate quality measurements require accurate calibration of space-borne instruments. [...] Read more.
In order to have confidence in the long-term records of atmospheric and surface properties derived from satellite measurements it is important to know the stability and accuracy of the actual radiance or reflectance measurements. Climate quality measurements require accurate calibration of space-borne instruments. Inter-calibration is the process that ties the calibration of a target instrument to a more accurate, preferably SI-traceable, reference instrument by matching measurements in time, space, wavelength, and view angles. A major challenge for any inter-calibration study is to find and acquire matched samples from within the large data volumes distributed across Earth science data centers. Typically less than 0.1% of the instrument data are required for inter-calibration analysis. Software tools and networking middleware are necessary for intelligent selection and retrieval of matched samples from multiple instruments on separate spacecraft. This paper discusses the Multi-Instrument Inter-Calibration (MIIC) system, a web-based software framework used by the Climate Absolute Radiance and Refractivity Observatory (CLARREO) Pathfinder mission to simplify the data management mechanics of inter-calibration. MIIC provides three main services: (1) inter-calibration event prediction; (2) data acquisition; and (3) data analysis. The combination of event prediction and powerful server-side functions reduces the data volume required for inter-calibration studies by several orders of magnitude, dramatically reducing network bandwidth and disk storage needs. MIIC provides generic retrospective analysis services capable of sifting through large data volumes of existing instrument data. The MIIC tiered design deployed at large institutional data centers can help international organizations, such as Global Space Based Inter-Calibration System (GSICS), more efficiently acquire matched data from multiple data centers. In this paper we describe the MIIC architecture and services. Full article
Show Figures

Graphical abstract

23 pages, 10347 KiB  
Article
Monitoring Bedfast Ice and Ice Phenology in Lakes of the Lena River Delta Using TerraSAR-X Backscatter and Coherence Time Series
by Sofia Antonova 1,*, Claude R. Duguay 2, Andreas Kääb 3, Birgit Heim 1, Moritz Langer 4, Sebastian Westermann 3 and Julia Boike 1
1 Alfred Wegener Institute, Helmholtz Center for Polar and Marine Research, Potsdam 14473, Germany
2 Department of Geography & Environmental Management and Interdisciplinary Centre on Climate Change, University of Waterloo, Waterloo, ON N2L 3G1, Canada
3 Department of Geosciences, University of Oslo, Oslo 0316, Norway
4 Department of Geography, Humboldt-Universität zu Berlin, Berlin 10099, Germany
Remote Sens. 2016, 8(11), 903; https://doi.org/10.3390/rs8110903 - 3 Nov 2016
Cited by 44 | Viewed by 12095
Abstract
Thermokarst lakes and ponds are major elements of permafrost landscapes, occupying up to 40% of the land area in some Arctic regions. Shallow lakes freeze to the bed, thus preventing permafrost thaw underneath them and limiting the length of the period with greenhouse [...] Read more.
Thermokarst lakes and ponds are major elements of permafrost landscapes, occupying up to 40% of the land area in some Arctic regions. Shallow lakes freeze to the bed, thus preventing permafrost thaw underneath them and limiting the length of the period with greenhouse gas production in the unfrozen lake sediments. Radar remote sensing permits to distinguish lakes with bedfast ice due to the difference in backscatter intensities from bedfast and floating ice. This study investigates the potential of a unique time series of three-year repeat-pass TerraSAR-X (TSX) imagery with high temporal (11 days) and spatial (10 m) resolution for monitoring bedfast ice as well as ice phenology of lakes in the zone of continuous permafrost in the Lena River Delta, Siberia. TSX backscatter intensity is shown to be an excellent tool for monitoring floating versus bedfast lake ice as well as ice phenology. TSX-derived timing of ice grounding and the ice growth model CLIMo are used to retrieve the ice thicknesses of the bedfast ice at points where in situ ice thickness measurements were available. Comparison shows good agreement in the year of field measurements. Additionally, for the first time, an 11-day sequential interferometric coherence time series is analyzed as a supplementary approach for the bedfast ice monitoring. The coherence time series detects most of the ice grounding as well as spring snow/ice melt onset. Overall, the results show the great value of TSX time series for monitoring Arctic lake ice and provide a basis for various applications: for instance, derivation of shallow lakes bathymetry, evaluation of winter water resources and locating fish winter habitat as well as estimation of taliks extent in permafrost. Full article
Show Figures

Graphical abstract

11 pages, 3350 KiB  
Article
Evaluation and Uncertainty Estimation of the Latest Radar and Satellite Snowfall Products Using SNOTEL Measurements over Mountainous Regions in Western United States
by Yixin Wen 1,*, Ali Behrangi 1, Bjorn Lambrigtsen 1 and Pierre-Emmanuel Kirstetter 2,3
1 Jet Propulsion Laboratory, California Institute of Technology, Pasadena, CA 91109, USA
2 Advanced Radar Research Center, University of Oklahoma, Norman, OK 73019, USA
3 NOAA/National Severe Storms Laboratory, Norman, OK 73019, USA
Remote Sens. 2016, 8(11), 904; https://doi.org/10.3390/rs8110904 - 1 Nov 2016
Cited by 34 | Viewed by 7019
Abstract
Snow contributes to regional and global water budgets, and is of critical importance to water resources management and our society. Along with advancement in remote sensing tools and techniques to retrieve snowfall, verification and refinement of these estimates need to be performed using [...] Read more.
Snow contributes to regional and global water budgets, and is of critical importance to water resources management and our society. Along with advancement in remote sensing tools and techniques to retrieve snowfall, verification and refinement of these estimates need to be performed using ground-validation datasets. A comprehensive evaluation of the Multi-Radar/Multi-Sensor (MRMS) snowfall products and Integrated Multi-satellitE Retrievals for GPM (Global Precipitation Measurement) (IMERG) precipitation products is conducted using the Snow Telemetry (SNOTEL) daily precipitation and Snow Water Equivalent (SWE) datasets. Severe underestimations are found in both radar and satellite products. Comparisons are conducted as functions of air temperature, snowfall intensity, and radar beam height, in hopes of resolving the discrepancies between measurements by remote sensing and gauge, and finally developing better snowfall retrieval algorithms in the future. Full article
(This article belongs to the Special Issue Uncertainties in Remote Sensing)
Show Figures

Graphical abstract

18 pages, 13157 KiB  
Article
Crowdsourcing In-Situ Data on Land Cover and Land Use Using Gamification and Mobile Technology
by Juan Carlos Laso Bayas 1,*, Linda See 1, Steffen Fritz 1, Tobias Sturn 1, Christoph Perger 1, Martina Dürauer 1, Mathias Karner 1, Inian Moorthy 1, Dmitry Schepaschenko 1,2, Dahlia Domian 1 and Ian McCallum 1
1 Ecosystems Services and Management Program, International Institute for Applied Systems Analysis, Laxenburg A-2361, Austria
2 Forestry Faculty, Bauman Moscow State Technical University, Mytischi 141005, Russia
Remote Sens. 2016, 8(11), 905; https://doi.org/10.3390/rs8110905 - 1 Nov 2016
Cited by 52 | Viewed by 9818
Abstract
Citizens are increasingly becoming involved in data collection, whether for scientific purposes, to carry out micro-tasks, or as part of a gamified, competitive application. In some cases, volunteered data collection overlaps with that of mapping agencies, e.g., the citizen-based mapping of features in [...] Read more.
Citizens are increasingly becoming involved in data collection, whether for scientific purposes, to carry out micro-tasks, or as part of a gamified, competitive application. In some cases, volunteered data collection overlaps with that of mapping agencies, e.g., the citizen-based mapping of features in OpenStreetMap. LUCAS (Land Use Cover Area frame Sample) is one source of authoritative in-situ data that are collected every three years across EU member countries by trained personnel at a considerable cost to taxpayers. This paper presents a mobile application called FotoQuest Austria, which involves citizens in the crowdsourcing of in-situ land cover and land use data, including at locations of LUCAS sample points in Austria. The results from a campaign run during the summer of 2015 suggest that land cover and land use can be crowdsourced using a simple protocol based on LUCAS. This has implications for remote sensing as this data stream represents a new source of potentially valuable information for the training and validation of land cover maps as well as for area estimation purposes. Although the most detailed and challenging classes were more difficult for untrained citizens to recognize, the agreement between the crowdsourced data and the LUCAS data for basic high level land cover and land use classes in homogeneous areas (ca. 80%) shows clear potential. Recommendations for how to further improve the quality of the crowdsourced data in the context of LUCAS are provided so that this source of data might one day be accurate enough for land cover mapping purposes. Full article
(This article belongs to the Special Issue Citizen Science and Earth Observation)
Show Figures

Graphical abstract

28 pages, 7110 KiB  
Article
Creating Multi-Temporal Composites of Airborne Imaging Spectroscopy Data in Support of Digital Soil Mapping
by Sanne Diek *, Michael E. Schaepman and Rogier De Jong
Remote Sensing Laboratories (RSL), University of Zürich, Winterthurerstrasse 190, Zürich 8057, Switzerland
Remote Sens. 2016, 8(11), 906; https://doi.org/10.3390/rs8110906 - 2 Nov 2016
Cited by 48 | Viewed by 7068
Abstract
An increasing demand for full spatio-temporal coverage of soil information drives the growing use of soil spectroscopy. Soil spectroscopy application performed under laboratory conditions or in-field studies in semi-arid areas have shown promising results. However, when acquiring data in temperate zones, limitations by [...] Read more.
An increasing demand for full spatio-temporal coverage of soil information drives the growing use of soil spectroscopy. Soil spectroscopy application performed under laboratory conditions or in-field studies in semi-arid areas have shown promising results. However, when acquiring data in temperate zones, limitations by vegetation-free coverage, variation in soil moisture and management are driving coherent spatio-temporal data collection. This study explores the use of multi-temporal imaging spectroscopy data to increase the total mapping area of bare soils in a heterogeneous agricultural landscape. Spectrally and spatially high-resolution data from the Airborne Prism Experiment (APEX) were collected in September 2013, April 2014 and April 2015. Bare soils in all acquisitions were identified. To eliminate short-term differences in soil moisture and soil surface roughness, the empirical line method was used to calibrate the reflectance values of the singular images (2013 and 2015) towards the singular image with most bare soil pixels (2014). Difference indicators show that the calibration was successful (decrease in root mean square difference and angle difference, increase in R2 and gain and offset close to one and zero). Finally, the multi-temporal composite image contained more than double the amount of bare soil pixels as compared to a singular acquisition. Summary statistics show that reflectance values of the multi-temporal composite approximate the single image data of 2014 (mean and standard deviation of 2014: 24.2 ± 8.9 vs. 24.0 ± 9.5 for the multi-temporal composite of 2013, 2014 and 2015). This indicates that global differences in soil moisture and land management have been corrected for. As a result, an improved spatial representation of soil parameters can be retrieved from the composite data. Spatial distribution of the correction factors and analysis of the spatial variability of all images, however, indicate that non-linear, short-term differences like variation in soil moisture and land management largely influence the result of the multi-temporal composite. Quantification and attribution of those factors will be required in the future to allow correcting for them. Full article
(This article belongs to the Special Issue Remote Sensing Applied to Soils: From Ground to Space)
Show Figures

Graphical abstract

24 pages, 8315 KiB  
Article
Generic Methodology for Field Calibration of Nacelle-Based Wind Lidars
by Antoine Borraccino *,†, Michael Courtney and Rozenn Wagner
1 DTU Wind Energy, Technical University of Denmark, Kongens Lyngby 2800, Denmark
Current address: Risø Campus, Frederiksborgvej 399, Roskilde 4000, Denmark
Remote Sens. 2016, 8(11), 907; https://doi.org/10.3390/rs8110907 - 2 Nov 2016
Cited by 15 | Viewed by 6978
Abstract
Nacelle-based Doppler wind lidars have shown promising capabilities to assess power performance, detect yaw misalignment or perform feed-forward control. The power curve application requires uncertainty assessment. Traceable measurements and uncertainties of nacelle-based wind lidars can be obtained through a methodology applicable to any [...] Read more.
Nacelle-based Doppler wind lidars have shown promising capabilities to assess power performance, detect yaw misalignment or perform feed-forward control. The power curve application requires uncertainty assessment. Traceable measurements and uncertainties of nacelle-based wind lidars can be obtained through a methodology applicable to any type of existing and upcoming nacelle lidar technology. The generic methodology consists in calibrating all the inputs of the wind field reconstruction algorithms of a lidar. These inputs are the line-of-sight velocity and the beam position, provided by the geometry of the scanning trajectory and the lidar inclination. The line-of-sight velocity is calibrated in atmospheric conditions by comparing it to a reference quantity based on classic instrumentation such as cup anemometers and wind vanes. The generic methodology was tested on two commercially developed lidars, one continuous wave and one pulsed systems, and provides consistent calibration results: linear regressions show a difference of ∼0.5% between the lidar-measured and reference line-of-sight velocities. A comprehensive uncertainty procedure propagates the reference uncertainty to the lidar measurements. At a coverage factor of two, the estimated line-of-sight velocity uncertainty ranges from 3.2% at 3 m · s 1 to 1.9% at 16 m · s 1 . Most of the line-of-sight velocity uncertainty originates from the reference: the cup anemometer uncertainty accounts for ∼90% of the total uncertainty. The propagation of uncertainties to lidar-reconstructed wind characteristics can use analytical methods in simple cases, which we demonstrate through the example of a two-beam system. The newly developed calibration methodology allows robust evaluation of a nacelle lidar’s performance and uncertainties to be established. Calibrated nacelle lidars may consequently be further used for various wind turbine applications in confidence. Full article
(This article belongs to the Special Issue Remote Sensing of Wind Energy)
Show Figures

Graphical abstract

16 pages, 19403 KiB  
Article
Towards Slow-Moving Landslide Monitoring by Integrating Multi-Sensor InSAR Time Series Datasets: The Zhouqu Case Study, China
by Qian Sun 1, Jun Hu 2,*, Lei Zhang 3 and Xiaoli Ding 3
1 College of Resources and Environmental Science, Hunan Normal University, Changsha 410081, China
2 School of Geosciences and Info-Physics, Central South University, Changsha 410083, China
3 Department of Land Surveying and Geo-Informatics, The Hong Kong Polytechnic University, Hong Kong 999077, China
Remote Sens. 2016, 8(11), 908; https://doi.org/10.3390/rs8110908 - 2 Nov 2016
Cited by 71 | Viewed by 8235
Abstract
Although the past few decades have witnessed the great development of Synthetic Aperture Radar Interferometry (InSAR) technology in the monitoring of landslides, such applications are limited by geometric distortions and ambiguity of 1D Line-Of-Sight (LOS) measurements, both of which are the fundamental weakness [...] Read more.
Although the past few decades have witnessed the great development of Synthetic Aperture Radar Interferometry (InSAR) technology in the monitoring of landslides, such applications are limited by geometric distortions and ambiguity of 1D Line-Of-Sight (LOS) measurements, both of which are the fundamental weakness of InSAR. Integration of multi-sensor InSAR datasets has recently shown its great potential in breaking through the two limits. In this study, 16 ascending images from the Advanced Land Observing Satellite (ALOS) and 18 descending images from the Environmental Satellite (ENVISAT) have been integrated to characterize and to detect the slow-moving landslides in Zhouqu, China between 2008 and 2010. Geometric distortions are first mapped by using the imaging geometric parameters of the used SAR data and public Digital Elevation Model (DEM) data of Zhouqu, which allow the determination of the most appropriate data assembly for a particular slope. Subsequently, deformation rates along respective LOS directions of ALOS ascending and ENVISAT descending tracks are estimated by conducting InSAR time series analysis with a Temporarily Coherent Point (TCP)-InSAR algorithm. As indicated by the geometric distortion results, 3D deformation rates of the Xieliupo slope at the east bank of the Pai-lung River are finally reconstructed by joint exploiting of the LOS deformation rates from cross-heading datasets based on the surface–parallel flow assumption. It is revealed that the synergistic results of ALOS and ENVISAT datasets provide a more comprehensive understanding and monitoring of the slow-moving landslides in Zhouqu. Full article
(This article belongs to the Special Issue Multi-Sensor and Multi-Data Integration in Remote Sensing)
Show Figures

Graphical abstract

16 pages, 11597 KiB  
Article
Hyperspectral Reflectance Anisotropy Measurements Using a Pushbroom Spectrometer on an Unmanned Aerial Vehicle—Results for Barley, Winter Wheat, and Potato
by Peter P. J. Roosjen *, Juha M. Suomalainen, Harm M. Bartholomeus and Jan G. P. W. Clevers
Laboratory of Geo-Information Science and Remote Sensing, Wageningen University & Research, Droevendaalsesteeg 3, 6708 PB Wageningen, The Netherlands
Remote Sens. 2016, 8(11), 909; https://doi.org/10.3390/rs8110909 - 2 Nov 2016
Cited by 36 | Viewed by 13981
Abstract
Reflectance anisotropy is a signal that contains information on the optical and structural properties of a surface and can be studied by performing multi-angular reflectance measurements that are often done using cumbersome goniometric measurements. In this paper we describe an innovative and fast [...] Read more.
Reflectance anisotropy is a signal that contains information on the optical and structural properties of a surface and can be studied by performing multi-angular reflectance measurements that are often done using cumbersome goniometric measurements. In this paper we describe an innovative and fast method where we use a hyperspectral pushbroom spectrometer mounted on a multirotor unmanned aerial vehicle (UAV) to perform such multi-angular measurements. By hovering the UAV above a surface while rotating it around its vertical axis, we were able to sample the reflectance anisotropy within the field of view of the spectrometer, covering all view azimuth directions up to a 30° view zenith angle. We used this method to study the reflectance anisotropy of barley, potato, and winter wheat at different growth stages. The reflectance anisotropy patterns of the crops were interpreted by analysis of the parameters obtained by fitting of the Rahman-Pinty-Verstraete (RPV) model at a 5-nm interval in the 450–915 nm range. To demonstrate the results of our method, we firstly present measurements of barley and winter wheat at two different growth stages. On the first measuring day, barley and winter wheat had structurally comparable canopies and displayed similar anisotropic reflectance patterns. On the second measuring day the anisotropy of crops differed significantly due to the crop-specific development of grain heads in the top layer of their canopies. Secondly, we show how the anisotropy is reduced for a potato canopy when it grows from an open row structure to a closed canopy. In this case, especially the backward scattering intensity was strongly diminished due to the decrease in shadowing effects that were caused by the potato rows that were still present on the first measuring day. The results of this study indicate that the presented method is capable of retrieving anisotropic reflectance characteristics of vegetation canopies and that it is a feasible alternative for field goniometer measurements. Full article
Show Figures

Graphical abstract

26 pages, 14903 KiB  
Article
Vegetation Responses to Climate Variability in the Northern Arid to Sub-Humid Zones of Sub-Saharan Africa
by Khaldoun Rishmawi 1, Stephen D. Prince 1,* and Yongkang Xue 2
1 Department of Geographical Sciences, University of Maryland, College Park, MD 20782, USA
2 Department of Geography, University of California-Los Angeles, Los Angeles, CA 90095, USA
Remote Sens. 2016, 8(11), 910; https://doi.org/10.3390/rs8110910 - 2 Nov 2016
Cited by 51 | Viewed by 8965
Abstract
In water limited environments precipitation is often considered the key factor influencing vegetation growth and rates of development. However; other climate variables including temperature; humidity; the frequency and intensity of precipitation events are also known to affect productivity; either directly by changing photosynthesis [...] Read more.
In water limited environments precipitation is often considered the key factor influencing vegetation growth and rates of development. However; other climate variables including temperature; humidity; the frequency and intensity of precipitation events are also known to affect productivity; either directly by changing photosynthesis and transpiration rates or indirectly by influencing water availability and plant physiology. The aim here is to quantify the spatiotemporal patterns of vegetation responses to precipitation and to additional; relevant; meteorological variables. First; an empirical; statistical analysis of the relationship between precipitation and the additional meteorological variables and a proxy of vegetation productivity (the Normalized Difference Vegetation Index; NDVI) is reported and; second; a process-oriented modeling approach to explore the hydrologic and biophysical mechanisms to which the significant empirical relationships might be attributed. The analysis was conducted in Sub-Saharan Africa; between 5 and 18°N; for a 25-year period 1982–2006; and used a new quasi-daily Advanced Very High Resolution Radiometer (AVHRR) dataset. The results suggest that vegetation; particularly in the wetter areas; does not always respond directly and proportionately to precipitation variation; either because of the non-linearity of soil moisture recharge in response to increases in precipitation; or because variations in temperature and humidity attenuate the vegetation responses to changes in water availability. We also find that productivity; independent of changes in total precipitation; is responsive to intra-annual precipitation variation. A significant consequence is that the degree of correlation of all the meteorological variables with productivity varies geographically; so no one formulation is adequate for the entire region. Put together; these results demonstrate that vegetation responses to meteorological variation are more complex than an equilibrium relationship between precipitation and productivity. In addition to their intrinsic interest; the findings have important implications for detection of anthropogenic dryland degradation (desertification); for which the effects of natural fluctuations in meteorological variables must be controlled in order to reveal non-meteorological; including anthropogenic; degradation. Full article
(This article belongs to the Special Issue Remote Sensing of Land Degradation and Drivers of Change)
Show Figures

Graphical abstract

18 pages, 8339 KiB  
Article
The Use of C-/X-Band Time-Gapped SAR Data and Geotechnical Models for the Study of Shanghai’s Ocean-Reclaimed Lands through the SBAS-DInSAR Technique
by Antonio Pepe 1, Manuela Bonano 1, Qing Zhao 2,3,4,*, Tianliang Yang 5,6 and Hanmei Wang 5,6
1 Institute for Electromagnetic Sensing of the Environment, Italian National Research Council, Via Diocleziano 328, Napoli 80124, Italy
2 Key Laboratory of Geographical Information Science, Ministry of Education, East China Normal University, Shanghai 200241, China
3 School of Geographic Sciences, East China Normal University, Shanghai 200241, China
4 Joint Laboratory for Environmental Remote Sensing and Data Assimilation, East China Normal University, Shanghai 200062, China
5 Key Laboratory of Land Subsidence Monitoring and Prevention, Ministry of Land and Resources, Shanghai 200072, China
6 Shanghai Institute of Geological Survey, Shanghai 200072, China
Remote Sens. 2016, 8(11), 911; https://doi.org/10.3390/rs8110911 - 2 Nov 2016
Cited by 71 | Viewed by 7176
Abstract
In this work, we investigate the temporal evolution of ground deformation affecting the ocean-reclaimed lands of the Shanghai (China) megacity, from 2007 to 2016, by applying the Differential Synthetic Aperture Radar Interferometry (DInSAR) technique known as the Small BAseline Subset (SBAS) algorithm. For [...] Read more.
In this work, we investigate the temporal evolution of ground deformation affecting the ocean-reclaimed lands of the Shanghai (China) megacity, from 2007 to 2016, by applying the Differential Synthetic Aperture Radar Interferometry (DInSAR) technique known as the Small BAseline Subset (SBAS) algorithm. For the analysis, we exploited two sets of non-time-overlapped synthetic aperture radar (SAR) data, acquired from 2007 to 2010, by the ASAR/ENVISAT (C-band) instrument, and from 2014 to 2016 by the X-band COSMO-SkyMed (CSK) sensors. The long time gap (of about three years) existing between the available C- and X-band datasets made the generation of unique displacement time-series more difficult. Nonetheless, this problem was successfully solved by benefiting from knowledge of time-dependent geotechnical models, which describe the temporal evolution of the expected deformation affecting Shanghai’s ocean-reclaimed platforms. The combined ENVISAT/CSK (vertical) deformation time-series were analyzed to gain insight into the future evolution of displacement signals within the investigated area. As an outcome, we find that ocean-reclaimed lands in Shanghai experienced, between 2007 and 2016, average cumulative (vertical) displacements extending down to 25 centimeters. Full article
(This article belongs to the Special Issue Multi-Sensor and Multi-Data Integration in Remote Sensing)
Show Figures

Graphical abstract

14 pages, 1938 KiB  
Article
Assessment of Mining Extent and Expansion in Myanmar Based on Freely-Available Satellite Imagery
by Katherine J. LaJeunesse Connette 1,2,*, Grant Connette 1, Asja Bernd 2,3, Paing Phyo 2,4, Kyaw Htet Aung 2,4, Ye Lin Tun 2,4, Zaw Min Thein 2, Ned Horning 5, Peter Leimgruber 1 and Melissa Songer 1
1 Smithsonian Conservation Biology Institute, Conservation Ecology Center, 1500 Remount Rd., Front Royal, VA 22630, USA
2 EcoDev/ALARM, Kamaryut Township, Yangon 11041, Myanmar
3 Department of Biogeography, University of Bayreuth, Universitaetsstrasse 30, Bayreuth 95447, Germany
4 One Map Myanmar, Center for Development and the Environment, University of Bern, 18D Sein Lei Yeik Thar Street, Yankin Township, Yangon 11081, Myanmar
5 American Museum of Natural History, New York, NY 10024, USA
Remote Sens. 2016, 8(11), 912; https://doi.org/10.3390/rs8110912 - 3 Nov 2016
Cited by 56 | Viewed by 14350
Abstract
Using freely-available data and open-source software, we developed a remote sensing methodology to identify mining areas and assess recent mining expansion in Myanmar. Our country-wide analysis used Landsat 8 satellite data from a select number of mining areas to create a raster layer [...] Read more.
Using freely-available data and open-source software, we developed a remote sensing methodology to identify mining areas and assess recent mining expansion in Myanmar. Our country-wide analysis used Landsat 8 satellite data from a select number of mining areas to create a raster layer of potential mining areas. We used this layer to guide a systematic scan of freely-available fine-resolution imagery, such as Google Earth, in order to digitize likely mining areas. During this process, each mining area was assigned a ranking indicating our certainty in correct identification of the mining land use. Finally, we identified areas of recent mining expansion based on the change in albedo, or brightness, between Landsat images from 2002 and 2015. We identified 90,041 ha of potential mining areas in Myanmar, of which 58% (52,312 ha) was assigned high certainty, 29% (26,251 ha) medium certainty, and 13% (11,478 ha) low certainty. Of the high-certainty mining areas, 62% of bare ground was disturbed (had a large increase in albedo) since 2002. This four-month project provides the first publicly-available database of mining areas in Myanmar, and it demonstrates an approach for large-scale assessment of mining extent and expansion based on freely-available data. Full article
Show Figures

Graphical abstract

10 pages, 2752 KiB  
Technical Note
Radiological Assessment on Interest Areas on the Sellafield Nuclear Site via Unmanned Aerial Vehicle
by Peter G. Martin 1,*, James Moore 2, John S. Fardoulis 1, Oliver D. Payton 1 and Thomas B. Scott 1
1 Interface Analysis Centre, School of Physics, HH Wills Physics Laboratory, University of Bristol, Tyndall Avenue, Bristol BS8 1TL, UK
2 Sellafield Ltd., Sellafield, Seascale, Cumbria CA20 1PG, UK
Remote Sens. 2016, 8(11), 913; https://doi.org/10.3390/rs8110913 - 3 Nov 2016
Cited by 24 | Viewed by 7446
Abstract
The Sellafield nuclear plant is a 3 km2 site in north-west Cumbria, England, with a long and distinguished history of nuclear power generation, reprocessing and waste storage—with a current working emphasis on decommissioning and clean-up. Important to this safe, efficient and complete [...] Read more.
The Sellafield nuclear plant is a 3 km2 site in north-west Cumbria, England, with a long and distinguished history of nuclear power generation, reprocessing and waste storage—with a current working emphasis on decommissioning and clean-up. Important to this safe, efficient and complete remediation of the site, routine monitoring is essential in a wide range of on-site environments and structures to attain: (i) accurately map the evolving distribution of radiation with the best possible accuracy (sensitivity and spatial resolution); in addition to (ii) the contributing radionuclide species and therefore the radiological and chemo-toxicity risk. This work presents the trial deployment of an unmanned aerial vehicle equipped with a lightweight radiation detection system as a novel tool for the assessment of radioactivity at a number of test-sites on the nuclear licenced site. Through the use of this system, it was possible to determine the existence of anthropogenically present radiation at selected facilities. Such a system has been proven to be highly accurate (spatially) and precise (attribution of contamination species observed) within the challenging site environments, capable of measuring and mapping contamination over both high and low dose-rate areas. Full article
Show Figures

Graphical abstract

15 pages, 7412 KiB  
Article
Spatial Correlation of Satellite-Derived PM2.5 with Hospital Admissions for Respiratory Diseases
by Ching-Ju Liu 1,*, Chian-Yi Liu 2,3,*, Ngoc Thi Mong 2 and Charles C. K. Chou 4
1 Department of Audiology and Speech Language Pathology, Mackay Medical College, New Taipei City 25245, Taiwan
2 Center for Space and Remote Sensing Research, National Central University, Taoyuan 32001, Taiwan
3 Department of Atmospheric Sciences, National Central University, Taoyuan 32001, Taiwan
4 Research Center for Environmental Changes, Academia Sinica, Taipei 11529, Taiwan
Remote Sens. 2016, 8(11), 914; https://doi.org/10.3390/rs8110914 - 3 Nov 2016
Cited by 18 | Viewed by 7005
Abstract
Respiratory diseases, particularly allergic rhinitis, are spatially and temporally correlated with the ground PM2.5 level. A study of the correlation between the two factors should therefore account for spatiotemporal variations. Satellite observation has the advantage of wide spatial coverage over pin-point style [...] Read more.
Respiratory diseases, particularly allergic rhinitis, are spatially and temporally correlated with the ground PM2.5 level. A study of the correlation between the two factors should therefore account for spatiotemporal variations. Satellite observation has the advantage of wide spatial coverage over pin-point style ground-based in situ monitoring stations. Therefore, the current study used both ground measurement and satellite data sets to investigate the spatial and temporal correlation of satellite-derived PM2.5 with respiratory diseases. This study used 4-year satellite data and PM2.5 levels of the period at eight stations in Taiwan to obtain the spatial and temporal relationship between aerosol optical depth (AOD) and PM2.5. The AOD-PM2.5 model was further examined using the cross-validation (CV) technique and was found to have high reliability compared with similar models. The model was used to obtain satellite-derived PM2.5 levels and to analyze the hospital admissions for allergic rhinitis in 2008. The results suggest that adults (18–65 years) and children (3–18 years) are the most vulnerable groups to the effect of PM2.5 compared with infants and elderly people. This result may be because the two affected age groups spend longer time outdoors. This result may also be attributed to the long-range PM2.5 transport from upper stream locations and the atmospheric circulation patterns, which are significant in spring and fall. The results of the current study suggest that additional environmental factors that might be associated with respiratory diseases should be considered in future studies. Full article
(This article belongs to the Special Issue Earth Observations for a Better Future Earth)
Show Figures

Graphical abstract

18 pages, 6102 KiB  
Article
Crop Mapping Using PROBA-V Time Series Data at the Yucheng and Hongxing Farm in China
by Xin Zhang, Miao Zhang, Yang Zheng and Bingfang Wu *
Key Laboratory of Digital Earth Science, Institute of Remote Sensing and Digital Earth, Chinese Academy of Sciences, Olympic Village Science Park, W. Beichen Road, Beijing 100101, China
Remote Sens. 2016, 8(11), 915; https://doi.org/10.3390/rs8110915 - 3 Nov 2016
Cited by 28 | Viewed by 9009
Abstract
PROBA-V is a new global vegetation monitoring satellite launched in the second quarter of 2013 that provides data with a 100 m to 1 km spatial resolution and a daily to 10-day temporal resolution in the visible and near infrared (VNIR) bands. A [...] Read more.
PROBA-V is a new global vegetation monitoring satellite launched in the second quarter of 2013 that provides data with a 100 m to 1 km spatial resolution and a daily to 10-day temporal resolution in the visible and near infrared (VNIR) bands. A major mission of the PROBA-V satellite is global agriculture monitoring, in which the accuracy of crop mapping plays a key role. In countries such as China, crop fields are typically small, in assorted shapes and with various management approaches, which deem traditional methods of crop identification ineffective, and accuracy is highly dependent on image resolution and acquisition time. The five-day temporal and 100 m spatial resolution PROBA-V data make it possible to automatically identify crops using time series phenological information. This paper takes advantage of the improved spatial and temporal resolution of the PROBA-V data, to map crops at the Yucheng site in Shandong Province and the Hongxing farm in Heilongjiang province of China. First, the Swets filter algorithm was employed to eliminate noisy pixels and fill in data gaps on time series data during the growing season. Then, the crops are classified based on the Iterative Self-Organizing Data Analysis Technique (ISODATA) clustering, the maximum likelihood method (MLC) and similarity analysis. The mapping results were validated using field-collected crop type polygons and high resolution crop maps based on GaoFen-1 satellite (GF-1) data in 16 m resolution. Our study showed that, for the Yucheng site, the cropping system is simple, mainly dominated by winter wheat–maize rotation. The overall accuracy of crop identification was 73.39% which was slightly better than the result derived from MODIS data. For the Hongxing farm, the cropping system is more complex (i.e., more than three types of crops were planted). The overall accuracy of the crop mapping by PROBA-V was 73.29% which was significantly higher than the MODIS product (46.81%). This study demonstrates that time series PROBA-V data can serve as a useful source for reliable crop identification and area estimation. The high revisiting frequency and global coverage of the PROBA-V data show good potential for future global crop mapping and agricultural monitoring. Full article
Show Figures

Figure 1

14 pages, 2984 KiB  
Article
Impacts of Temporal-Spatial Variant Background Ionosphere on Repeat-Track GEO D-InSAR System
by Cheng Hu 1, Yuanhao Li 1, Xichao Dong 1,*, Chang Cui 1 and Teng Long 1,2
1 School of Information and Electronics, Beijing Institute of Technology, Beijing 100081, China
2 Beijing Key Laboratory of Embedded Real-Time Information Processing Technology, Beijing 100081, China
Remote Sens. 2016, 8(11), 916; https://doi.org/10.3390/rs8110916 - 4 Nov 2016
Cited by 26 | Viewed by 4510
Abstract
An L band geosynchronous synthetic aperture radar (GEO SAR) differential interferometry system (D-InSAR) will be obviously impacted by the background ionosphere, which will give rise to relative image shifts and decorrelations of the SAR interferometry (InSAR) pair, and induce the interferometric phase screen [...] Read more.
An L band geosynchronous synthetic aperture radar (GEO SAR) differential interferometry system (D-InSAR) will be obviously impacted by the background ionosphere, which will give rise to relative image shifts and decorrelations of the SAR interferometry (InSAR) pair, and induce the interferometric phase screen errors in interferograms. However, the background ionosphere varies within the long integration time (hundreds to thousands of seconds) and the extensive imaging scene (1000 km levels) of GEO SAR. As a result, the conventional temporal-spatial invariant background ionosphere model (i.e., frozen model) used in Low Earth Orbit (LEO) SAR is no longer valid. To address the issue, we firstly construct a temporal-spatial background ionosphere variation model, and then theoretically analyze its impacts, including relative image shifts and the decorrelation of the GEO InSAR pair, and the interferometric phase screen errors, on the repeat-track GEO D-InSAR processing. The related impacts highly depend on the background ionosphere parameters (constant total electron content (TEC) component, and the temporal first-order and the temporal second-order derivatives of TEC with respect to the azimuth time), signal bandwidth, and integration time. Finally, the background ionosphere data at Isla Guadalupe Island (29.02°N, 118.27°W) on 7–8 October 2013 is employed for validating the aforementioned analysis. Under the selected background ionosphere dataset, the temporal-spatial background ionosphere variation can give rise to a relative azimuth shift of dozens of meters at most, and even the complete decorrelation in the InSAR pair. Moreover, the produced interferometric phase screen error corresponds to a deformation measurement error of more than 0.2 m at most, even in a not severely impacted area. Full article
Show Figures

Graphical abstract

24 pages, 5228 KiB  
Article
The Effects of Spatiotemporal Changes in Land Degradation on Ecosystem Services Values in Sanjiang Plain, China
by Fengqin Yan 1,2,3, Shuwen Zhang 1,*, Xingtu Liu 1, Dan Chen 1,4, Jing Chen 4,5, Kun Bu 1, Jiuchun Yang 1 and Liping Chang 1
1 Northeast Institute of Geography and Agroecology, Chinese Academy of Sciences, Changchun 130102, China
2 University of Chinese Academy of Sciences, Beijing 100049, China
3 International Center for Climate and Global Change Research and School of Forestry and Wildlife Sciences, Auburn University, Auburn, AL 36849, USA
4 College of Earth Science, Jilin University, Changchun 130061, China
5 College of Arts & Sciences, Beijing Union University, Beijing 100083, China
Remote Sens. 2016, 8(11), 917; https://doi.org/10.3390/rs8110917 - 4 Nov 2016
Cited by 55 | Viewed by 6908
Abstract
Sanjiang Plain has undergone dramatic land degradation since the 1950s, which has caused negative effects on ecosystems services and sustainability. In this study, we used trajectory analysis as well as the Lorenz curve, Gini coefficient and relative land use suitability index (R) to [...] Read more.
Sanjiang Plain has undergone dramatic land degradation since the 1950s, which has caused negative effects on ecosystems services and sustainability. In this study, we used trajectory analysis as well as the Lorenz curve, Gini coefficient and relative land use suitability index (R) to analyze spatiotemporal changes of land degradation from 1954 to 2013 and to make a preliminary estimation of the role of human activities in observed environmental changes using a five-stage LULC data. This study also explored the effect of land degradation on the values and structure of ecosystem services. Our results indicated that more than 70% of marsh area originally present in the study area has been lost, whereas less than 30% was preserved. Dry farmland and paddy increased rapidly at the expense of marsh, forest and grassland. Land use structure became more unsuitable during the past 60 years. Compared with natural factors, human activities played a dominant role (89.67%) in these changes. This dramatic land degradation caused the significant loss of ecosystem services values and the changes in the structure of ecosystem services. These results confirmed the effectiveness of combining temporal trajectory analysis, the Lorenz curve/Gini coefficient and the R index in analyzing spatiotemporal changes in progressive land degradation. Also, these findings highlight the necessity of separating dry farmland from paddy when studying land degradation changes and the effects on ecosystem services in regions where dry farmland has often been converted to paddy. Full article
(This article belongs to the Special Issue Remote Sensing of Land Degradation and Drivers of Change)
Show Figures

Graphical abstract

29 pages, 4846 KiB  
Opinion
Trying to Break New Ground in Aerial Archaeology
by Geert Verhoeven 1,* and Christopher Sevara 2
1 Ludwig Boltzmann Institute for Archaeological Prospection & Virtual Archaeology (LBI ArchPro), Franz-Klein-Gasse 1/III, Wien A-1190, Austria
2 Department of Prehistoric and Historical Archaeology, University of Vienna, Franz-Klein-Gasse 1/III, Wien A-1190, Austria
Remote Sens. 2016, 8(11), 918; https://doi.org/10.3390/rs8110918 - 4 Nov 2016
Cited by 25 | Viewed by 10251
Abstract
Aerial reconnaissance continues to be a vital tool for landscape-oriented archaeological research. Although a variety of remote sensing platforms operate within the earth’s atmosphere, the majority of aerial archaeological information is still derived from oblique photographs collected during observer-directed reconnaissance flights, a prospection [...] Read more.
Aerial reconnaissance continues to be a vital tool for landscape-oriented archaeological research. Although a variety of remote sensing platforms operate within the earth’s atmosphere, the majority of aerial archaeological information is still derived from oblique photographs collected during observer-directed reconnaissance flights, a prospection approach which has dominated archaeological aerial survey for the past century. The resulting highly biased imagery is generally catalogued in sub-optimal (spatial) databases, if at all, after which a small selection of images is orthorectified and interpreted. For decades, this has been the standard approach. Although many innovations, including digital cameras, inertial units, photogrammetry and computer vision algorithms, geographic(al) information systems and computing power have emerged, their potential has not yet been fully exploited in order to re-invent and highly optimise this crucial branch of landscape archaeology. The authors argue that a fundamental change is needed to transform the way aerial archaeologists approach data acquisition and image processing. By addressing the very core concepts of geographically biased aerial archaeological photographs and proposing new imaging technologies, data handling methods and processing procedures, this paper gives a personal opinion on how the methodological components of aerial archaeology, and specifically aerial archaeological photography, should evolve during the next decade if developing a more reliable record of our past is to be our central aim. In this paper, a possible practical solution is illustrated by outlining a turnkey aerial prospection system for total coverage survey together with a semi-automated back-end pipeline that takes care of photograph correction and image enhancement as well as the management and interpretative mapping of the resulting data products. In this way, the proposed system addresses one of many bias issues in archaeological research: the bias we impart to the visual record as a result of selective coverage. While the total coverage approach outlined here may not altogether eliminate survey bias, it can vastly increase the amount of useful information captured during a single reconnaissance flight while mitigating the discriminating effects of observer-based, on-the-fly target selection. Furthermore, the information contained in this paper should make it clear that with current technology it is feasible to do so. This can radically alter the basis for aerial prospection and move landscape archaeology forward, beyond the inherently biased patterns that are currently created by airborne archaeological prospection. Full article
(This article belongs to the Special Issue Archaeological Prospecting and Remote Sensing)
Show Figures

Graphical abstract

23 pages, 3558 KiB  
Article
A Spectral-Texture Kernel-Based Classification Method for Hyperspectral Images
by Yi Wang *,†, Yan Zhang and Haiwei Song
1 Institute of Geophysics and Geomatics, China University of Geosciences, Wuhan 430074, China
These authors contributed equally to this work.
Remote Sens. 2016, 8(11), 919; https://doi.org/10.3390/rs8110919 - 5 Nov 2016
Cited by 14 | Viewed by 6891
Abstract
Classification of hyperspectral images always suffers from high dimensionality and very limited labeled samples. Recently, the spectral-spatial classification has attracted considerable attention and can achieve higher classification accuracy and smoother classification maps. In this paper, a novel spectral-spatial classification method for hyperspectral images [...] Read more.
Classification of hyperspectral images always suffers from high dimensionality and very limited labeled samples. Recently, the spectral-spatial classification has attracted considerable attention and can achieve higher classification accuracy and smoother classification maps. In this paper, a novel spectral-spatial classification method for hyperspectral images by using kernel methods is investigated. For a given hyperspectral image, the principle component analysis (PCA) transform is first performed. Then, the first principle component of the input image is segmented into non-overlapping homogeneous regions by using the entropy rate superpixel (ERS) algorithm. Next, the local spectral histogram model is applied to each homogeneous region to obtain the corresponding texture features. Because this step is performed within each homogenous region, instead of within a fixed-size image window, the obtained local texture features in the image are more accurate, which can effectively benefit the improvement of classification accuracy. In the following step, a contextual spectral-texture kernel is constructed by combining spectral information in the image and the extracted texture information using the linearity property of the kernel methods. Finally, the classification map is achieved by the support vector machines (SVM) classifier using the proposed spectral-texture kernel. Experiments on two benchmark airborne hyperspectral datasets demonstrate that our method can effectively improve classification accuracies, even though only a very limited training sample is available. Specifically, our method can achieve from 8.26% to 15.1% higher in terms of overall accuracy than the traditional SVM classifier. The performance of our method was further compared to several state-of-the-art classification methods of hyperspectral images using objective quantitative measures and a visual qualitative evaluation. Full article
Show Figures

Graphical abstract

14 pages, 5407 KiB  
Article
A New Empirical Model for Radar Scattering from Bare Soil Surfaces
by Nicolas Baghdadi 1,*, Mohammad Choker 1, Mehrez Zribi 2, Mohammad El Hajj 1, Simonetta Paloscia 3, Niko E. C. Verhoest 4, Hans Lievens 4,5, Frederic Baup 2 and Francesco Mattia 6
1 IRSTEA, UMR TETIS, 500 rue François Breton, F-34093 Montpellier CEDEX 5, France
2 CESBIO, 18 av. Edouard Belin, bpi 2801, 31401 Toulouse CEDEX 9, France
3 CNR-IFAC, via Madonna del Piano, 10, 50019 Florence, Italy
4 Laboratory of Hydrology and Water Management, Ghent University, B-9000 Ghent, Belgium
5 Global Modeling and Assimilation Office, NASA Goddard Space Flight Center, Greenbelt, MD 20771, USA
6 CNR-ISSIA, via Amendola 122/D, 70126 Bari, Italy
Remote Sens. 2016, 8(11), 920; https://doi.org/10.3390/rs8110920 - 7 Nov 2016
Cited by 99 | Viewed by 9230
Abstract
The objective of this paper is to propose a new semi-empirical radar backscattering model for bare soil surfaces based on the Dubois model. A wide dataset of backscattering coefficients extracted from synthetic aperture radar (SAR) images and in situ soil surface parameter measurements [...] Read more.
The objective of this paper is to propose a new semi-empirical radar backscattering model for bare soil surfaces based on the Dubois model. A wide dataset of backscattering coefficients extracted from synthetic aperture radar (SAR) images and in situ soil surface parameter measurements (moisture content and roughness) is used. The retrieval of soil parameters from SAR images remains challenging because the available backscattering models have limited performances. Existing models, physical, semi-empirical, or empirical, do not allow for a reliable estimate of soil surface geophysical parameters for all surface conditions. The proposed model, developed in HH, HV, and VV polarizations, uses a formulation of radar signals based on physical principles that are validated in numerous studies. Never before has a backscattering model been built and validated on such an important dataset as the one proposed in this study. It contains a wide range of incidence angles (18°–57°) and radar wavelengths (L, C, X), well distributed, geographically, for regions with different climate conditions (humid, semi-arid, and arid sites), and involving many SAR sensors. The results show that the new model shows a very good performance for different radar wavelengths (L, C, X), incidence angles, and polarizations (RMSE of about 2 dB). This model is easy to invert and could provide a way to improve the retrieval of soil parameters. Full article
Show Figures

Graphical abstract

16 pages, 2150 KiB  
Article
Seasonal Habitat Patterns of Japanese Common Squid (Todarodes Pacificus) Inferred from Satellite-Based Species Distribution Models
by Irene D. Alabia 1,*, Mariko Dehara 2, Sei-Ichi Saitoh 1 and Toru Hirawake 3
1 Arctic Research Center, Hokkaido University, N21 W11 Kita-Ku, Sapporo 001-0021, Japan
2 Remote sensing technology center of Japan, Tokyu Reit Toranomon Bldg. 3F 3-17-1 Toranomon, Minato-ku 105-0001, Tokyo, Japan
3 Laboratory of Marine Environment and Resource Sensing, Faculty of Fisheries Sciences, Hokkaido University, 3-1-1 Minato-cho, Hakodate 041-8611, Hokkaido, Japan
Remote Sens. 2016, 8(11), 921; https://doi.org/10.3390/rs8110921 - 5 Nov 2016
Cited by 26 | Viewed by 8134
Abstract
The understanding of the spatio-temporal distributions of the species habitat in the marine environment is central to effectual resource management and conservation. Here, we examined the potential habitat distributions of Japanese common squid (Todarodes pacificus) in the Sea of Japan during [...] Read more.
The understanding of the spatio-temporal distributions of the species habitat in the marine environment is central to effectual resource management and conservation. Here, we examined the potential habitat distributions of Japanese common squid (Todarodes pacificus) in the Sea of Japan during a four-year period. The seasonal patterns of preferential habitat were inferred from species distribution models, built using squid occurrences detected from night-time visible images and remotely-sensed environmental factors. The predicted squid habitat (i.e., areas with high habitat suitability) revealed strong seasonal variability, characterized by a reduction of potential habitat, confined off of the southern part of the basin during the winter–spring period (December–May). Apparent expansion of preferential habitat occurred during summer–autumn months (June–November), concurrent with the formation of highly suitable habitat patches in certain regions of the Sea of Japan. These habitat distribution patterns were in response to changes in oceanographic conditions and synchronous with seasonal migration of squid. Moreover, the most important variables regulating the spatio-temporal patterns of suitable habitat were sea surface temperature, depth, sea surface height anomaly, and eddy kinetic energy. These variables could affect the habitat distributions through their impacts on growth and survival of squid, local nutrient transport, and the availability of favorable spawning and feeding grounds. Full article
Show Figures

Graphical abstract

20 pages, 10334 KiB  
Article
On the Potential of Robust Satellite Techniques Approach for SPM Monitoring in Coastal Waters: Implementation and Application over the Basilicata Ionian Coastal Waters Using MODIS‐Aqua
by Carmine Di Polito 1, Emanuele Ciancia 1, Irina Coviello 2, David Doxaran 3, Teodosio Lacava 2,*, Nicola Pergola 2, Valeria Satriano 1 and Valerio Tramutoli 1
1 School of Engineering, University of Basilicata, Via dell’Ateneo Lucano 10, Potenza 85100, Italy
2 Institute of Methodologies for Environmental Analysis (IMAA), CNR, C.da S. Loja, Tito Scalo (Pz) 85050, Italy
3 Laboratoire d’Océanographie de Villefranche (LOV), UMR 7093, CNRS/UPMC, Villefranche Sur Mer Cedex 06230, France
Remote Sens. 2016, 8(11), 922; https://doi.org/10.3390/rs8110922 - 5 Nov 2016
Cited by 19 | Viewed by 6077
Abstract
Monitoring river plume dynamics and variations in complex coastal areas can provide useful information to prevent marine environmental damage. In this work, the Robust Satellite Techniques (RST) approach has been implemented and tested on historical series of Aqua Moderate Resolution Imaging Spectroradiometer (MODIS) [...] Read more.
Monitoring river plume dynamics and variations in complex coastal areas can provide useful information to prevent marine environmental damage. In this work, the Robust Satellite Techniques (RST) approach has been implemented and tested on historical series of Aqua Moderate Resolution Imaging Spectroradiometer (MODIS) data to monitor, for the first time, Suspended Particulate Matter (SPM) anomalies associated to river plumes. To this aim, MODIS-Aqua Level 1A data were processed using an atmospheric correction adequate for coastal waters, and SPM daily maps were generated applying an algorithm adapted from literature. The RST approach was then applied to these maps to assess the anomalous presence of SPM. The study area involves the Basilicata region coastal waters (Ionian Sea, South of Italy). A long-time analysis (2003–2015) conducted for the month of December allows us to find that the maximum SPM concentration value was registered in December 2013, when an extreme hydrological event occurred. A short-time analysis was then carried out applying RST to monitor the dynamics of anomalous SPM concentrations. Finally, the most exposed areas, in terms of SPM concentration, were identified. The results obtained in this work showed the RST high potential when used in combination with standard SPM daily maps to better characterize and monitor coastal waters. Full article
Show Figures

Graphical abstract

10 pages, 3248 KiB  
Technical Note
Multi-Sensor SAR Image Registration Based on Object Shape
by Jie Rui 1,2,3, Chao Wang 1,*, Hong Zhang 1 and Fei Jin 3
1 Key Laboratory of Digital Earth Science, Institute of Remote Sensing and Digital Earth, Beijing 100094, China
2 University of Chinese Academy of Science, Beijing 100049, China
3 Zhengzhou Institute of Surveying and Mapping, Zhengzhou 450052, China
Remote Sens. 2016, 8(11), 923; https://doi.org/10.3390/rs8110923 - 5 Nov 2016
Cited by 5 | Viewed by 5058
Abstract
Owing to significant differences in synthetic aperture radar (SAR) images caused by diverse imaging mechanisms and imaging conditions, inconsistent features and relationship correspondences constitute key problems for traditional image registration algorithms. This study presents a novel SAR image registration method based on the [...] Read more.
Owing to significant differences in synthetic aperture radar (SAR) images caused by diverse imaging mechanisms and imaging conditions, inconsistent features and relationship correspondences constitute key problems for traditional image registration algorithms. This study presents a novel SAR image registration method based on the shape information of distinct ground objects, which is obtained via object extraction and morphological operations. We utilize a shape context descriptor to compare the contours of objects and detect invariant control points. The experimental results show that the proposed method can achieve a reliable and stable registration performance for SAR images of different sensors. Full article
Show Figures

Graphical abstract

15 pages, 8095 KiB  
Article
Urban–Rural Contrasts in Central-Eastern European Cities Using a MODIS 4 Micron Time Series
by Monika Tomaszewska 1 and Geoffrey M. Henebry 1,2,*
1 Geospatial Sciences Center of Excellence, South Dakota State University, Brookings, SD 57007, USA
2 Department of Natural Resource Management, South Dakota State University, Brookings, SD 57007, USA
Remote Sens. 2016, 8(11), 924; https://doi.org/10.3390/rs8110924 - 6 Nov 2016
Cited by 7 | Viewed by 5579
Abstract
A primary impact of urbanization on the local climate is evident in the phenomenon recognized as the Urban Heat Island (UHI) effect. This urban thermal anomaly can increase the health risks of vulnerable populations to heat waves. The surface UHI results from emittance [...] Read more.
A primary impact of urbanization on the local climate is evident in the phenomenon recognized as the Urban Heat Island (UHI) effect. This urban thermal anomaly can increase the health risks of vulnerable populations to heat waves. The surface UHI results from emittance in the longer wavelengths of the thermal infrared; however, there are also urban anomalies that are detectable from radiance in the shorter wavelengths (3–5 micron) of the Middle Infrared (MIR). Radiance in the MIR can penetrate urban haze which frequently obscures urban areas by scattering visible and near infrared radiation. We analyzed seasonal and spatial variations in MIR for three Central European cities from 2003 through 2012 using Moderate Resolution Imaging Spectrometer (MODIS) band 23 (~4 micron) to evaluate whether MIR radiance could be used to characterize heat anomalies associated with urban areas. We examined the seasonality of MIR radiance over urban areas and nearby croplands and found that the urban MIR anomalies varied due to time of year: cropland MIR could be larger than urban MIR when there was more exposed soil at planting and harvest times. Further, we compared monthly mean MIR with the Normalized Difference Vegetation Index (NDVI) to analyze contrasts between urban and rural areas. We found that the seasonal dynamic range of the MIR could exceed that of the NDVI. We explored the linkage between meteorological data and MIR radiance and found a range of responses from strong to weak dependence of MIR radiance on maximum temperature and accumulated precipitation. Our results extend the understanding of the anomalous characteristics of urban areas within a rural matrix.
Full article
Show Figures

Graphical abstract

27 pages, 16159 KiB  
Article
Europe’s Green Arteries—A Continental Dataset of Riparian Zones
by Christof J. Weissteiner 1,*, Martin Ickerott 2, Hannes Ott 2, Markus Probeck 2, Gernot Ramminger 2, Nicola Clerici 3, Hans Dufourmont 4 and Ana Maria Ribeiro De Sousa 4
1 Independent consultant
2 GAF AG, Arnulfstrasse 199, D-80634 Munich, Germany
3 Functional and Ecosystem Ecology Unit (EFE) Biology Program, Universidad del Rosario Kr 26 No 63B-48, 111221 Bogotá D.C., Colombia
4 European Environment Agency (EEA), Kongens Nytorv 6, 1050 København K, Denmark
Remote Sens. 2016, 8(11), 925; https://doi.org/10.3390/rs8110925 - 6 Nov 2016
Cited by 40 | Viewed by 8427
Abstract
Riparian zones represent ecotones between terrestrial and aquatic ecosystems and are of utmost importance to biodiversity and ecosystem functions. Modelling/mapping of these valuable and fragile areas is needed for improved ecosystem management, based on an accounting of changes and on monitoring of their [...] Read more.
Riparian zones represent ecotones between terrestrial and aquatic ecosystems and are of utmost importance to biodiversity and ecosystem functions. Modelling/mapping of these valuable and fragile areas is needed for improved ecosystem management, based on an accounting of changes and on monitoring of their functioning over time. In Europe, the main legislative driver behind this goal is the European Commission’s Biodiversity Strategy to 2020, on the one hand aiming at halting biodiversity loss, on the other hand enhancing ecosystem services by 2020, and restoring them as far as is feasible. A model, based on Earth Observation data, including Digital Elevation Models, hydrological, soil, land cover/land use data, and vegetation indices is employed in a multi-modular and stratified approach, based on fuzzy logic and object based image analysis, to delineate potential, observed and actual riparian zones. The approach is designed in an open modular way, allowing future modifications and repeatability. The results represent a first step of a future monitoring and assessment campaign for European riparian zones and their implications on biodiversity and on ecosystem functions and services. Considering the complexity and the enormous extent of the area, covering 39 European countries, including Turkey, the level of detail is unprecedented. Depending on the accounting modus, 0.95%–1.19% of the study area can be attributed as actual riparian area (considering Strahler’s stream orders 3–8, based on the Copernicus EU-Hydro dataset), corresponding to 55,558–69,128 km2. Similarly, depending on the accounting approach, the potential riparian zones cover an area about 3–5 times larger. Land cover/land use in detected riparian areas was mainly of semi-natural characteristics, while the potential riparian areas are predominately covered by agriculture, followed by semi-natural and urban areas. Full article
Show Figures

Graphical abstract

11 pages, 3005 KiB  
Article
Interference Mitigation Achieved with a Reconfigurable Stepped Frequency GPR System
by Raffaele Persico * and Giovanni Leucci
Institute for Archaeological and Monumental Heritage, Via Monteroni, Campus Universitario, 73100 Lecce, Italy
Remote Sens. 2016, 8(11), 926; https://doi.org/10.3390/rs8110926 - 7 Nov 2016
Cited by 9 | Viewed by 5336
Abstract
In this contribution, some possible effects of large band electromagnetic interferences on Ground Penetrating Radar (GPR) data are shown, and a possible way to counteract them is shown, too. The mitigation of the interferences is implemented thanks to a prototypal reconfigurable stepped frequency [...] Read more.
In this contribution, some possible effects of large band electromagnetic interferences on Ground Penetrating Radar (GPR) data are shown, and a possible way to counteract them is shown, too. The mitigation of the interferences is implemented thanks to a prototypal reconfigurable stepped frequency GPR system, that allows to program the integration time of the harmonic tones vs. the frequency. In particular, an algorithm for the measurement of the effects of the interferences in the field (linked to the signal to interference ratio) is proposed and tested vs. experimental data. The paper will show some advantages and some drawbacks of the proposed procedure. Full article
(This article belongs to the Special Issue Radar Systems for the Societal Challenges)
Show Figures

Figure 1

17 pages, 4747 KiB  
Article
Regionalization of Uncovered Agricultural Soils Based on Organic Carbon and Soil Texture Estimations
by Martin Kanning *,†, Bastian Siegmann and Thomas Jarmer
1 Institute of Computer Science, Osnabrück University, Wachsbleiche 27, D-49090 Osnabrück, Germany
These authors contributed equally to this work.
Remote Sens. 2016, 8(11), 927; https://doi.org/10.3390/rs8110927 - 8 Nov 2016
Cited by 29 | Viewed by 7366
Abstract
The determination of soil texture and organic carbon across agricultural areas provides important information to derive soil condition. Precise digital soil maps can help to till agricultural fields with more accuracy, greater cost-efficiency and better environmental protection. In the present study, the laboratory [...] Read more.
The determination of soil texture and organic carbon across agricultural areas provides important information to derive soil condition. Precise digital soil maps can help to till agricultural fields with more accuracy, greater cost-efficiency and better environmental protection. In the present study, the laboratory analysis of sand, silt, clay and soil organic carbon (SOC) content was combined with hyperspectral image data to estimate the distribution of soil texture and SOC across an agricultural area. The aim was to identify regions with similar soil properties and derive uniform soil regions based on this information. Soil parameter data and corresponding laboratory spectra were used to calibrate cross-validated (leave-one-out) partial least squares regression (PLSR) models, resulting in robust models for sand (R2 = 0.77, root-mean-square error (RMSE) = 5.37) and SOC (R2 = 0.89, RMSE = 0.27), as well as moderate models for silt (R2 = 0.62, RMSE = 5.46) and clay (R2 = 0.53, RMSE = 2.39). The regression models were applied to Airborne Imaging Spectrometer for Applications DUAL (aisaDUAL) hyperspectral image data to spatially estimate the concentration of these parameters. Afterwards, a decision tree, based on the Food and Agriculture Organization (FAO) soil texture classification scheme, was developed to determine the soil texture for each pixel of the hyperspectral airborne data. These soil texture regions were further refined with the spatial SOC estimations. The developed method is useful to identify spatial regions with similar soil properties, which can provide a vital information source for an adapted treatment of agricultural fields in terms of the necessary amount of fertilizers or water. The approach can also be adapted to wider regions with a larger sample size to create detailed digital soil maps (DSMs). Further, the presented method should be applied to future hyperspectral satellite missions like Environmental Mapping and Analysis Program (EnMap) and Hyperspectral Infrared Imager (HyspIRI) to cover larger areas in shorter time intervals. Updated DSMs on a regular basis could particularly support precision farming aspects. Full article
(This article belongs to the Special Issue Remote Sensing in Precision Agriculture)
Show Figures

Figure 1

35 pages, 27312 KiB  
Article
A Generic Framework for Assessing the Performance Bounds of Image Feature Detectors
by Shoaib Ehsan 1,*, Adrian F. Clark 1, Ales Leonardis 2, Naveed Ur Rehman 3, Ahmad Khaliq 4, Maria Fasli 1 and Klaus D. McDonald-Maier 1
1 School of Computer Science and Electronic Engineering, University of Essex, Colchester CO4 3SQ, UK
2 School of Computer Science, University of Birmingham, Birmingham B15 2TT, UK
3 Electrical Engineering Department, COMSATS Institute of Information Technology, Islamabad 44000, Pakistan
4 College of Electrical and Mechanical Engineering, National University of Sciences and Technology (NUST), Islamabad 44000, Pakistan
Remote Sens. 2016, 8(11), 928; https://doi.org/10.3390/rs8110928 - 9 Nov 2016
Cited by 4 | Viewed by 4803
Abstract
Since local feature detection has been one of the most active research areas in computer vision during the last decade and has found wide range of applications (such as matching and registration of remotely sensed image data), a large number of detectors have [...] Read more.
Since local feature detection has been one of the most active research areas in computer vision during the last decade and has found wide range of applications (such as matching and registration of remotely sensed image data), a large number of detectors have been proposed. The interest in feature-based applications continues to grow and has thus rendered the task of characterizing the performance of various feature detection methods an important issue in vision research. Inspired by the good practices of electronic system design, a generic framework based on the repeatability measure is presented in this paper that allows assessment of the upper and lower bounds of detector performance and finds statistically significant performance differences between detectors as a function of image transformation amount by introducing a new variant of McNemar’s test in an effort to design more reliable and effective vision systems. The proposed framework is then employed to establish operating and guarantee regions for several state-of-the art detectors and to identify their statistical performance differences for three specific image transformations: JPEG compression, uniform light changes and blurring. The results are obtained using a newly acquired, large image database (20,482 images) with 539 different scenes. These results provide new insights into the behavior of detectors and are also useful from the vision systems design perspective. Finally, results for some local feature detectors are presented for a set of remote sensing images to showcase the potential and utility of this framework for remote sensing applications in general. Full article
Show Figures

Graphical abstract

15 pages, 701 KiB  
Article
Sparsity-Inducing Super-Resolution Passive Radar Imaging with Illuminators of Opportunity
by Shunsheng Zhang 1,*, Yongqiang Zhang 1, Wen-Qin Wang 1, Cheng Hu 2 and Tat Soon Yeo 3
1 Research Institute of Electronic Science and Technology, University of Electronic Science and Technology of China, Chengdu 611731, China
2 Electronics and Information School, Beijing Institute of Technology, Beijing 100081, China
3 Department of Electrical and Computer Engineering, National University of Singapore, Singapore 117576, Singapore
Remote Sens. 2016, 8(11), 929; https://doi.org/10.3390/rs8110929 - 8 Nov 2016
Cited by 3 | Viewed by 5387
Abstract
Multiple illuminators of opportunity (IOs) and a large rotation angle are often required for current passive radar imaging techniques. However, a large rotation angle demands a long observation time, which cannot be implemented for actual passive radar system. To overcome this disadvantage, this [...] Read more.
Multiple illuminators of opportunity (IOs) and a large rotation angle are often required for current passive radar imaging techniques. However, a large rotation angle demands a long observation time, which cannot be implemented for actual passive radar system. To overcome this disadvantage, this paper proposes a super-resolution passive radar imaging framework with a sparsity-inducing compressed sensing (CS) technique, which allows for fewer IOs and a smaller rotation angle. In the proposed imaging framework, the sparsity-based passive radar imaging is modeled mathematically, and the spatial frequencies and amplitudes of different scatterers on the target are recovered by the log-sum penalty function-based CS reconstruction algorithm. In doing so, a super-resolution passive radar imagery is obtained by the frequency searching approach. Simulation results not only validate that the proposed method outperforms existing super-resolution algorithms, such as ESPRIT and RELAX, especially in the cases with low signal-to-noise ratio (SNR) and limited number of measurements, but also have shown that our proposed method can perform robust reconstruction no matter if the target is on grid or not. Full article
(This article belongs to the Special Issue Radar Systems for the Societal Challenges)
Show Figures

Figure 1

19 pages, 12835 KiB  
Article
Forms of Urban Expansion of Chinese Municipalities and Provincial Capitals, 1970s–2013
by Fang Liu, Zengxiang Zhang and Xiao Wang *
Institute of Remote Sensing and Digital Earth, Chinese Academy of Sciences, Beijing 100101, China
Remote Sens. 2016, 8(11), 930; https://doi.org/10.3390/rs8110930 - 9 Nov 2016
Cited by 62 | Viewed by 7761
Abstract
Urban expansion form is the most direct manifestation of urban expansion in space. Although it has been widely and vigorously studied, relatively little attention has been paid to reveal its spatiotemporal characteristics at the administrative level over a long timeframe. In this study, [...] Read more.
Urban expansion form is the most direct manifestation of urban expansion in space. Although it has been widely and vigorously studied, relatively little attention has been paid to reveal its spatiotemporal characteristics at the administrative level over a long timeframe. In this study, 31 Chinese municipalities and provincial capitals were selected as subjects to identify the urban expansion forms of provincial and higher level cities in China. First, urban expansion processes of these cities in the past four decades were reconstructed using remote sensing and geographical information system (GIS) technology. Then, the overall characteristics of urban expansion were presented to scientifically determine the urban expansion forms of the provincial and higher level cities in China. Afterwards, the annual expansion area per city (AEAC) index was employed to describe the urban expansion processes and determine the important time nodes of the 31 cities. Lastly, the urban expansion type (UET) index was adopted to analyze the spatiotemporal characteristics of urban expansion forms. Results indicate that (1) from the 1970s to 2013, urban lands in provincial and higher level cities in China expanded dramatically, with the central built-up area increasing by over 5 times, and urban expansion demonstrating an apparent spatial difference. The expansion rate of cities in East China was fastest with an AEAC of 13.78 km2, followed by that in Central China (AEAC = 9.67 km2). The urban expansion rate was slowest in West China (AEAC = 7.11 km2); (2) Affected by the national macro policies, urban expansion processes successively experienced four different stages: a slow expansion period (1970s–1987), an accelerating expansion period (1987–1995), a slowdown expansion period (1995–2000), and a high-speed fluctuating expansion period (after 2000); (3) The urban expansion forms of municipalities and provincial capitals were mainly edge-expansion supported by infilling expansion. The leapfrog form contributed minimally to urban expansion; (4) The edge-expansion form surged before 2010 and gradually slowed down after 2010. By contrast, infilling expansion kept increasing in the past four decades. Lastly, the rate of urban expansion via the leapfrog form fluctuated from the 1970s to 2013. Full article
Show Figures

Graphical abstract

19 pages, 37155 KiB  
Article
Dynamic Mapping of Rice Growth Parameters Using HJ-1 CCD Time Series Data
by Jing Wang 1, Jingfeng Huang 1,*, Ping Gao 2, Chuanwen Wei 1 and Lamin R. Mansaray 1,3
1 Institute of Remote Sensing and Information Application, Zhejiang University, Hangzhou 310058, China
2 Jiangsu Meteorological Bureau, Nanjing 210008, China
3 Department of Agro-meteorology and Geo-informatics, Magbosi Land, Water and Environment Research Center (MLWERC), Sierra Leone Agricultural Research Institute (SLARI), Freetown PMB 1313, Sierra Leone
Remote Sens. 2016, 8(11), 931; https://doi.org/10.3390/rs8110931 - 9 Nov 2016
Cited by 34 | Viewed by 6622 | Correction
Abstract
The high temporal resolution (4-day) charge-coupled device (CCD) cameras onboard small environment and disaster monitoring and forecasting satellites (HJ-1A/B) with 30 m spatial resolution and large swath (700 km) have substantially increased the availability of regional clear sky optical remote sensing data. For [...] Read more.
The high temporal resolution (4-day) charge-coupled device (CCD) cameras onboard small environment and disaster monitoring and forecasting satellites (HJ-1A/B) with 30 m spatial resolution and large swath (700 km) have substantially increased the availability of regional clear sky optical remote sensing data. For the application of dynamic mapping of rice growth parameters, leaf area index (LAI) and aboveground biomass (AGB) were considered as plant growth indicators. The HJ-1 CCD-derived vegetation indices (VIs) showed robust relationships with rice growth parameters. Cumulative VIs showed strong performance for the estimation of total dry AGB. The cross-validation coefficient of determination ( R C V 2 ) was increased by using two machine learning methods, i.e., a back propagation neural network (BPNN) and a support vector machine (SVM) compared with traditional regression equations of LAI retrieval. The LAI inversion accuracy was further improved by dividing the rice growth period into before and after heading stages. This study demonstrated that continuous rice growth monitoring over time and space at field level can be implemented effectively with HJ-1 CCD 10-day composite data using a combination of proper VIs and regression models. Full article
(This article belongs to the Special Issue Earth Observations for Precision Farming in China (EO4PFiC))
Show Figures

Figure 1

13 pages, 16611 KiB  
Article
Development of a Multi-Spatial Resolution Approach to the Surveillance of Active Fire Lines Using Himawari-8
by Chathura H. Wickramasinghe 1,2,*, Simon Jones 1,2, Karin Reinke 1,2 and Luke Wallace 1,2
1 School of Science, RMIT University, Melbourne VIC 3001, Australia
2 Bushfire and Natural Hazards Cooperative Research Centre, Melbourne VIC 3002, Australia
Remote Sens. 2016, 8(11), 932; https://doi.org/10.3390/rs8110932 - 9 Nov 2016
Cited by 62 | Viewed by 9051
Abstract
Satellite remote sensing is regularly used for wildfire detection, fire severity mapping and burnt area mapping. Applications in the surveillance of wildfire using geostationary-based sensors have been limited by low spatial resolutions. With the launch in 2015 of the AHI (Advanced Himawari Imaginer) [...] Read more.
Satellite remote sensing is regularly used for wildfire detection, fire severity mapping and burnt area mapping. Applications in the surveillance of wildfire using geostationary-based sensors have been limited by low spatial resolutions. With the launch in 2015 of the AHI (Advanced Himawari Imaginer) sensor on board Himawari-8, ten-minute interval imagery is available covering an entire earth hemisphere across East Asia and Australasia. Existing active fire detection algorithms depend on middle infrared (MIR) and thermal infrared (TIR) channels to detect fire. Even though sub-pixel fire detection algorithms can detect much smaller fires, the location of the fire within the AHI 2 × 2 km (400 ha) MIR/TIR pixel is unknown. This limits the application of AHI as a wildfire surveillance and tracking sensor. A new multi-spatial resolution approach is presented in this paper that utilizes the available medium resolution channels in AHI. The proposed algorithm is able to map firelines at a 500 m resolution. This is achieved using near infrared (NIR) (1 km) and RED (500 m) data to detect burnt area and smoke within the flagged MIR (2 km) pixel. Initial results based on three case studies carried out in Western Australia shows that the algorithm was able to continuously track fires during the day at 500 m resolution. The results also demonstrate the utility for wildfire management activities. Full article
Show Figures

Graphical abstract

19 pages, 11721 KiB  
Article
Mapping Annual Forest Cover in Sub-Humid and Semi-Arid Regions through Analysis of Landsat and PALSAR Imagery
by Yuanwei Qin 1, Xiangming Xiao 1,2,*, Jie Wang 1, Jinwei Dong 1, Kayti Ewing 3,4, Bruce Hoagland 3,5, Daniel J. Hough 5, Todd D. Fagin 3,5, Zhenhua Zou 1, George L. Geissler 6, George Z. Xian 7 and Thomas R. Loveland 7
1 Department of Microbiology and Plant Biology, Center for Spatial Analysis, University of Oklahoma, Norman, OK 73019, USA
2 Ministry of Education Key Laboratory of Biodiversity Science and Ecological Engineering, Institute of Biodiversity Science, Fudan University, Shanghai 200433, China
3 Oklahoma Natural Heritage Inventory, Department of Geography and Environmental Sustainability, University of Oklahoma, Norman, OK 73019, USA
4 Environmental Division, Arkansas State Highway and Transportation Department, Little Rock, AR 72209, USA
5 Oklahoma Biological Survey, University of Oklahoma, Norman, OK 73019, USA
6 Oklahoma Forestry Services, Oklahoma city, OK 73105, USA
7 U.S. Geological Survey (USGS) Earth Resources Observation and Science (EROS) Center, Sioux Falls, SD 57198, USA
Remote Sens. 2016, 8(11), 933; https://doi.org/10.3390/rs8110933 - 10 Nov 2016
Cited by 29 | Viewed by 8275
Abstract
Accurately mapping the spatial distribution of forests in sub-humid to semi-arid regions over time is important for forest management but a challenging task. Relatively large uncertainties still exist in the spatial distribution of forests and forest changes in the sub-humid and semi-arid regions. [...] Read more.
Accurately mapping the spatial distribution of forests in sub-humid to semi-arid regions over time is important for forest management but a challenging task. Relatively large uncertainties still exist in the spatial distribution of forests and forest changes in the sub-humid and semi-arid regions. Numerous publications have used either optical or synthetic aperture radar (SAR) remote sensing imagery, but the resultant forest cover maps often have large errors. In this study, we propose a pixel- and rule-based algorithm to identify and map annual forests from 2007 to 2010 in Oklahoma, USA, a transitional region with various climates and landscapes, using the integration of the L-band Advanced Land Observation Satellite (ALOS) PALSAR Fine Beam Dual Polarization (FBD) mosaic dataset and Landsat images. The overall accuracy and Kappa coefficient of the PALSAR/Landsat forest map were about 88.2% and 0.75 in 2010, with the user and producer accuracy about 93.4% and 75.7%, based on the 3270 random ground plots collected in 2012 and 2013. Compared with the forest products from Japan Aerospace Exploration Agency (JAXA), National Land Cover Database (NLCD), Oklahoma Ecological Systems Map (OKESM) and Oklahoma Forest Resource Assessment (OKFRA), the PALSAR/Landsat forest map showed great improvement. The area of the PALSAR/Landsat forest was about 40,149 km2 in 2010, which was close to the area from OKFRA (40,468 km2), but much larger than those from JAXA (32,403 km2) and NLCD (37,628 km2). We analyzed annual forest cover dynamics, and the results show extensive forest cover loss (2761 km2, 6.9% of the total forest area in 2010) and gain (3630 km2, 9.0%) in southeast and central Oklahoma, and the total area of forests increased by 684 km2 from 2007 to 2010. This study clearly demonstrates the potential of data fusion between PALSAR and Landsat images for mapping annual forest cover dynamics in sub-humid to semi-arid regions, and the resultant forest maps would be helpful to forest management. Full article
Show Figures

Graphical abstract

12 pages, 1183 KiB  
Article
Evaluation of Vertical Accuracy of the WorldDEM™ Using the Runway Method
by Kazimierz Becek 1,2,*, Wolfgang Koppe 3 and Şenol Hakan Kutoğlu 4
1 Department of Geomatics Engineering, Bülent Ecevit University, Zonguldak 67100, Turkey
2 Faculty of Geoingeenering, Mine and Geology, Wroclaw University of Technology, Wroclaw 50-370, Poland
3 Airbus Defense and Space, Friedrichshafen 88039, Germany
4 Department of Geomatics Engineering, Bülent Ecevit University, Zonguldak 67100, Turkey
Remote Sens. 2016, 8(11), 934; https://doi.org/10.3390/rs8110934 - 10 Nov 2016
Cited by 36 | Viewed by 5814
Abstract
Accuracy assessment of a global digital elevation model (DEM) is an important and challenging task primarily because of the difficulties and costs associated with securing a reliable and representative reference dataset. In this article, we report on the vertical accuracy assessment of the [...] Read more.
Accuracy assessment of a global digital elevation model (DEM) is an important and challenging task primarily because of the difficulties and costs associated with securing a reliable and representative reference dataset. In this article, we report on the vertical accuracy assessment of the WorldDEM™, the latest global DEM using the synthetic aperture radar interferometry (InSAR) method, based on the German TanDEM-X mission data. For reference data we use vertical profiles along the centerline of 47 paved runways located in different areas around the world. Our accuracy statement is based on the analysis of discrepancies between the reference data and the corresponding vertical profiles extracted from the WorldDEM™ dataset. Since the runways are nearly flat and have homogenous surfaces, the observed discrepancies are mainly due to instrument-induced error. Therefore, the derived accuracy statement has a universal character, e.g., it is not biased by other error sources including target- or environment-induced errors. Our main conclusions are that the WorldDEM™ is the most accurate global DEM to date in terms of its vertical accuracy; it appears that the accuracy is spatially independent. Full article
Show Figures

Graphical abstract

12 pages, 3490 KiB  
Article
Post-Earthquake Damage Inspection of Wood-Frame Buildings by a Polarimetric GB-SAR System
by Hai Liu 1, Christian Koyama 2, Jinfeng Zhu 1,*, Qinghuo Liu 3 and Motoyuki Sato 2,*
1 Department of Electronic Science, Institute of Electromagnetics and Acoustics, Xiamen University, Xiamen 361005, China
2 Center for Northeast Asian Studies, Tohoku University, Sendai 980-8576, Japan
3 Department of Electrical and Computer Engineering, Duke University, Durham, NC 27708-0291, USA
Remote Sens. 2016, 8(11), 935; https://doi.org/10.3390/rs8110935 - 10 Nov 2016
Cited by 15 | Viewed by 5732
Abstract
Structural damage inspection after an earthquake is essential for safety assessment of the affected wood-frame buildings and for making knowledgeable decision regarding their repair, renovation, or replacement. We present a polarimetric radar system for sensing the concealed wood-frames damaged by earthquakes. This system [...] Read more.
Structural damage inspection after an earthquake is essential for safety assessment of the affected wood-frame buildings and for making knowledgeable decision regarding their repair, renovation, or replacement. We present a polarimetric radar system for sensing the concealed wood-frames damaged by earthquakes. This system employs an antenna array consisting of four linearly polarized Vivaldi antennas recording full-polarimetric radar echoes in an ultra-wideband ranging from 1 to 20 GHz. The detailed design of the system and the signal processing algorithms for high-resolution 3D imaging are introduced. We conducted a number of surveys on damaged wooden wall specimens in laboratory. The experiment results indicate that the high-frequency radar waves can penetrate the wooden walls. Deformations of wooden structures (about 2 cm displacement) inside the wall, as well as the concealed small metal nails (about 3 mm in diameter and less than 2 cm in length) and bolts can be clearly imaged. The shape and orientation of the wooden members have shown a great sensitivity to the radar polarization. It is concluded that radar polarimetry can provide much richer information on the condition of concealed building structures than the conventional single-polarization subsurface penetrating radar. Full article
Show Figures

Graphical abstract

33 pages, 8872 KiB  
Article
Capability Assessment and Performance Metrics for the Titan Multispectral Mapping Lidar
by Juan Carlos Fernandez-Diaz 1,2,*, William E. Carter 1,2, Craig Glennie 1,2, Ramesh L. Shrestha 1,2, Zhigang Pan 1,2, Nima Ekhtari 1,2, Abhinav Singhania 1,2, Darren Hauser 1,2 and Michael Sartori 1,2
1 National Center for Airborne Laser Mapping (NCALM), Houston, TX 77204, USA
2 Department of Civil and Environmental Engineering, University of Houston, Houston, TX 77204, USA
Remote Sens. 2016, 8(11), 936; https://doi.org/10.3390/rs8110936 - 10 Nov 2016
Cited by 152 | Viewed by 15010
Abstract
In this paper we present a description of a new multispectral airborne mapping light detection and ranging (lidar) along with performance results obtained from two years of data collection and test campaigns. The Titan multiwave lidar is manufactured by Teledyne Optech Inc. (Toronto, [...] Read more.
In this paper we present a description of a new multispectral airborne mapping light detection and ranging (lidar) along with performance results obtained from two years of data collection and test campaigns. The Titan multiwave lidar is manufactured by Teledyne Optech Inc. (Toronto, ON, Canada) and emits laser pulses in the 1550, 1064 and 532 nm wavelengths simultaneously through a single oscillating mirror scanner at pulse repetition frequencies (PRF) that range from 50 to 300 kHz per wavelength (max combined PRF of 900 kHz). The Titan system can perform simultaneous mapping in terrestrial and very shallow water environments and its multispectral capability enables new applications, such as the production of false color active imagery derived from the lidar return intensities and the automated classification of target and land covers. Field tests and mapping projects performed over the past two years demonstrate capabilities to classify five land covers in urban environments with an accuracy of 90%, map bathymetry under more than 15 m of water, and map thick vegetation canopies at sub-meter vertical resolutions. In addition to its multispectral and performance characteristics, the Titan system is designed with several redundancies and diversity schemes that have proven to be beneficial for both operations and the improvement of data quality. Full article
(This article belongs to the Special Issue Airborne Laser Scanning)
Show Figures

Graphical abstract

22 pages, 49569 KiB  
Article
Spatio-Temporal Error Sources Analysis and Accuracy Improvement in Landsat 8 Image Ground Displacement Measurements
by Chao Ding 1, Guangcai Feng 1,*, Zhiwei Li 1, Xinjian Shan 2, Yanan Du 1 and Huiqiang Wang 1
1 School of Geosciences and Info-Physics, Central South University, Changsha 410083, China
2 State Key Laboratory of Earthquake Dynamics, Institute of Geology, China Earthquake Administration, Beijing 100029, China
Remote Sens. 2016, 8(11), 937; https://doi.org/10.3390/rs8110937 - 10 Nov 2016
Cited by 48 | Viewed by 10333
Abstract
Because of the advantages of low cost, large coverage and short revisit cycle, Landsat 8 images have been widely applied to monitor earth surface movements. However, there are few systematic studies considering the error source characteristics or the improvement of the deformation field [...] Read more.
Because of the advantages of low cost, large coverage and short revisit cycle, Landsat 8 images have been widely applied to monitor earth surface movements. However, there are few systematic studies considering the error source characteristics or the improvement of the deformation field accuracy obtained by Landsat 8 image. In this study, we utilize the 2013 Mw 7.7 Balochistan, Pakistan earthquake to analyze error spatio-temporal characteristics and elaborate how to mitigate error sources in the deformation field extracted from multi-temporal Landsat 8 images. We found that the stripe artifacts and the topographic shadowing artifacts are two major error components in the deformation field, which currently lack overall understanding and an effective mitigation strategy. For the stripe artifacts, we propose a small spatial baseline (<200 m) method to avoid the stripe artifacts effect on the deformation field. We also propose a small radiometric baseline method to reduce the topographic shadowing artifacts and radiometric decorrelation noises. Those performances and accuracy evaluation show that these two methods are effective in improving the precision of deformation field. This study provides the possibility to detect subtle ground movement with higher precision caused by earthquake, melting glaciers, landslides, etc., with Landsat 8 images. It is also a good reference for error source analysis and corrections in deformation field extracted from other optical satellite images. Full article
(This article belongs to the Special Issue Earth Observations for Geohazards)
Show Figures

Graphical abstract

16 pages, 13665 KiB  
Technical Note
Data Service Platform for Sentinel-2 Surface Reflectance and Value-Added Products: System Use and Examples
by Francesco Vuolo 1,*, Mateusz Żółtak 1, Claudia Pipitone 1,2, Luca Zappa 1, Hannah Wenng 1, Markus Immitzer 1, Marie Weiss 3, Frederic Baret 3 and Clement Atzberger 1
1 Institute of Surveying, Remote Sensing & Land Information (IVFL), University of Natural Resources and Life Sciences, Vienna (BOKU), Peter Jordan Str. 82, 1190 Vienna, Austria
2 Department of Civil, Environmental, Aerospace, Materials Engineering (DICAM), University of Palermo, Viale Delle Scienze, Bld. 8, 90128 Palermo, Italy
3 Institut National de la Recherche Agronomique—Université d’Avignon et des Pays du Vaucluse (INRA-UAPV), 228 Route de l’Aérodrome, 84914 Avignon, France
Remote Sens. 2016, 8(11), 938; https://doi.org/10.3390/rs8110938 - 11 Nov 2016
Cited by 148 | Viewed by 20018
Abstract
This technical note presents the first Sentinel-2 data service platform for obtaining atmospherically-corrected images and generating the corresponding value-added products for any land surface on Earth. Using the European Space Agency’s (ESA) Sen2Cor algorithm, the platform processes ESA’s Level-1C top-of-atmosphere reflectance to atmospherically-corrected [...] Read more.
This technical note presents the first Sentinel-2 data service platform for obtaining atmospherically-corrected images and generating the corresponding value-added products for any land surface on Earth. Using the European Space Agency’s (ESA) Sen2Cor algorithm, the platform processes ESA’s Level-1C top-of-atmosphere reflectance to atmospherically-corrected bottom-of-atmosphere (BoA) reflectance (Level-2A). The processing runs on-demand, with a global coverage, on the Earth Observation Data Centre (EODC), which is a public-private collaborative IT infrastructure in Vienna (Austria) for archiving, processing, and distributing Earth observation (EO) data. Using the data service platform, users can submit processing requests and access the results via a user-friendly web page or using a dedicated application programming interface (API). Building on the processed Level-2A data, the platform also creates value-added products with a particular focus on agricultural vegetation monitoring, such as leaf area index (LAI) and broadband hemispherical-directional reflectance factor (HDRF). An analysis of the performance of the data service platform, along with processing capacity, is presented. Some preliminary consistency checks of the algorithm implementation are included to demonstrate the expected product quality. In particular, Sentinel-2 data were compared to atmospherically-corrected Landsat-8 data for six test sites achieving a R2 = 0.90 and Root Mean Square Error (RMSE) = 0.031. LAI was validated for one test site using ground estimations. Results show a very good agreement (R2 = 0.83) and a RMSE of 0.32 m2/m2 (12% of mean value). Full article
Show Figures

Graphical abstract

18 pages, 4653 KiB  
Article
Wind Turbine Wake Characterization from Temporally Disjunct 3-D Measurements
by Paula Doubrawa 1,*, Rebecca J. Barthelmie 1, Hui Wang 2, S. C. Pryor 3 and Matthew J. Churchfield 4
1 Sibley School of Mechanical and Aerospace Engineering, Cornell University, Ithaca, NY 14853, USA
2 SgurrEnergy Ltd., Vancouver, BC V6C 2X6, Canada
3 Department of Earth and Atmospheric Sciences, Cornell University, Ithaca, NY 14853, USA
4 National Renewable Energy Laboratory, Golden, CO 80401, USA
Remote Sens. 2016, 8(11), 939; https://doi.org/10.3390/rs8110939 - 10 Nov 2016
Cited by 19 | Viewed by 5954
Abstract
Scanning LiDARs can be used to obtain three-dimensional wind measurements in and beyond the atmospheric surface layer. In this work, metrics characterizing wind turbine wakes are derived from LiDAR observations and from large-eddy simulation (LES) data, which are used to recreate the LiDAR [...] Read more.
Scanning LiDARs can be used to obtain three-dimensional wind measurements in and beyond the atmospheric surface layer. In this work, metrics characterizing wind turbine wakes are derived from LiDAR observations and from large-eddy simulation (LES) data, which are used to recreate the LiDAR scanning geometry. The metrics are calculated for two-dimensional planes in the vertical and cross-stream directions at discrete distances downstream of a turbine under single-wake conditions. The simulation data are used to estimate the uncertainty when mean wake characteristics are quantified from scanning LiDAR measurements, which are temporally disjunct due to the time that the instrument takes to probe a large volume of air. Based on LES output, we determine that wind speeds sampled with the synthetic LiDAR are within 10% of the actual mean values and that the disjunct nature of the scan does not compromise the spatial variation of wind speeds within the planes. We propose scanning geometry density and coverage indices, which quantify the spatial distribution of the sampled points in the area of interest and are valuable to design LiDAR measurement campaigns for wake characterization. We find that scanning geometry coverage is important for estimates of the wake center, orientation and length scales, while density is more important when seeking to characterize the velocity deficit distribution. Full article
(This article belongs to the Special Issue Remote Sensing of Wind Energy)
Show Figures

Graphical abstract

18 pages, 2643 KiB  
Article
Deriving and Evaluating City-Wide Vegetation Heights from a TanDEM-X DEM
by Johannes Schreyer * and Tobia Lakes
Applied Geoinformation Science Lab, Department of Geography, Humboldt-Universität zu Berlin, Unter den Linden 6, 10099 Berlin, Germany
Remote Sens. 2016, 8(11), 940; https://doi.org/10.3390/rs8110940 - 11 Nov 2016
Cited by 9 | Viewed by 5537
Abstract
Vegetation provides important functions and services in urban areas, and vegetation heights divided into vertical and horizontal units can be used as indicators for its assessment. Conversely, detailed area-wide and updated height information is frequently missing for most urban areas. This study sought [...] Read more.
Vegetation provides important functions and services in urban areas, and vegetation heights divided into vertical and horizontal units can be used as indicators for its assessment. Conversely, detailed area-wide and updated height information is frequently missing for most urban areas. This study sought to assess three vegetation height classes from a globally available TanDEM-X digital elevation model (DEM, 12 × 12 m spatial resolution) for Berlin, Germany. Subsequently, height distribution and its accuracy across biotope classes were derived. For this, a TanDEM-X intermediate DEM, a LiDAR DTM, an UltraCamX vegetation layer, and a biotope map were included. The applied framework comprised techniques of data integration and raster algebra for: Deriving a height model for all of Berlin, masking non-vegetated areas, classifying two canopy height models (CHMs) for bushes/shrubs and trees, deriving vegetation heights for 12 biotope classes and assessing accuracies using validation CHMs. The findings highlighted the possibility of assessing vegetation heights for total vegetation, trees and bushes/shrubs with low and consistent offsets of mean heights (total CHM: −1.56 m; CHM for trees: −2.23 m; CHM bushes/shrubs: 0.60 m). Negative offsets are likely caused by X-band canopy penetrations. Between the biotope classes, large variations of height and area were identified (vegetation height/biotope and area/biotope: ~3.50–~16.00 m; 4.44%–96.53%). The framework and results offer a great asset for citywide and spatially explicit assessment of vegetation heights as an input for urban ecology studies, such as investigating habitat diversity based on the vegetation’s heterogeneity. Full article
(This article belongs to the Special Issue Remote Sensing of Urban Ecology)
Show Figures

Graphical abstract

25 pages, 8981 KiB  
Article
Water Constituents and Water Depth Retrieval from Sentinel-2A—A First Evaluation in an Oligotrophic Lake
by Katja Dörnhöfer 1,*, Anna Göritz 2,3, Peter Gege 2, Bringfried Pflug 4 and Natascha Oppelt 1
1 Earth Observation and Modelling, Department of Geography, Christian-Albrechts-Universität zu Kiel, Ludewig-Meyn-Str. 14, Kiel D-24098, Germany
2 German Aerospace Center, Remote Sensing Technology Institute, Münchner Str. 20, Oberpfaffenhofen, Weßling D-82234, Germany
3 Remote Sensing Technology, Technische Universität München, Arcisstr. 21, München D-80333, Germany
4 German Aerospace Center, Remote Sensing Technology Institute, Rutherfordstr. 2, Berlin-Adlershof D-12489, Germany
Remote Sens. 2016, 8(11), 941; https://doi.org/10.3390/rs8110941 - 11 Nov 2016
Cited by 111 | Viewed by 12995
Abstract
Satellite remote sensing may assist in meeting the needs of lake monitoring. In this study, we aim to evaluate the potential of Sentinel-2 to assess and monitor water constituents and bottom characteristics of lakes at spatio-temporal synoptic scales. In a field campaign at [...] Read more.
Satellite remote sensing may assist in meeting the needs of lake monitoring. In this study, we aim to evaluate the potential of Sentinel-2 to assess and monitor water constituents and bottom characteristics of lakes at spatio-temporal synoptic scales. In a field campaign at Lake Starnberg, Germany, we collected validation data concurrently to a Sentinel-2A (S2-A) overpass. We compared the results of three different atmospheric corrections, i.e., Sen2Cor, ACOLITE and MIP, with in situ reflectance measurements, whereof MIP performed best (r = 0.987, RMSE = 0.002 sr−1). Using the bio-optical modelling tool WASI-2D, we retrieved absorption by coloured dissolved organic matter (aCDOM(440)), backscattering and concentration of suspended particulate matter (SPM) in optically deep water; water depths, bottom substrates and aCDOM(440) were modelled in optically shallow water. In deep water, SPM and aCDOM(440) showed reasonable spatial patterns. Comparisons with in situ data (mean: 0.43 m−1) showed an underestimation of S2-A derived aCDOM(440) (mean: 0.14 m−1); S2-A backscattering of SPM was slightly higher than backscattering from in situ data (mean: 0.027 m−1 vs. 0.019 m−1). Chlorophyll-a concentrations (~1 mg·m−3) of the lake were too low for a retrieval. In shallow water, retrieved water depths exhibited a high correlation with echo sounding data (r = 0.95, residual standard deviation = 0.12 m) up to 2.5 m (Secchi disk depth: 4.2 m), though water depths were slightly underestimated (RMSE = 0.56 m). In deeper water, Sentinel-2A bands were incapable of allowing a WASI-2D based separation of macrophytes and sediment which led to erroneous water depths. Overall, the results encourage further research on lakes with varying optical properties and trophic states with Sentinel-2A. Full article
Show Figures

Graphical abstract

21 pages, 7939 KiB  
Article
A Novel Approach for Retrieving Tree Leaf Area from Ground-Based LiDAR
by Ting Yun 1,2,†, Feng An 1,†, Weizheng Li 3, Yuan Sun 4, Lin Cao 4 and Lianfeng Xue 2,*
1 Danzhou Investigation and Experiment Station of Tropical Crops, Ministry of Agriculture, Rubber Research Institute, Chinese Academy of Tropical Agricultural Sciences, Danzhou 571737, China
2 School of Information Science and Technology, Nanjing Forestry University, Nanjing 210037, China
3 Advanced Analysis and Testing Centre, Nanjing Forestry University, Nanjing 210037, China
4 College of Forestry, Nanjing Forestry University, Nanjing 210037, China
These authors contributed equally to this work.
Remote Sens. 2016, 8(11), 942; https://doi.org/10.3390/rs8110942 - 11 Nov 2016
Cited by 71 | Viewed by 8806
Abstract
Leaf area is an important plant canopy structure parameter with important ecological significance. Light detection and ranging technology (LiDAR) with the application of a terrestrial laser scanner (TLS) is an appealing method for accurately estimating leaf area; however, the actual utility of this [...] Read more.
Leaf area is an important plant canopy structure parameter with important ecological significance. Light detection and ranging technology (LiDAR) with the application of a terrestrial laser scanner (TLS) is an appealing method for accurately estimating leaf area; however, the actual utility of this scanner depends largely on the efficacy of point cloud data (PCD) analysis. In this paper, we present a novel method for quantifying total leaf area within each tree canopy from PCD. Firstly, the shape, normal vector distribution and structure tensor of PCD features were combined with the semi-supervised support vector machine (SVM) method to separate various tree organs, i.e., branches and leaves. In addition, the moving least squares (MLS) method was adopted to remove ghost points caused by the shaking of leaves in the wind during the scanning process. Secondly, each target tree was scanned using two patterns, i.e., one scan and three scans around the canopy, to reduce the occlusion effect. Specific layer subdivision strategies according to the acquisition ranges of the scanners were designed to separate the canopy into several layers. Thirdly, 10% of the PCD was randomly chosen as an analytic dataset (ADS). For the ADS, an innovative triangulation algorithm with an assembly threshold was designed to transform these discrete scanning points into leaf surfaces and estimate the fractions of each foliage surface covered by the laser pulses. Then, a novel ratio of the point number to leaf area in each layer was defined and combined with the total number of scanned points to retrieve the total area of the leaves in the canopy. The quantified total leaf area of each tree was validated using laborious measurements with a LAI-2200 Plant Canopy Analyser and an LI-3000C Portable Area Meter. The results showed that the individual tree leaf area was accurately reproduced using our method from three registered scans, with a relative deviation of less than 10%. Nevertheless, estimations from only one scan resulted in a deviation of >25% in the retrieved individual tree leaf area due to the occlusion effect. Indeed, this study provides a novel connection between leaf area estimates and scanning sensor configuration and supplies an interesting method for estimating leaf area based on PCD. Full article
(This article belongs to the Special Issue Digital Forest Resource Monitoring and Uncertainty Analysis)
Show Figures

Graphical abstract

13 pages, 3174 KiB  
Article
An Optimal Sample Data Usage Strategy to Minimize Overfitting and Underfitting Effects in Regression Tree Models Based on Remotely-Sensed Data
by Yingxin Gu 1,*, Bruce K. Wylie 2, Stephen P. Boyte 3, Joshua Picotte 1, Daniel M. Howard 3, Kelcy Smith 3 and Kurtis J. Nelson 2
1 ASRC InuTeq, Contractor to US Geological Survey (USGS) Earth Resources Observation and Science (EROS) Center, 47914 252nd Street, Sioux Falls, SD 57198, USA
2 US Geological Survey (USGS) Earth Resources Observation and Science (EROS) Center, 47914 252nd Street, Sioux Falls, SD 57198, USA
3 Stinger Ghaffarian Technologies (SGT), Contractor to US Geological Survey (USGS) Earth Resources Observation and Science (EROS) Center, 47914 252nd Street, Sioux Falls, SD 57198, USA
Remote Sens. 2016, 8(11), 943; https://doi.org/10.3390/rs8110943 - 11 Nov 2016
Cited by 52 | Viewed by 7803
Abstract
Regression tree models have been widely used for remote sensing-based ecosystem mapping. Improper use of the sample data (model training and testing data) may cause overfitting and underfitting effects in the model. The goal of this study is to develop an optimal sampling [...] Read more.
Regression tree models have been widely used for remote sensing-based ecosystem mapping. Improper use of the sample data (model training and testing data) may cause overfitting and underfitting effects in the model. The goal of this study is to develop an optimal sampling data usage strategy for any dataset and identify an appropriate number of rules in the regression tree model that will improve its accuracy and robustness. Landsat 8 data and Moderate-Resolution Imaging Spectroradiometer-scaled Normalized Difference Vegetation Index (NDVI) were used to develop regression tree models. A Python procedure was designed to generate random replications of model parameter options across a range of model development data sizes and rule number constraints. The mean absolute difference (MAD) between the predicted and actual NDVI (scaled NDVI, value from 0–200) and its variability across the different randomized replications were calculated to assess the accuracy and stability of the models. In our case study, a six-rule regression tree model developed from 80% of the sample data had the lowest MAD (MADtraining = 2.5 and MADtesting = 2.4), which was suggested as the optimal model. This study demonstrates how the training data and rule number selections impact model accuracy and provides important guidance for future remote-sensing-based ecosystem modeling. Full article
Show Figures

Graphical abstract

28 pages, 14204 KiB  
Article
Grassland and Cropland Net Ecosystem Production of the U.S. Great Plains: Regression Tree Model Development and Comparative Analysis
by Bruce Wylie 1,*,†, Daniel Howard 2,†, Devendra Dahal 2,†, Tagir Gilmanov 3, Lei Ji 4, Li Zhang 5 and Kelcy Smith 2
1 Earth Resources Observation and Science (EROS) Center, U.S. Geological Survey (USGS), Sioux Falls, SD 57198, USA
2 Stinger Ghaffarian Technologies (SGT), Contractor to USGS EROS Center, Sioux Falls, SD 57198, USA
3 Gilmanov Research & Consulting, LLP, Brookings, SD 57006, USA
4 ASRC InuTeq, Contractor to USGS EROS Center, Sioux Falls, SD 57198, USA
5 Key Laboratory of Digital Earth Science, Institute of Remote Sensing and Digital Earth, Chinese Academy of Sciences, Beijing 100094, China
These authors contributed equally to this work.
Remote Sens. 2016, 8(11), 944; https://doi.org/10.3390/rs8110944 - 11 Nov 2016
Cited by 15 | Viewed by 7395
Abstract
This paper presents the methodology and results of two ecological-based net ecosystem production (NEP) regression tree models capable of up scaling measurements made at various flux tower sites throughout the U.S. Great Plains. Separate grassland and cropland NEP regression tree models were trained [...] Read more.
This paper presents the methodology and results of two ecological-based net ecosystem production (NEP) regression tree models capable of up scaling measurements made at various flux tower sites throughout the U.S. Great Plains. Separate grassland and cropland NEP regression tree models were trained using various remote sensing data and other biogeophysical data, along with 15 flux towers contributing to the grassland model and 15 flux towers for the cropland model. The models yielded weekly mean daily grassland and cropland NEP maps of the U.S. Great Plains at 250 m resolution for 2000–2008. The grassland and cropland NEP maps were spatially summarized and statistically compared. The results of this study indicate that grassland and cropland ecosystems generally performed as weak net carbon (C) sinks, absorbing more C from the atmosphere than they released from 2000 to 2008. Grasslands demonstrated higher carbon sink potential (139 g C·m−2·year−1) than non-irrigated croplands. A closer look into the weekly time series reveals the C fluctuation through time and space for each land cover type. Full article
Show Figures

Graphical abstract

21 pages, 23653 KiB  
Article
Mapping Urban Impervious Surface by Fusing Optical and SAR Data at the Decision Level
by Zhenfeng Shao 1, Huyan Fu 1,2,*, Peng Fu 3 and Li Yin 4
1 State Key Laboratory of Information Engineering in Surveying, Mapping and Remote Sensing, Wuhan University, 129 Luoyu Road, Wuhan 430079, China
2 Chinese Academy of Surveying and Mapping, Lianhuachixi Road 28, Haidian District, Beijing 100830, China
3 Center for Urban and Environmental Change, Department of Earth and Environmental Systems, Indiana State University, Terre Haute, IN 47809, USA
4 Department of Urban and Regional Planning, University at Buffalo, The State University of New York, Buffalo, NY 14214, USA
Remote Sens. 2016, 8(11), 945; https://doi.org/10.3390/rs8110945 - 12 Nov 2016
Cited by 99 | Viewed by 9454
Abstract
The proliferation of impervious surfaces results in a series of environmental issues, such as the decrease of vegetated areas and the aggravation of the urban heat island effects. The mapping of impervious surface and its spatial distributions is of significance for the ecological [...] Read more.
The proliferation of impervious surfaces results in a series of environmental issues, such as the decrease of vegetated areas and the aggravation of the urban heat island effects. The mapping of impervious surface and its spatial distributions is of significance for the ecological study of urban environment. Currently, the integration of optical and synthetic aperture radar (SAR) data has shown advantages in accurately characterizing impervious surface. However, the fusion mainly occurs at the pixel and feature levels which are subject to influences of data noises and feature selections, respectively. In this paper, an innovative and effective method was developed to extract urban impervious surface by synergistically utilizing optical and SAR images at the decision level. The objective of this paper was to obtain an accurate urban impervious surface map based on the random forest classifier and the evidence theory and to provide a detailed uncertainty analysis accompanying the fused impervious surface maps. In this study, both the GaoFen (GF-1) and Sentinel-1A imagery were first used as independent data sources for mapping urban impervious surfaces. Then additional spectral features and texture features were extracted and integrated with the original GF-1 and Sentinel-1A images in generating impervious surfaces. Finally, based on the Dempster-Shafer (D-S) theory, impervious surfaces were produced by fusing the previously estimated impervious surfaces from different datasets at the decision level. Results showed that impervious surfaces estimated from the combined use of original images and features yielded a higher accuracy than those from the original optical or SAR data. Further validations suggested that optical data was better than SAR data in separating impervious surfaces from non-impervious surfaces. The fused impervious surfaces at the decision level had a higher overall accuracy than those produced independently by optical or SAR data. It was also highlighted that the fusion of GF-1 and Sentinel-1A images reduced the amount of confusions among the low reflectance of impervious surface and water, as well as for low reflectance of bare land. An overall accuracy of 95.33% was achieved for extracting urban impervious surfaces by fused datasets. The spatial distributions of uncertainties provided by the evidence theory displayed a confidence level of at least 75% for the impervious surfaces derived from the fused datasets. Full article
(This article belongs to the Special Issue Monitoring of Land Changes)
Show Figures

Graphical abstract

17 pages, 2359 KiB  
Article
Development of a New BRDF-Resistant Vegetation Index for Improving the Estimation of Leaf Area Index
by Su Zhang 1,2, Liangyun Liu 1,*, Xinjie Liu 1 and Zefei Liu 1,3
1 Key Laboratory of Digital Earth Science, Institute of Remote Sensing and Digital Earth, Chinese Academy of Sciences, Beijing 100094, China
2 University of Chinese Academy of Sciences, Beijing 100049, China
3 College of Geometrics, Xi’an University of Science and Technology, Xi’an 710054, China
Remote Sens. 2016, 8(11), 947; https://doi.org/10.3390/rs8110947 - 12 Nov 2016
Cited by 14 | Viewed by 6051
Abstract
The leaf area index (LAI) is one of the most important Earth surface parameters used in the modeling of ecosystems and their interaction with climate. Numerous vegetation indices have been developed to estimate the LAI. However, because of the effects of the bi-directional [...] Read more.
The leaf area index (LAI) is one of the most important Earth surface parameters used in the modeling of ecosystems and their interaction with climate. Numerous vegetation indices have been developed to estimate the LAI. However, because of the effects of the bi-directional reflectance distribution function (BRDF), most of these vegetation indices are also sensitive to the effect of BRDF. In this study, we aim to present a new BRDF-resistant vegetation index (BRVI), which is sensitive to the LAI but insensitive to the effect of BRDF. Firstly, the BRDF effects of different bands were investigated using both simulated data and in-situ measurements of winter wheat made at different growth stages. We found bi-directional shape similarity in the solar principal plane between the green and the near-infrared (NIR) bands and between the blue and red bands for farmland soil conditions and with medium chlorophyll content level. Secondly, the consistency of the shape of the BRDF across different bands was employed to develop a new BRDF-resistant vegetation index for estimating the LAI. The reflectance ratios of the NIR band to the green band and the blue band to the red band were reasonably assumed to be resistant to the BRDF effects. Nevertheless, the variation amplitude of the bi-directional reflectance in the solar principal plane was different for different bands. The divisors in the two reflectance ratios were improved by combining the reflectances at the red and green bands. The new BRVI was defined as a normalized combination of the two improved reflectance ratios. Finally, the potential of the proposed BRVI for estimation of the LAI was evaluated using both simulated data and in-situ measurements and also compared to other popular vegetation indices. The results showed that the influence of the BRDF on the BRVI was the weakest and that the BRVI retrieved LAI values well, with a coefficient of determination (R2) of 0.84 and an RMSE of 0.83 for the field data and with an R2 of 0.97 and an RMSE of 0.25 for the simulated data. It was concluded, therefore, that the new BRVI is resistant to BRDF effect and is also promising for use in estimating the LAI. Full article
Show Figures

Graphical abstract

27 pages, 4921 KiB  
Article
Environmental and Anthropogenic Degradation of Vegetation in the Sahel from 1982 to 2006
by Khaldoun Rishmawi and Stephen D. Prince *
Department of Geographical Sciences, University of Maryland, College Park, MD 20782, USA
Remote Sens. 2016, 8(11), 948; https://doi.org/10.3390/rs8110948 - 13 Nov 2016
Cited by 19 | Viewed by 6736
Abstract
There is a great deal of debate on the extent, causes, and even the reality of land degradation in the Sahel. Investigations carried out before approximately 2000 using remote sensing data suggest widespread reductions in biological productivity, while studies extending beyond 2000 consistently [...] Read more.
There is a great deal of debate on the extent, causes, and even the reality of land degradation in the Sahel. Investigations carried out before approximately 2000 using remote sensing data suggest widespread reductions in biological productivity, while studies extending beyond 2000 consistently reveal a net increase in vegetation production, strongly related to the recovery of rainfall following the extreme droughts of the 1970s and 1980s, and thus challenging the notion of widespread, long-term, subcontinental-scale degradation. Yet, the spatial variations in the rates of vegetation recovery are not fully explained by rainfall trends. It is hypothesized that, in addition to rainfall, other meteorological variables and human land use have contributed to vegetation dynamics. Throughout most of the Sahel, the interannual variability in growing season ΣNDVIgs (measured from satellites, used as a proxy of vegetation productivity) was strongly related to rainfall, humidity, and temperature (mean r2 = 0.67), but with rainfall alone was weaker (mean r2 = 0.41). The mean and upper 95th quantile (UQ) rates of change in ΣNDVIgs in response to climate were used to predict potential ΣNDVIgs—that is, the ΣNDVIgs expected in response to climate variability alone, excluding any anthropogenic effects. The differences between predicted and observed ΣNDVIgs were regressed against time to detect any long-term (positive or negative) trends in vegetation productivity. Over most of the Sahel, the trends did not significantly depart from what is expected from the trends in meteorological variables. However, substantial and spatially contiguous areas (~8% of the total area of the Sahel) were characterized by negative, and, in some areas, positive trends. To explore whether the negative trends were human-induced, they were compared with the available data of population density, land use, and land biophysical properties that are known to affect the susceptibility of land to degradation. The spatial variations in the trends of the residuals were partly related to soils and tree cover, but also to several anthropogenic pressures. Full article
Show Figures

Graphical abstract

19 pages, 4744 KiB  
Article
Variability of Particle Size Distributions in the Bohai Sea and the Yellow Sea
by Zhongfeng Qiu 1,2, Deyong Sun 1,2,*, Chuanmin Hu 3, Shengqiang Wang 1,2, Lufei Zheng 1, Yu Huan 1 and Tian Peng 1
1 School of Marine Sciences, Nanjing University of Information Science & Technology, Nanjing 210044, China
2 Jiangsu Research Center for Ocean Survey Technology, Nanjing 210044, China
3 College of Marine Science, University of South Florida, 140 Seventh Avenue South, St. Petersburg, FL 33701, USA
Remote Sens. 2016, 8(11), 949; https://doi.org/10.3390/rs8110949 - 15 Nov 2016
Cited by 21 | Viewed by 5967
Abstract
Particle size distribution (PSD) is an important parameter that is relevant to many aspects of marine ecosystems, such as phytoplankton functional types, optical absorption and scattering from particulates, sediment fluxes, and carbon export. However, only a handful of studies have documented the PSD [...] Read more.
Particle size distribution (PSD) is an important parameter that is relevant to many aspects of marine ecosystems, such as phytoplankton functional types, optical absorption and scattering from particulates, sediment fluxes, and carbon export. However, only a handful of studies have documented the PSD variability in different regions. Here, we investigate the PSD properties and variability in two shallow and semi-enclosed seas (the Bohai Sea (BS) and Yellow Sea (YS)), using in situ laser diffraction measurements (LISST-100X Type C) and other measurements at 79 stations in November 2013. The results show large variability in particle concentrations (in both volume and number concentrations), with volume concentrations varying by 57-fold. The median particle diameter (Dv50) from each of the water samples also covers a large range (22.4–307.0 μm) and has an irregular statistical distribution, indicating complexity in the PSD. The PSD slopes (2.7–4.5), estimated from a power-law model, cover nearly the entire range reported previously for natural waters. Small mineral particles (with large PSD slopes) are characteristic of near-shore waters prone to sediment resuspension by winds and tides, while large biological particles (with small PSD slopes) dominate the total suspended particulates for waters away from the coast. For the BS and YS, this study provides the first report on the properties and spatial variability of the PSD, which may influence the optical properties of the ocean surface and remote sensing algorithms that are based on estimations of particle concentrations and sizes. Full article
Show Figures

Graphical abstract

16 pages, 3038 KiB  
Article
An Alternative Quality Control Technique for Mineral Chemistry Analysis of Portland Cement-Grade Limestone Using Shortwave Infrared Spectroscopy
by Nasrullah Zaini 1,2,*, Freek Van der Meer 1, Frank Van Ruitenbeek 1, Boudewijn De Smeth 1, Fadli Amri 3 and Caroline Lievens 1
1 Department of Earth Systems Analysis, Faculty of Geo-Information Science and Earth Observation (ITC), University of Twente, P.O. Box 217, 7500 AE Enschede, The Netherlands
2 Department of Physics, Faculty of Mathematics and Natural Sciences, Syiah Kuala University, Darussalam, Banda Aceh 23111, Indonesia
3 Laboratory Department, PT. Lafarge Cement Indonesia, Km 17 Lhoknga, Aceh Besar 23353, Indonesia
Remote Sens. 2016, 8(11), 950; https://doi.org/10.3390/rs8110950 - 15 Nov 2016
Cited by 27 | Viewed by 7752
Abstract
Shortwave infrared (SWIR) spectroscopy can be applied directly to analyze the mineral chemistry of raw or geologic materials. It provides diagnostic spectral characteristics of the chemical composition of minerals, information that is invaluable for the identification and quality control of such materials. The [...] Read more.
Shortwave infrared (SWIR) spectroscopy can be applied directly to analyze the mineral chemistry of raw or geologic materials. It provides diagnostic spectral characteristics of the chemical composition of minerals, information that is invaluable for the identification and quality control of such materials. The present study aims to investigate the potential of SWIR spectroscopy as an alternative quality control technique for the mineral chemistry analysis of Portland cement-grade limestone. We used the spectroscopic (wavelength position and depth of absorption feature) and geochemical characteristics of limestone samples to estimate the abundance and composition of carbonate and clay minerals on rock surfaces. The depth of the carbonate (CO3) and Al-OH absorption features are linearly correlated with the contents of CaO and Al2O3 in the samples, respectively, as determined by portable X-ray fluorescence (PXRF) measurements. Variations in the wavelength position of CO3 and Al-OH absorption features are related to changes in the chemical compositions of the samples. The results showed that the dark gray and light gray limestone samples are better suited for manufacturing Portland cement clinker than the dolomitic limestone samples. This finding is based on the CaO, MgO, Al2O3, and SiO2 concentrations and compositions. The results indicate that SWIR spectroscopy is an appropriate approach for the chemical quality control of cement raw materials. Full article
Show Figures

Graphical abstract

25 pages, 26592 KiB  
Article
Investigation on Mining Subsidence Based on Multi-Temporal InSAR and Time-Series Analysis of the Small Baseline Subset—Case Study of Working Faces 22201-1/2 in Bu’ertai Mine, Shendong Coalfield, China
by Chao Ma 1,2, Xiaoqian Cheng 1,2,*, Yali Yang 1, Xiaoke Zhang 3, Zengzhang Guo 2 and Youfeng Zou 2
1 Department of Remote Sensing Science and Technology, Henan Polytechnic University, Jiaozuo 454000, China
2 Key Laboratory of Mine Spatial Information Technologies of SBSM, Henan Polytechnic University, Jiaozuo 454000, China
3 School of Public Administration, Hohai University, Nanjing 210098, China
Remote Sens. 2016, 8(11), 951; https://doi.org/10.3390/rs8110951 - 16 Nov 2016
Cited by 70 | Viewed by 8482
Abstract
High-intensity coal mining (large mining height, shallow mining depth, and rapid advancing) frequently causes large-scale ground damage within a short period of time. Understanding mining subsidence under high-intensity mining can provide a basis for mining-induced damage assessment, land remediation in a subsidence area, [...] Read more.
High-intensity coal mining (large mining height, shallow mining depth, and rapid advancing) frequently causes large-scale ground damage within a short period of time. Understanding mining subsidence under high-intensity mining can provide a basis for mining-induced damage assessment, land remediation in a subsidence area, and ecological reconstruction in vulnerable ecological regions in Western China. In this study, the mining subsidence status of Shendong Coalfield was investigated and analyzed using two-pass differential interferometric synthetic aperture radar (DInSAR) technology based on high-resolution synthetic aperture radar data (RADARSAT-2 precise orbit, multilook fine, 5 m) collected from 20 January 2012 to June 2013. Surface damages in Shendong Coalfield over a period of 504 days under open-pit mining and underground mining were observed. Ground deformation of the high-intensity mining working faces 22201-1/2 in Bu’ertai Mine, Shendong Coalfield was monitored using small baseline subset (SBAS) InSAR technology. (1) DInSAR detected and located 85 ground deformation areas (including ground deformations associated with past-mining activity). The extent of subsidence in Shendong Coalfield presented a progressive increase at an average monthly rate of 13.09 km2 from the initial 54.98 km2 to 225.20 km2, approximately, which accounted for 7% of the total area of Shendong Coalfield; (2) SBAS-InSAR reported that the maximum cumulative subsidence area reached 5.58 km2 above the working faces 22201-1/2. The advance speed of ground destruction (7.9 m/day) was nearly equal to that of underground mining (8.1 m/day). Full article
(This article belongs to the Special Issue Earth Observations for Geohazards)
Show Figures

Graphical abstract

16 pages, 8288 KiB  
Article
Using Landsat, MODIS, and a Biophysical Model to Evaluate LST in Urban Centers
by Mohammad Z. Al-Hamdan 1,*, Dale A. Quattrochi 2, Lahouari Bounoua 3, Asia Lachir 3 and Ping Zhang 3,4,5
1 Universities Space Research Association at NASA Marshall Space Flight Center, National Space Science and Technology Center, Huntsville, AL 35805, USA
2 Earth Science Office at NASA Marshall Space Flight Center, National Space Science and Technology Center, Huntsville, AL 35805, USA
3 Biospheric Sciences Laboratory, NASA’s Goddard Space Flight Center, Greenbelt, MD 20771, USA
4 Earth System Science Interdisciplinary Center, University of Maryland, College Park, MD 20742, USA
5 Science System Applications Inc., Lanham, MD 20706, USA
Remote Sens. 2016, 8(11), 952; https://doi.org/10.3390/rs8110952 - 16 Nov 2016
Cited by 18 | Viewed by 9087
Abstract
In this paper, we assessed and compared land surface temperature (LST) in urban centers using data from Landsat, MODIS, and the Simple Biosphere model (SiB2). We also evaluated the sensitivity of the model’s LST to different land cover types, fractions (percentages), and emissivities [...] Read more.
In this paper, we assessed and compared land surface temperature (LST) in urban centers using data from Landsat, MODIS, and the Simple Biosphere model (SiB2). We also evaluated the sensitivity of the model’s LST to different land cover types, fractions (percentages), and emissivities compared to reference points derived from Landsat thermal data. This was demonstrated in three climatologically- and morphologically-different cities of Atlanta, GA, New York, NY, and Washington, DC. Our results showed that in these cities SiB2 was sensitive to both the emissivity and the land cover type and fraction, but much more sensitive to the latter. The practical implications of these results are rather significant since they imply that the SiB2 model can be used to run different scenarios for evaluating urban heat island (UHI) mitigation strategies. This study also showed that using detailed emissivities per land cover type and fractions from Landsat-derived data caused a convergence of the model results towards the Landsat-derived LST for most of the studied cases. This study also showed that SiB2 LSTs are closer in magnitude to Landsat-derived LSTs than MODIS-derived LSTs. It is important, however, to emphasize that both Landsat and MODIS LSTs are not direct observations and, as such, do not represent a ground truth. More studies will be needed to compare these results to in situ LST data and provide further validation. Full article
(This article belongs to the Special Issue Multi-Sensor and Multi-Data Integration in Remote Sensing)
Show Figures

Graphical abstract

21 pages, 5264 KiB  
Article
Water Budget Analysis within the Surrounding of Prominent Lakes and Reservoirs from Multi-Sensor Earth Observation Data and Hydrological Models: Case Studies of the Aral Sea and Lake Mead
by Alka Singh 1,*, Florian Seitz 1, Annette Eicker 2 and Andreas Güntner 3,4
1 Deutsches Geodätisches Forschungsinstitut (DGFI-TUM), Technische Universität München, Arcisstr. 21, Munich 80333, Germany
2 HafenCity Universität, Überseeallee 16, Hamburg 20457, Germany
3 Helmholtz Center Potsdam, GFZ German Research Centre for Geosciences, Telegrafenberg, Potsdam 14473, Germany
4 Institute of Earth and Environmental Science, University of Potsdam, Potsdam 14476, Germany
Remote Sens. 2016, 8(11), 953; https://doi.org/10.3390/rs8110953 - 16 Nov 2016
Cited by 12 | Viewed by 7375
Abstract
The hydrological budget of a region is determined based on the horizontal and vertical water fluxes acting in both inward and outward directions. These integrated water fluxes vary, altering the total water storage and consequently the gravitational force of the region. The time-dependent [...] Read more.
The hydrological budget of a region is determined based on the horizontal and vertical water fluxes acting in both inward and outward directions. These integrated water fluxes vary, altering the total water storage and consequently the gravitational force of the region. The time-dependent gravitational field can be observed through the Gravity Recovery and Climate Experiment (GRACE) gravimetric satellite mission, provided that the mass variation is above the sensitivity of GRACE. This study evaluates mass changes in prominent reservoir regions through three independent approaches viz. fluxes, storages, and gravity, by combining remote sensing products, in-situ data and hydrological model outputs using WaterGAP Global Hydrological Model (WGHM) and Global Land Data Assimilation System (GLDAS). The results show that the dynamics revealed by the GRACE signal can be better explored by a hybrid method, which combines remote sensing-based reservoir volume estimates with hydrological model outputs, than by exclusive model-based storage estimates. For the given arid/semi-arid regions, GLDAS based storage estimations perform better than WGHM. Full article
(This article belongs to the Special Issue Remote Sensing of Climate Change and Water Resources)
Show Figures

Figure 1

14 pages, 4190 KiB  
Article
Random Forest Classification of Wetland Landcovers from Multi-Sensor Data in the Arid Region of Xinjiang, China
by Shaohong Tian 1, Xianfeng Zhang 1,*, Jie Tian 2 and Quan Sun 1
1 Institute of Remote Sensing and Geographic Information System, Peking University, 5 Summer Palace Road, Beijing 100871, China
2 Department of International Development, Community, and Environment, Clark University, Worcester, MA 01610, USA
Remote Sens. 2016, 8(11), 954; https://doi.org/10.3390/rs8110954 - 16 Nov 2016
Cited by 176 | Viewed by 13579
Abstract
The wetland classification from remotely sensed data is usually difficult due to the extensive seasonal vegetation dynamics and hydrological fluctuation. This study presents a random forest classification approach for the retrieval of the wetland landcover in the arid regions by fusing the Pléiade-1B [...] Read more.
The wetland classification from remotely sensed data is usually difficult due to the extensive seasonal vegetation dynamics and hydrological fluctuation. This study presents a random forest classification approach for the retrieval of the wetland landcover in the arid regions by fusing the Pléiade-1B data with multi-date Landsat-8 data. The segmentation of the Pléiade-1B multispectral image data was performed based on an object-oriented approach, and the geometric and spectral features were extracted for the segmented image objects. The normalized difference vegetation index (NDVI) series data were also calculated from the multi-date Landsat-8 data, reflecting vegetation phenological changes in its growth cycle. The feature set extracted from the two sensors data was optimized and employed to create the random forest model for the classification of the wetland landcovers in the Ertix River in northern Xinjiang, China. Comparison with other classification methods such as support vector machine and artificial neural network classifiers indicates that the random forest classifier can achieve accurate classification with an overall accuracy of 93% and the Kappa coefficient of 0.92. The classification accuracy of the farming lands and water bodies that have distinct boundaries with the surrounding land covers was improved 5%–10% by making use of the property of geometric shapes. To remove the difficulty in the classification that was caused by the similar spectral features of the vegetation covers, the phenological difference and the textural information of co-occurrence gray matrix were incorporated into the classification, and the main wetland vegetation covers in the study area were derived from the two sensors data. The inclusion of phenological information in the classification enables the classification errors being reduced down, and the overall accuracy was improved approximately 10%. The results show that the proposed random forest classification by fusing multi-sensor data can retrieve better wetland landcover information than the other classifiers, which is significant for the monitoring and management of the wetland ecological resources in arid areas. Full article
Show Figures

Graphical abstract

30 pages, 20037 KiB  
Article
Evaluation of the Quality of NDVI3g Dataset against Collection 6 MODIS NDVI in Central Europe between 2000 and 2013
by Anikó Kern 1,*, Hrvoje Marjanović 2 and Zoltán Barcza 3
1 Department of Geophysics and Space Science, Eötvös Loránd University, Pázmány P. st. 1/A, Budapest H-1117, Hungary
2 Croatian Forest Research Institute, Cvjetno naselje 41, Jastrebarsko HR-10450, Croatia
3 Department of Meteorology, Eötvös Loránd University, Pázmány P. st. 1/A, Budapest H-1117, Hungary
Remote Sens. 2016, 8(11), 955; https://doi.org/10.3390/rs8110955 - 17 Nov 2016
Cited by 40 | Viewed by 8084
Abstract
Remote sensing provides invaluable insight into the dynamics of vegetation with global coverage and reasonable temporal resolution. Normalized Difference Vegetation Index (NDVI) is widely used to study vegetation greenness, production, phenology and the responses of ecosystems to climate fluctuations. The extended global NDVI3g [...] Read more.
Remote sensing provides invaluable insight into the dynamics of vegetation with global coverage and reasonable temporal resolution. Normalized Difference Vegetation Index (NDVI) is widely used to study vegetation greenness, production, phenology and the responses of ecosystems to climate fluctuations. The extended global NDVI3g dataset created by Global Inventory Modeling and Mapping Studies (GIMMS) has an exceptional 32 years temporal coverage. Due to the methodology that was used to create NDVI3g inherent noise and uncertainty is present in the dataset. To evaluate the accuracy and uncertainty of application of NDVI3g at regional scale we used Collection-6 data from the MODerate resolution Imaging Spectroradiometer (MODIS) sensor on board satellite Terra as a reference. After noise filtering, statistical harmonization of the NDVI3g dataset was performed for Central Europe based on MOD13 NDVI. Mean seasonal NDVI profiles, start, end and length of the growing season, magnitude and timing of peak NDVI were calculated from NDVI3g (original, noise filtered and harmonized) and MODIS NDVI and compared with each other. NDVI anomalies were also compared and evaluated using simple climate sensitivity metrics. The results showed that (1) the original NDVI3g has limited applicability in Central Europe, which was also implied by the significant disagreement between the NDVI3g and MODIS NDVI datasets; (2) the harmonization of NDVI3g with MODIS NDVI is promising since the newly created dataset showed improved quality for diverse vegetation metrics. For NDVI anomaly detection NDVI3g showed limited applicability, even after harmonization. Climate–NDVI relationships are not represented well by NDVI3g. The presented results can help researchers to assess the expected quality of the NDVI3g-based studies in Central Europe. Full article
Show Figures

Graphical abstract

17 pages, 27221 KiB  
Article
Study of Subsidence and Earthquake Swarms in the Western Pakistan
by Jingqiu Huang 1,*, Shuhab D. Khan 1, Abduwasit Ghulam 2, Wanda Crupa 1, Ismail A. Abir 1, Abdul S. Khan 3, Din M. Kakar 4, Aimal Kasi 3 and Najeebullah Kakar 3
1 Department of Earth & Atmospheric Sciences, University of Houston, Houston, TX 77204, USA
2 Center for Sustainability, Saint Louis University, St. Louis, MO 63108, USA
3 Center of Excellence in Mineralogy, University of Balochistan, Quetta 87500, Pakistan
4 Department of Geology, University of Balochistan, Quetta 87500, Pakistan
Remote Sens. 2016, 8(11), 956; https://doi.org/10.3390/rs8110956 - 18 Nov 2016
Cited by 22 | Viewed by 8736
Abstract
In recent years, the Quetta Valley and surrounding areas have experienced unprecedented levels of subsidence, which has been attributed mainly to groundwater withdrawal. However, this region is also tectonically active and is home to several regional strike-slip faults, including the north–south striking left-lateral [...] Read more.
In recent years, the Quetta Valley and surrounding areas have experienced unprecedented levels of subsidence, which has been attributed mainly to groundwater withdrawal. However, this region is also tectonically active and is home to several regional strike-slip faults, including the north–south striking left-lateral Chaman Fault System. Several large earthquakes have occurred recently in this area, including one deadly Mw 6.4 earthquake that struck on 28 October 2008. This study integrated Interferometric Synthetic Aperture Radar (InSAR) results with GPS, gravity, seismic reflection profiles, and earthquake centroid-moment-tensor (CMT) data to identify the impact of tectonic and anthropogenic processes on subsidence and earthquake patterns in this region. To detect and map the spatial-temporal features of the processes that led to the surface deformation, this study used two Synthetic Aperture Radar (SAR) time series, i.e., 15 Phased Array L-band Synthetic Aperture Radar (PALSAR) images acquired by an Advanced Land Observing Satellite (ALOS) from 2006–2011 and 40 Environmental Satellite (ENVISAT) Advanced Synthetic Aperture Radar (ASAR) images spanning 2003–2010. A Small Baseline Subset (SBAS) technique was used to investigate surface deformation. Five seismic lines totaling ~60 km, acquired in 2003, were used to map the blind thrust faults beneath a Quaternary alluvium layer. The median filtered SBAS-InSAR average velocity profile supports groundwater withdrawal as the dominant source of subsidence, with some contribution from tectonic subsidence in the Quetta Valley. Results of SBAS-InSAR multi-temporal analysis provide a better explanation for the pre-, co-, and post-seismic displacement pattern caused by the 2008 earthquake swarms across two strike-slip faults. Full article
Show Figures

Graphical abstract

5 pages, 169 KiB  
Editorial
Preface: The Environmental Mapping and Analysis Program (EnMAP) Mission: Preparing for Its Scientific Exploitation
by Saskia Foerster 1,*, Véronique Carrère 2, Michael Rast 3 and Karl Staenz 4
1 Section 1.4 Remote Sensing, Helmholtz Center Potsdam GFZ German Research Center for Geosciences, Telegrafenberg, 14473 Potsdam, Germany
2 Laboratoire de Planétologie et Géodynamique de Nantes, University of Nantes, 2 rue de la Houssinière, BP92208, 44322 Nantes Cedex 3, France
3 ESA-ESRIN, Via Galileo Galilei, 00044 Frascati, Italy
4 Alberta Terrestrial Imaging Centre and Department of Geography, University of Lethbridge, 4401 University Drive, Lethbridge, AB T1K 3M4, Canada
Remote Sens. 2016, 8(11), 957; https://doi.org/10.3390/rs8110957 - 17 Nov 2016
Cited by 13 | Viewed by 5393
Abstract
The imaging spectroscopy mission EnMAP aims to assess the state and evolution of terrestrial and aquatic ecosystems, examine the multifaceted impacts of human activities, and support a sustainable use of natural resources. Once in operation (scheduled to launch in 2019), EnMAP will provide [...] Read more.
The imaging spectroscopy mission EnMAP aims to assess the state and evolution of terrestrial and aquatic ecosystems, examine the multifaceted impacts of human activities, and support a sustainable use of natural resources. Once in operation (scheduled to launch in 2019), EnMAP will provide high-quality observations in the visible to near-infrared and shortwave-infrared spectral range. The scientific preparation of the mission comprises an extensive science program. This special issue presents a collection of research articles, demonstrating the potential of EnMAP for various applications along with overview articles on the mission and software tools developed within its scientific preparation. Full article
Show Figures

Graphical abstract

23 pages, 31180 KiB  
Article
Scanning, Multibeam, Single Photon Lidars for Rapid, Large Scale, High Resolution, Topographic and Bathymetric Mapping
by John J. Degnan
Sigma Space Corporation, 4600 Forbes Blvd., Lanham, MD 20706, USA
Remote Sens. 2016, 8(11), 958; https://doi.org/10.3390/rs8110958 - 18 Nov 2016
Cited by 95 | Viewed by 12004
Abstract
Several scanning, single photon sensitive, 3D imaging lidars are herein described that operate at aircraft above ground levels (AGLs) between 1 and 11 km, and speeds in excess of 200 knots. With 100 beamlets and laser fire rates up to 60 kHz, we, [...] Read more.
Several scanning, single photon sensitive, 3D imaging lidars are herein described that operate at aircraft above ground levels (AGLs) between 1 and 11 km, and speeds in excess of 200 knots. With 100 beamlets and laser fire rates up to 60 kHz, we, at the Sigma Space Corporation (Lanham, MD, USA), have interrogated up to 6 million ground pixels per second, all of which can record multiple returns from volumetric scatterers such as tree canopies. High range resolution has been achieved through the use of subnanosecond laser pulsewidths, detectors and timing receivers. The systems are presently being deployed on a variety of aircraft to demonstrate their utility in multiple applications including large scale surveying, bathymetry, forestry, etc. Efficient noise filters, suitable for near realtime imaging, have been shown to effectively eliminate the solar background during daytime operations. Geolocation elevation errors measured to date are at the subdecimeter level. Key differences between our Single Photon Lidars, and competing Geiger Mode lidars are also discussed. Full article
(This article belongs to the Special Issue Airborne Laser Scanning)
Show Figures

Graphical abstract

27 pages, 16495 KiB  
Article
Long Term Global Surface Soil Moisture Fields Using an SMOS-Trained Neural Network Applied to AMSR-E Data
by Nemesio J. Rodríguez-Fernández 1,2,*, Yann H. Kerr 1, Robin Van der Schalie 3,4, Amen Al-Yaari 5, Jean-Pierre Wigneron 5, Richard De Jeu 3,4, Philippe Richaume 1, Emanuel Dutra 2, Arnaud Mialon 1 and Matthias Drusch 6
1 Centre d’Etudes Spatiales de la Biosphère Université de Toulouse, Centre National d’Etudes Spatiales (CNES), Centre National de la Recherche Scientifique (CNRS), Institut de Recherche pour le Dévelopement (IRD), 18 av. Edouard Belin, bpi 2801, 31401 Toulouse CEDEX 9, France
2 European Centre for Medium-Range Weather Forecasts (ECMWF), Shinfield Park, RG2 9AX Reading, UK
3 Faculty of Earth and Life Sciences, VU University Amsterdam (VUA), 1081 HV Amsterdam, The Netherlands
4 Transmissivity B.V., Huygensstraat 34, 2201 AZ Noordwijk, The Netherlands
5 Interactions Sol Plante Atmosphére (ISPA), Unité Mixte de Recherche 1391, Institut National de la Recherche Agronomique (INRA), CS 20032, 33882 Villenave d’ornon cedex, France
6 European Space Research and Technology Centre (ESTEC), European Space Agency (ESA), Keplerlaan 1, 2201 AZ Noordwijk, The Netherlands
Remote Sens. 2016, 8(11), 959; https://doi.org/10.3390/rs8110959 - 18 Nov 2016
Cited by 38 | Viewed by 6951
Abstract
A method to retrieve soil moisture (SM) from Advanced Scanning Microwave Radiometer—Earth Observing System Sensor (AMSR-E) observations using Soil Moisture and Ocean Salinity (SMOS) Level 3 SM as a reference is discussed. The goal is to obtain longer time series of SM with [...] Read more.
A method to retrieve soil moisture (SM) from Advanced Scanning Microwave Radiometer—Earth Observing System Sensor (AMSR-E) observations using Soil Moisture and Ocean Salinity (SMOS) Level 3 SM as a reference is discussed. The goal is to obtain longer time series of SM with no significant bias and with a similar dynamical range to that of the SMOS SM dataset. This method consists of training a neural network (NN) to obtain a global non-linear relationship linking AMSR-E brightness temperatures ( T b ) to the SMOS L3 SM dataset on the concurrent mission period of 1.5 years. Then, the NN model is used to derive soil moisture from past AMSR-E observations. It is shown that in spite of the different frequencies and sensing depths of AMSR-E and SMOS, it is possible to find such a global relationship. The sensitivity of AMSR-E T b ’s to soil temperature ( T s o i l ) was also evaluated using European Centre for Medium-Range Weather Forecast Interim/Land re-analysis (ERA-Land) and Modern-Era Retrospective analysis for Research and Applications-Land (MERRA-Land) model data. The best combination of AMSR-E T b ’s to retrieve T s o i l is H polarization at 23 and 36 GHz plus V polarization at 36 GHz. Regarding SM, several combinations of input data show a similar performance in retrieving SM. One NN that uses C and X bands and T s o i l information was chosen to obtain SM in the 2003–2011 period. The new dataset shows a low bias (<0.02 m3/m3) and low standard deviation of the difference (<0.04 m3/m3) with respect to SMOS L3 SM over most of the globe’s surface. The new dataset was evaluated together with other AMSR-E SM datasets and the Climate Change Initiative (CCI) SM dataset against the MERRA-Land and ERA-Land models for the 2003–2011 period. All datasets show a significant bias with respect to models for boreal regions and high correlations over regions other than the tropical and boreal forest. All of the global SM datasets including AMSR-E NN were also evaluated against a large number of in situ measurements over four continents. Over Australia, all datasets show a strong level of agreement with in situ measurements. Models perform better over Europe and mountainous regions in North America. Remote sensing datasets (in particular NN and the Land Parameter Retrieval Model (LPRM)) perform as well as models for other North American sites and perform better than models over the Sahel region. Full article
Show Figures

Graphical abstract

2 pages, 458 KiB  
Correction
Correction: Singh, A., et al. Remote Sensing of Storage Fluctuations of Poorly Gauged Reservoirs and State Space Model (SSM)-Based Estimation. Remote Sens. 2015, 7, 17113–17134
by Alka Singh 1,*, Ujjwal Kumar 2 and Florian Seitz 1
1 Deutsches Geodätisches Forschungsinstitut, Technische Universität München, Arcisstr. 21, 80333 Munich, Germany
2 School of Environment & Natural Resources (SENR), Doon University, 248001 Dehradun, India
Remote Sens. 2016, 8(11), 960; https://doi.org/10.3390/rs8110960 - 21 Nov 2016
Cited by 2 | Viewed by 3536
Abstract
The authors wish to make the following corrections to their paper [1].[...] Full article
Show Figures

Figure 1

25 pages, 21134 KiB  
Article
Estimating and Up-Scaling Fuel Moisture and Leaf Dry Matter Content of a Temperate Humid Forest Using Multi Resolution Remote Sensing Data
by Hamed Adab 1, Kasturi Devi Kanniah 2,3,* and Jason Beringer 4
1 Faculty of Geography and Environmental Science, Hakim Sabzevari University, Sabzevar, Khorasan Razavi 9617976487, Iran
2 Faculty of Geoinformation and Real Estate, Universiti Teknologi Malaysia, Johor 81310, Malaysia
3 Centre for Environmental Sustainability and Water Security, Research Institute for Sustainable Environment, Universiti Teknologi Malaysia, Johor 81310, Malaysia
4 School of Earth and Environment, University of Western Australia (M004), 35 Stirling Highway, Crawley WA 6009, Australia
Remote Sens. 2016, 8(11), 961; https://doi.org/10.3390/rs8110961 - 19 Nov 2016
Cited by 17 | Viewed by 8485
Abstract
Vegetation moisture and dry matter content are important indicators in predicting the behavior of fire and it is widely used in fire spread models. In this study, leaf fuel moisture content such as Live Fuel Moisture Content (LFMC), Leaf Relative Water Content (RWC), [...] Read more.
Vegetation moisture and dry matter content are important indicators in predicting the behavior of fire and it is widely used in fire spread models. In this study, leaf fuel moisture content such as Live Fuel Moisture Content (LFMC), Leaf Relative Water Content (RWC), Dead Fuel Moisture Content (DFMC), and Leaf Dry Matter Content (LDMC) (hereinafter known as moisture content indices (MCI)) were calculated in the field for different forest species at 32 sites in a temperate humid forest (Zaringol forest) located in northeastern Iran. These data and several relevant vegetation-biophysical indices and atmospheric variables calculated using Landsat 7 Enhanced Thematic Mapper Plus (ETM+) data with moderate spatial resolution (30 m) were used to estimate MCI of the Zaringol forest using Artificial Neural Network (ANN) and Multiple Linear Regression (MLR) methods. The prediction of MCI using ANN showed that ETM+ predicted MCI slightly better (Mean Absolute Percentage Error (MAPE) of 6%–12%)) than MLR (MAPE between 8% and 17%). Once satisfactory results in estimating MCI were obtained by using ANN from ETM+ data, these data were then upscaled to estimate MCI using MODIS data for daily monitoring of leaf water and leaf dry matter content at 500 m spatial resolution. For MODIS derived LFMC, LDMC, RWC, and DLMC, the ANN produced a MAPE between 11% and 29% for the indices compared to MLR which produced an MAPE of 14%–33%. In conclusion, we suggest that upscaling is necessary for solving the scale discrepancy problems between the indicators and low spatial resolution MODIS data. The scaling up of MCI could be used for pre-fire alert system and thereby can detect fire prone areas in near real time for fire-fighting operations. Full article
(This article belongs to the Special Issue Remote Sensing of Vegetation Structure and Dynamics)
Show Figures

Graphical abstract

22 pages, 14337 KiB  
Article
Global Daily High-Resolution Satellite-Based Foundation Sea Surface Temperature Dataset: Development and Validation against Two Definitions of Foundation SST
by Kohtaro Hosoda * and Futoki Sakaida
Center for Atmospheric and Oceanic Studies, Graduate School of Science, Tohoku University, Aramaki-aza-Aoba 6-3, Aoba, Sendai 980-8576, Japan
Remote Sens. 2016, 8(11), 962; https://doi.org/10.3390/rs8110962 - 21 Nov 2016
Cited by 10 | Viewed by 7829
Abstract
This paper describes a global, daily sea surface temperature (SST) analysis based on satellite microwave and infrared measurements. The SST analysis includes a diurnal correction method to estimate foundation SST (SST free from diurnal variability) using satellite sea surface wind and solar radiation [...] Read more.
This paper describes a global, daily sea surface temperature (SST) analysis based on satellite microwave and infrared measurements. The SST analysis includes a diurnal correction method to estimate foundation SST (SST free from diurnal variability) using satellite sea surface wind and solar radiation data, frequency splitting to reproduce intra-seasonal variability and a quality control procedure repeated twice to avoid operation errors. An optimal interpolation method designed for foundation SST is applied to blend the microwave and infrared satellite measurements. Although in situ SST measurements are not used for bias correction adjustments in the analysis, the output product, with a spatial grid size of 0.1°, has an accuracy of 0.48 C and 0.46 C compared to the in situ foundation SST measurements derived by drifting buoys and Argo floats, respectively. The same quality against the two types of in situ foundation SST (drifters and Argo) suggests that the two definitions of foundation SST proposed by past studies can provide same-quality information about the sea surface state underlying the diurnal thermocline. Full article
Show Figures

Graphical abstract

25 pages, 17184 KiB  
Article
Cloud Extraction from Chinese High Resolution Satellite Imagery by Probabilistic Latent Semantic Analysis and Object-Based Machine Learning
by Kai Tan, Yongjun Zhang * and Xin Tong
School of Remote Sensing and Information Engineering, Wuhan University, No. 129 Luoyu Road, Wuhan 430079, China
Remote Sens. 2016, 8(11), 963; https://doi.org/10.3390/rs8110963 - 22 Nov 2016
Cited by 45 | Viewed by 12249
Abstract
Automatic cloud extraction from satellite imagery is a vital process for many applications in optical remote sensing since clouds can locally obscure the surface features and alter the reflectance. Clouds can be easily distinguished by the human eyes in satellite imagery via remarkable [...] Read more.
Automatic cloud extraction from satellite imagery is a vital process for many applications in optical remote sensing since clouds can locally obscure the surface features and alter the reflectance. Clouds can be easily distinguished by the human eyes in satellite imagery via remarkable regional characteristics, but finding a way to automatically detect various kinds of clouds by computer programs to speed up the processing efficiency remains a challenge. This paper introduces a new cloud detection method based on probabilistic latent semantic analysis (PLSA) and object-based machine learning. The method begins by segmenting satellite images into superpixels by Simple Linear Iterative Clustering (SLIC) algorithm while also extracting the spectral, texture, frequency and line segment features. Then, the implicit information in each superpixel is extracted from the feature histogram through the PLSA model by which the descriptor of each superpixel can be computed to form a feature vector for classification. Thereafter, the cloud mask is extracted by optimal thresholding and applying the Support Vector Machine (SVM) algorithm at the superpixel level. The GrabCut algorithm is then applied to extract more accurate cloud regions at the pixel level by assuming the cloud mask as the prior knowledge. When compared to different cloud detection methods in the literature, the overall accuracy of the proposed cloud detection method was up to 90 percent for ZY-3 and GF-1 images, which is about a 6.8 percent improvement over the traditional spectral-based methods. The experimental results show that the proposed method can automatically and accurately detect clouds using the multispectral information of the available four bands. Full article
Show Figures

Graphical abstract

17 pages, 3877 KiB  
Article
Spatial Distribution of Diffuse Attenuation of Photosynthetic Active Radiation and Its Main Regulating Factors in Inland Waters of Northeast China
by Jianhang Ma 1,2, Kaishan Song 1,*, Zhidan Wen 1, Ying Zhao 1,2, Yingxin Shang 1,2, Chong Fang 1,2 and Jia Du 1
1 Northeast Institute of Geography and Agroecology, Chinese Academy of Sciences (CAS), Changchun 130102, China
2 University of Chinese Academy of Sciences, Beijing 100049, China
Remote Sens. 2016, 8(11), 964; https://doi.org/10.3390/rs8110964 - 21 Nov 2016
Cited by 22 | Viewed by 6566
Abstract
Light availability in lakes or reservoirs is affected by optically active components (OACs) in the water. Light plays a key role in the distribution of phytoplankton and hydrophytes, thus, is a good indicator of the trophic state of an aquatic system. Diffuse attenuation [...] Read more.
Light availability in lakes or reservoirs is affected by optically active components (OACs) in the water. Light plays a key role in the distribution of phytoplankton and hydrophytes, thus, is a good indicator of the trophic state of an aquatic system. Diffuse attenuation of photosynthetic active radiation (PAR) (Kd(PAR)) is commonly used to quantitatively assess the light availability. The PAR and the concentration of OACs were measured at 206 sites, which covered 26 lakes and reservoirs in Northeast China. The spatial distribution of Kd(PAR) was depicted and its association with the OACs was assessed by grey incidences(GIs) and linear regression analysis. Kd(PAR) varied from 0.45 to 15.04 m−1. This investigation revealed that reservoirs in the east part of Northeast China were clear with small Kd(PAR) values, while lakes located in plain areas, where the source of total suspended matter (TSM) varied, displayed high Kd(PAR) values. The GIs and linear regression analysis indicated that the TSM was the dominant factor in determining Kd(PAR) values and best correlated with Kd(PAR) (R2 = 0.906, RMSE = 0.709). Most importantly, we have demonstrated that the TSM concentration is a reliable measurement for the estimation of the Kd(PAR) as 74% of the data produced a relative error (RE) of less than 0.4 in a leave-one-out cross validation (LOO-CV) analysis. Spatial transferability assessment of the model also revealed that TSM performed well as a determining factor of the Kd(PAR) for the majority of the lakes. However, a few exceptions were identified where the optically regulating dominant factors were chlorophyll-a (Chl-a) and/or the chromophroic dissolved organic matter (CDOM). These extreme cases represent lakes with exceptionally clear waters. Full article
(This article belongs to the Special Issue Water Optics and Water Colour Remote Sensing)
Show Figures

Graphical abstract

17 pages, 7903 KiB  
Article
Interpolation of GPS and Geological Data Using InSAR Deformation Maps: Method and Application to Land Subsidence in the Alto Guadalentín Aquifer (SE Spain)
by Marta Béjar-Pizarro 1,2,3,*, Carolina Guardiola-Albert 1,4, Ramón P. García-Cárdenas 5, Gerardo Herrera 1,2,3,6, Anna Barra 7, Antonio López Molina 8, Serena Tessitore 1,9, Alejandra Staller 10, José A. Ortega-Becerril 11 and Ramón P. García-García 5
1 Geohazards InSAR Laboratory and Modeling Group (InSARlab), Geoscience Research Department, Geological Survey of Spain (IGME), Alenza 1, 28003 Madrid, Spain
2 Research Partnership Unit IGME-UA on Radar Interferometry Applied to Ground Deformation (UNIRAD), University of Alicante, P.O. Box 99, 03080 Alicante, Spain
3 Spanish Working Group on Ground Subsidence (SUBTER), UNESCO, 03690 Alicante, Spain
4 Environmental Geology and Geomathematics, Geoscience Research Department, Geological Survey of Spain (IGME), Alenza 1, 28003 Madrid, Spain
5 Departamento de Ingeniería Civil, Universidad Católica San Antonio de Murcia, Campus de los Jerónimos, 30107 Murcia, Spain
6 Earth Observation and Geohazards Expert Group (EOEG), EuroGeoSurveys, the Geological Surveys of Europe, 36-38, Rue Joseph II, 1000 Brussels, Belgium
7 Centre Tecnològic de les Telecomunicacions de Catalunya (CTTC), 08860 Castelldefels, Barcelona, Spain
8 Leica Geosystems, s.l. Ctra Fuencarral, 28108 Alcobendas, Madrid, Spain
9 Department of Earth Sciences, Environment and Resources, Federico II University of Naples, Largo San Marcellino 10, 80138 Naples, Italy
10 Dpto.de Ingeniería Topográfica y Cartografía, Universidad Politécnica de Madrid, 28031 Madrid, Spain
11 Dpto. de Geología y Geoquímica, Facultad Ciencias, Universidad Autónoma de Madrid, 28049 Madrid, Spain
add Show full affiliation list remove Hide full affiliation list
Remote Sens. 2016, 8(11), 965; https://doi.org/10.3390/rs8110965 - 23 Nov 2016
Cited by 51 | Viewed by 9289
Abstract
Land subsidence resulting from groundwater extractions is a global phenomenon adversely affecting many regions worldwide. Understanding the governing processes and mitigating associated hazards require knowing the spatial distribution of the implicated factors (piezometric levels, lithology, ground deformation), usually only known at discrete locations. [...] Read more.
Land subsidence resulting from groundwater extractions is a global phenomenon adversely affecting many regions worldwide. Understanding the governing processes and mitigating associated hazards require knowing the spatial distribution of the implicated factors (piezometric levels, lithology, ground deformation), usually only known at discrete locations. Here, we propose a methodology based on the Kriging with External Drift (KED) approach to interpolate sparse point measurements of variables influencing land subsidence using high density InSAR measurements. In our study, located in the Alto Guadalentín basin, SE Spain, these variables are GPS vertical velocities and the thickness of compressible soils. First, we estimate InSAR and GPS rates of subsidence covering the periods 2003–2010 and 2004–2013, respectively. Then, we apply the KED method to the discrete variables. The resulting continuous GPS velocity map shows maximum subsidence rates of 13 cm/year in the center of the basin, in agreement with previous studies. The compressible deposits thickness map is significantly improved. We also test the coherence of Sentinel-1 data in the study region and evaluate the applicability of this methodology with the new satellite, which will improve the monitoring of aquifer-related subsidence and the mapping of variables governing this phenomenon. Full article
(This article belongs to the Special Issue Multi-Sensor and Multi-Data Integration in Remote Sensing)
Show Figures

Graphical abstract

14 pages, 36024 KiB  
Article
Multi-Sensor Geomagnetic Prospection: A Case Study from Neolithic Thessaly, Greece
by Tuna Kalaycı * and Apostolos Sarris
Laboratory of Geophysical-Remote Sensing & Archaeoenvironment (GeoSat ReSeArch Lab), Foundation for Research & Technology, Hellas (FORTH), Melissinou & Nik. Fora 130, P.O. Box 119, Rethymnon 74100, Crete, Greece
Remote Sens. 2016, 8(11), 966; https://doi.org/10.3390/rs8110966 - 22 Nov 2016
Cited by 10 | Viewed by 6036
Abstract
Multi-sensor prospecting is a fast-emerging paradigm in archaeological geophysics. Given suitable ground conditions for navigation, sensor arrays drastically increase efficiency in data collection. In particular, geomagnetic prospecting benefits from this development. Despite these advancements, data processing still lacks a best-practice approach. Conventional processing [...] Read more.
Multi-sensor prospecting is a fast-emerging paradigm in archaeological geophysics. Given suitable ground conditions for navigation, sensor arrays drastically increase efficiency in data collection. In particular, geomagnetic prospecting benefits from this development. Despite these advancements, data processing still lacks a best-practice approach. Conventional processing methods developed for gridded data has been challenged by sensor arrays “roaming” in the landscape. In realization of the issue, the Innovative Geophysical Approaches for the Study of Early Agricultural Villages of Neolithic Thessaly (IGEAN) Project explored various innovative techniques for the betterment of the multi-sensor geomagnetic data processing. As a result, a modular pipeline is produced with minimal user intervention. In addition to standard steps, such as data clipping, various other algorithms have been introduced. This pipeline is tested over 20 Neolithic settlements in Thessaly, Greece, three of which are presented here in detail. The proposed workflow provides drastic improvements over raw data. As a result of these improvements, the IGEAN project revealed astonishing details on architectural elements, settlement enclosures, and paleolandscapes, changing completely the existing perspective of the Neolithic habitation in Thessaly. Full article
(This article belongs to the Special Issue Archaeological Prospecting and Remote Sensing)
Show Figures

Figure 1

22 pages, 30825 KiB  
Article
Incremental and Enhanced Scanline-Based Segmentation Method for Surface Reconstruction of Sparse LiDAR Data
by Weimin Wang 1,*, Ken Sakurada 1 and Nobuo Kawaguchi 1,2
1 Graduate School of Engineering, Nagoya University, Furo-cho, Chikusa-ku, Nagoya 464-8601, Japan
2 Institutes of Innovation for Future Society, Nagoya University, Furo-cho, Chikusa-ku, Nagoya 464-8601, Japan
Remote Sens. 2016, 8(11), 967; https://doi.org/10.3390/rs8110967 - 22 Nov 2016
Cited by 19 | Viewed by 9200
Abstract
The segmentation of point clouds is an important aspect of automated processing tasks such as semantic extraction. However, the sparsity and non-uniformity of the point clouds gathered by the popular 3D mobile LiDAR devices pose many challenges for existing segmentation methods. To improve [...] Read more.
The segmentation of point clouds is an important aspect of automated processing tasks such as semantic extraction. However, the sparsity and non-uniformity of the point clouds gathered by the popular 3D mobile LiDAR devices pose many challenges for existing segmentation methods. To improve the segmentation results of point clouds from mobile LiDAR devices, we propose an optimized segmentation method based on Scanline Continuity Constraint (SLCC) in this work. Unlike conventional scanline-based segmentation methods, SLCC clusters scanlines using the continuity constraints in terms of the distance as well as the direction of two consecutive points. In addition, scanline clusters are agglomerated not only into primitive geometrical shapes but also irregular shapes. Another downside to existing segmentation methods is that they are not capable of incremental processing. This causes unnecessary memory and time consumption for applications that require frame-wise segmentation or when new point clouds are added. In order to address this, we propose an incremental scheme—the Incremental Recursive Segmentation (IRIS), that can be easily applied to any segmentation method. IRIS is achieved by combining the segments of newly added point clouds and the previously segmented results. Furthermore, as an example application, we construct a processing pipeline consisting of plane fitting and surface reconstruction using the segmentation results. Finally, we evaluate the proposed methods on three datasets acquired from a handheld Velodyne HDL-32E LiDAR device. The experimental results verify the efficiency of IRIS for any segmentation method and the advantages of SLCC for processing mobile LiDAR data. Full article
Show Figures

Graphical abstract

18 pages, 3301 KiB  
Article
Biomass Estimation Using 3D Data from Unmanned Aerial Vehicle Imagery in a Tropical Woodland
by Daud Jones Kachamba 1,*, Hans Ole Ørka 1, Terje Gobakken 1, Tron Eid 1 and Weston Mwase 2
1 Department of Ecology and Natural Resource Management, Norwegian University of Life Sciences, P.O. Box 5003, NO-1432 Ås, Norway
2 Department of Forestry, Lilongwe University of Agriculture & Natural Resources, P.O. Box 219, Lilongwe, Malawi
Remote Sens. 2016, 8(11), 968; https://doi.org/10.3390/rs8110968 - 23 Nov 2016
Cited by 103 | Viewed by 12732
Abstract
Application of 3D data derived from images captured using unmanned aerial vehicles (UAVs) in forest biomass estimation has shown great potential in reducing costs and improving the estimates. However, such data have never been tested in miombo woodlands. UAV-based biomass estimation relies on [...] Read more.
Application of 3D data derived from images captured using unmanned aerial vehicles (UAVs) in forest biomass estimation has shown great potential in reducing costs and improving the estimates. However, such data have never been tested in miombo woodlands. UAV-based biomass estimation relies on the availability of reliable digital terrain models (DTMs). The main objective of this study was to evaluate application of 3D data derived from UAV imagery in biomass estimation and to compare impacts of DTMs generated based on different methods and parameter settings. Biomass was modeled using data acquired from 107 sample plots in a forest reserve in miombo woodlands of Malawi. The results indicated that there are no significant differences (p = 0.985) between tested DTMs except for that based on shuttle radar topography mission (SRTM). A model developed using unsupervised ground filtering based on a grid search approach, had the smallest root mean square error (RMSE) of 46.7% of a mean biomass value of 38.99 Mg·ha−1. Amongst the independent variables, maximum canopy height (Hmax) was the most frequently selected. In addition, all models included spectral variables incorporating the three color bands red, green and blue. The study has demonstrated that UAV acquired image data can be used in biomass estimation in miombo woodlands using automatically generated DTMs. Full article
(This article belongs to the Special Issue Recent Trends in UAV Remote Sensing)
Show Figures

Graphical abstract

23 pages, 10174 KiB  
Article
Estimation of Building Density with the Integrated Use of GF-1 PMS and Radarsat-2 Data
by Yi Zhou 1, Chenxi Lin 1,2,*, Shixin Wang 1, Wenliang Liu 1 and Ye Tian 1,2
1 Institute of Remote Sensing and Digital Earth, Chinese Academy of Sciences, Beijing 100101, China
2 University of Chinese Academy of Sciences, Beijing 100049, China
Remote Sens. 2016, 8(11), 969; https://doi.org/10.3390/rs8110969 - 23 Nov 2016
Cited by 16 | Viewed by 7671
Abstract
Building density, as a component of impervious surface fraction, is a significant indicator of population distribution as essentially all humans live and conduct activities in buildings. Because population spatialization usually occurs over large areas, large-scale building density estimation through a proper, time-efficient, and [...] Read more.
Building density, as a component of impervious surface fraction, is a significant indicator of population distribution as essentially all humans live and conduct activities in buildings. Because population spatialization usually occurs over large areas, large-scale building density estimation through a proper, time-efficient, and relatively precise way is urgently required. Therefore, this study constructed a decision tree by the Classification and Regression Tree (CART) algorithm combining synthetic aperture radar (SAR) with optical images. The input features included four spectral bands (B14) of GF-1 PMS imagery; Normalized Difference Vegetation Index (NDVI), Normalized Difference Water Index (NDWI), and Ratio Built-up Index (RBI) derived from them; and backscatter intensity (BI) of Radarsat-2 SAR data. In addition, a new index called amended backscatter intensity (ABI), which takes the influence created by different spatial patterns into account, was introduced and calculated through fractal dimension and lacunarity. Result showed that before the integration use of multisource data, a model using B14, NDVI, NDWI, and RBI had the highest accuracy, with RMSE of 10.28 and R2 of 0.63 for Jizhou and RMSE of 20.34 and R2 of 0.36 for Beijing. In Comparison, the best model after combining two data sources (i.e., the model employing B14, NDVI, NDWI, RBI and ABI) reduced the RMSE to 8.93 and 16.21 raised the R2 to 0.80 and 0.64, respectively. The result indicated that the synergistic use of optical and SAR data has the potential to improve the building density estimation performance and the addition of ABI has a better capacity for improving the model than other input features. Full article
Show Figures

Graphical abstract

23 pages, 8015 KiB  
Article
Modeling and Reconstruction of Time Series of Passive Microwave Data by Discrete Fourier Transform Guided Filtering and Harmonic Analysis
by Haolu Shang 1,2,3, Li Jia 1,3,* and Massimo Menenti 1,2,*
1 State Key Laboratory of Remote Sensing Science, Institute of Remote Sensing and Digital Earth, Chinese Academy of Sciences, Beijing 100101, China
2 Faculty of Civil Engineering and Geosciences, Delft University of Technology, 2600 GA Delft, The Netherlands
3 Joint Center for Global Change Studies (JCGCS), Beijing 100875, China
Remote Sens. 2016, 8(11), 970; https://doi.org/10.3390/rs8110970 - 23 Nov 2016
Cited by 4 | Viewed by 6170
Abstract
Daily time series of microwave radiometer data obtained in one-orbit direction are full of observation gaps due to satellite configuration and errors from spatial sampling. Such time series carry information about the surface signal including surface emittance and vegetation attenuation, and the atmospheric [...] Read more.
Daily time series of microwave radiometer data obtained in one-orbit direction are full of observation gaps due to satellite configuration and errors from spatial sampling. Such time series carry information about the surface signal including surface emittance and vegetation attenuation, and the atmospheric signal including atmosphere emittance and atmospheric attenuation. To extract the surface signal from this noisy time series, the Time Series Analysis Procedure (TSAP) was developed, based on the properties of the Discrete Fourier Transform (DFT). TSAP includes two stages: (1) identify the spectral features of observation gaps and errors and remove them with a modified boxcar filter; and (2) identify the spectral features of the surface signal and reconstruct it with the Harmonic Analysis of Time Series (HANTS) algorithm. Polarization Difference Brightness Temperature (PDBT) at 37 GHz data were used to illustrate the problems, to explain the implementation of TSAP and to validate this method, due to the PDBT sensitivity to the water content both at the land surface and in the atmosphere. We carried out a case study on a limited heterogeneous crop land and lake area, where the power spectrum of the PDBT time series showed that the harmonic components associated with observation gaps and errors have periods ≤8 days. After applying the modified boxcar filter with a length of 10 days, the RMSD between raw and filtered time series was above 11 K, mainly related to the power reduction in the frequency range associated with observation gaps and errors. Noise reduction is beneficial when applying PDBT observations to monitor wet areas and open water, since the PDBT range between dryland and open water is about 20 K. The spectral features of the atmospheric signal can be revealed by time series analysis of rain-gauge data, since the PDBT at 37 GHz is mainly attenuated by hydrometeors that yield precipitation. Thus, the spectral features of the surface signal were identified in the PDBT time series with the help of the rain-gauge data. HANTS reconstructed the upper envelope of the signal, i.e., correcting for atmospheric influence, while retaining the spectral features of the surface signal. To evaluate the impact of TSAP on retrieval accuracy, the fraction of Water Saturated Surface (WSS) in the region of Poyang Lake was retrieved with 37 GHz observations. The retrievals were evaluated against estimations of the lake area obtained with MODerate-resolution Imaging Spectroradiometer (MODIS) and Advanced Synthetic Aperture Radar (ASAR) data. The Relative RMSE on WSS was 39.5% with unfiltered data and 23% after applying TSAP, i.e., using the estimated surface signal only. Full article
Show Figures

Figure 1

Previous Issue
Next Issue
Back to TopTop