
Multi-Sensor Geomagnetic Prospection: A Case Study from Neolithic Thessaly, Greece


Abstract
:1. Introduction
2. State-of-the-Art
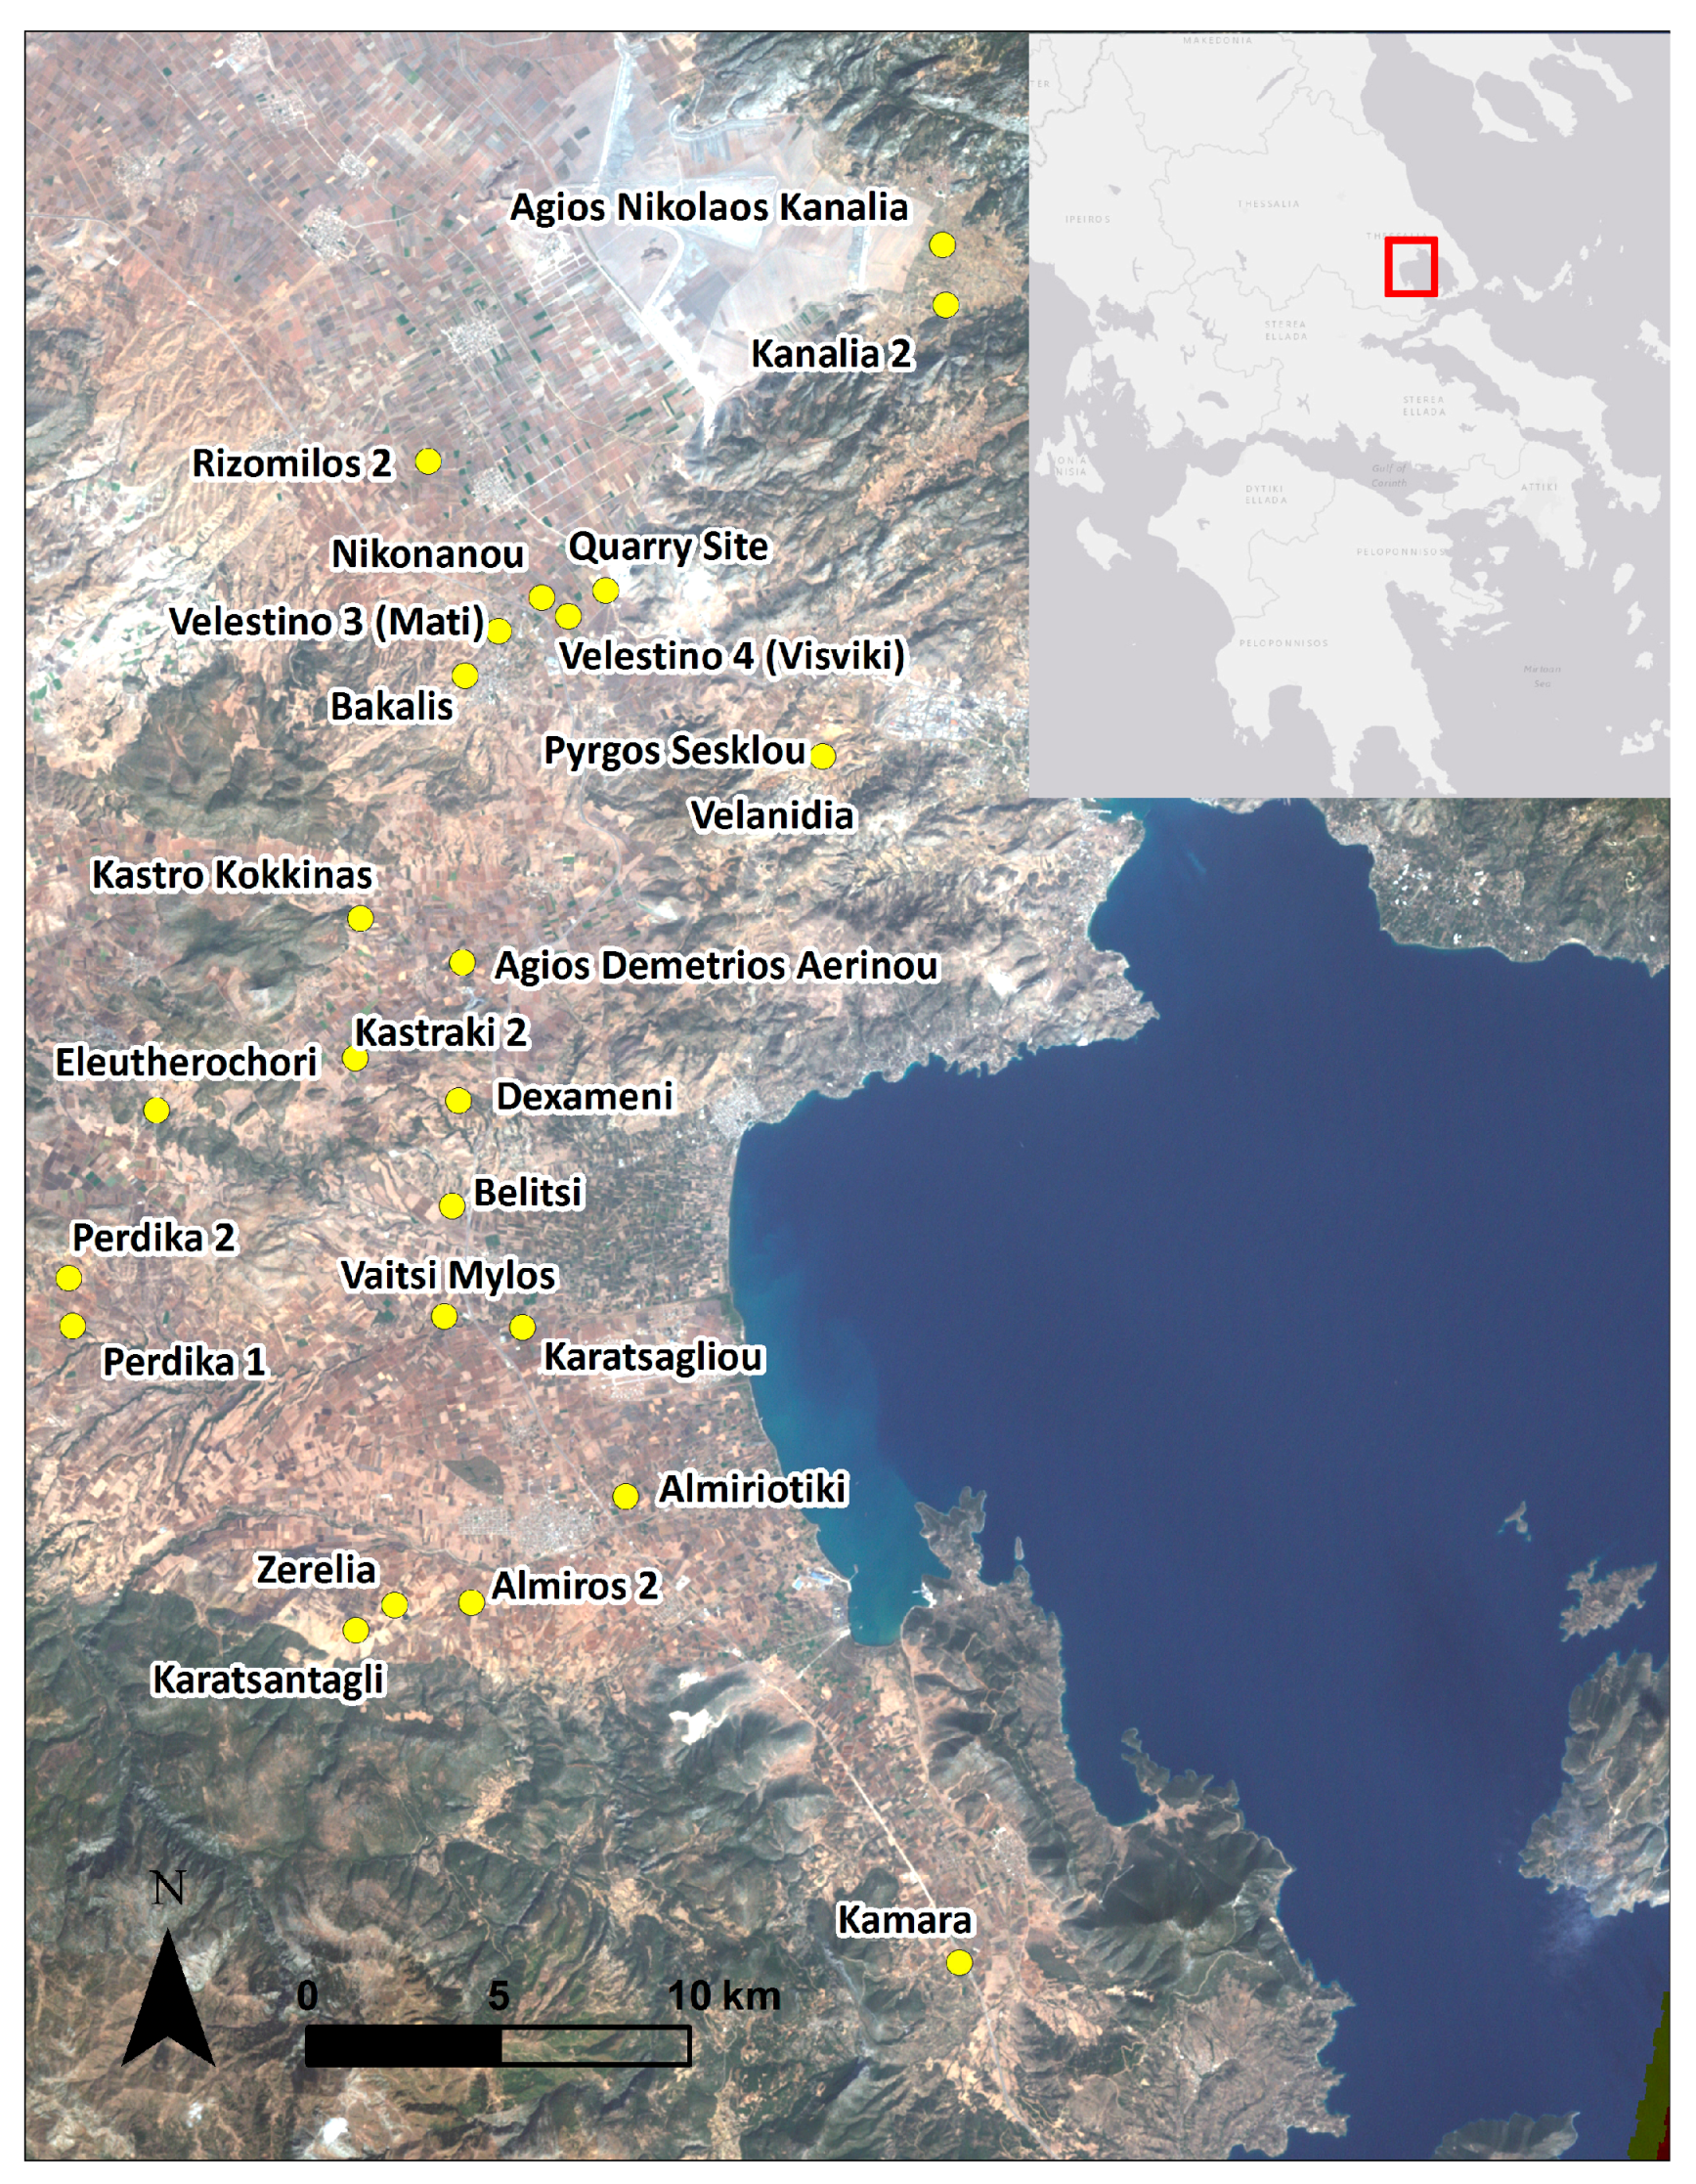
3. Study Area and Previous Research
4. Methodology
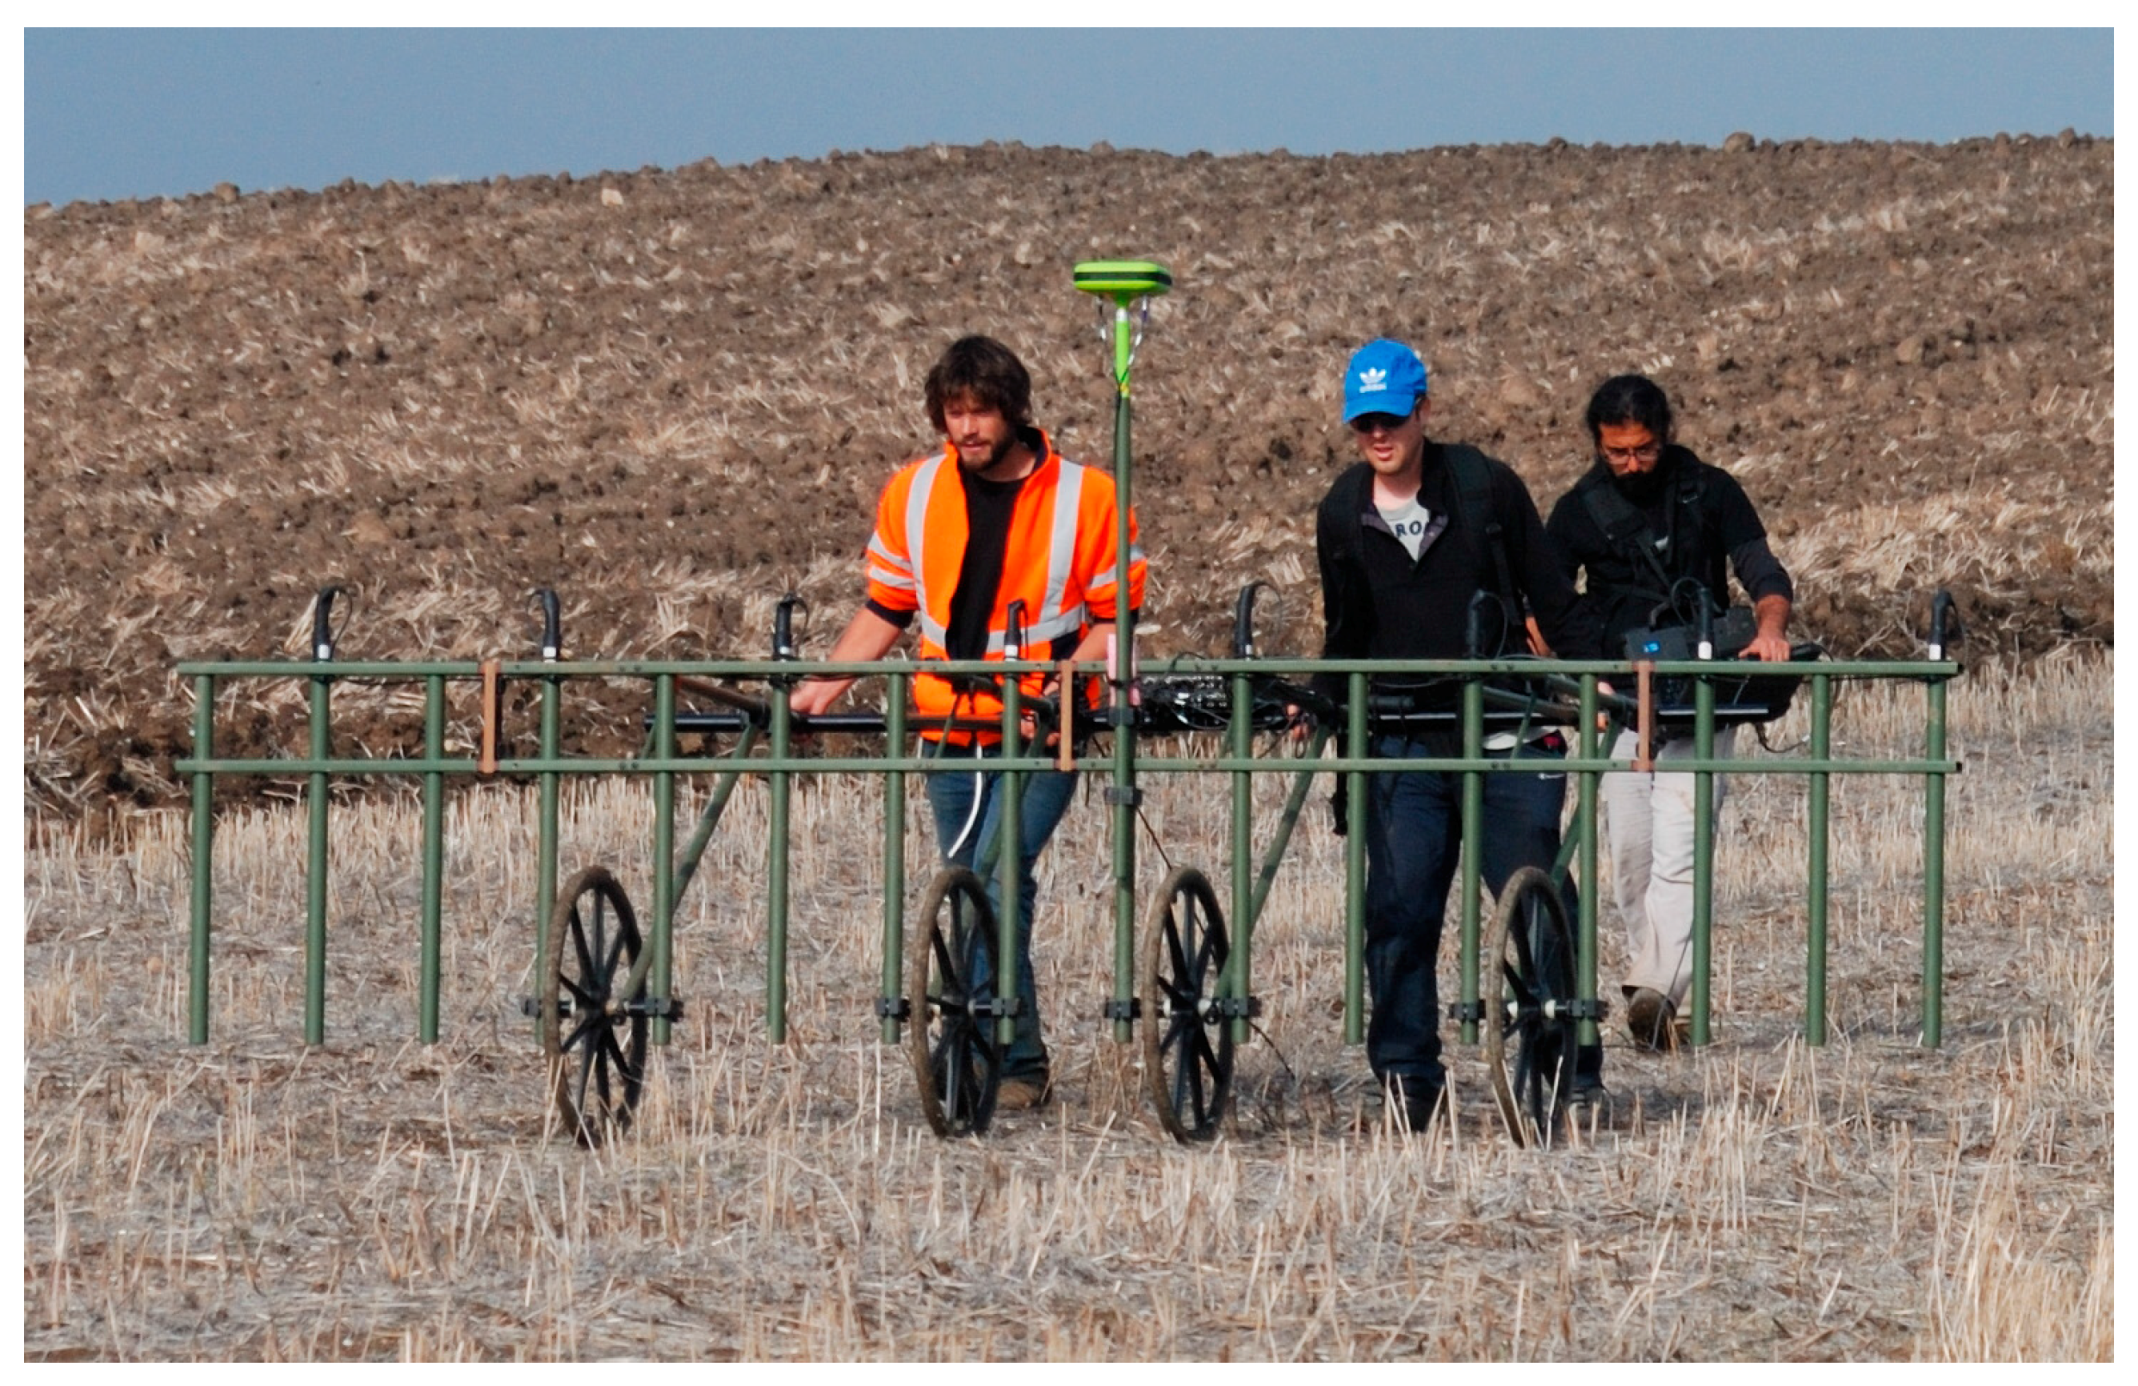
4.1. Instrumentation
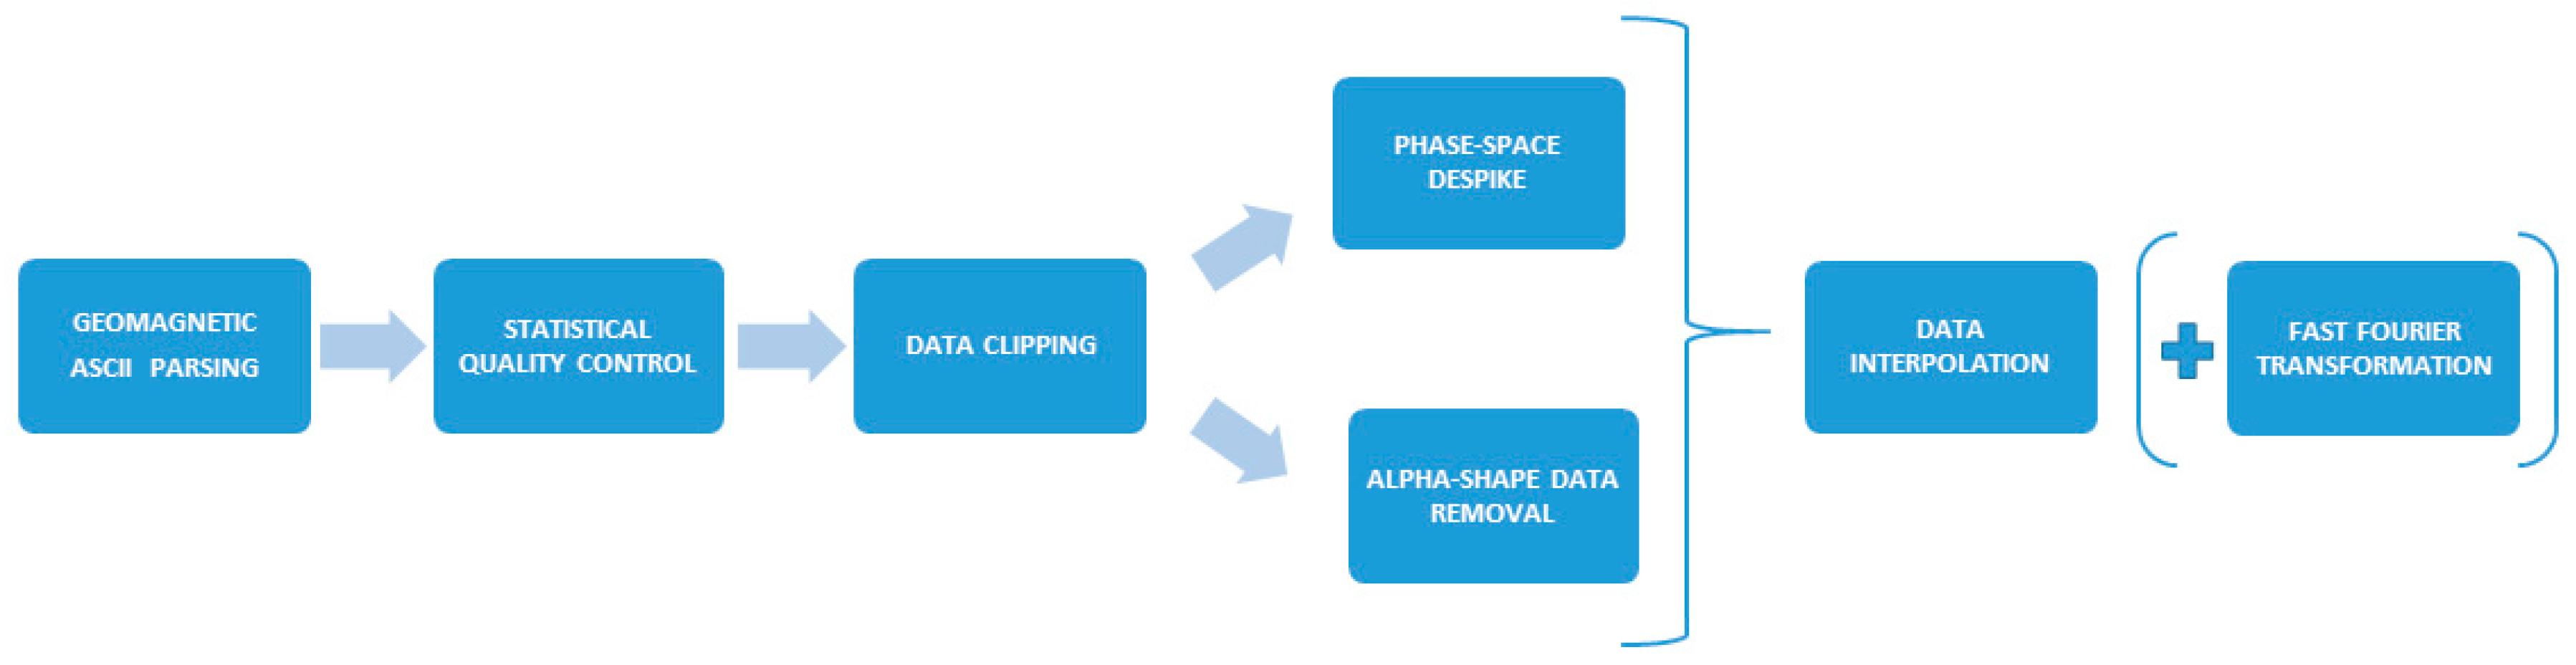
4.2. Data Analysis
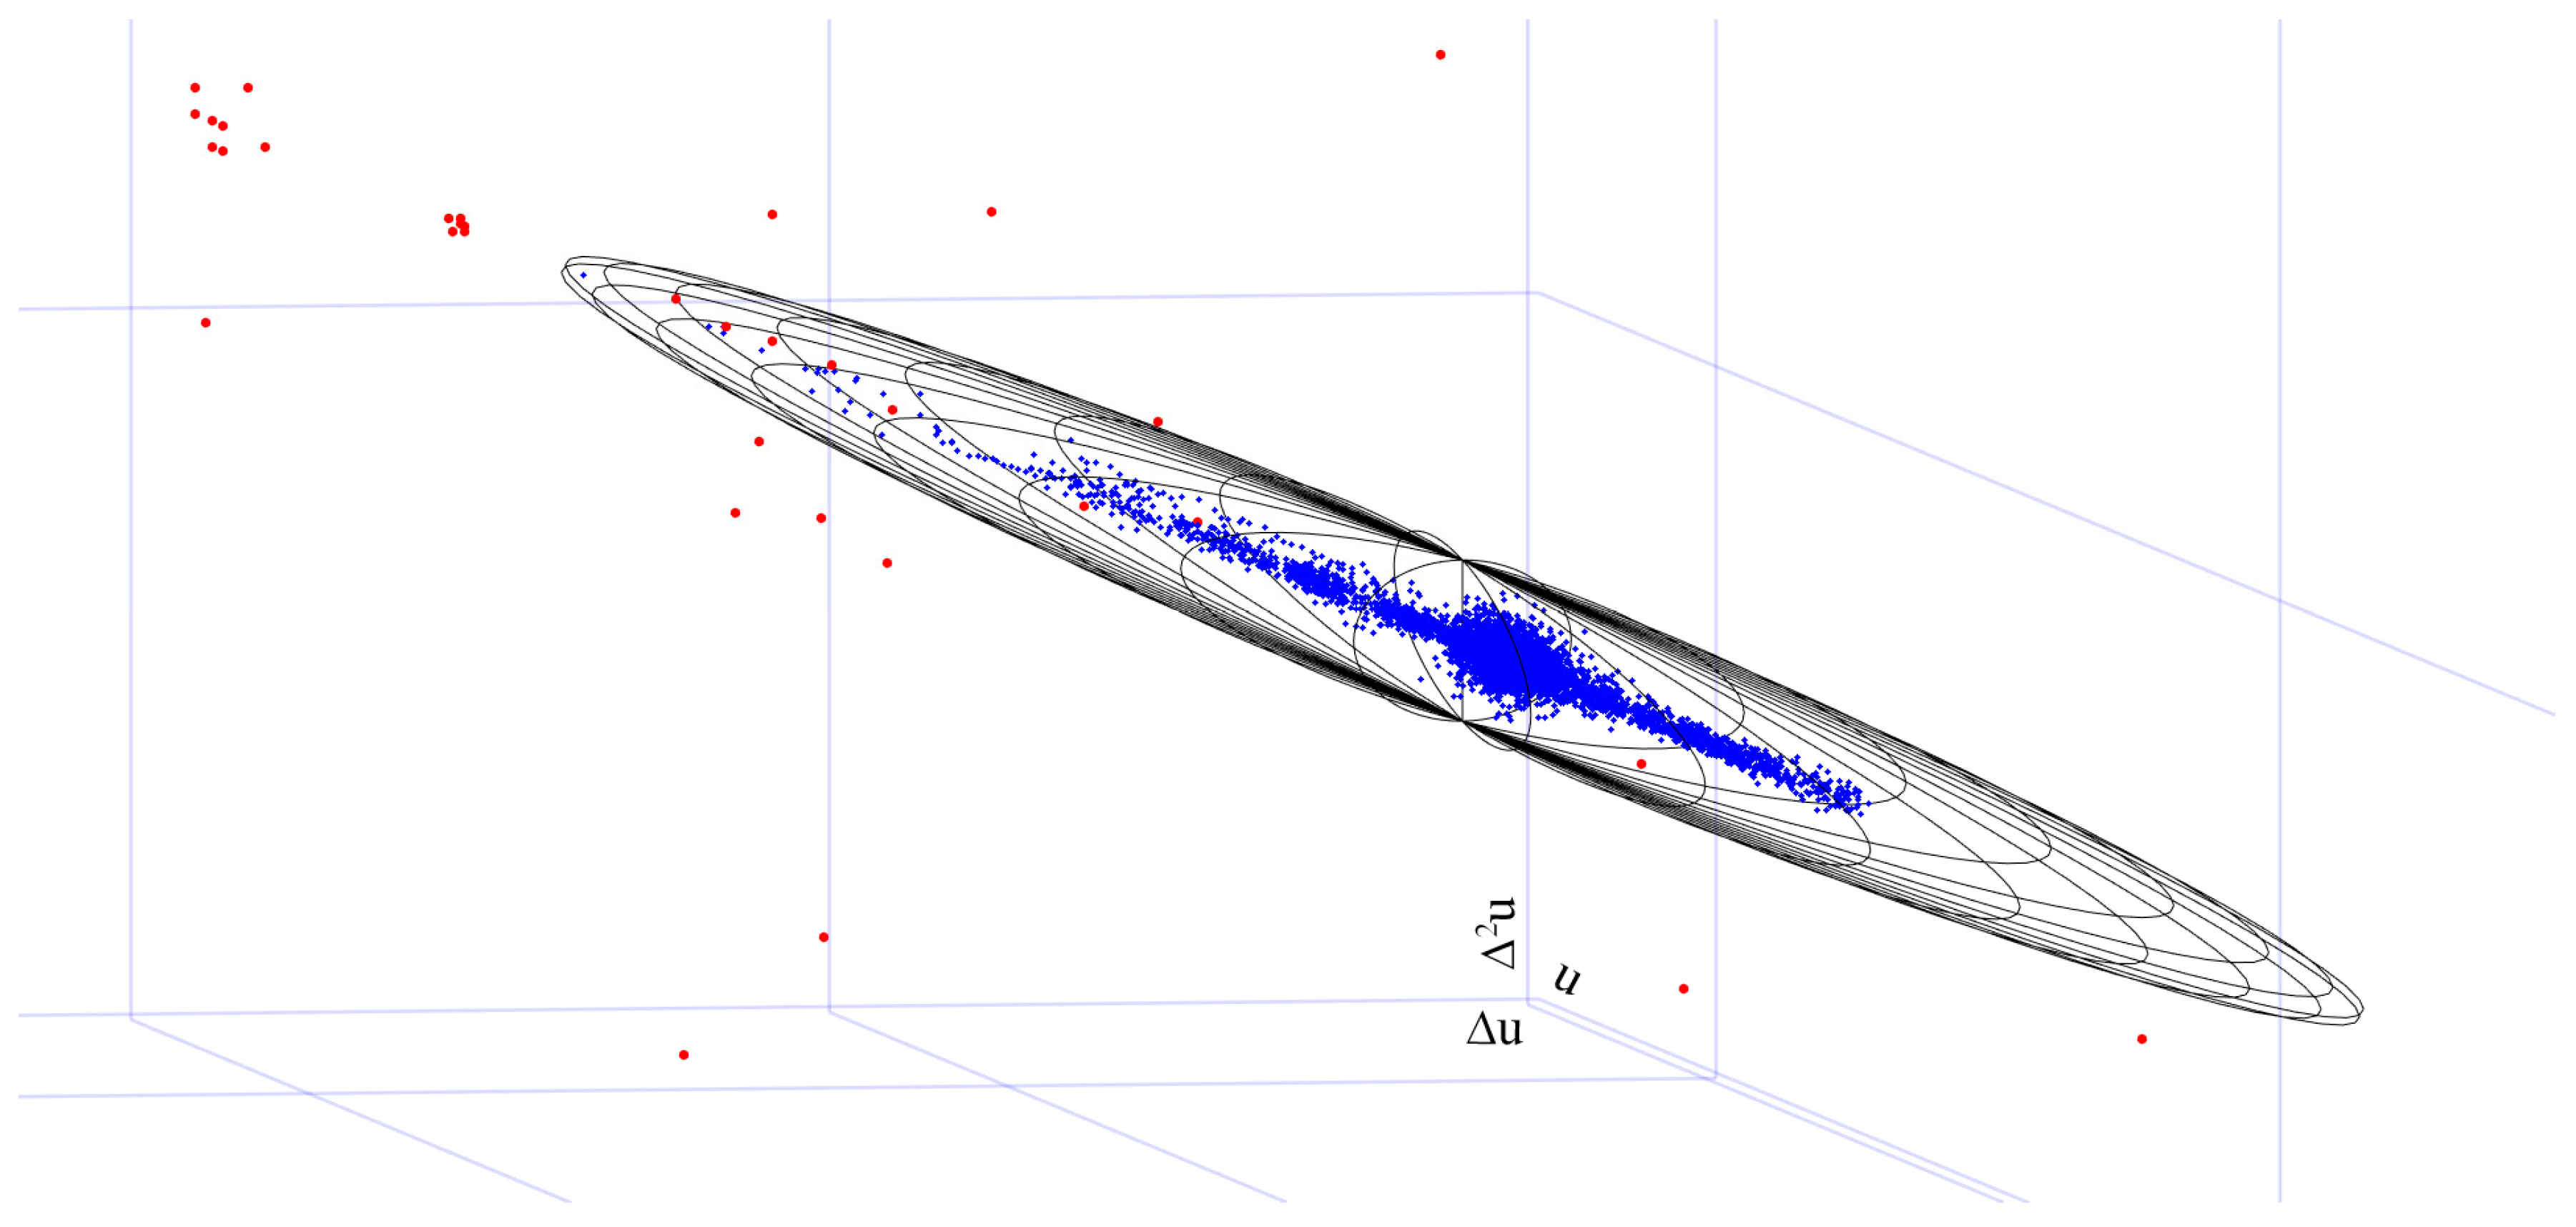
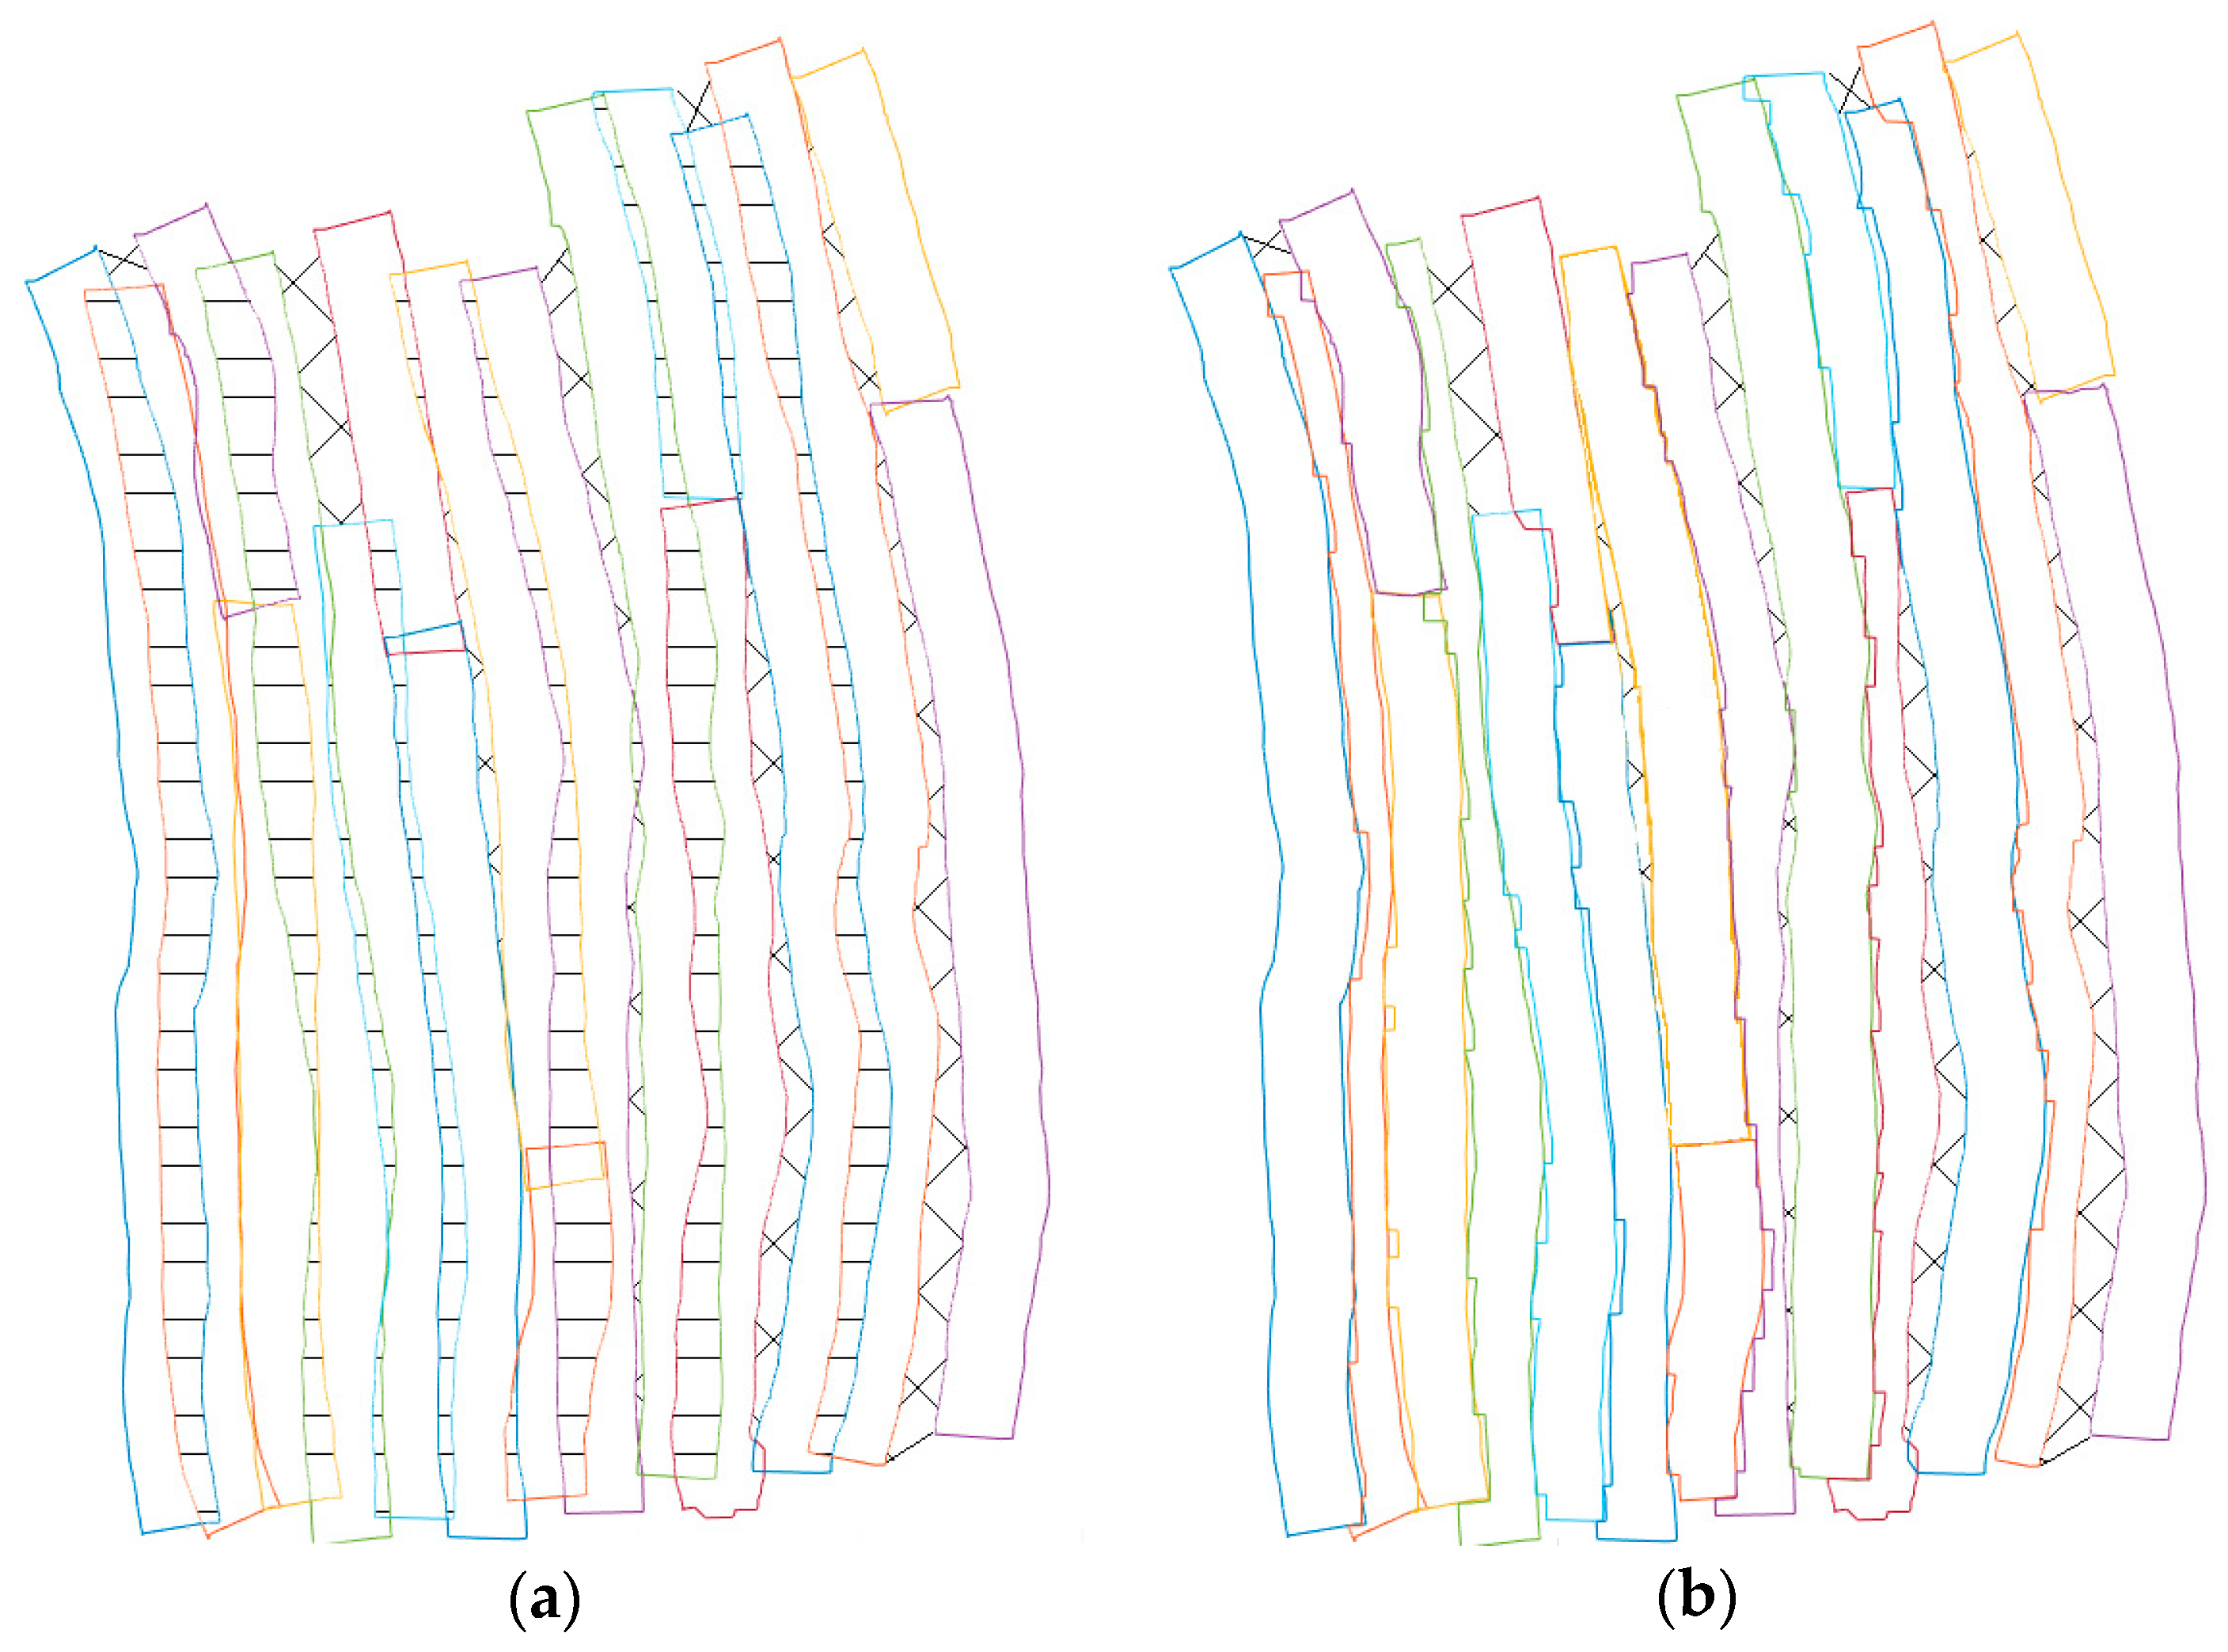
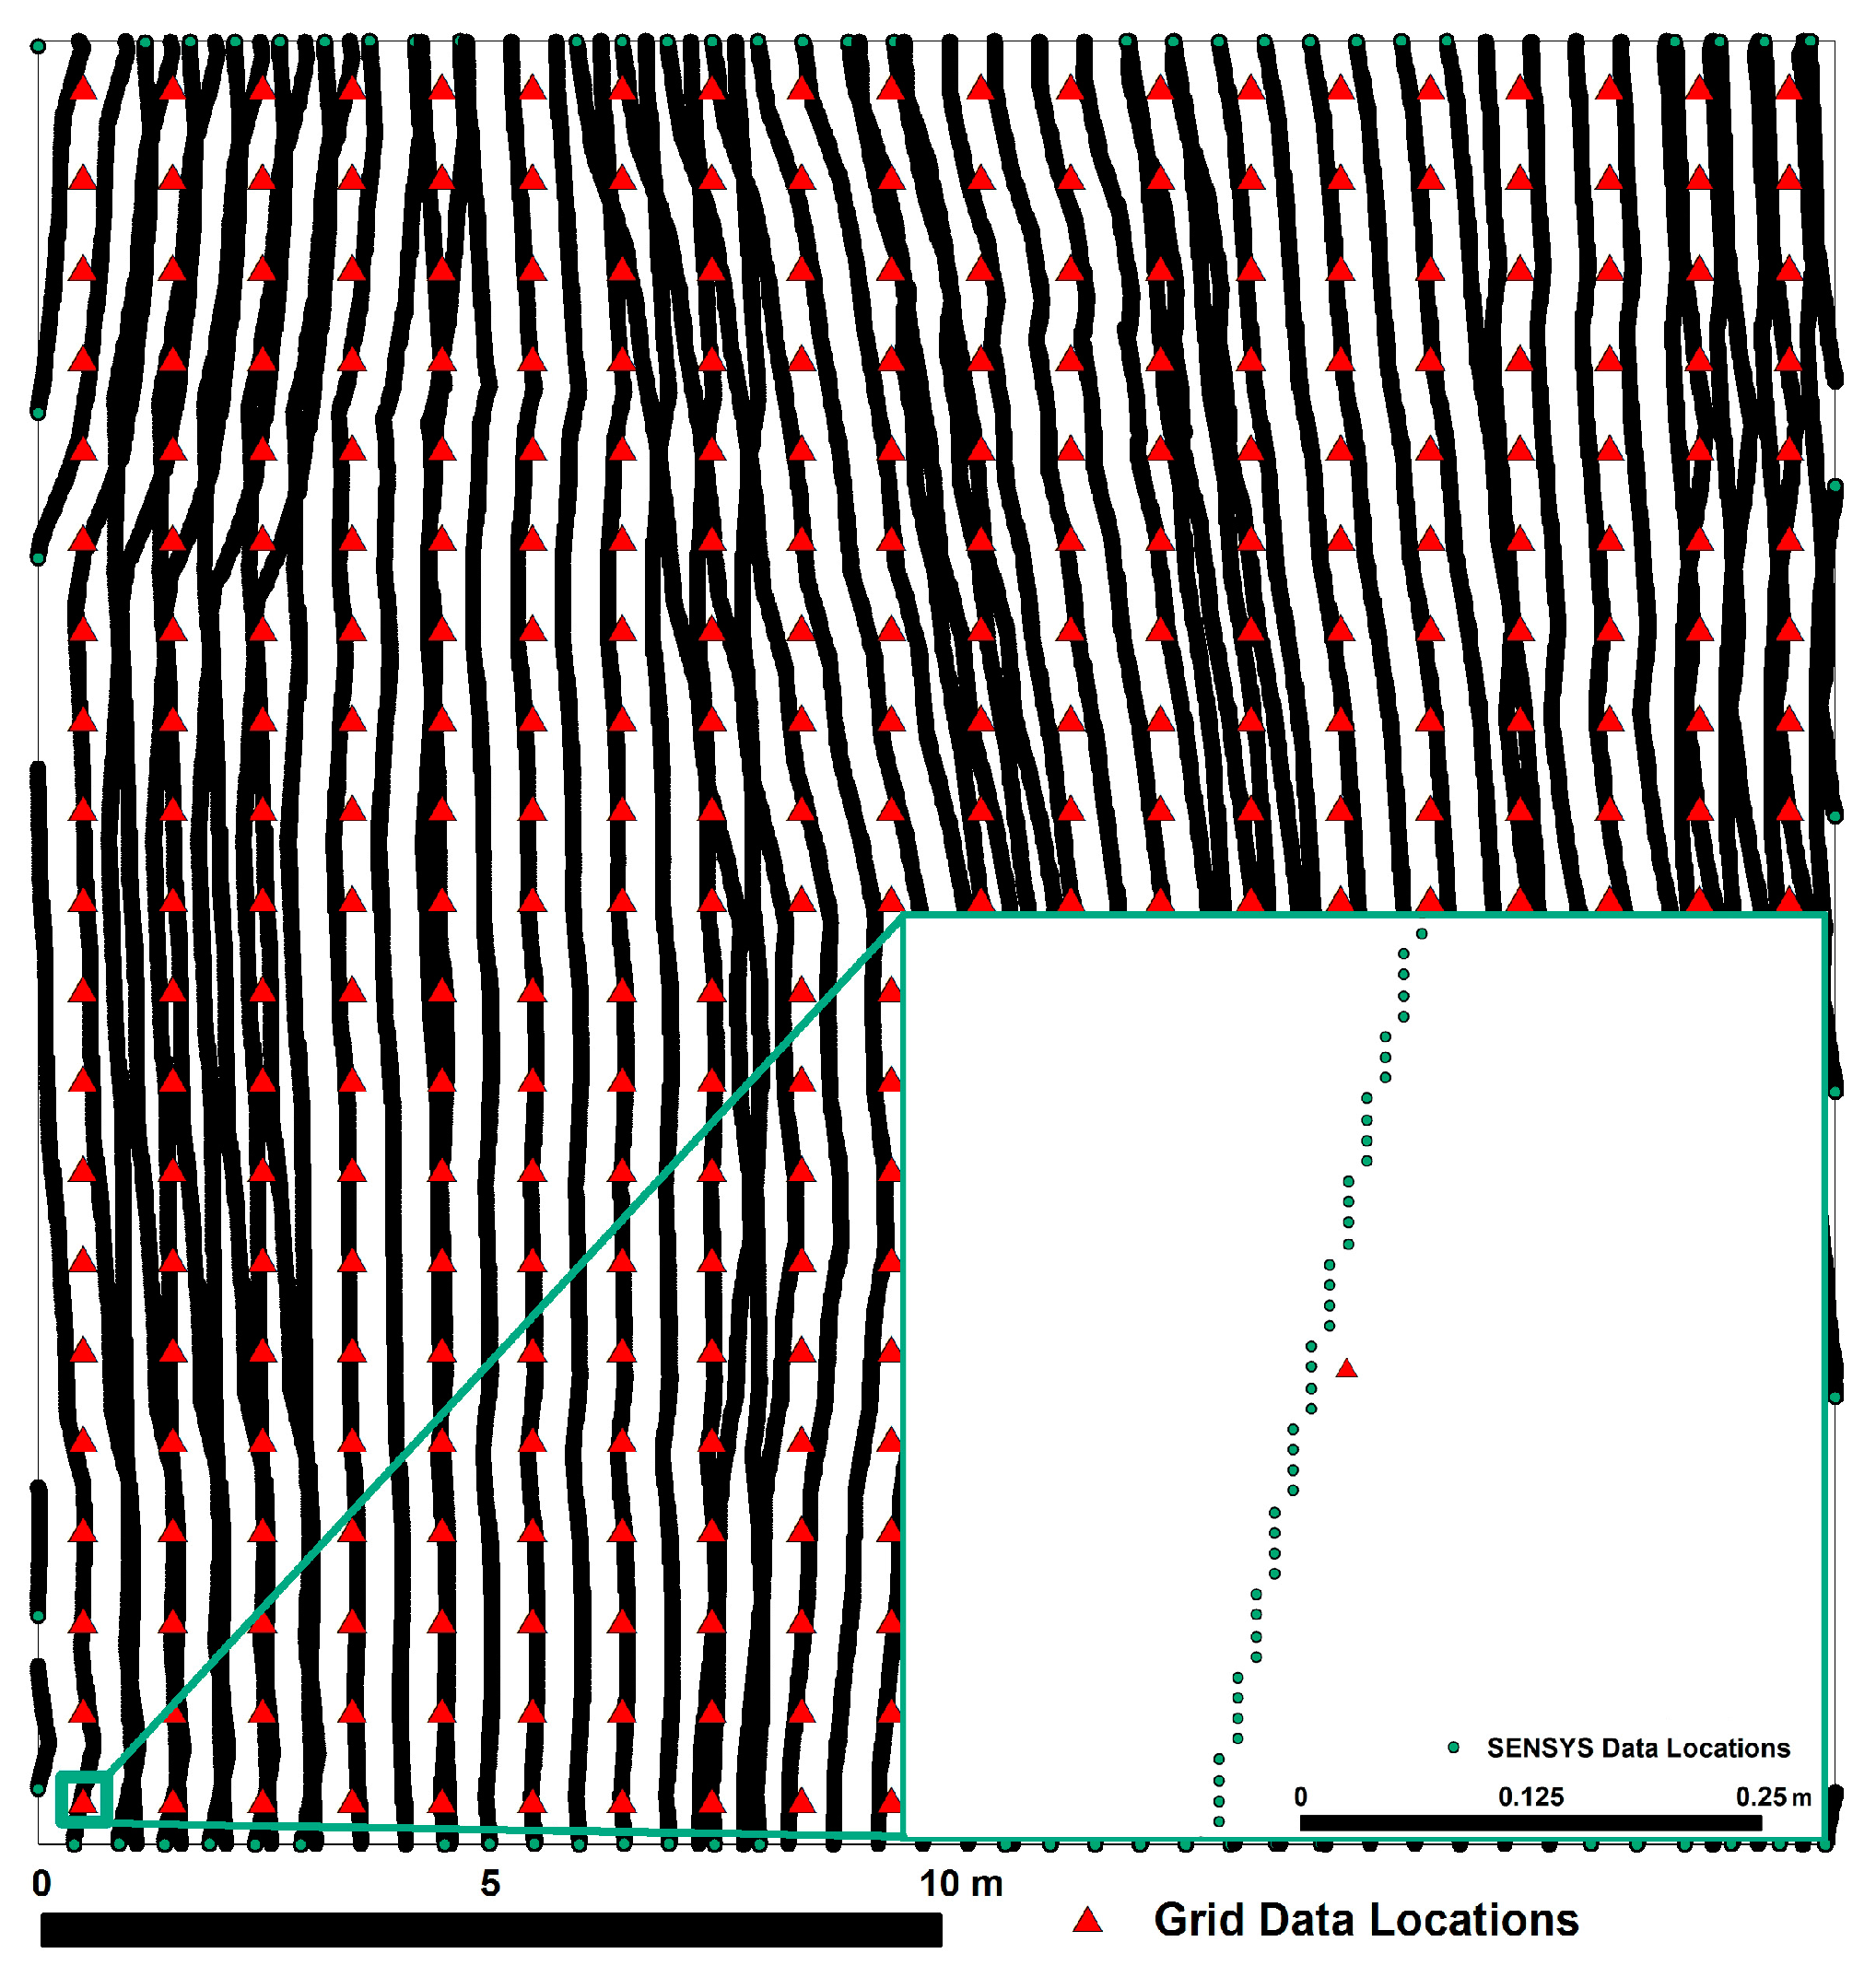
4.2.1. Outlier Removal Based on Space-Phase Method
4.2.2. Data Sparsing Based on Alpha Shapes
5. Results
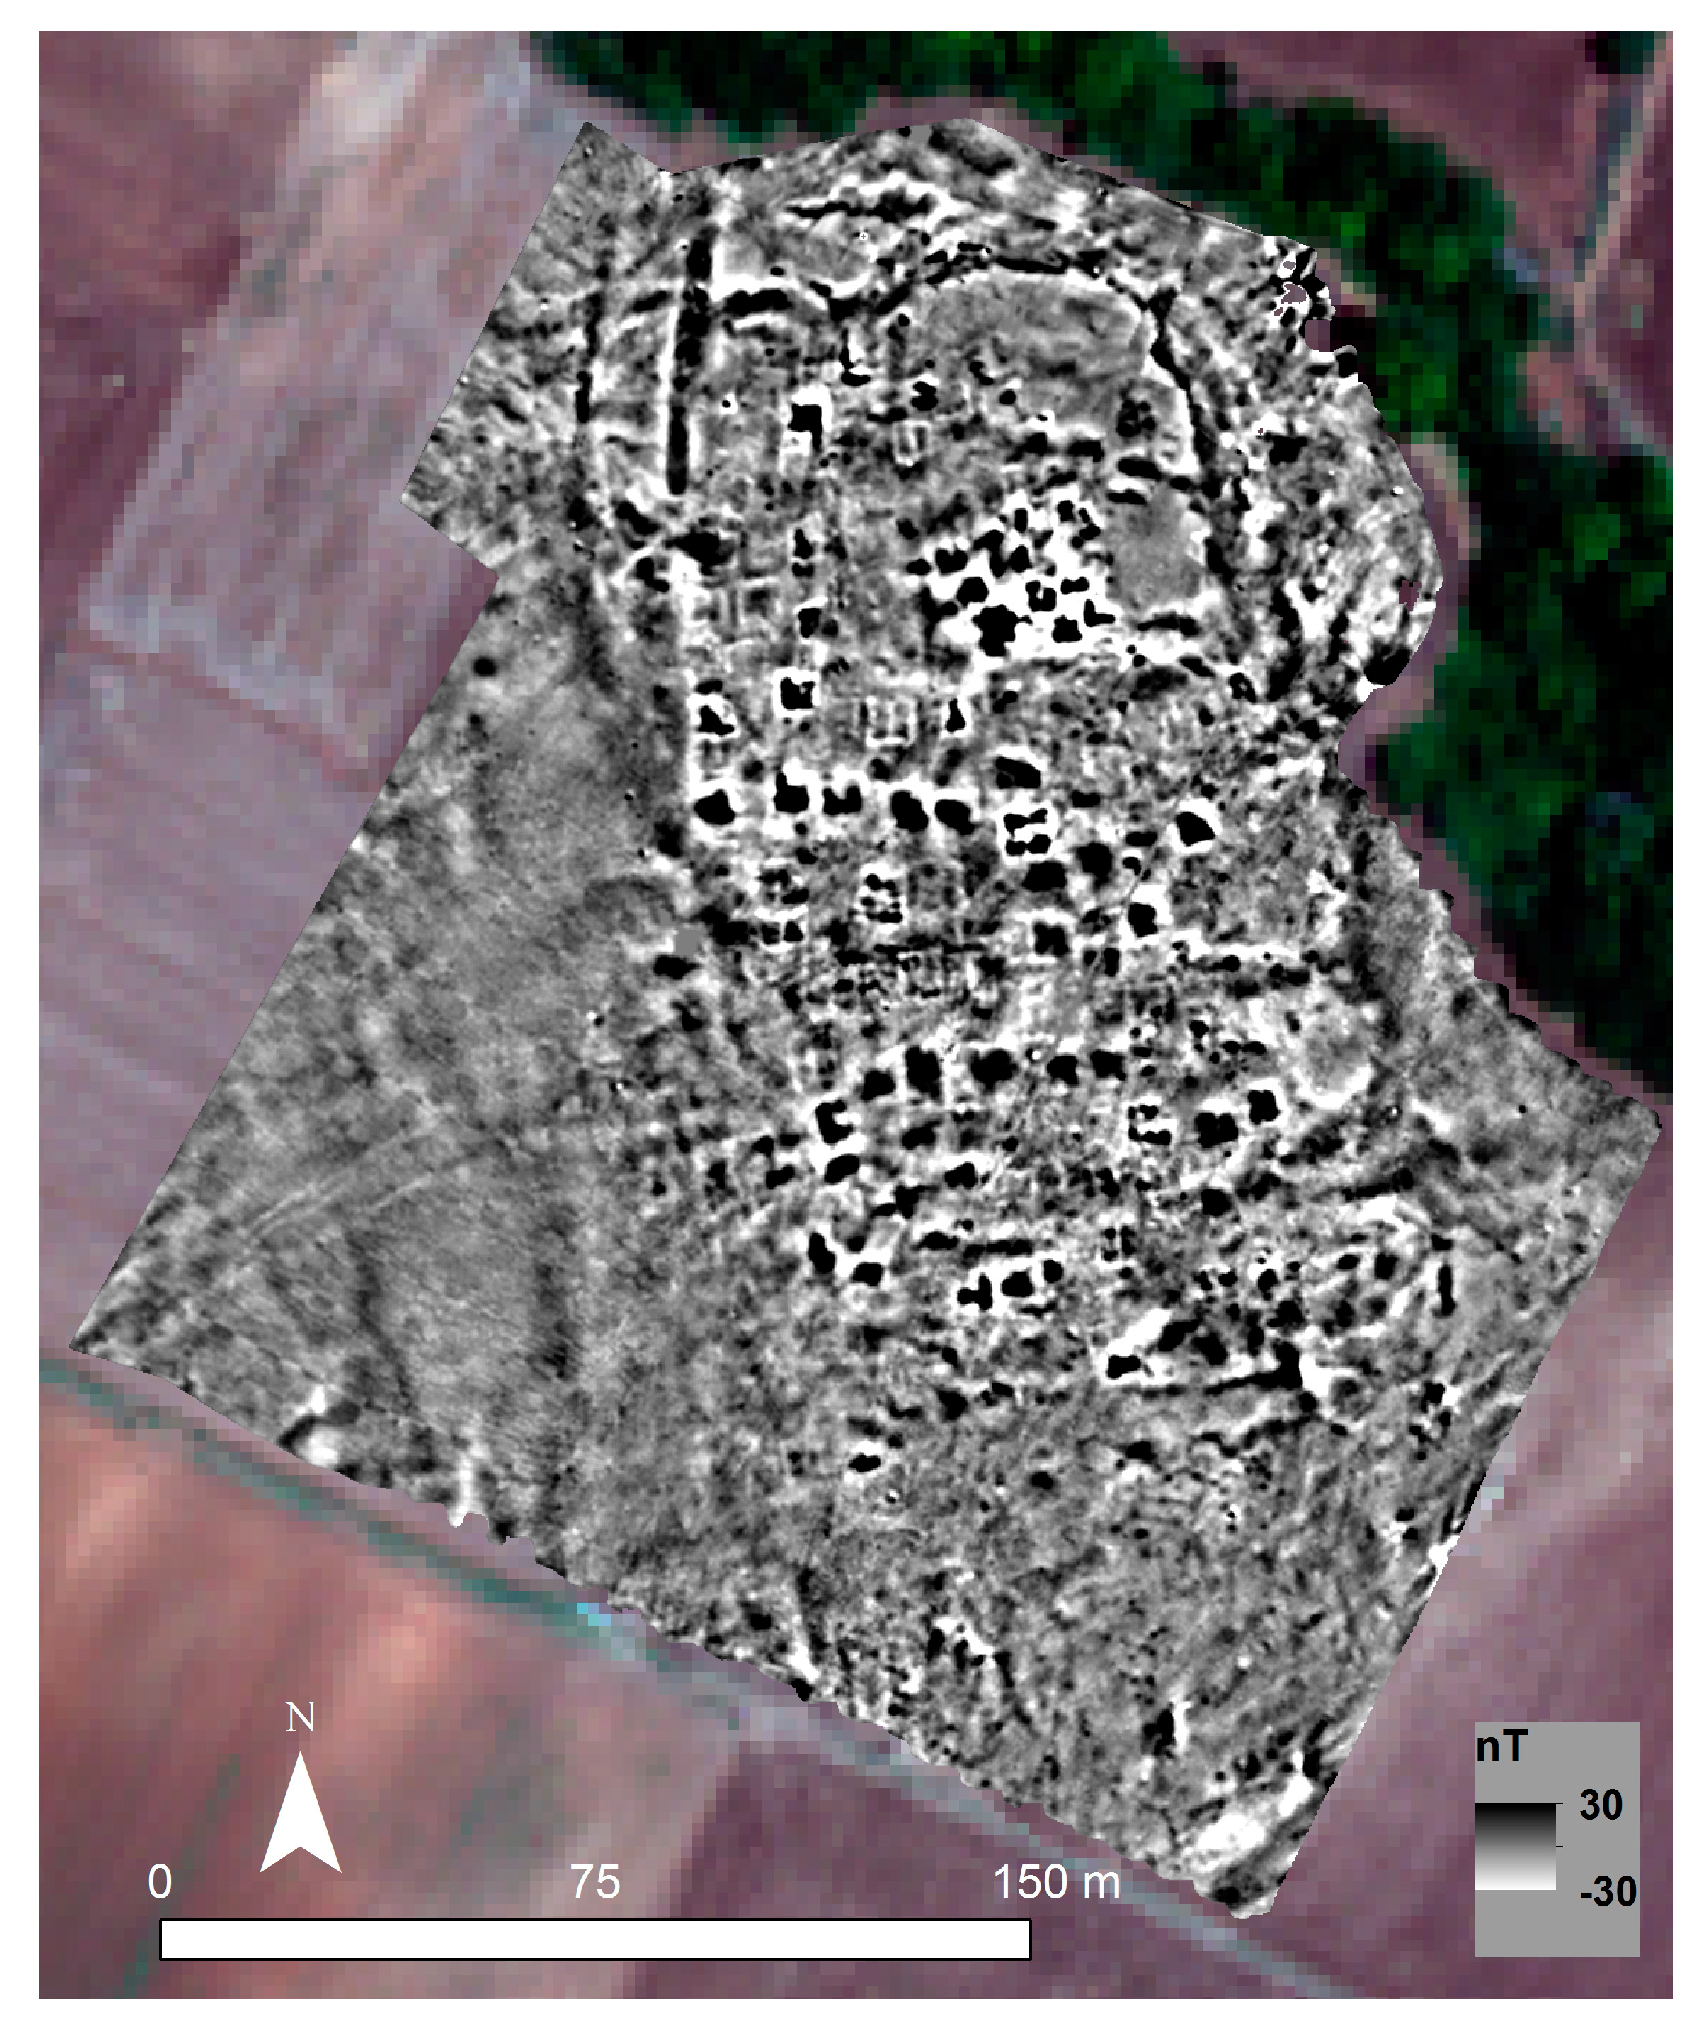
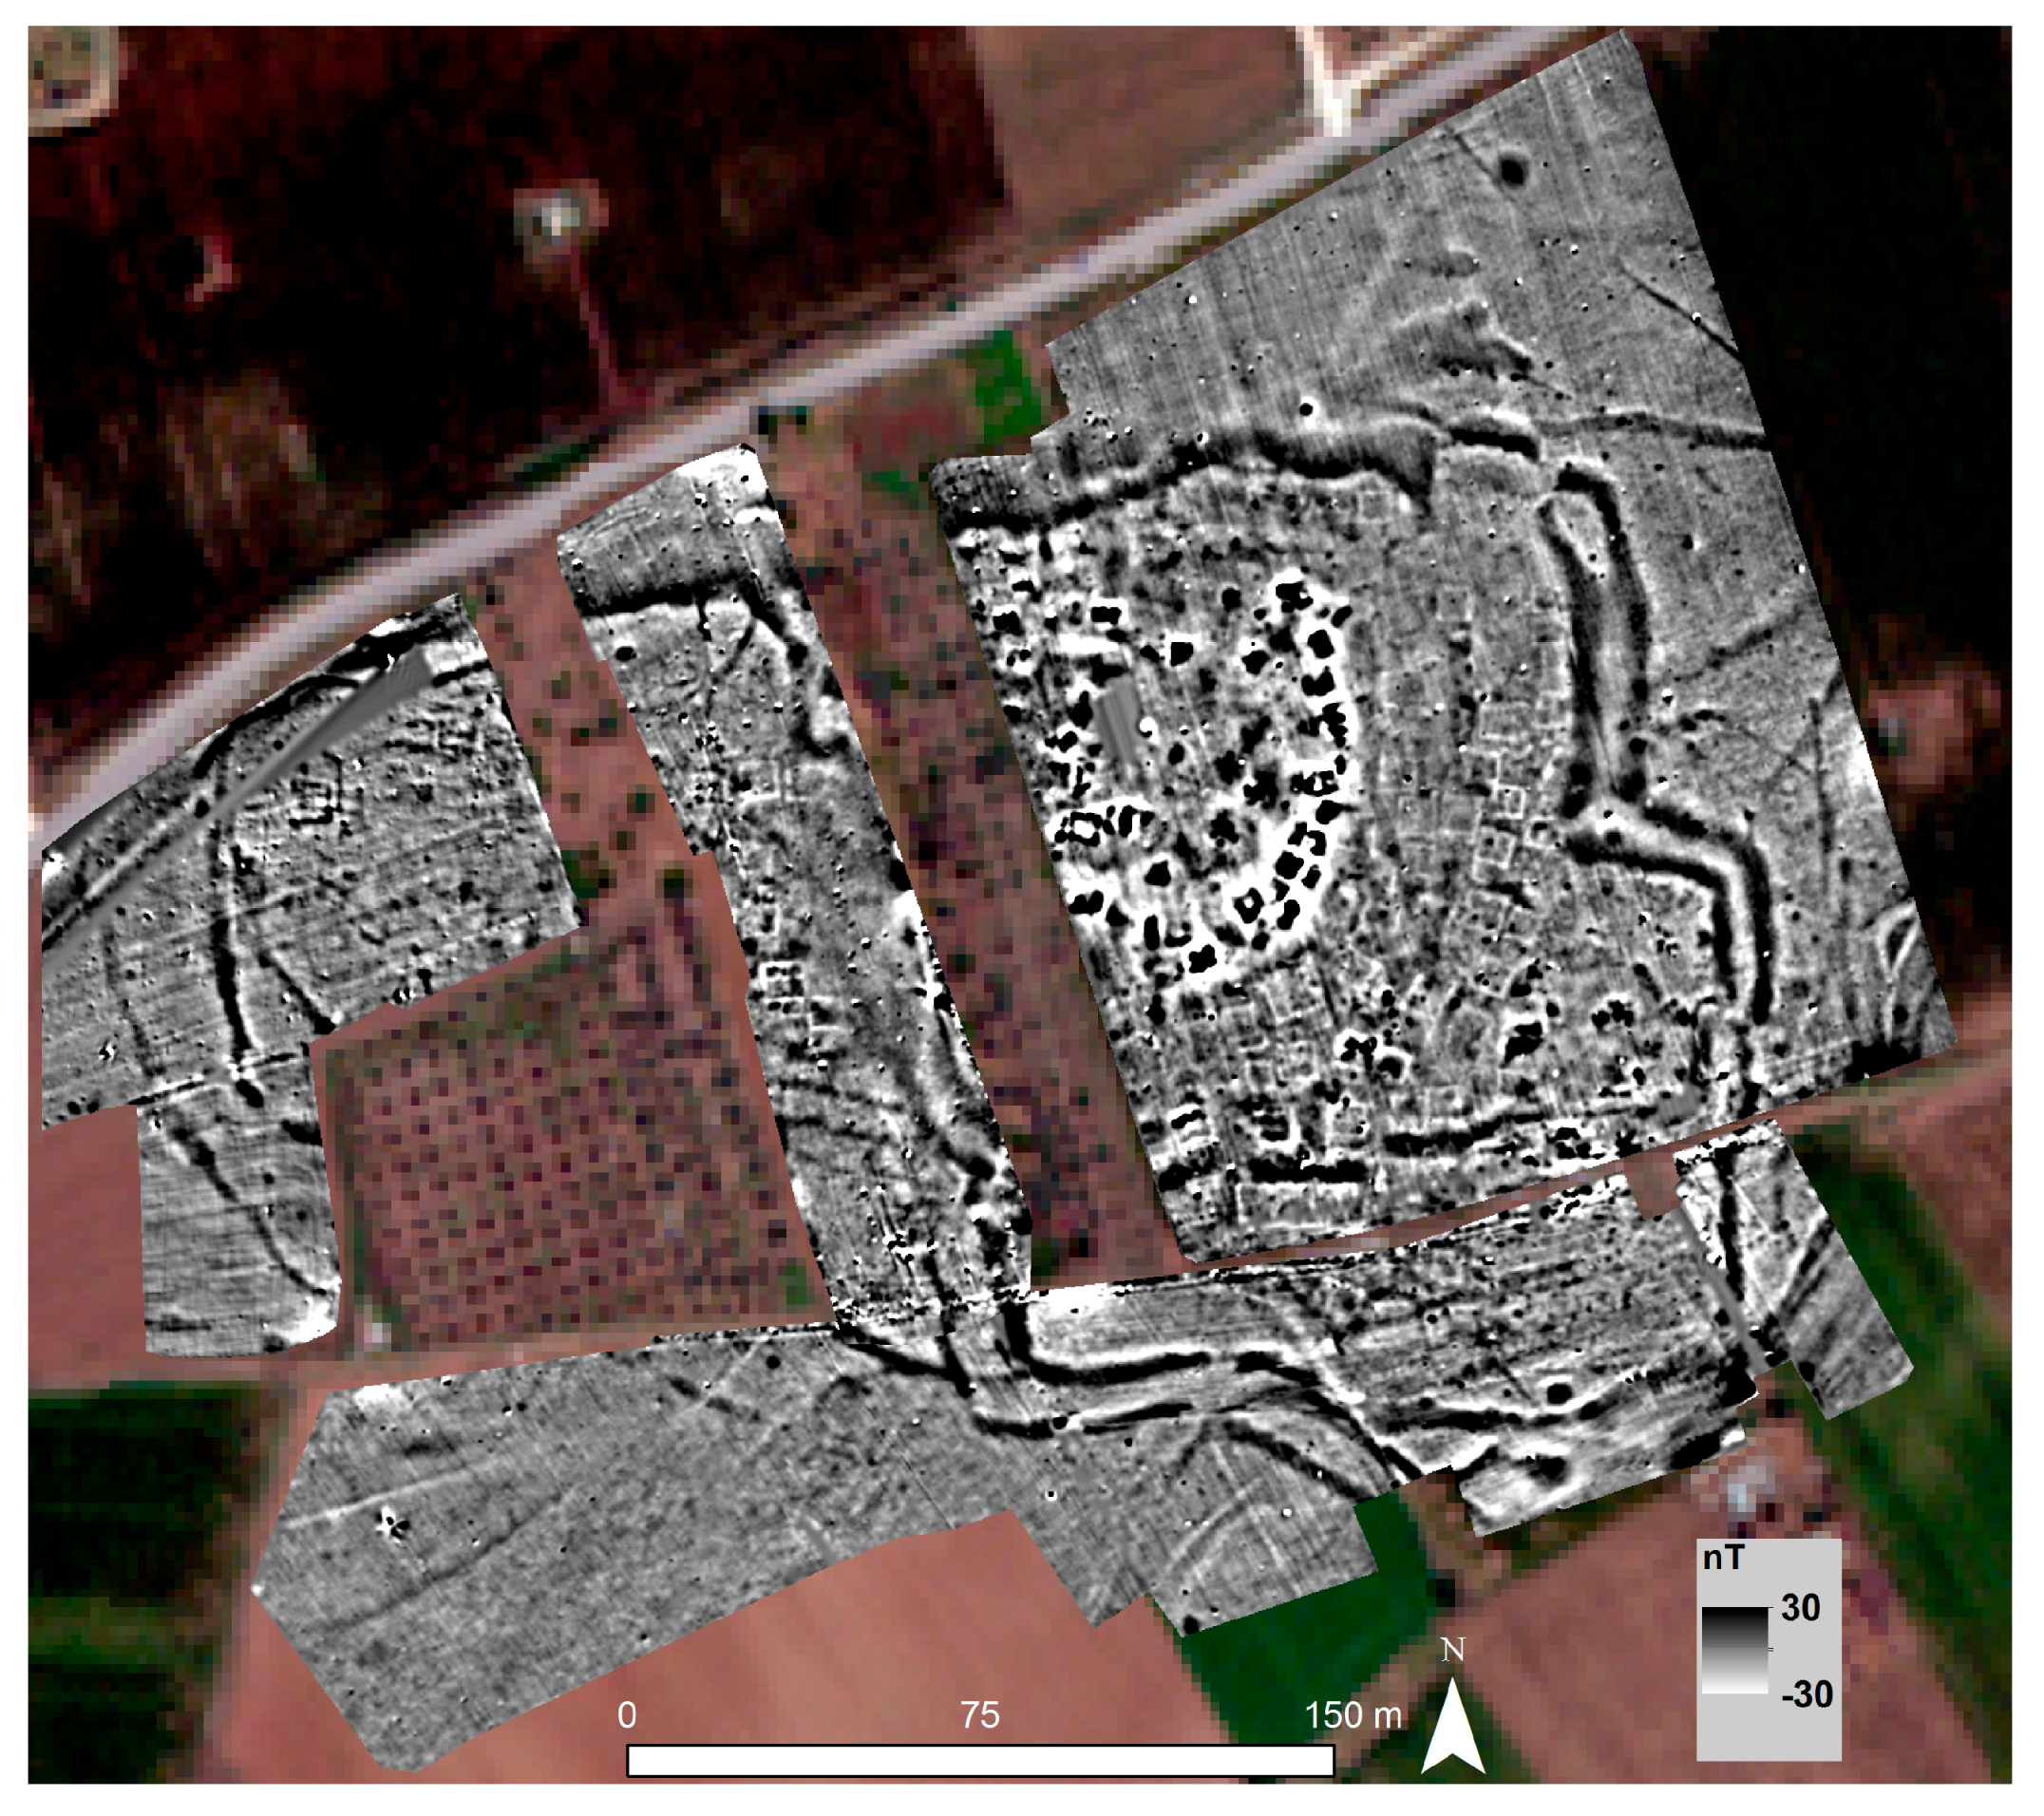
5.1. Almyriotiki
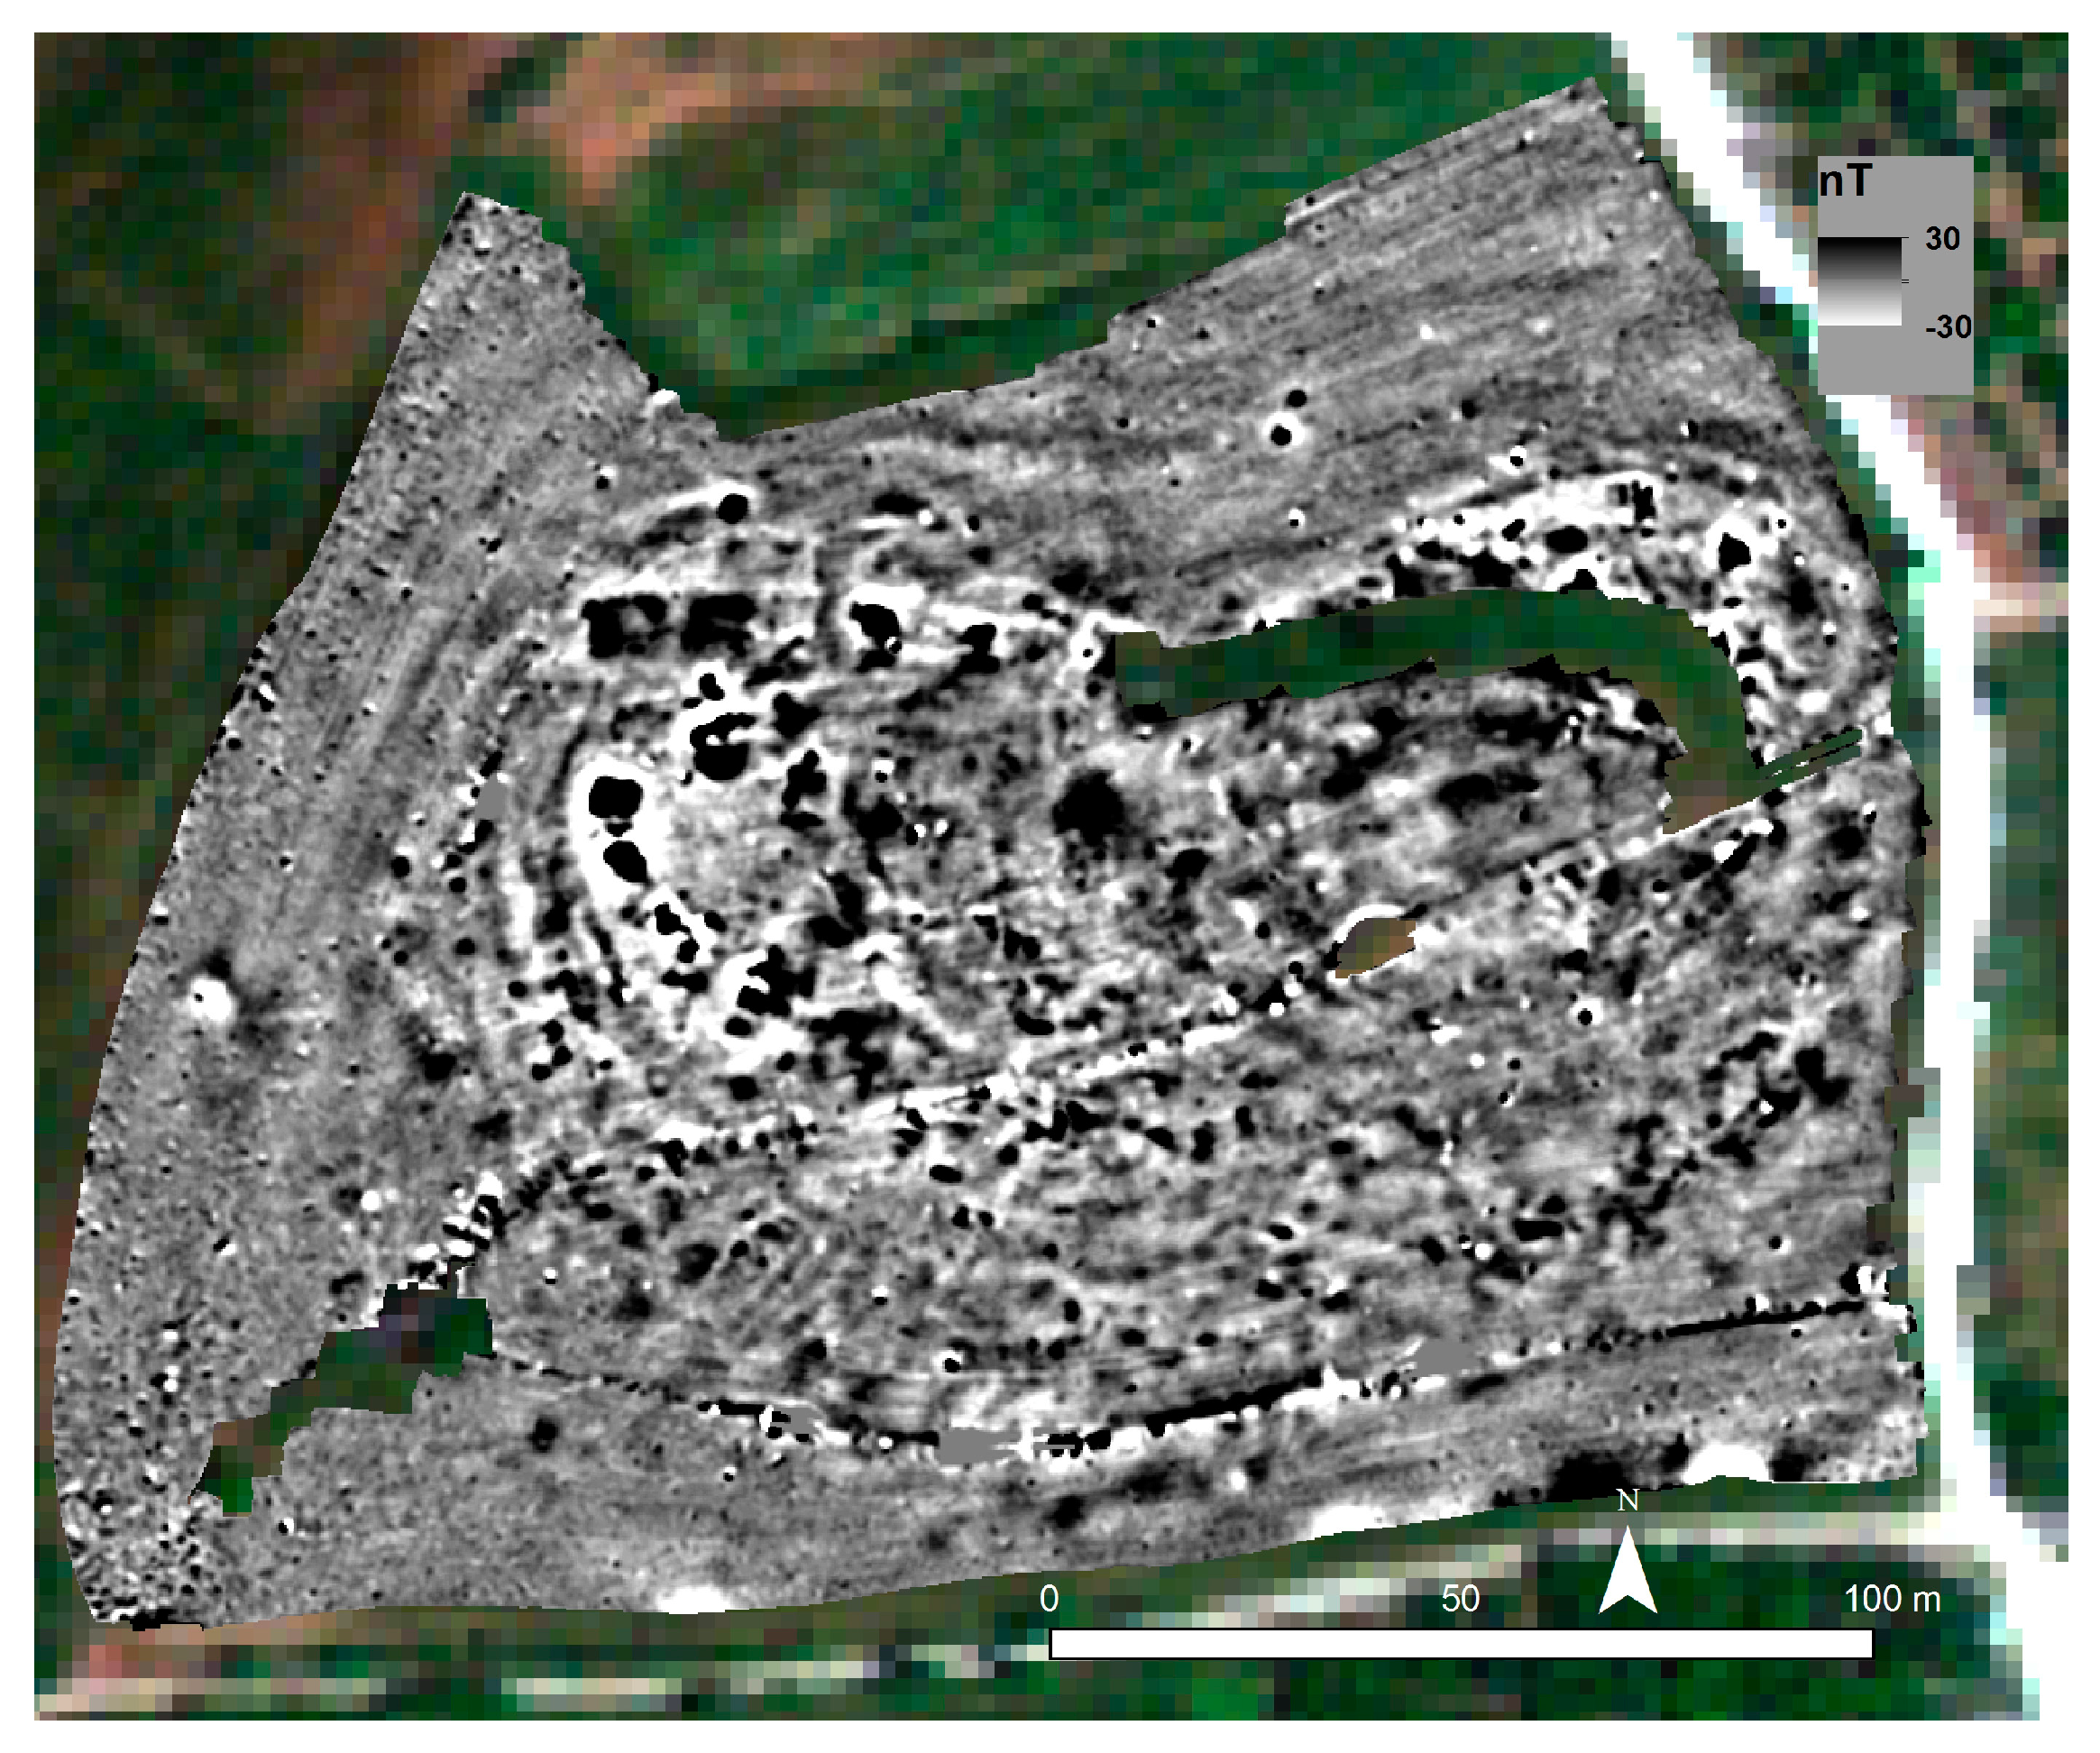
5.2. Perdika 1
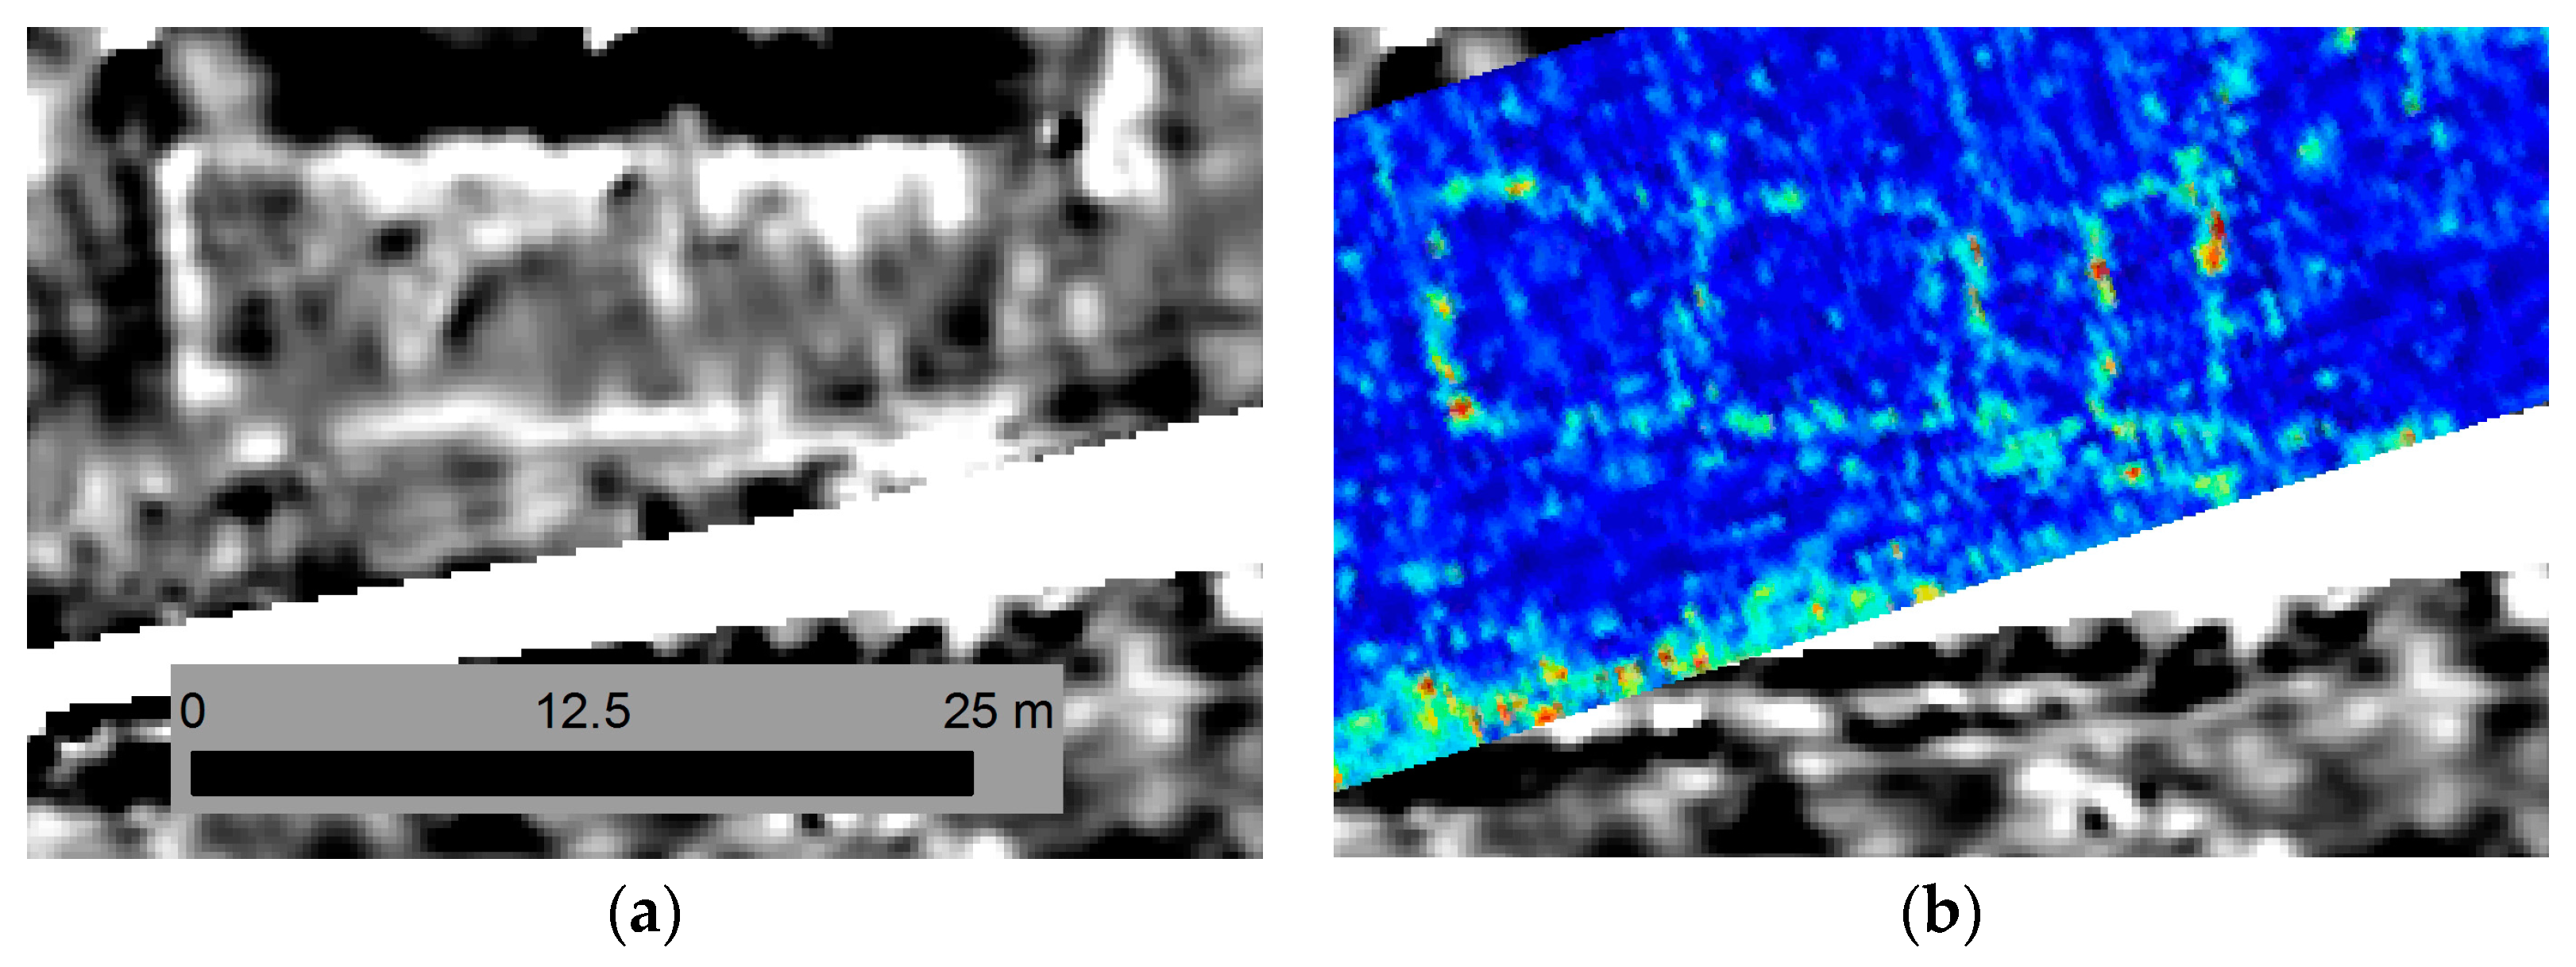
5.3. Velestino-Mati
6. Discussion
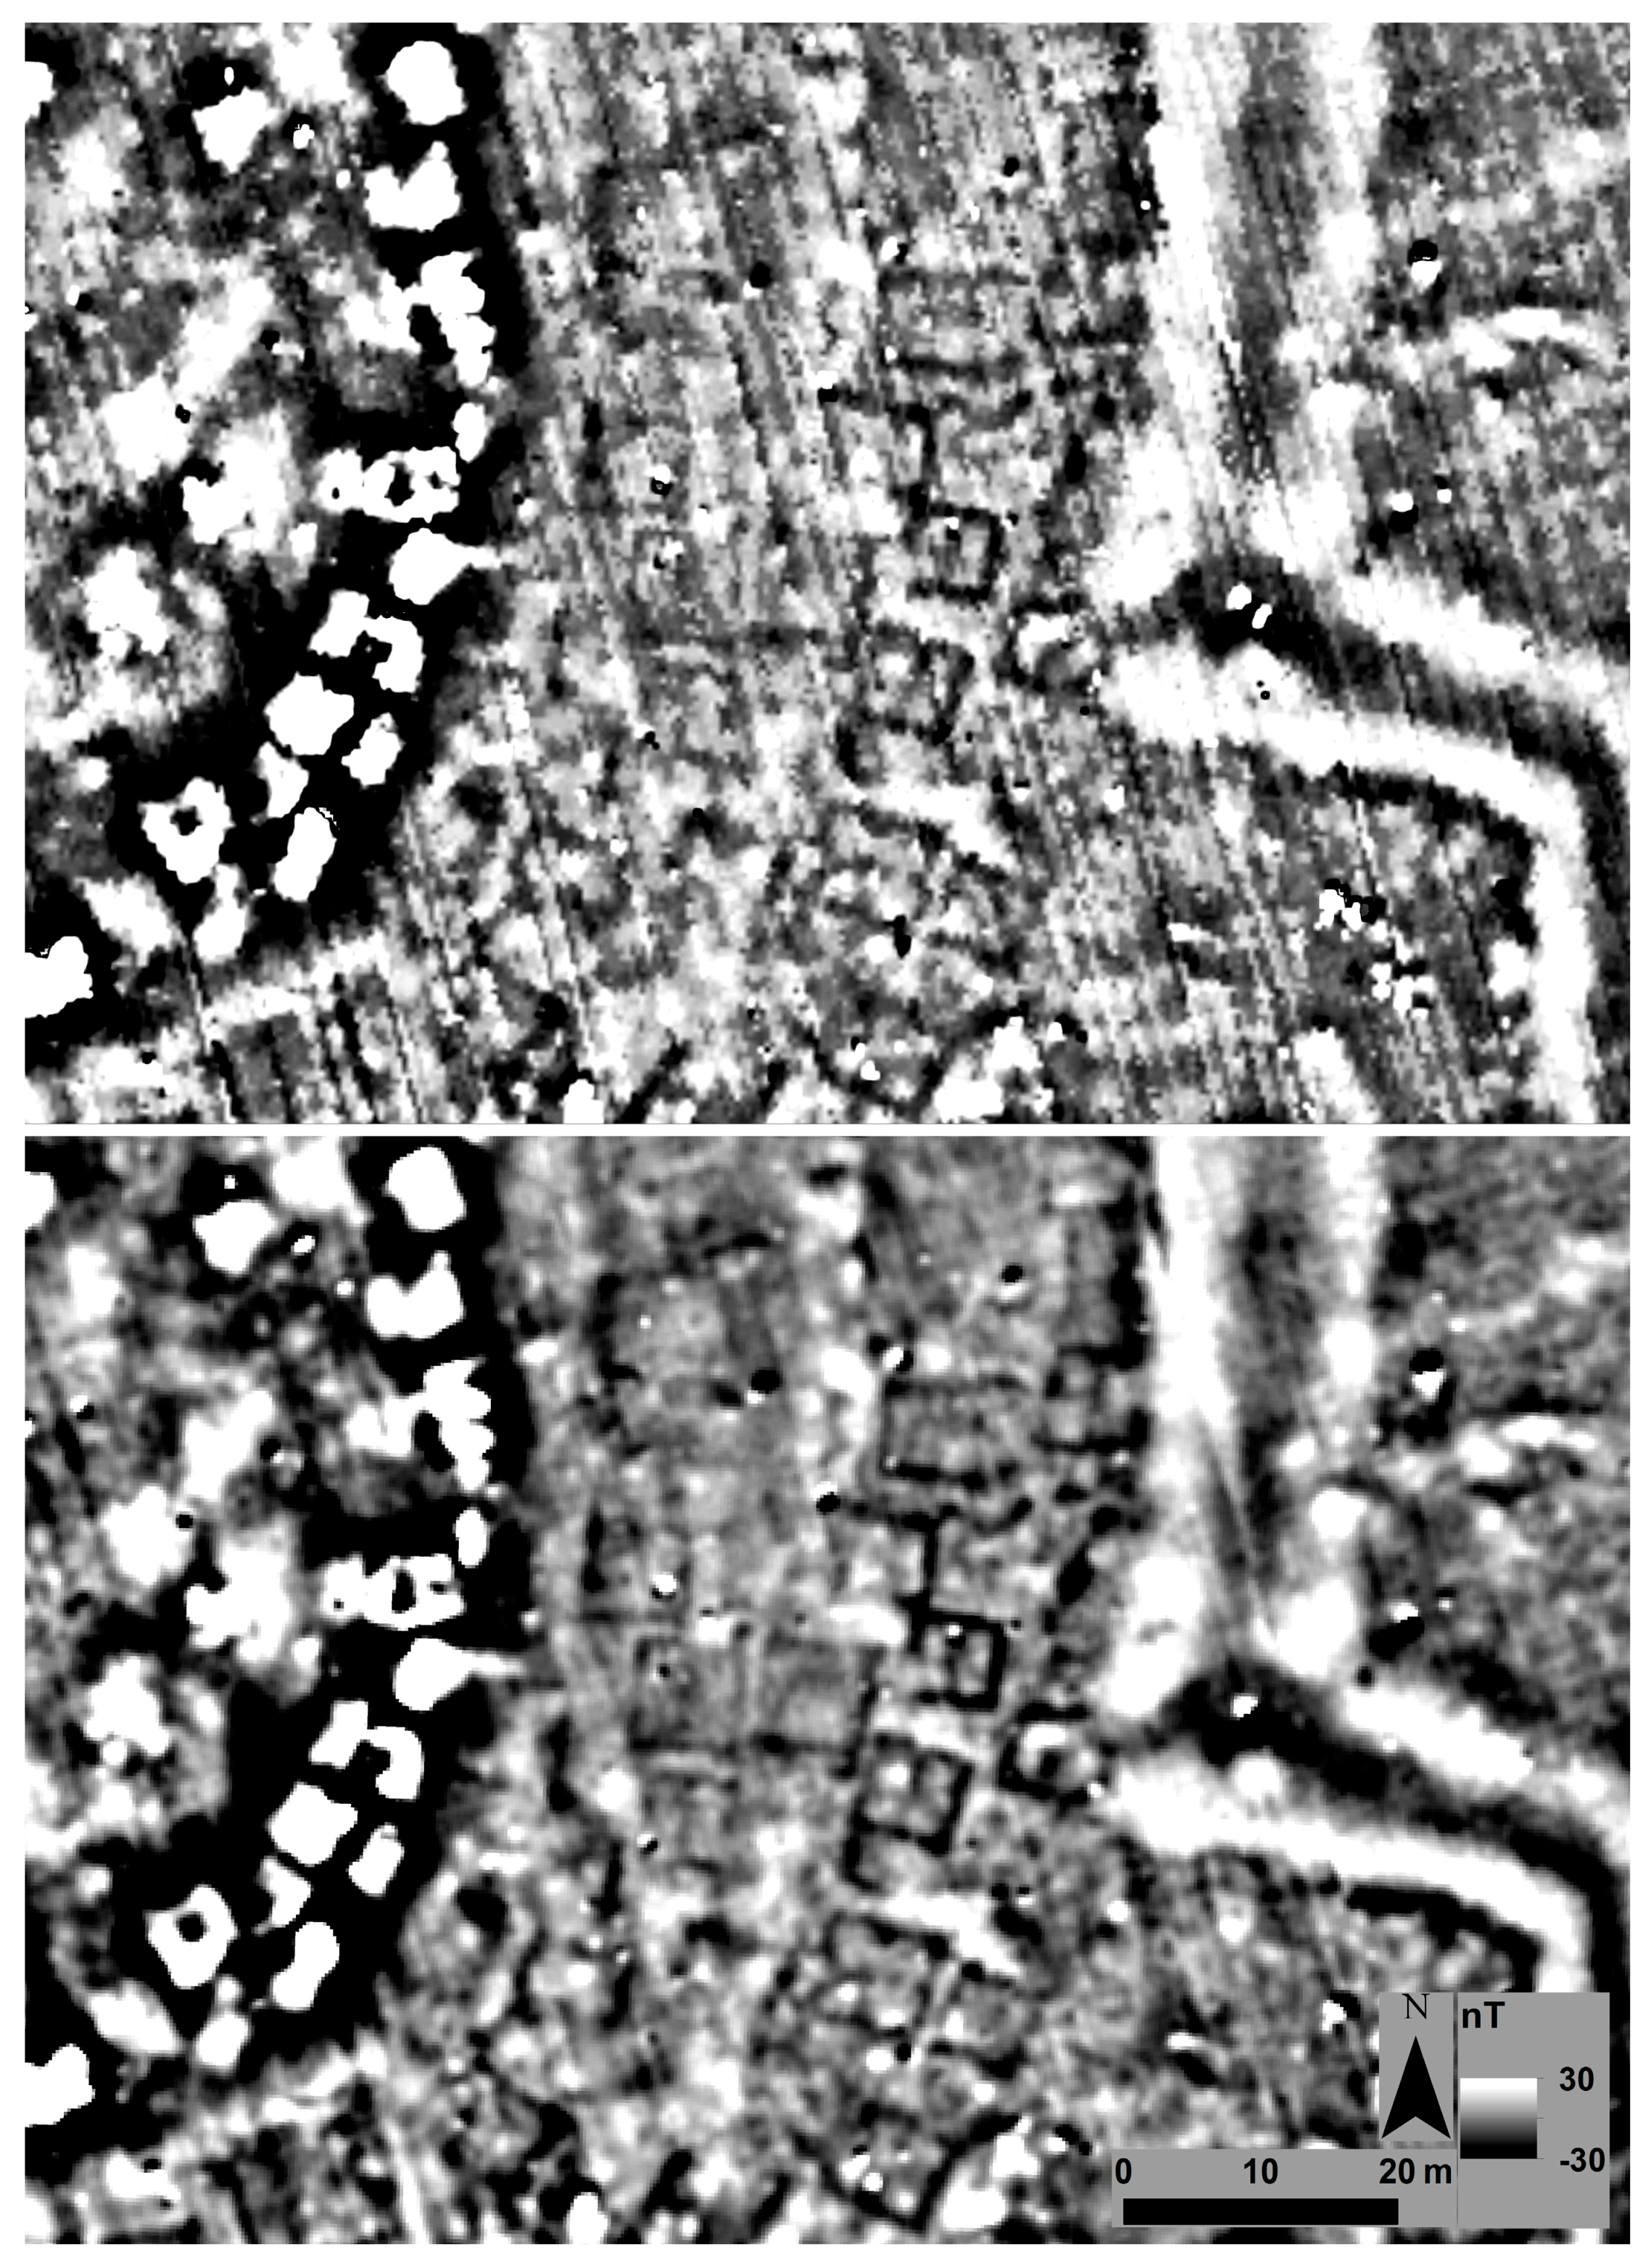
6.1. Built Environments
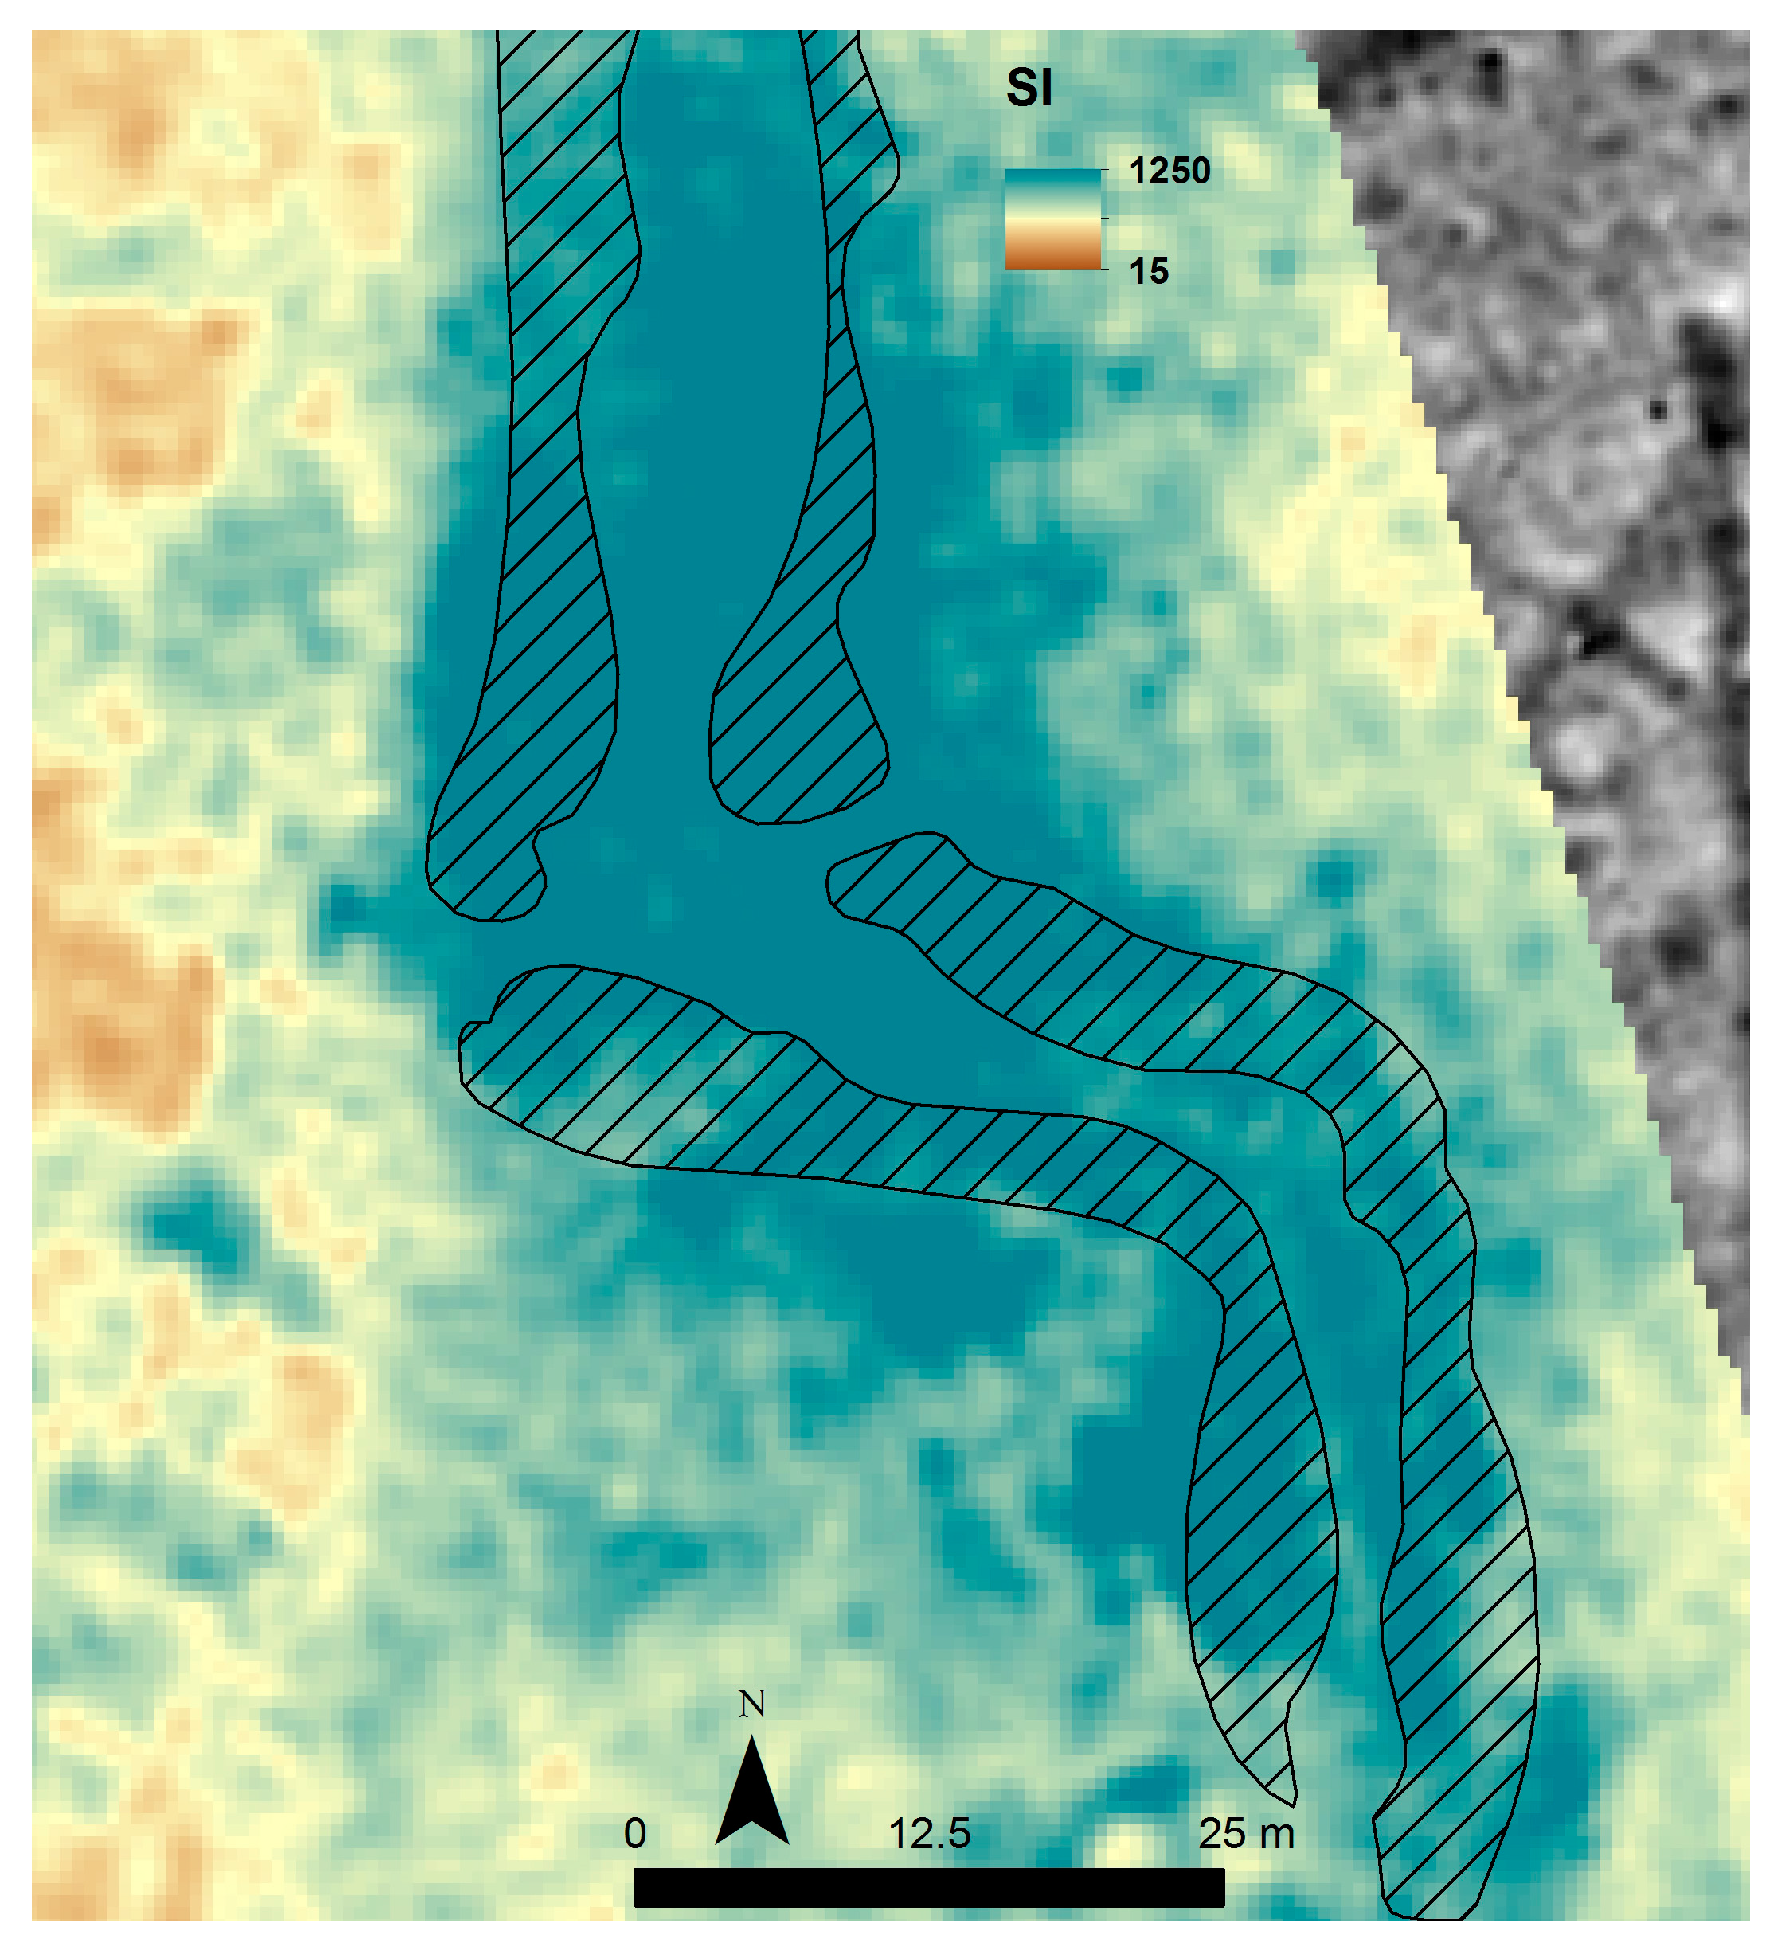
6.2. Enclosures
6.3. Paleoenvironments
7. Conclusions
Acknowledgments
Author Contributions
Conflicts of Interest
References and Note
- Perlès, C. The Early Neolithic in Greece: The First Farming Communities in Europe; Cambridge University Press: Cambridge, UK, 2001. [Google Scholar]
- Kvamme, K.L. Geophysical Surveys as Landscape Archaeology. Am. Antiq. 2003, 68, 435–457. [Google Scholar] [CrossRef]
- Karimali, E. The Neolithic Mode of Production and Exchange Reconsidered: Lithics Production and Exchange Patterns in Thessaly, Greece, during the Transitional Late Neolithic-Bronze Age Period; Boston University: Boston, MA, USA, 1994. [Google Scholar]
- Pentedeka, A. Pottery Exchange Networks during Middle and Late Neolithic in Thessaly. Ph.D. Thesis, Aristotle University of Thessaloniki, Thessaloniki, Greece, 2008. [Google Scholar]
- Vouzaxakis, K. Geographical Patterns and Theories of the Intercommunal Space in the Neolithic Thessaly. Ph.D. Thesis, Aristotle University of Thessaloniki, Thessaloniki, Greece, 2008. [Google Scholar]
- French, D.H. Notes on the Prehistoric Pottery Groups from Central Greece, Privately circulated. 1972.
- Theocharis, D.R. H Avgi Tis Thessalikis Proistorias: Archi kai Proimi Exelixi Tis Neolithikis; Filarchos Etaireia: Volos, Greece, 1967. [Google Scholar]
- Tsountas, C. Ai Proistorikai Akropoleis Diminiou kai Sesklou; Sakelarios: Athens, Greece, 1908. [Google Scholar]
- Wace, T. Prehistoric Thessaly: Being Some Account of Recent Excavations and Explorations in North-Eastern Greece from Lake Kopais to the Borders of Macedonia; Cambridge University Press: Cambridge, UK, 1912. [Google Scholar]
- Halstead, P. Strategies for Survival: An Ecological Approach to Social and Economic Change in the Early Farming Communities of Thessaly, N. Greece; University of Cambridge: Cambridge, UK, 1984. [Google Scholar]
- Gallis, K.I. Atlas Proisrorikon Oikosmon Tis Anatolikis Thessalikis Pediadas; Society of Historical Research of Thessaly: Larisa, Greece, 1992. [Google Scholar]
- Alexakis, D.; Sarris, A.; Astaras, T.; Albanakis, K. Integrated Gis, Remote Sensing and Geomorphologic Approaches for the Reconstruction of the Landscape Habitation of Thessaly during the Neolithic Period. J. Archaeol. Sci. 2011, 38, 89–100. [Google Scholar] [CrossRef]
- Alexakis, D.; Astaras, T.; Sarris, A.; Vouzaxakis, K.; Karimali, L. Reconstructing the Neolithic landscape of Thessaly through a GIS and Geological Approach. In Proceedings of the 35th International Conference on Computer Applications and Quantitative Methods in Archaeology, Berlin, Germany, 2–6 April 2007.
- Mori, N.; Suzuki, T.; Kakuno, S. Noise of Acoustic Doppler Velocimeter Data in Bubbly Flows. J. Eng. Mech. 2007, 133, 122–125. [Google Scholar] [CrossRef]
- Mori, N. Despiking Toolbox, Matlab; MathWorks: Natick, MA, USA, 2014. [Google Scholar]
- Goring, D.G.; Nikora, V.I. Despiking Acoustic Doppler Velocimeter Data. J. Hydraul. Eng. 2002, 128, 117–126. [Google Scholar] [CrossRef]
- Wahl, T.L. Discussion of “Despiking Acoustic Doppler Velocimeter Data”. J. Hydraul. Eng. 2003, 129, 484–487. [Google Scholar] [CrossRef]
- Bernardini, F.; Bajaj, C.L. Sampling and Reconstructing Manifolds Using Alpha-Shapes; Computer Science Technical Reports; Department of Computer Sciences, Purdue University: West Lafayette, IN, USA, 1997; pp. 1–11. [Google Scholar]
- Magoula Almyriotiki. Available online: http://igean.ims.forth.gr/sites.php?nid=17264 (accessed on 1 November 2016).
- Hamilakis, Y.; Kyparissi-Apostolika, N. Koutroulou Magoula in Central Greece: From the Neolithic to the Present. Antiquity 2012, 86. [Google Scholar]
- Runnels, C.N.; White, C.; Payne, C.; Wolff, N.P.; Rifkind, N.V.; LeBlanc, S.A. Warfare in Neolithic Thessaly: A Case Study. Hesperia 2009, 78, 165–194. [Google Scholar] [CrossRef]
- Sarris, A.; Argyriou, N.; Kalayci, T.; Simon, F.-X.; Donati, J.; Garcia, C.C.; Cantoro, G.; Manataki, M. Neolithic Ditches in Thessaly. In Proceedings of the Third International Conference on Remote Sensing and Geoinformation of Environment, Paphos, Cyprus, 16–19 March 2015.
- Magoula Perdika 1. Available online: http://igean.ims.forth.gr/sites.php?nid=17258 (accessed on 1 November 2016).
- Magoula Velestino–Mati. Available online: http://igean.ims.forth.gr/sites.php?nid=17255 (accessed on 1 November 2016).
- Demitrack, A. The Late Quaternary Geologic History of the Larissa Plain Thessaly, Greece: Tectonic, Climatic, and Human Impact on the Landscape. Ph.D. Thesis, Stanford University, Stanford, CA, USA, 1986. [Google Scholar]
- Summers, G.; Summers, F. Aspects of Urban Design at the Iron Age City on the Kerkenes Dag as Revealed by Geophysical Survey. Anatol. Antiq. 2006, 14, 71–88. [Google Scholar] [CrossRef]
- Simon, F.-X.; Kalayci, T.; Donati, J.C.; Garcia, C.C.; Manataki, M.; Sarris, A. How Efficient Is an Integrative Approach in Archaeological Geophysics? Comparative Case Studies from Neolithic Settlements in Thessaly (Central Greece). Near Surf. Geophys. 2015, 13, 633–643. [Google Scholar]
- Kvamme, K.L. Magnetometry: Nature’s Gift to Archaeology. In Remote Sensing in Archaeology: An Explicitly North American Perspective; Johnson, J.K., Ed.; University of Alabama Press: Tuscaloosa, AL, USA, 2006; pp. 205–234. [Google Scholar]


© 2016 by the authors; licensee MDPI, Basel, Switzerland. This article is an open access article distributed under the terms and conditions of the Creative Commons Attribution (CC-BY) license (http://creativecommons.org/licenses/by/4.0/).
Share and Cite
Kalaycı, T.; Sarris, A. Multi-Sensor Geomagnetic Prospection: A Case Study from Neolithic Thessaly, Greece. Remote Sens. 2016, 8, 966. https://doi.org/10.3390/rs8110966
Kalaycı T, Sarris A. Multi-Sensor Geomagnetic Prospection: A Case Study from Neolithic Thessaly, Greece. Remote Sensing. 2016; 8(11):966. https://doi.org/10.3390/rs8110966
Chicago/Turabian StyleKalaycı, Tuna, and Apostolos Sarris. 2016. "Multi-Sensor Geomagnetic Prospection: A Case Study from Neolithic Thessaly, Greece" Remote Sensing 8, no. 11: 966. https://doi.org/10.3390/rs8110966
APA StyleKalaycı, T., & Sarris, A. (2016). Multi-Sensor Geomagnetic Prospection: A Case Study from Neolithic Thessaly, Greece. Remote Sensing, 8(11), 966. https://doi.org/10.3390/rs8110966