Technical Note

Data Service Platform for Sentinel-2 Surface Reflectance and Value-Added Products: System Use and Examples

1
Institute of Surveying, Remote Sensing & Land Information (IVFL), University of Natural Resources and Life Sciences, Vienna (BOKU), Peter Jordan Str. 82, 1190 Vienna, Austria
2
Department of Civil, Environmental, Aerospace, Materials Engineering (DICAM), University of Palermo, Viale Delle Scienze, Bld. 8, 90128 Palermo, Italy
3
Institut National de la Recherche Agronomique—Université d’Avignon et des Pays du Vaucluse (INRA-UAPV), 228 Route de l’Aérodrome, 84914 Avignon, France
*
Author to whom correspondence should be addressed.
Remote Sens. 2016, 8(11), 938; https://doi.org/10.3390/rs8110938
Submission received: 1 August 2016 / Revised: 12 October 2016 / Accepted: 6 November 2016 / Published: 11 November 2016

Abstract

:
This technical note presents the first Sentinel-2 data service platform for obtaining atmospherically-corrected images and generating the corresponding value-added products for any land surface on Earth. Using the European Space Agency’s (ESA) Sen2Cor algorithm, the platform processes ESA’s Level-1C top-of-atmosphere reflectance to atmospherically-corrected bottom-of-atmosphere (BoA) reflectance (Level-2A). The processing runs on-demand, with a global coverage, on the Earth Observation Data Centre (EODC), which is a public-private collaborative IT infrastructure in Vienna (Austria) for archiving, processing, and distributing Earth observation (EO) data. Using the data service platform, users can submit processing requests and access the results via a user-friendly web page or using a dedicated application programming interface (API). Building on the processed Level-2A data, the platform also creates value-added products with a particular focus on agricultural vegetation monitoring, such as leaf area index (LAI) and broadband hemispherical-directional reflectance factor (HDRF). An analysis of the performance of the data service platform, along with processing capacity, is presented. Some preliminary consistency checks of the algorithm implementation are included to demonstrate the expected product quality. In particular, Sentinel-2 data were compared to atmospherically-corrected Landsat-8 data for six test sites achieving a R2 = 0.90 and Root Mean Square Error (RMSE) = 0.031. LAI was validated for one test site using ground estimations. Results show a very good agreement (R2 = 0.83) and a RMSE of 0.32 m2/m2 (12% of mean value).

Graphical Abstract

1. Introduction

Sentinel-2 is the newest generation Earth observation (EO) satellite of the European Space Agency (ESA) for land and coastal applications [1]. The satellite was launched in June 2015 and is part of Europe’s Copernicus program aiming at independent and continued global observation capacities [2]. Compared to Landsat satellites, Sentinel-2 offers an increased spectral and spatial resolution with 13 spectral bands of 10 to 60 m spatial resolution. Together with its twin satellite (to be launched beginning 2017), Sentinel-2 will cover the entire Earth every five days. The excellent performance characteristics of Sentinel-2 were shown already for different applications, such as crop and forest classification [2], sub-pixel landscape feature detection [3], mapping of built-up areas [4,5], as well as monitoring of glacier and water bodies [6,7].
Currently, users can find data at the ESA’s Scientific Data Hub (SDH), or using alternative platforms such as Amazon Web Service (AWS) or Google’s Earth Engine. Until now, however, none of the three mentioned platforms provides products for arbitrary places on Earth beyond the standard Level-1C level (top-of-atmosphere reflectance). To fill this gap, we developed a data service platform within the Earth Observation Data Centre (EODC) that allows access to atmospherically-corrected surface reflectance Sentinel-2 data (Level-2A) on-demand and globally. Level-2A data are required for numerous applications dealing with multi-temporal analysis (e.g., land surface phenology, land cover change) [8,9,10] as well as for accurate retrieval of land surface variables, such as leaf area index (LAI), fraction of absorbed photosynthetically active radiation (FAPAR), or albedo [11,12,13].
In this technical note we focus on products ready for delivery, including surface reflectance, three-band image composites, LAI, and broadband hemispherical-directional reflectance factors (HDRF), frequently deployed in our and other agricultural monitoring applications [14]. The paper presents the system implementation and provides examples of products and instructions for access. We also provide some first product examples and results of consistency checks. The technical note does not provide a comprehensive validation nor an attempt to improve the integrated software packages (e.g., related to the atmospheric correction).
In the following sections, we first introduce the algorithms used (Section 2.1) and describe options to access data (Section 2.2). In Section 3 we report preliminary results and data consistency checks. The technical note concludes in Section 4 with an overview of the data service platform performance, and an outlook to future improvements, product availability and plans for exploitation.

2. Product Description and Access

The data service platform was implemented by the University of Natural Resources and Life Science, BOKU [15] and provides access to individual Sentinel-2 granules (ortho-rectified image tiles of 100 × 100 km2 in UTM/WGS84 projection) processed at bottom-of-atmosphere (BoA) reflectance (Level-2A). The service runs on the Earth Observation Data Centre (EODC), which is a collaborative IT infrastructure for archiving, processing, and distributing Earth observation (EO) data [16].
Our data service platform processes the Sentinel-2 Level-1C images into Level-2A data using the ESA’s Sen2Cor algorithm [17]. Sen2Cor is supported by the ESA as a third-party plugin for the Sentinel-2 toolbox and it runs in the ESA Sentinel Application Platform (SNAP) or from the command line. Additional layers produced by this algorithm are also available such as Aerosol optical thickness (AOT), water vapor (WV), scene classification (SCL), and various quality indicators (QI).
To minimize atmospheric interference, all value-added products are calculated based on atmospherically-corrected Level-2A data. For users interested in simple three-band composites, the platform can create user-defined true and false color composites. All products are delivered in JPEG 2000 or TIFF format, at three different spatial resolutions (60, 20, and 10 m).
Within the day of the satellite acquisition, Sentinel-2 Level-1C scenes are pulled from the national mirror site and archived at EODC. As soon as the images are available, processing of Level-2A and value-added products is performed based on standing orders of on-demand requests. Submission of data queries and processing requests is made possible via a user-friendly web page or using an application programming interface (API). The API also allows query on the image metadata and bulk data access. An overview of the various products currently available on the Sentinel-2 data service platform is presented in Figure 1 and summarized in Table 1.

2.1. Sentinel-2 Level2-A Data and Value-Added Products

Atmospherically-corrected bottom-of-atmosphere (BoA) Sentinel-2 data are produced using the Sen2Cor processor (currently version 2.2.1), developed by ESA to perform atmospheric, terrain, and cirrus correction of top-of-atmosphere Level-1C input data [17]. The processor is considered a prototype and not validated for water and coastal regions. The correction is based on the application of look-up-tables (LUTs), which were pre-calculated using the libRadtran radiative transfer routines. The LUTs include two different types of aerosols (rural and maritime), two different types of atmospheres (mid-latitude summer and winter), six different types of ozone concentrations, and four different amounts of water vapor column [18]. As an example, Figure 1c shows the atmospherically-corrected B8a BoA reflectance (at 865 nm). Sen2Cor includes a scene classification module (example in Figure 1b) to map no data or defective pixels (pixel value = 0–1), four different cloud clover class probabilities (7–10), and six different classes including shadows (2), cloud shadows (3), vegetation (4), soils and deserts (5), water (6), and snow (11).
Other Sen2Cor outputs comprise (i) an estimation of the aerosol optical thickness (AOT) using the dense dark vegetation (DDV) algorithm [19] and the (ii) retrieval of water vapor (WV) using the pre-corrected differential absorption algorithm (APDA, [20]) analyzing Sentinel-2 bands B8a and B9. Example outputs for AOT and WV are shown in Figure 2.
The image file output and directory structures of all layers are similar to the Level-1C product structure with lossless compressed images based on the JPEG 2000 format and produced at three different resolutions, 60, 20, and 10 m.
True and false color composites are produced on-demand by combining three different Sentinel-2 spectral bands based on user requests. Contrast stretching is offered to optimize the RGB display (Figure 2 bottom).
For mapping leaf area index (LAI), we employ a neural network (NNT) algorithm developed by INRA [21]. The NNT algorithm was tailored for Sentinel-2 and trained using radiative transfer simulations from PROSPECT and SAIL radiative transfer models [22,23]. The inputs (BoA surface reflectance) and outputs (LAI) data are normalized and de-normalized, respectively, using given coefficients. An example image is shown in Figure 1e.
The broadband (490–2160 nm) hemispherical-directional reflectance factor (HDRF) (Figure 1d), obtained at the time of the satellite overpass was calculated as a weighted sum of the Level-2A Sentinel-2 surface reflectance, with broadband weights representing the corresponding fraction of the solar irradiance in each sensor band [24]. The broadband weights were adapted to take into account the spectral configuration of Sentinel-2.

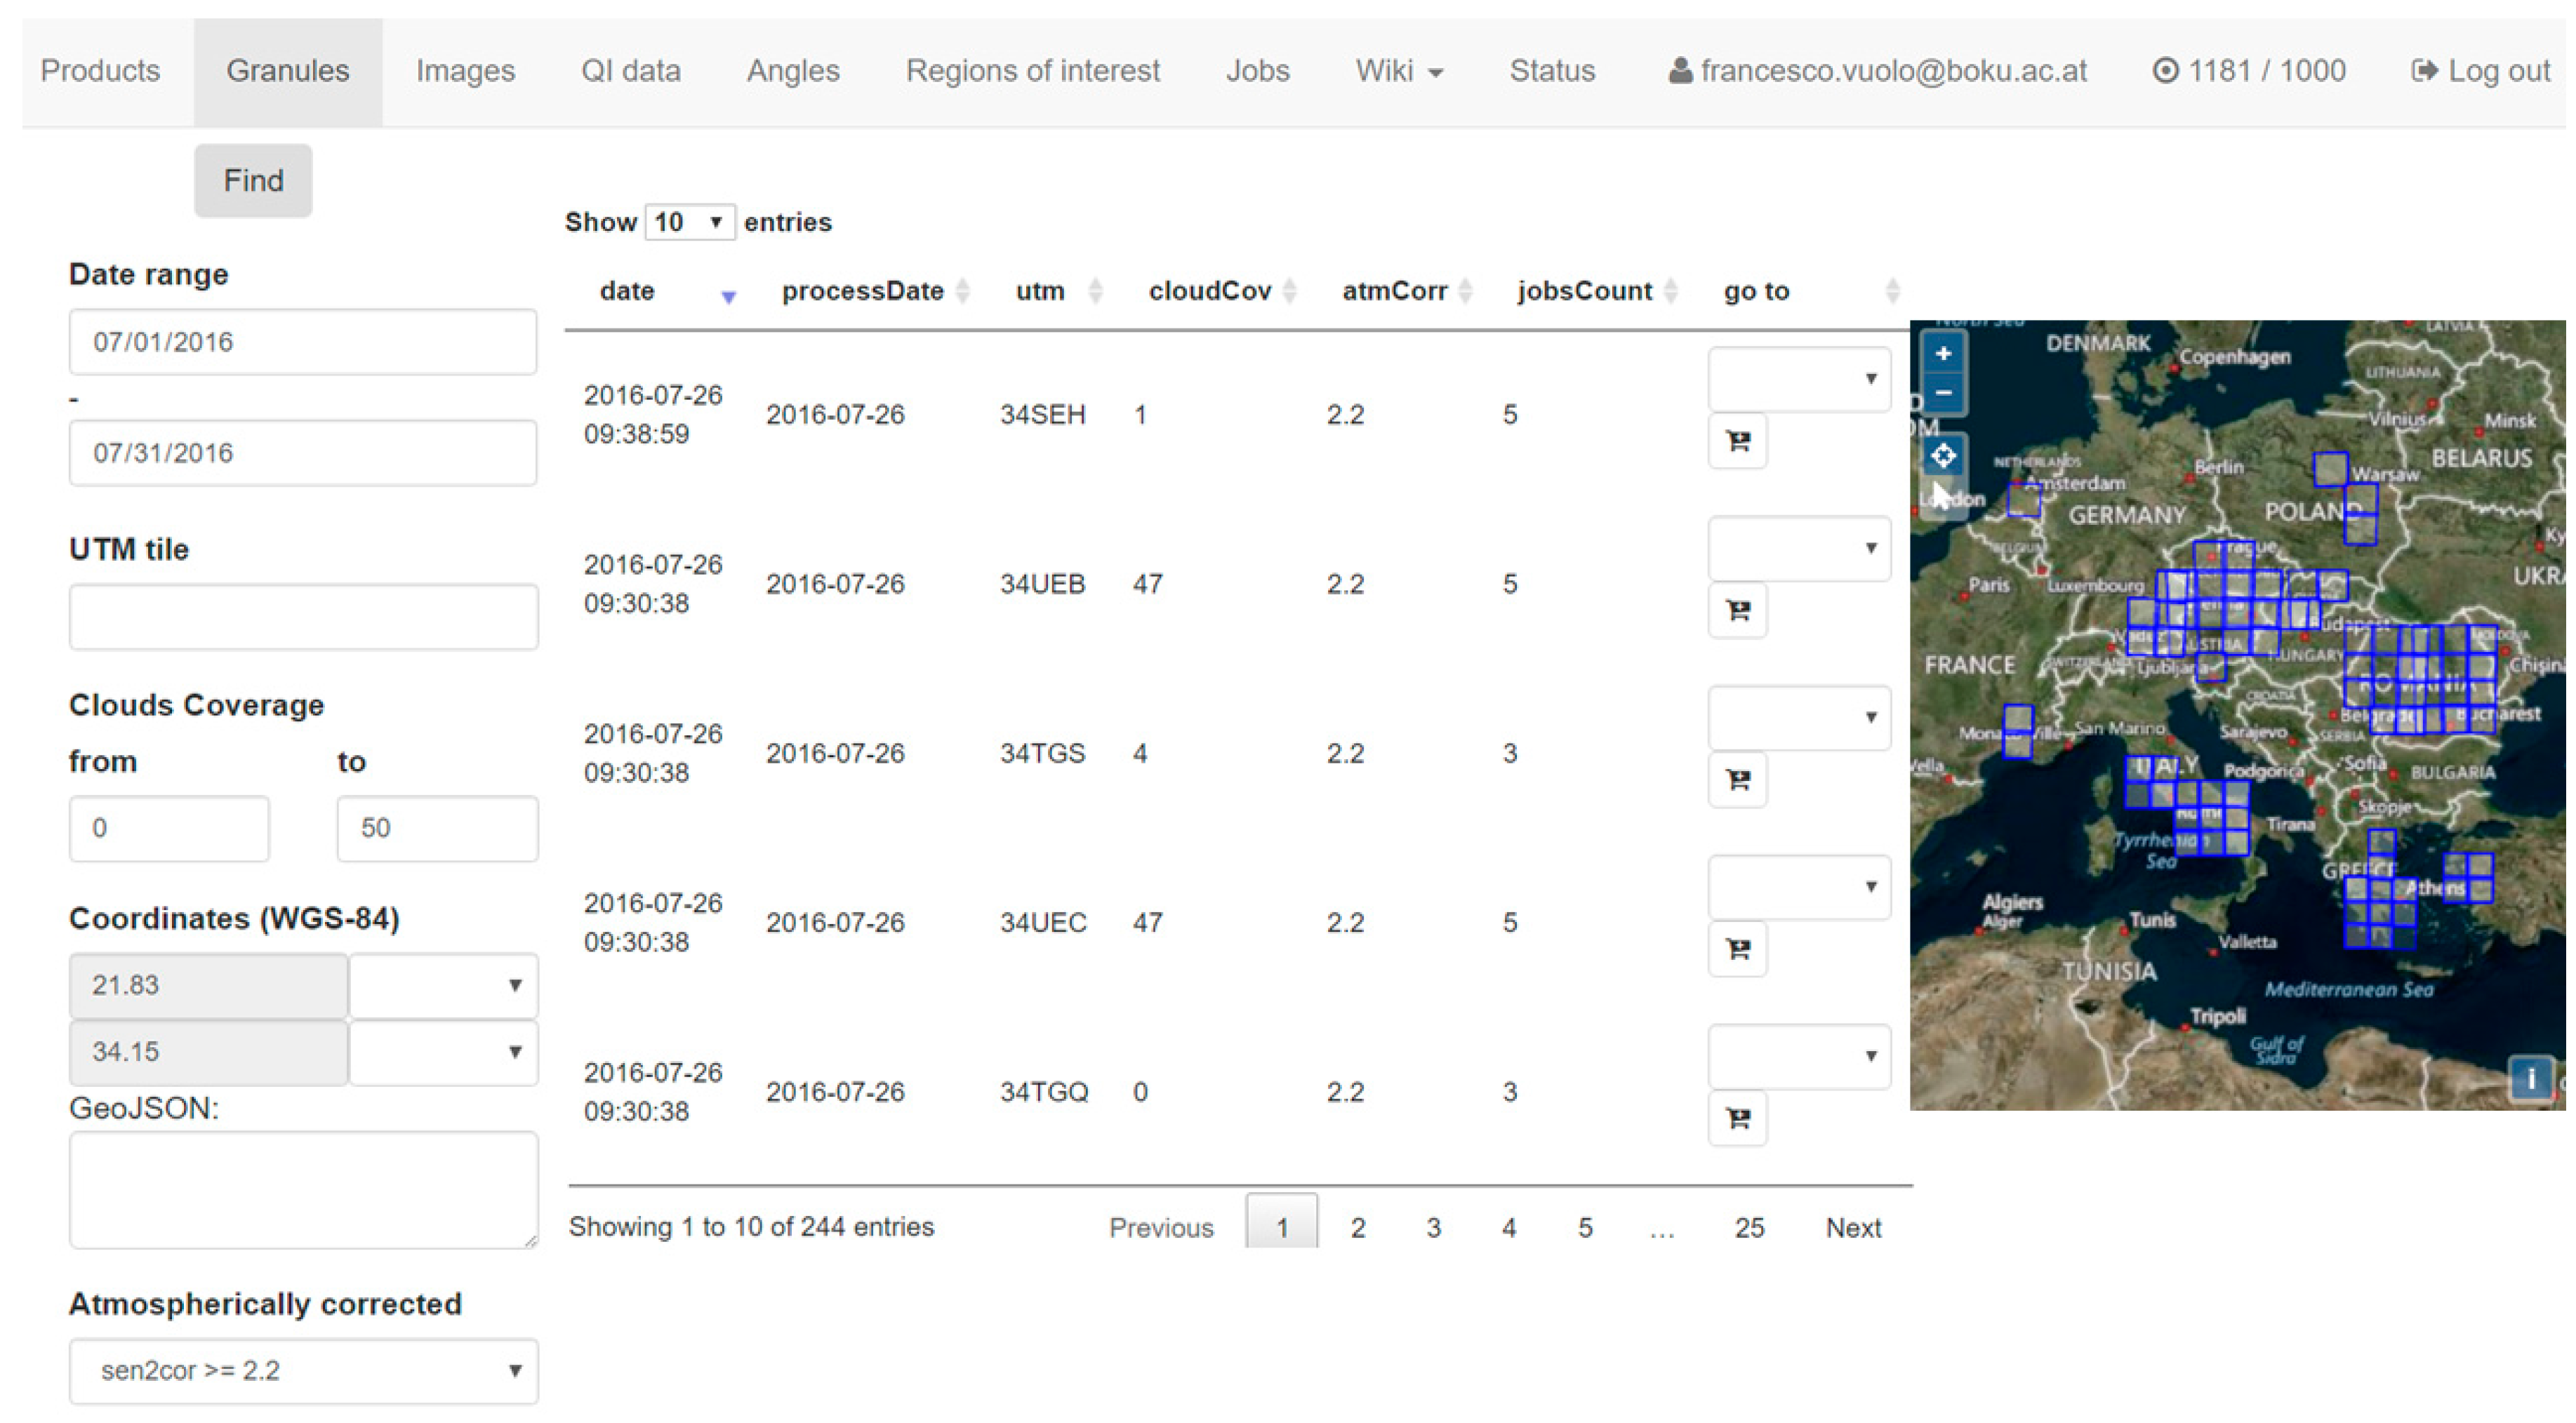
2.2. Data Discovery and Download via Web Interface

The web interface allows users to search for products (defined as the collection of elementary granules within a single orbit), granules (the 100 × 100 km2 image tiles) and images (image files of an individual granule, such as spectral bands or value-added products). The search can be filtered considering a range of acquisition dates, maximum cloud cover, and a set of coordinates (center point or using a GeoJSON string to define a point, bounding box or polygon). The metadata catalogue is regularly updated as new products are pulled from the national mirror sites and archived at EODC. From the user perspective, major performance improvements in data search are related to the use of (i) the actual geometry of valid data in the Sentinel-2 granules and (ii) an area-based cloud cover statistic (using the Level 1C cloud mask) instead of the “bulk” cloud cover percentage provided with the image metadata.
As an example, Figure 3 shows the data service web page with the results of a query identifying all atmospherically-corrected data available on the platform. Users can submit orders for any region of interest for one-time processing or continuous tasking. In the latter case, the creation of the Level-2A products is performed as soon as the Level-1C data are available on the server, generally within one day from the satellite acquisition.

2.3. Data Exploration and Download via the Application Programming Interface (API)

The API offers a set of predefined connection points where HTTP requests can be submitted to access metadata, granules, and individual image files or to activate processing services on the server side. The user must provide the information needed for each request, specifying (i) the product level, (ii) start and end of acquisition period; and (iii) coordinates of the region of interest. The request can thereafter be submitted using an internet browser or using common programming languages such as Python (Python Software Foundation), R (R Development Core Team, Vienna, Austria), or MATLAB (The MathWorks, Inc., Natick, MA, USA). The set of parameters and HTTP requests are described in the API documentation available on the web page. Some examples to query the catalogue of metadata, to download images and to generate RGB false color composites are provided using R programming environment in the Appendix.

3. Example Products and Preliminary Validation

3.1. Data Processing and Performance

The data service platform runs on a computer cluster at EODC [16] that consists of 100 cores, 2.25 TB of RAM and 122 TB of disk storage, and it is directly connected to the Sentinel-2 data archive (with 2 PB distributed hard disks and 1 PB tape storage). We currently deploy 4 cores with 12 GB of RAM to serve the APIs and the web page, and 12 cores and 52 GB of RAM are assigned to compute Level-2A data and value-added products. This hardware configuration is able to process in near-real-time up to about 2,000,000 km2 (equivalent to 200 Sentinel-2 granules) per day. In the near future, it is planned to add additional resources (304 cores, 3.8 TB RAM and 1.1 PB disk storage). The processing capacity should scale almost linearly with the amount of assigned system resources (cores and RAM).
In the development phase, the data service platform has performed the atmospheric correction of about 4000 Sentinel-2 granules and 2700 value-added products (i.e., LAI) for a group of core end-users. On average, the data service platform required 37 min (to a max of 1 h) for the atmospheric correction of one granule of 100 × 100 km2 and 15 min (to a max of 24 min) for the production of value-added products, such as LAI.
In the last month of operations (June 2016), we experienced a delivery time of final results from three days (low priority) to one day (high priority) including the time span between image acquisition and Level-1C product availability on the EODC archive.

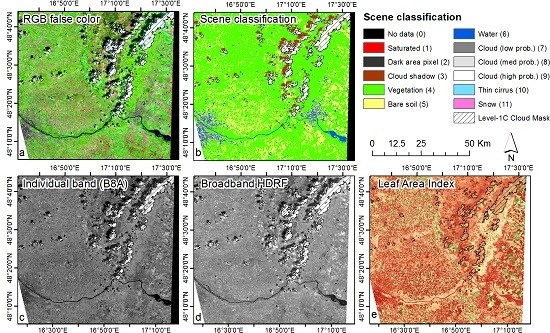
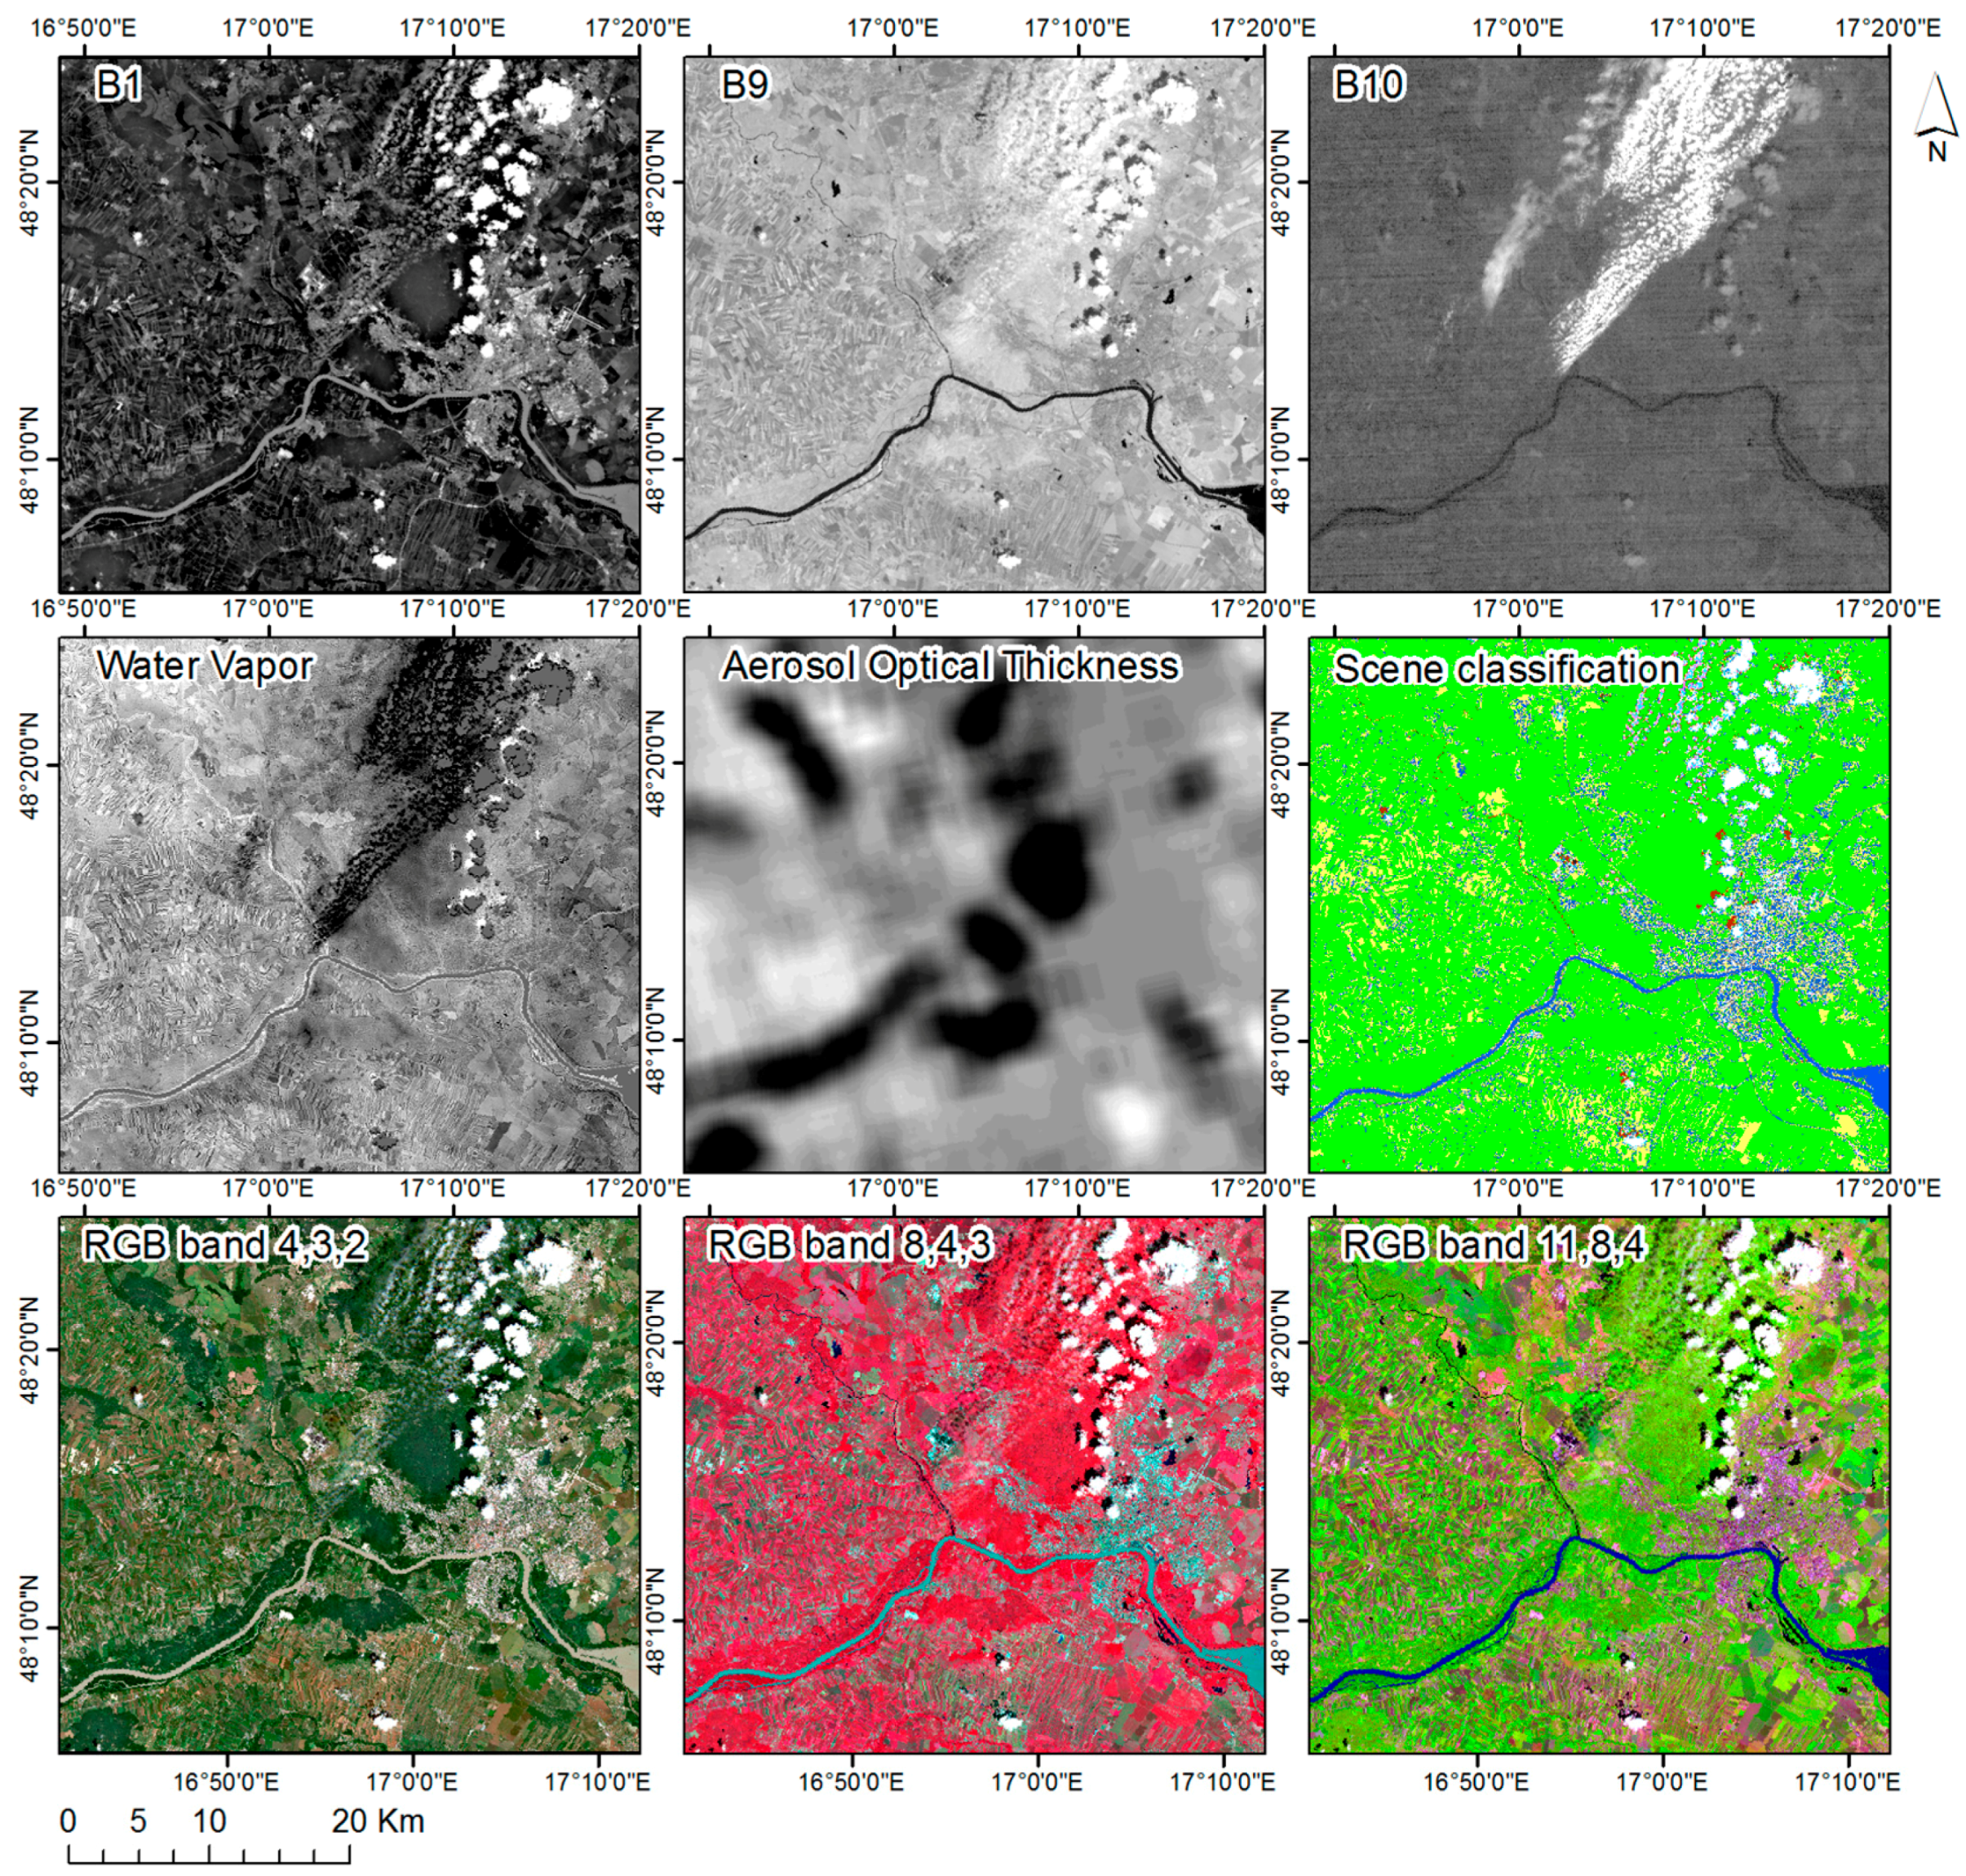
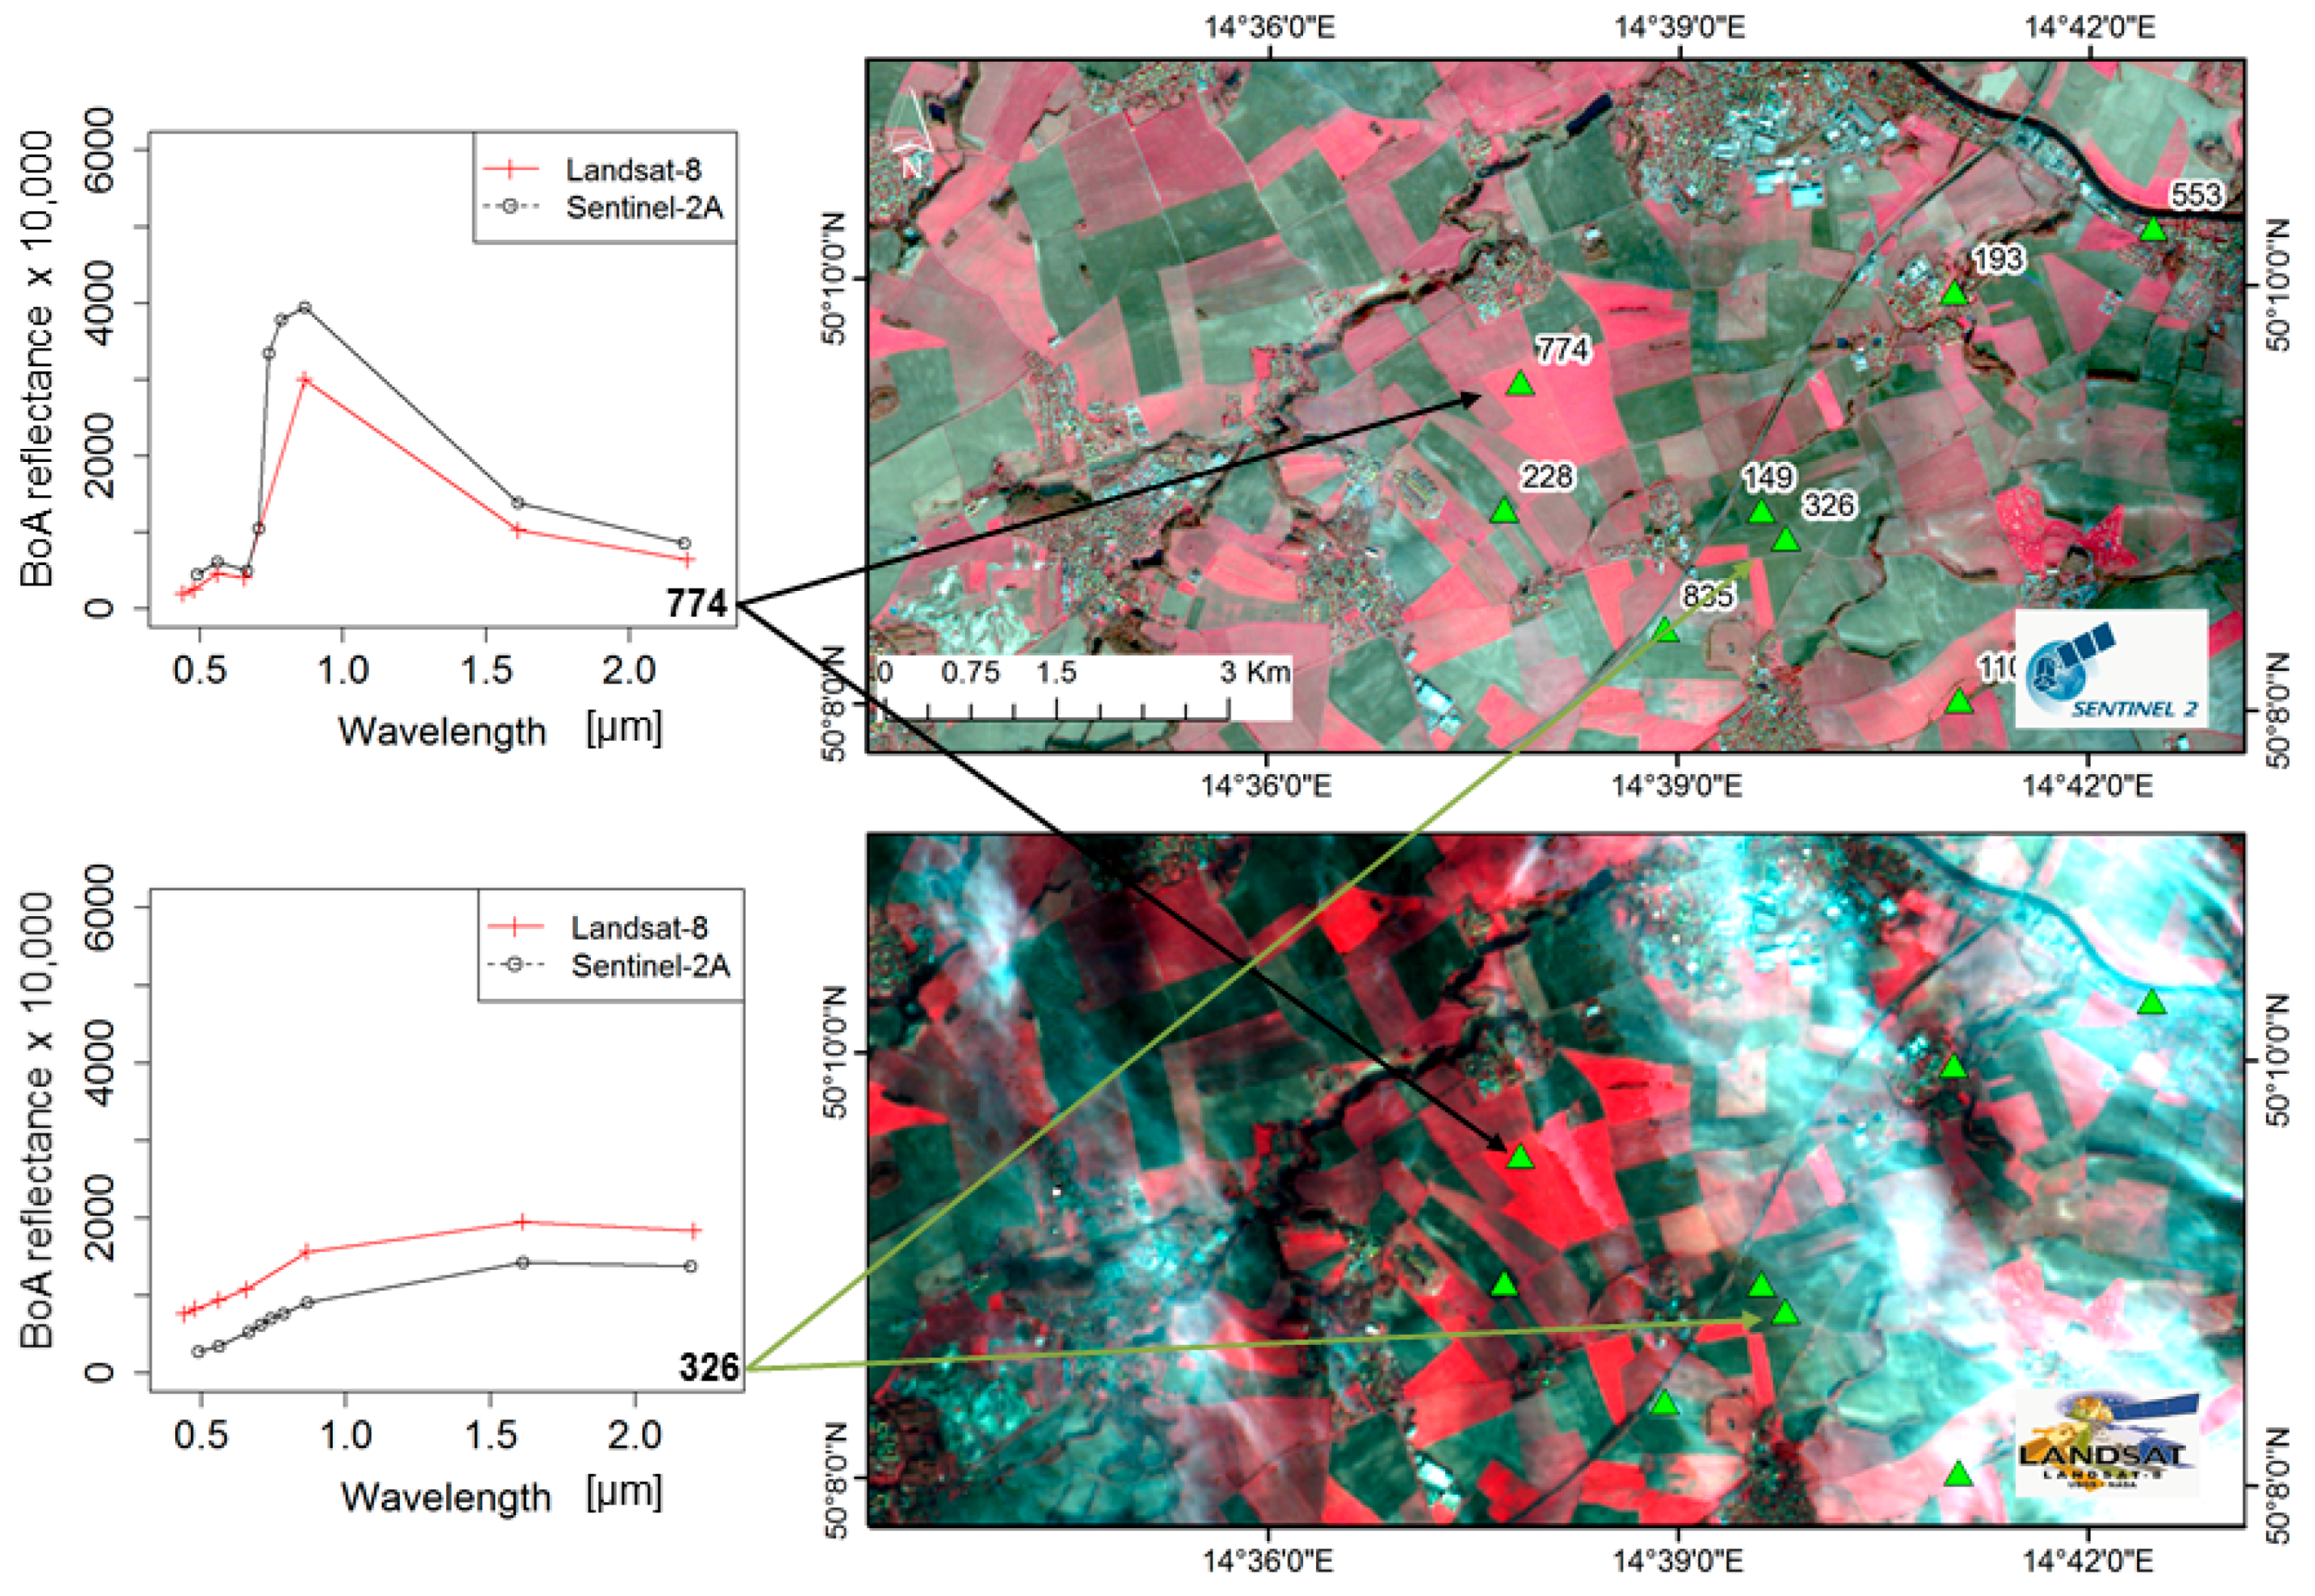
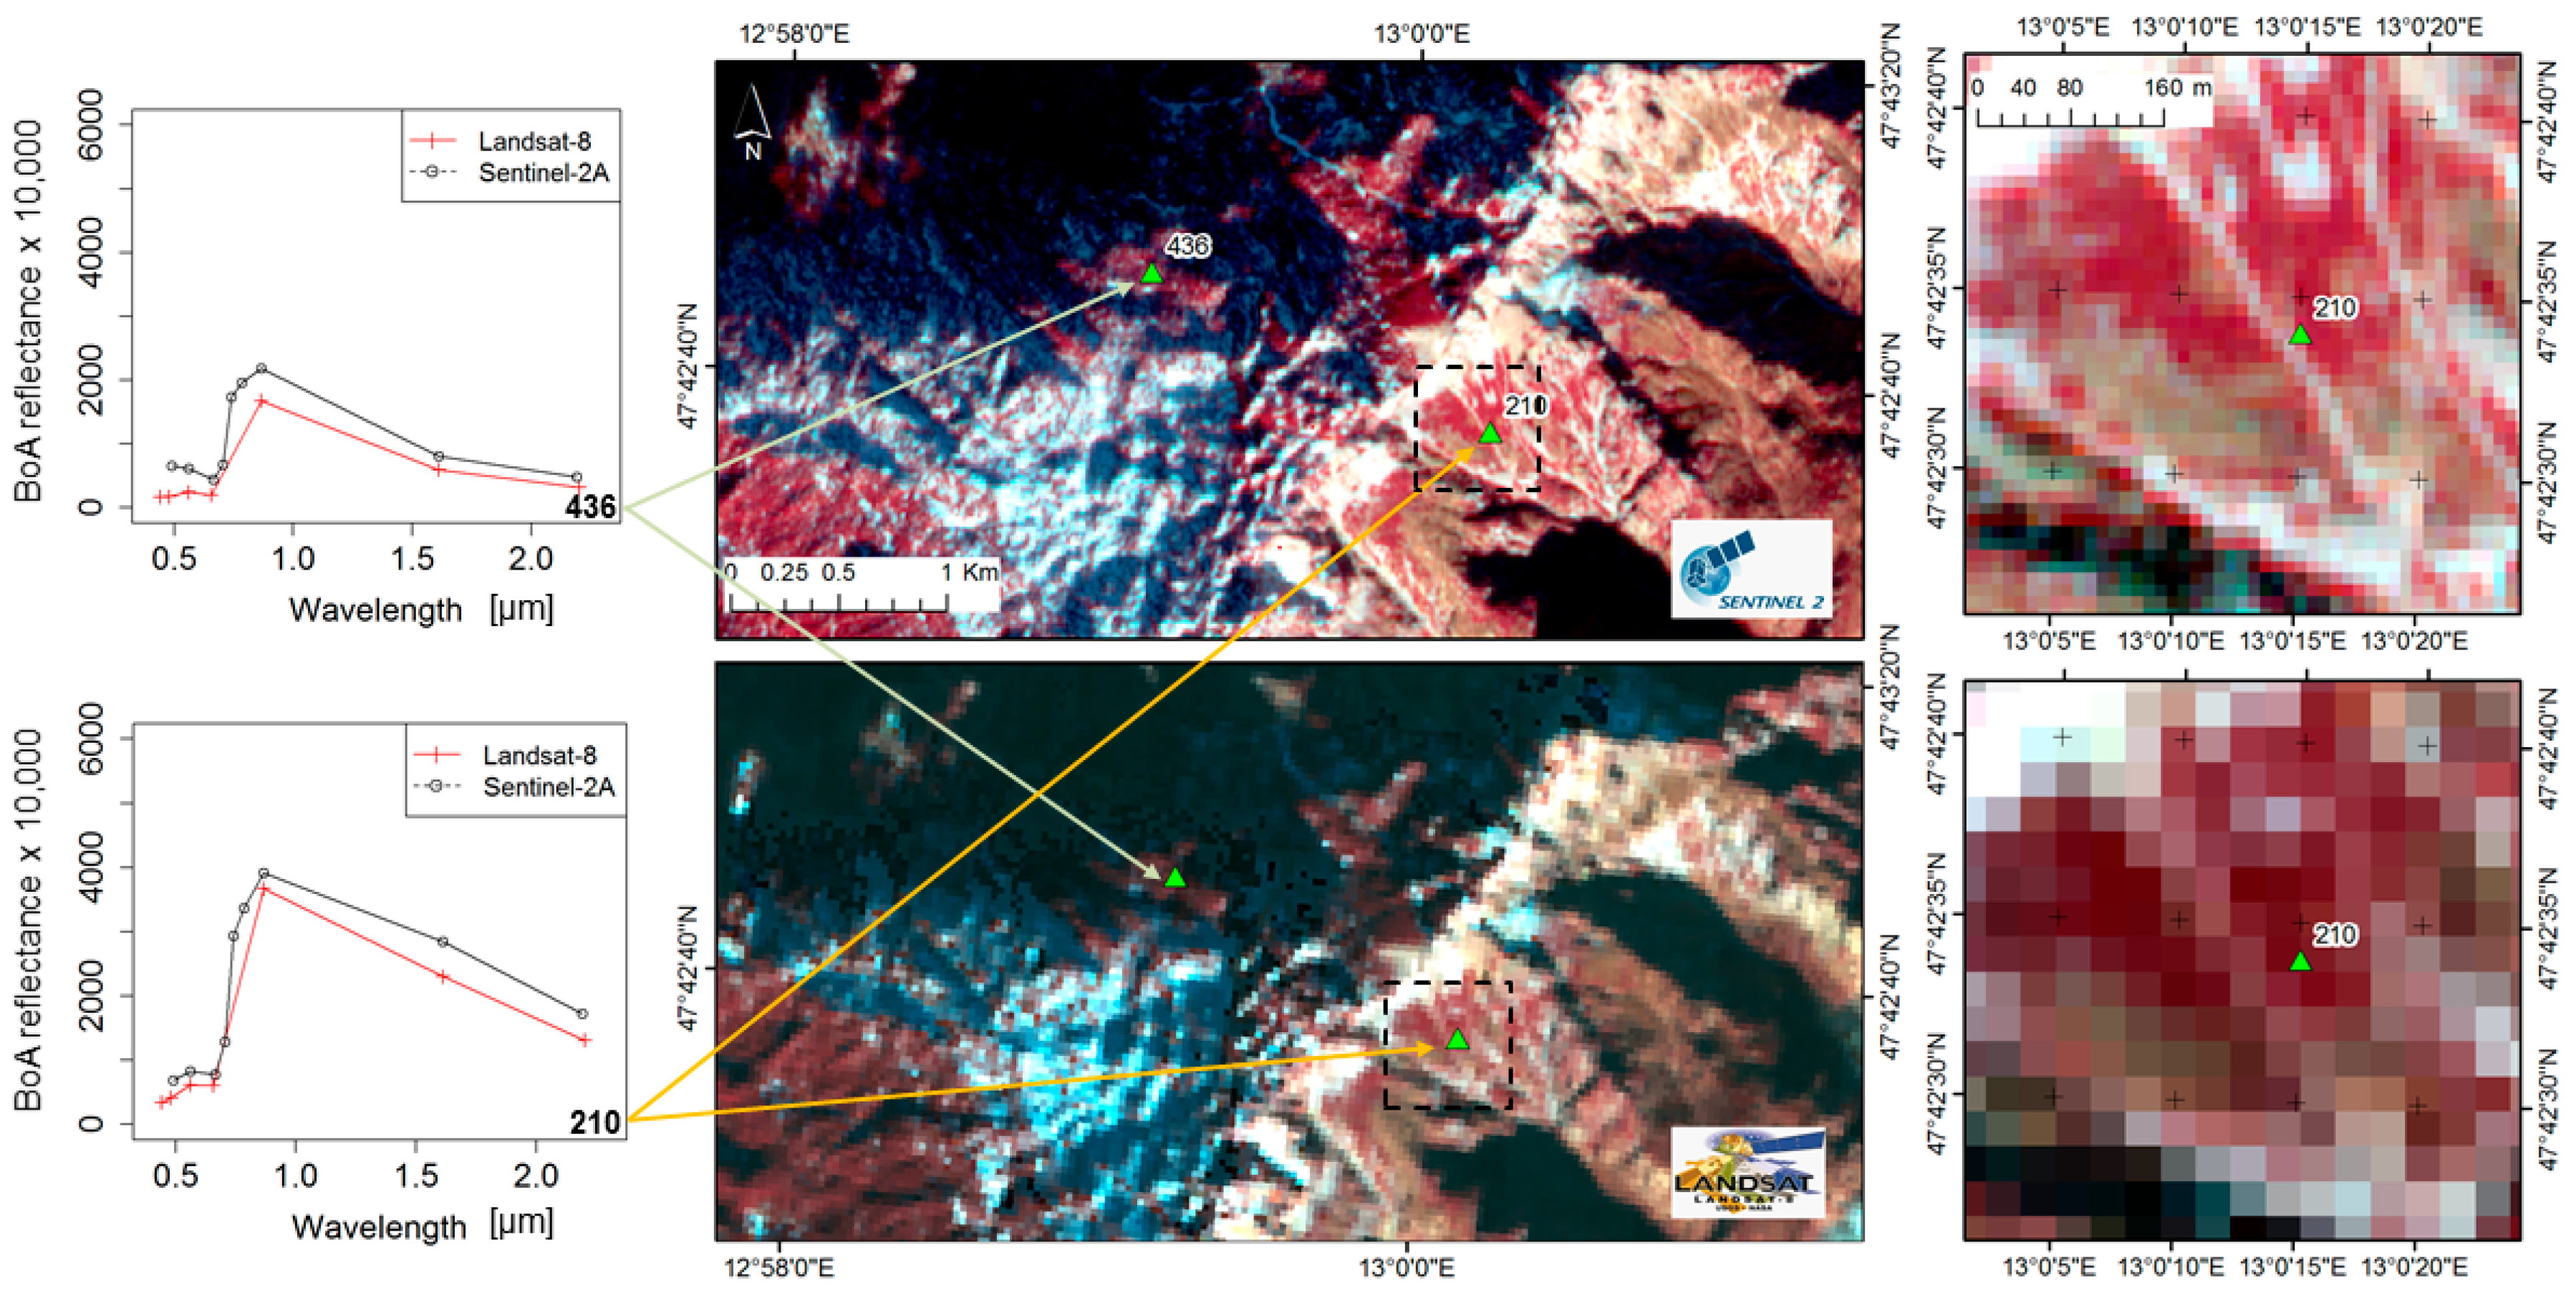
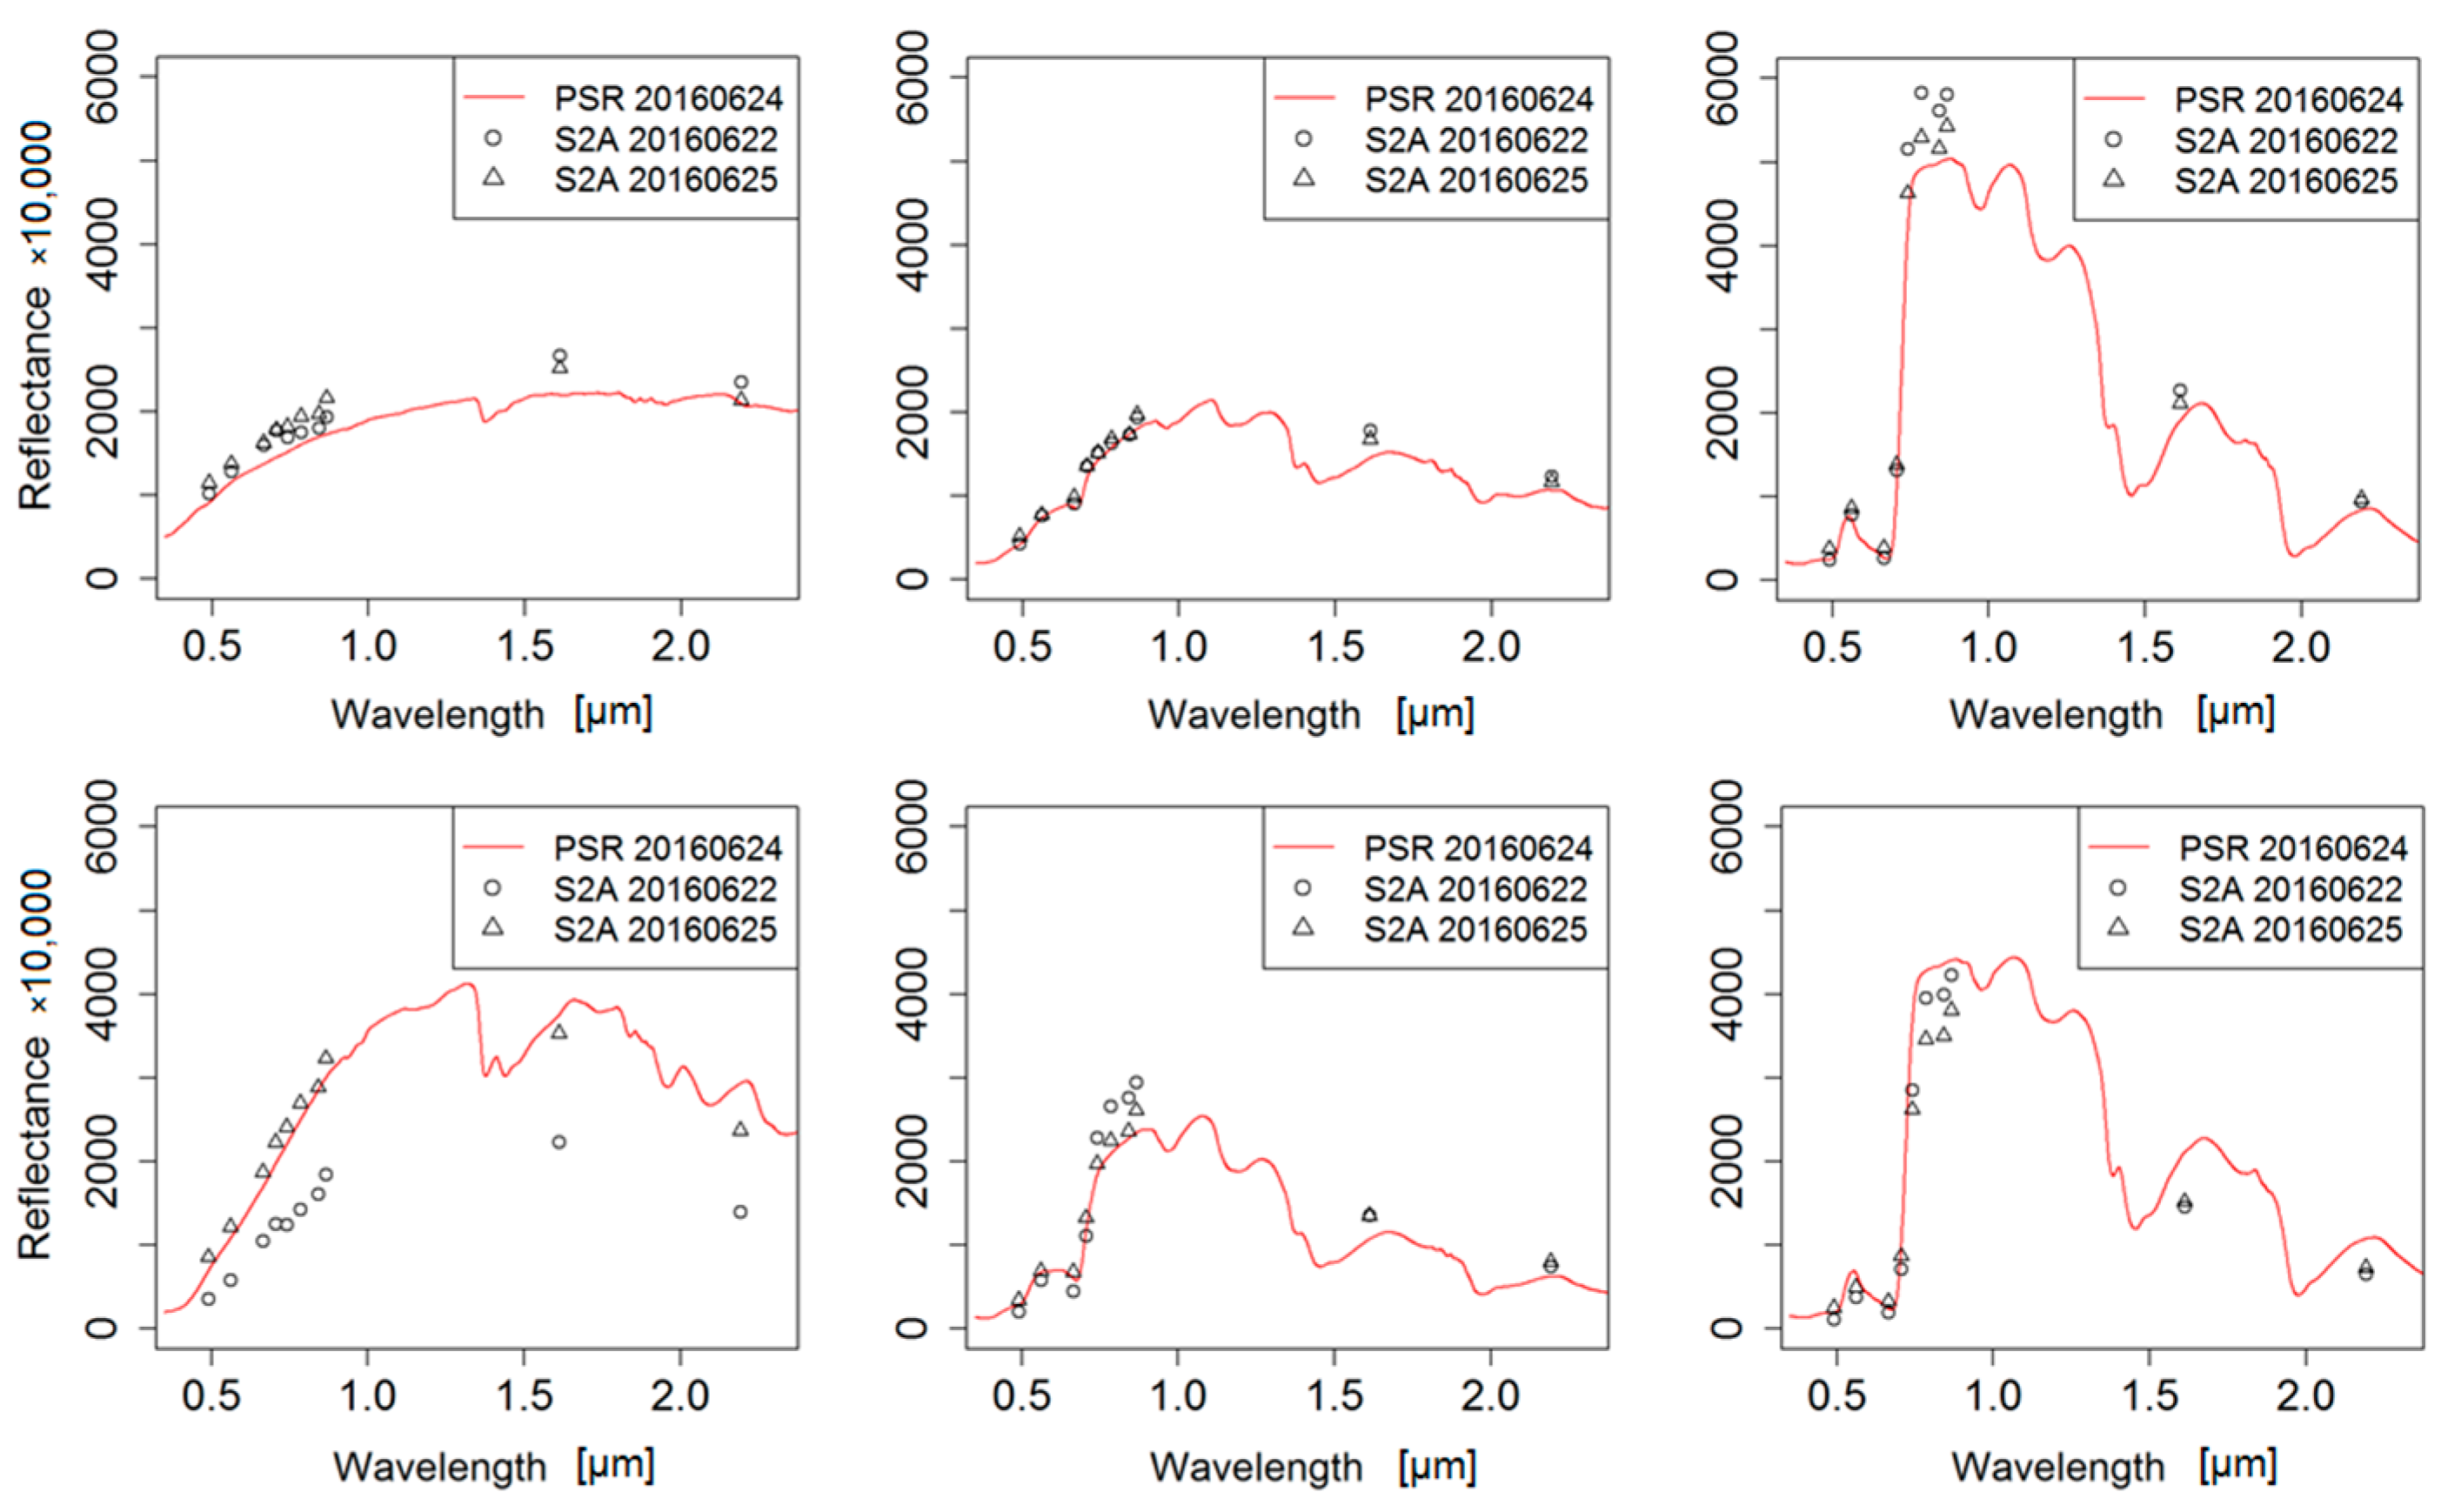
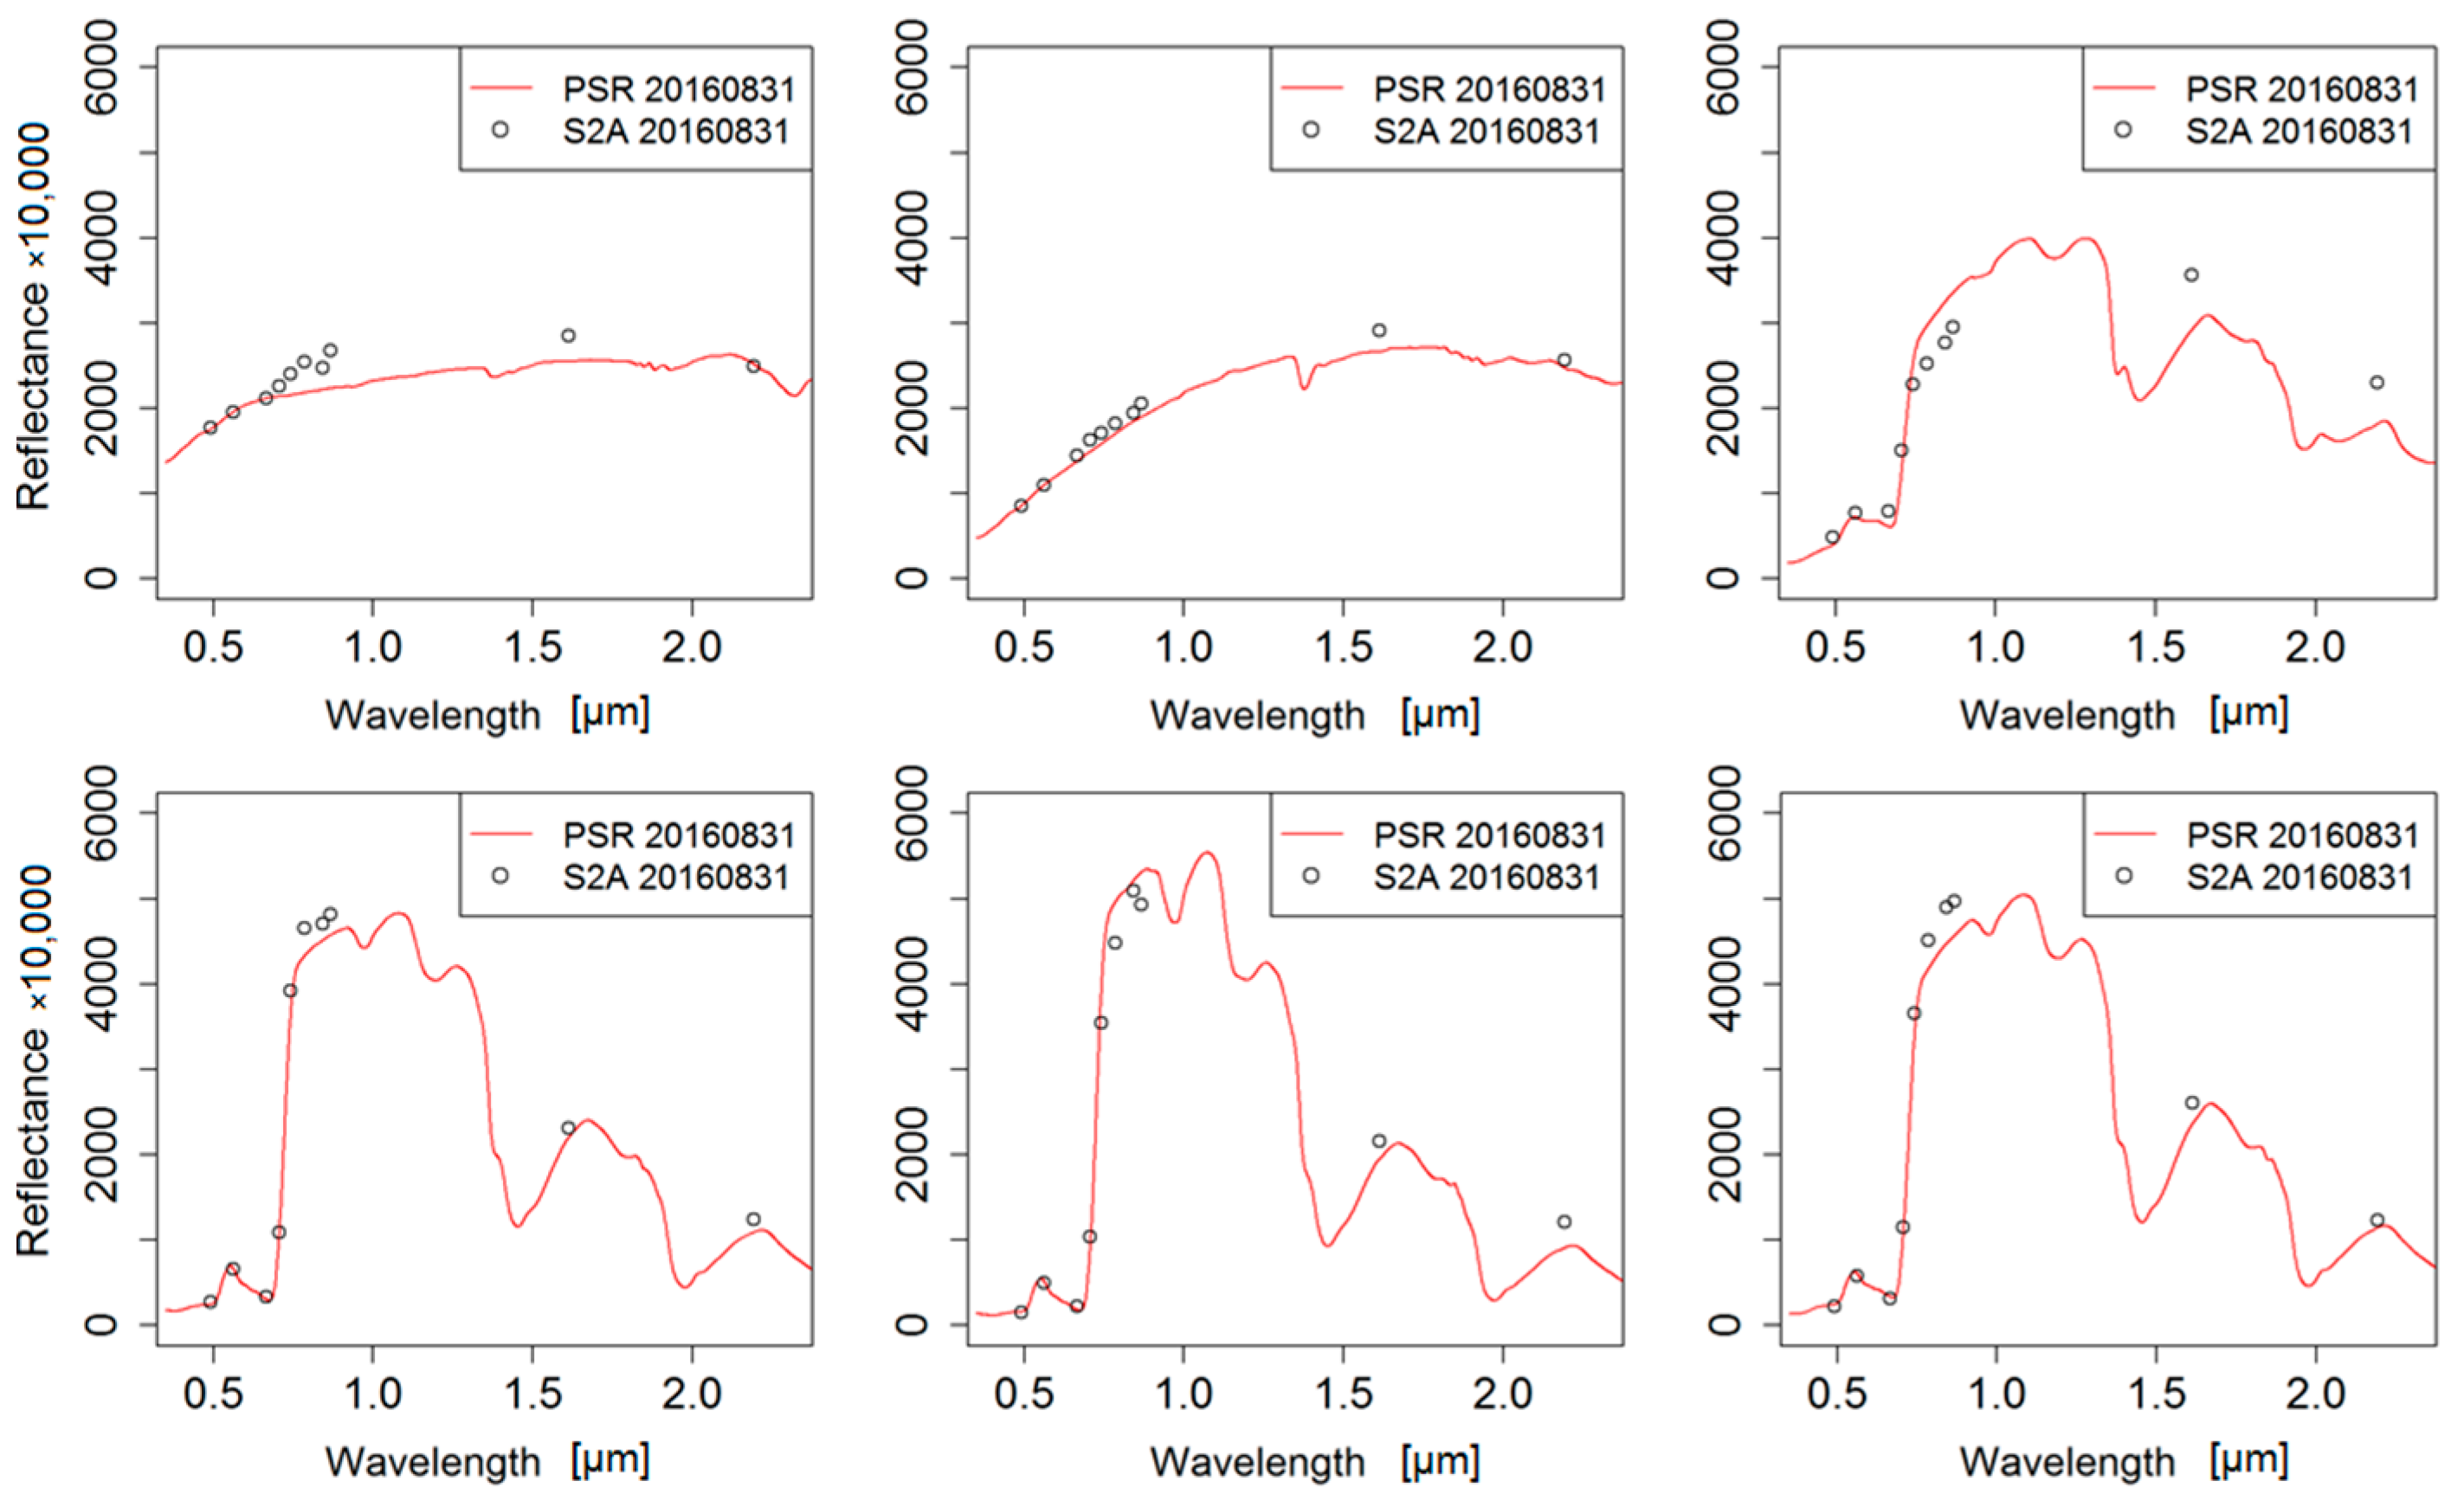
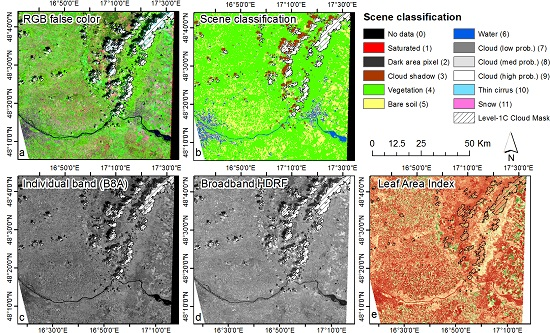
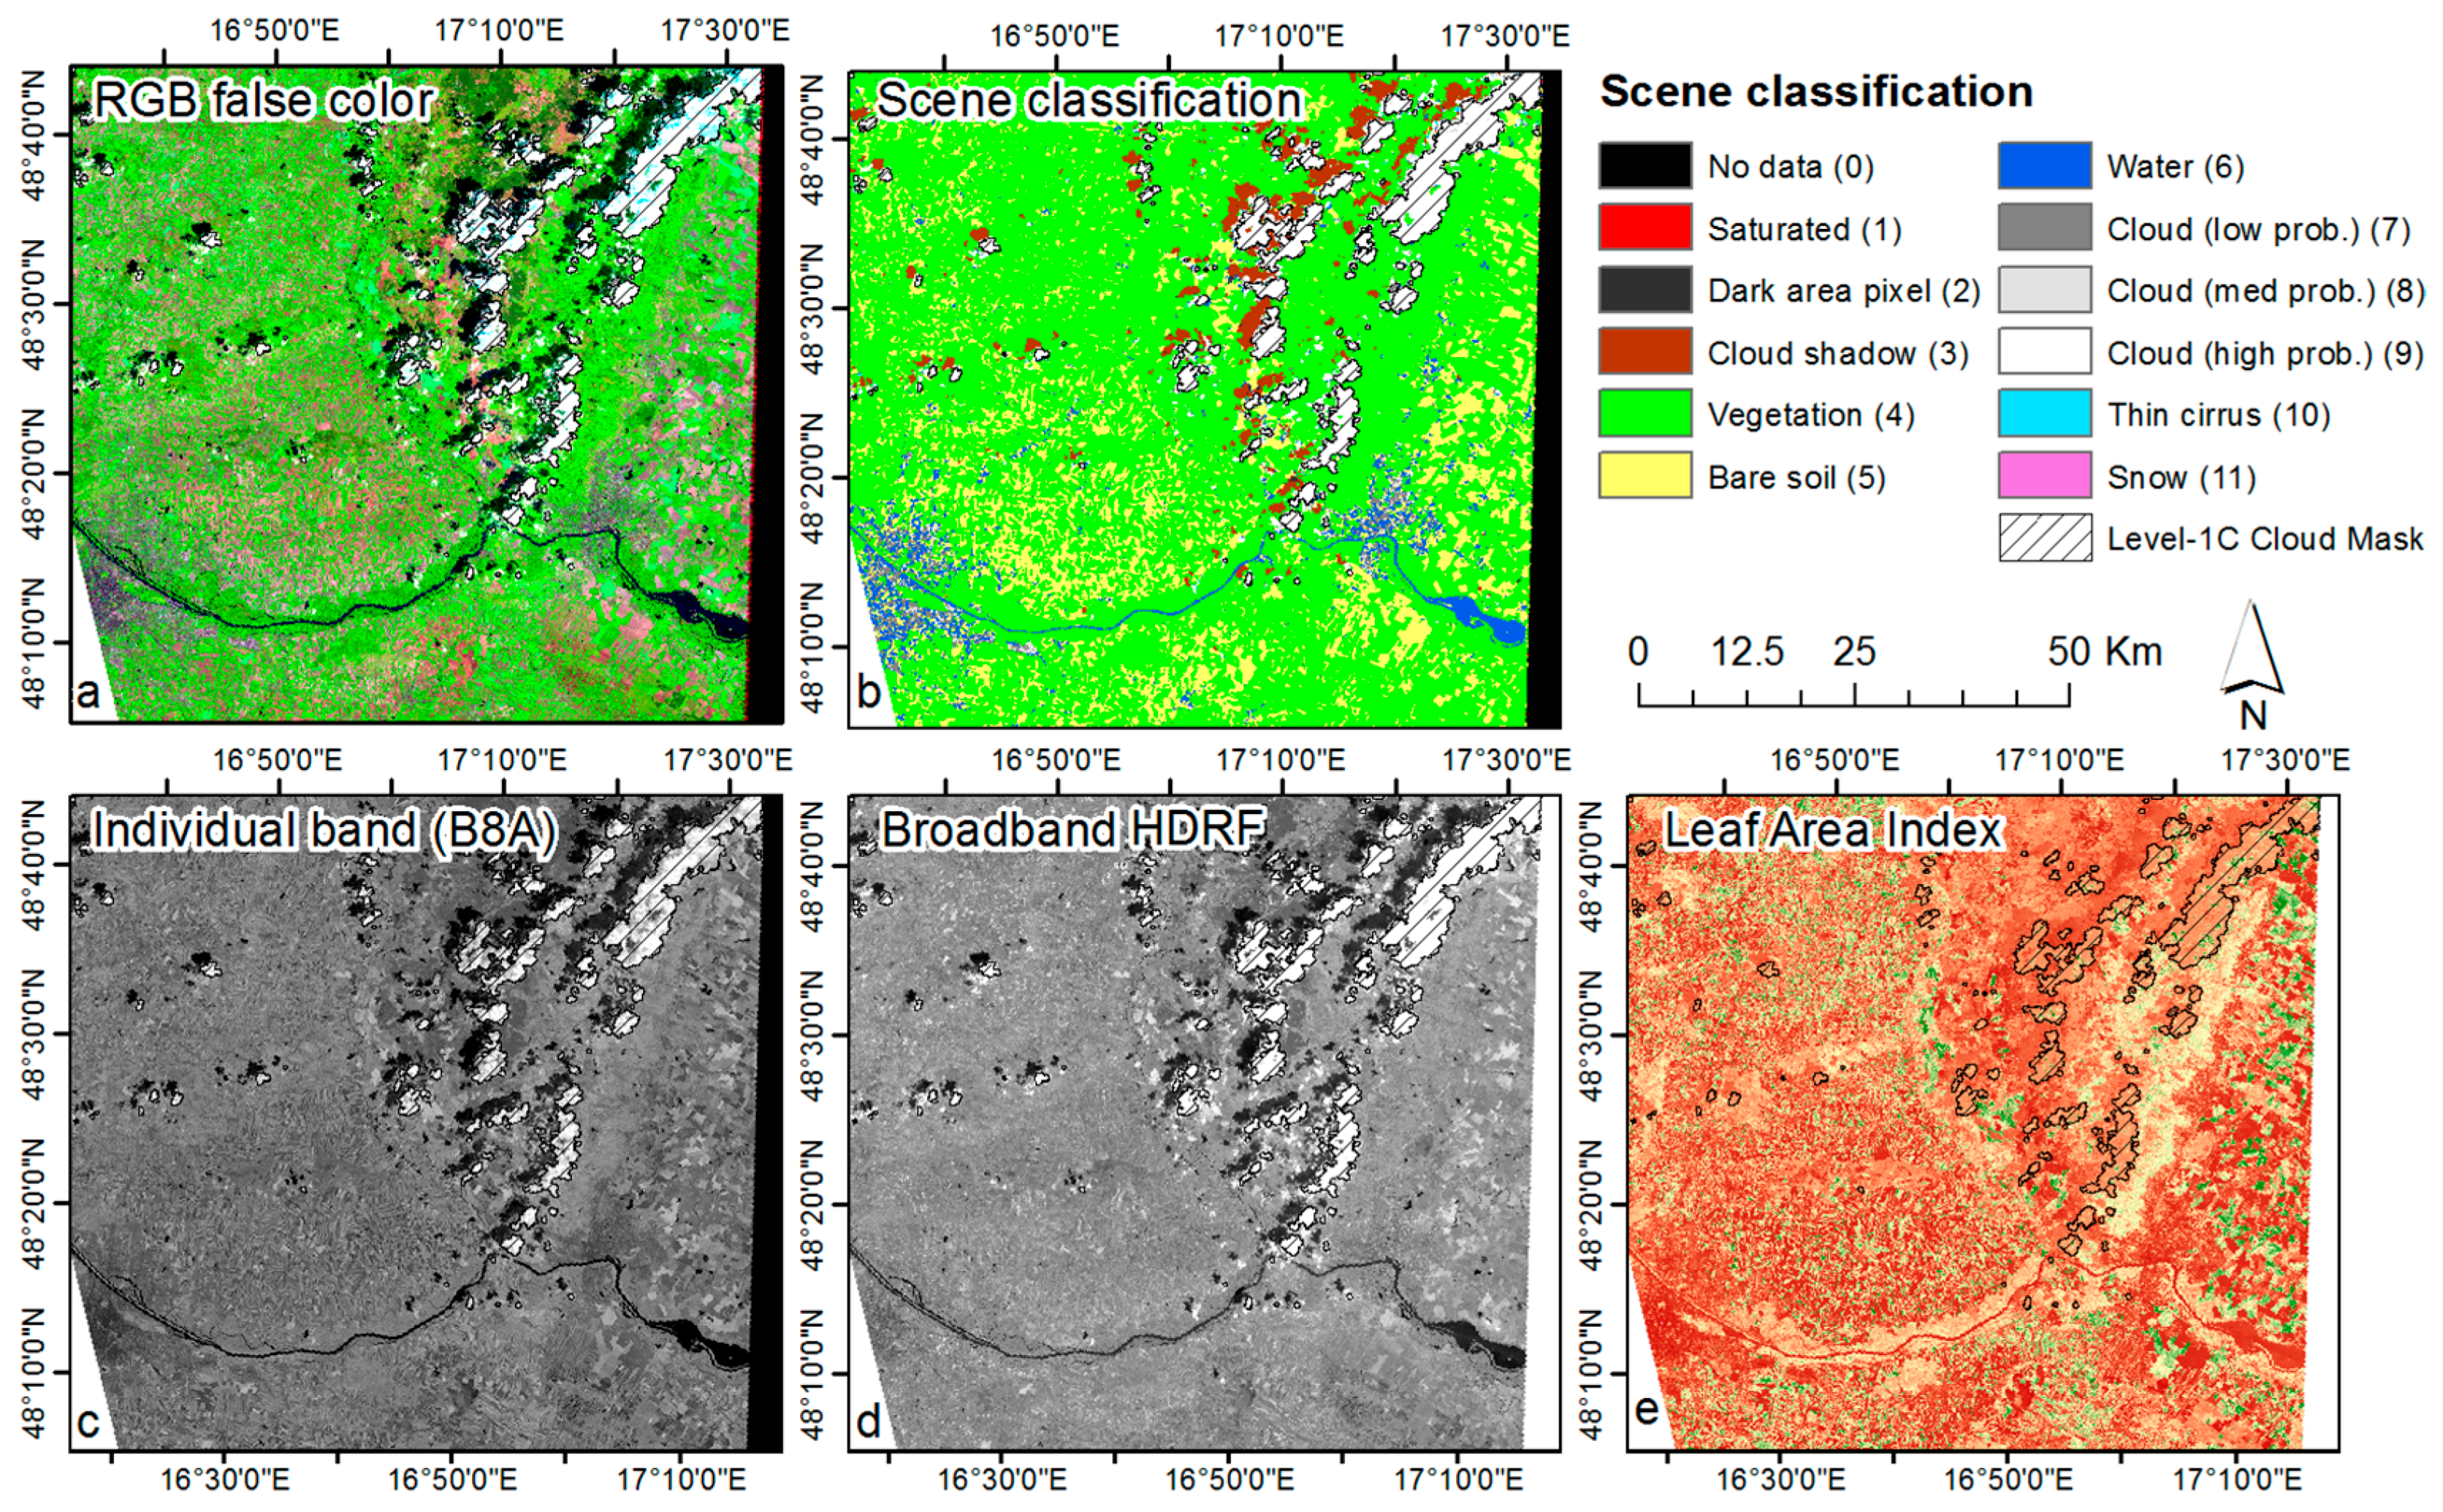
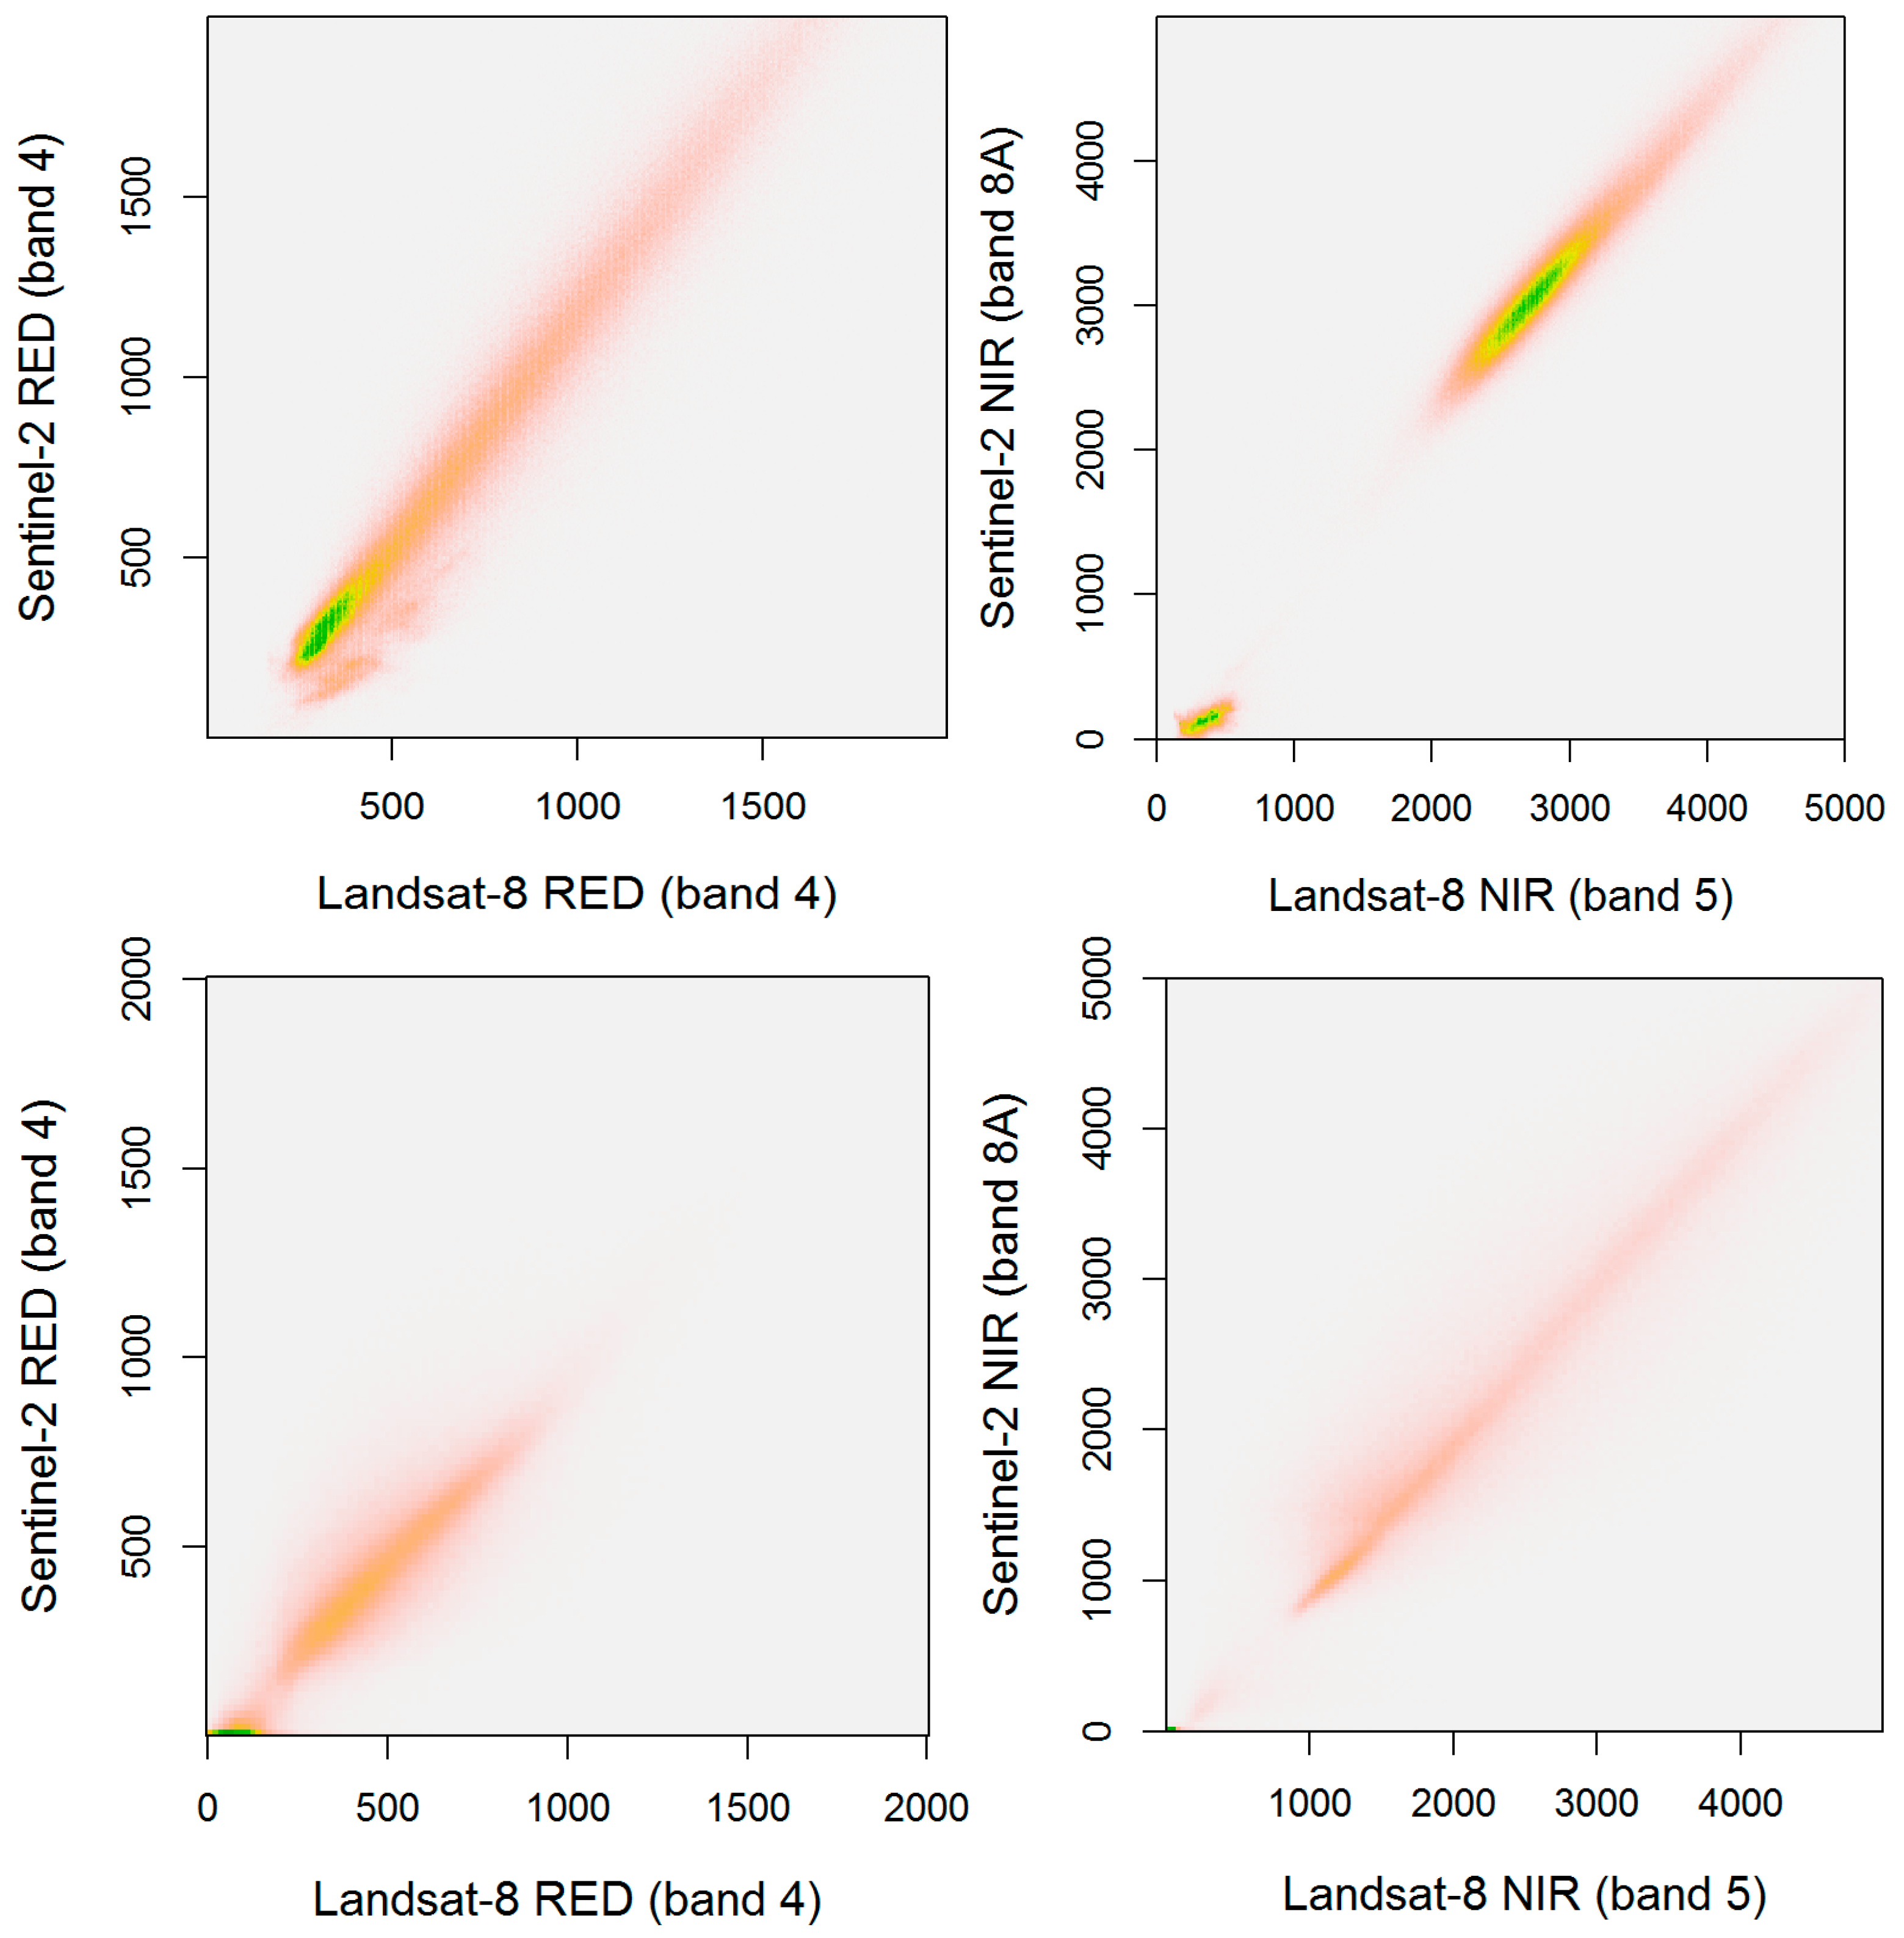
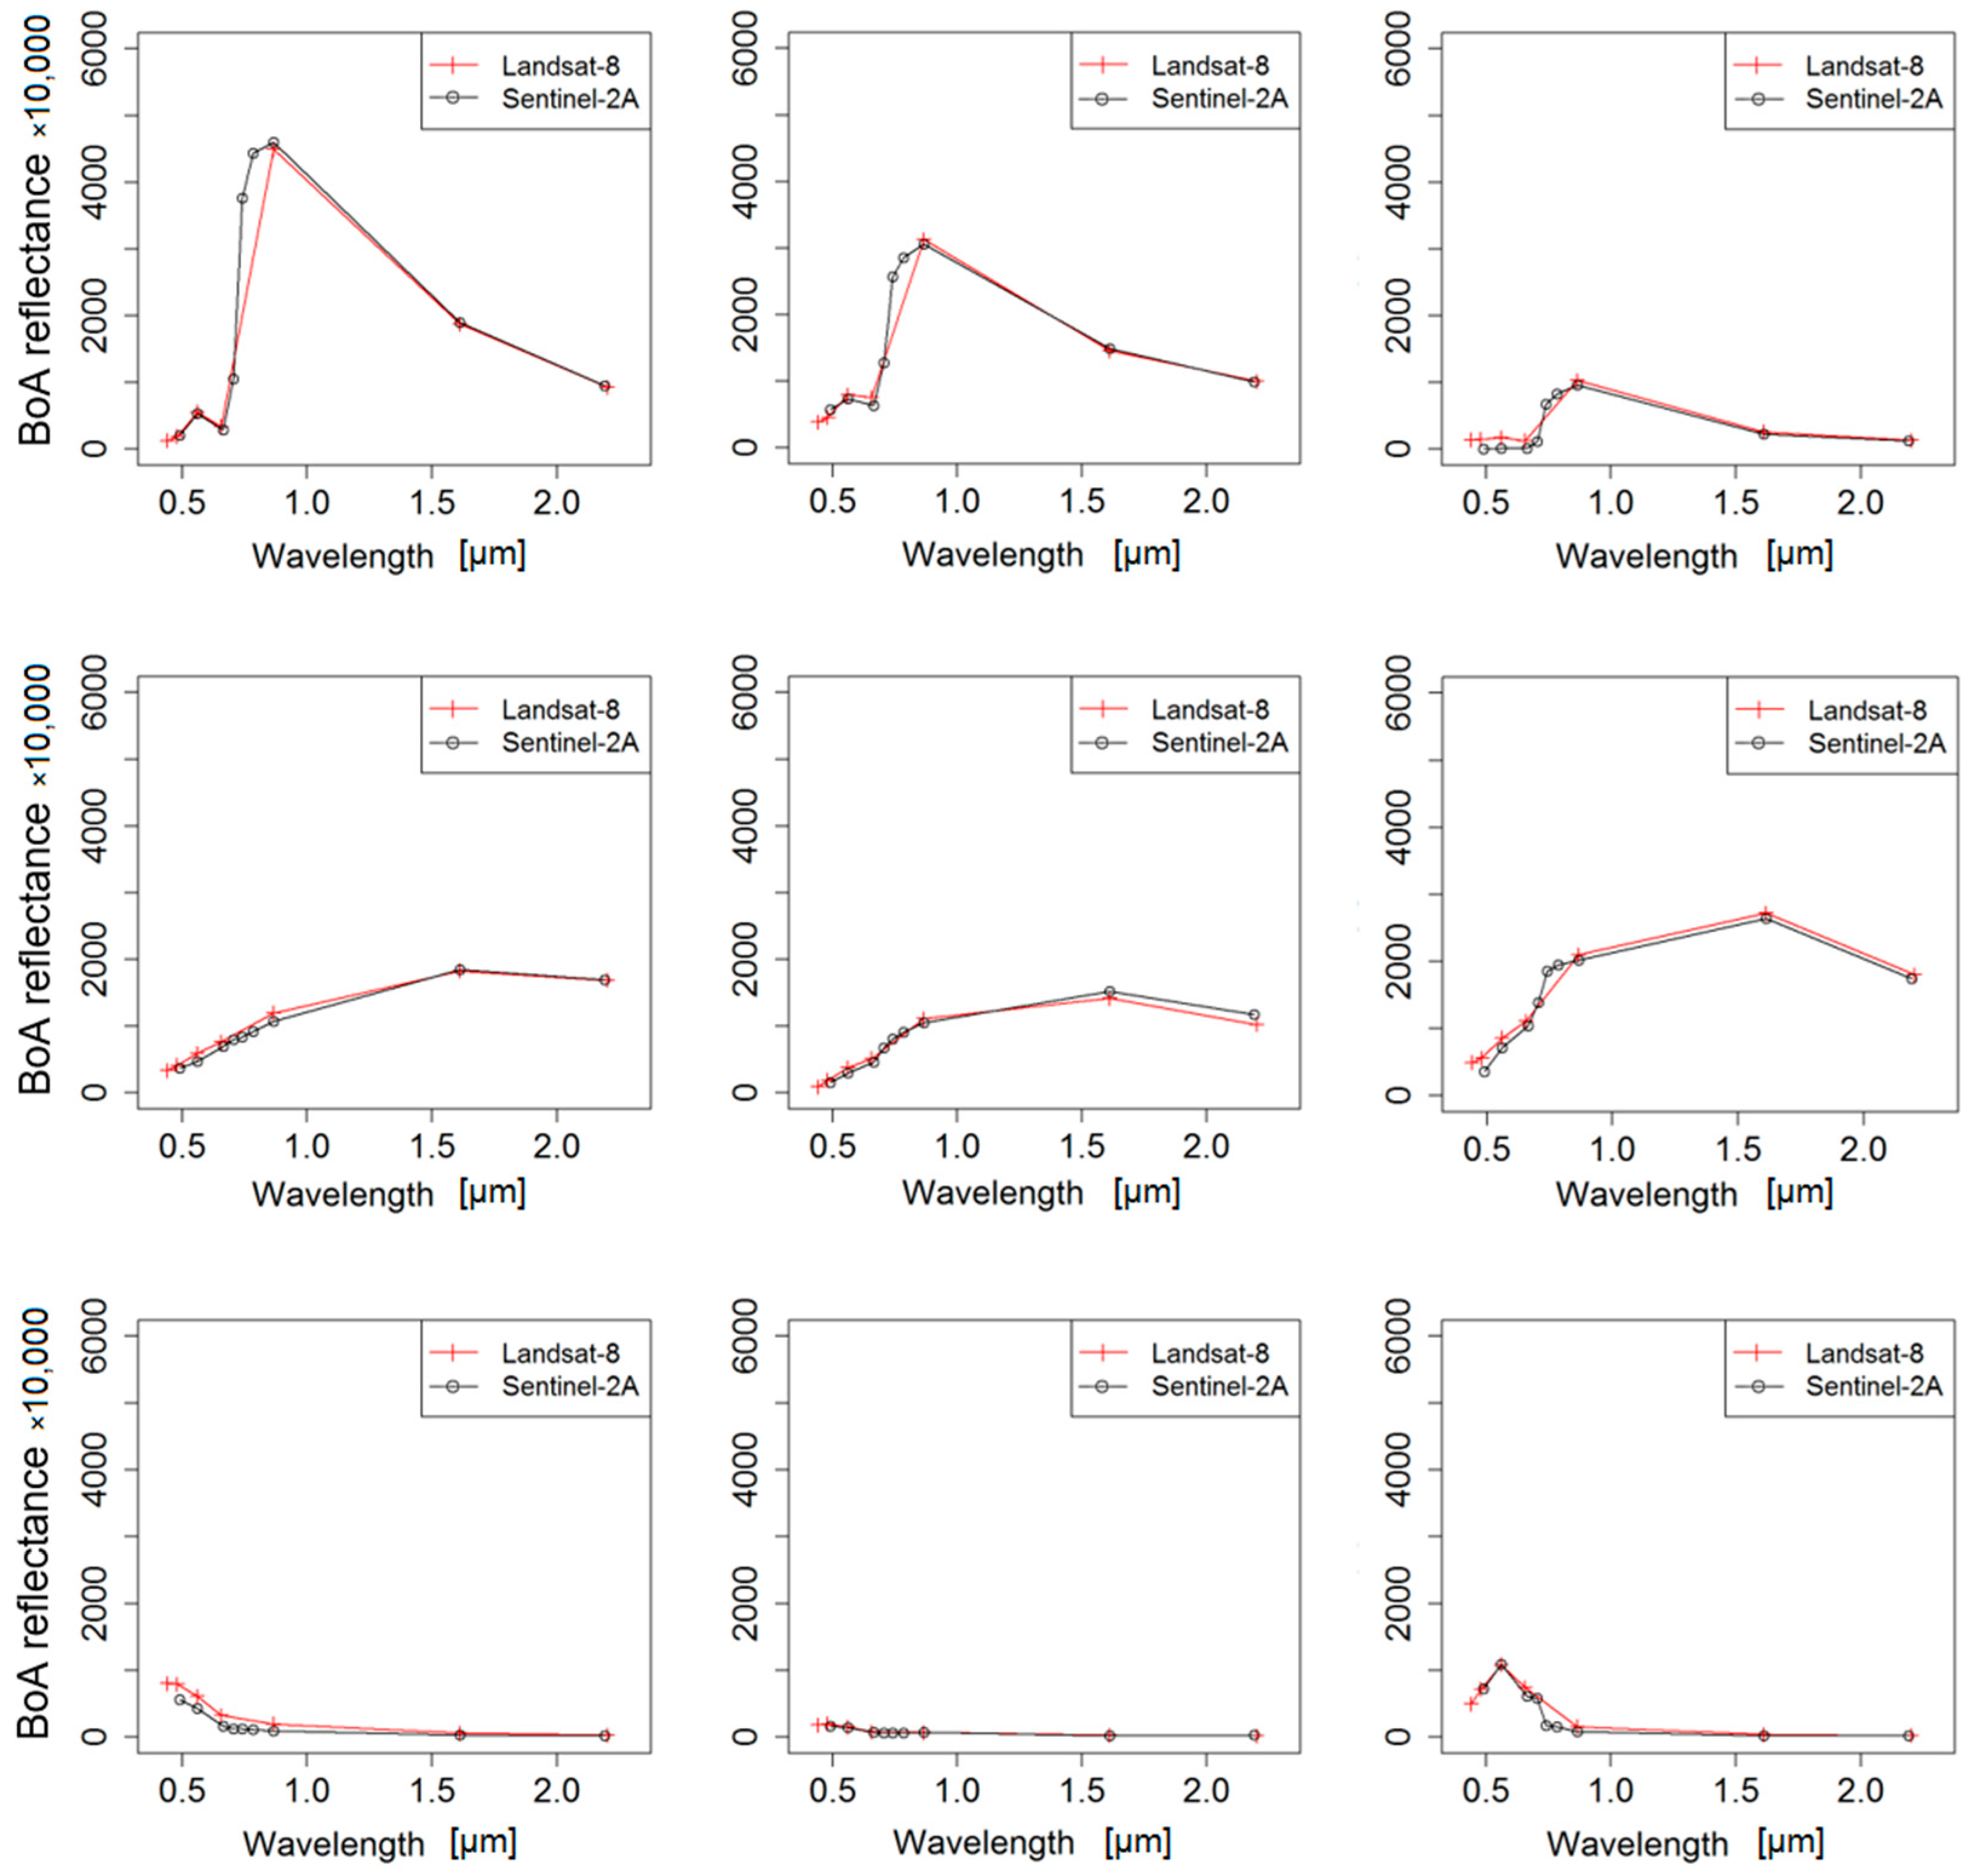
3.2. Surface Reflectance

The bottom-of-atmosphere (surface) reflectance is a basic input to many EO applications ranging from land surface phenology to land cover classification and change detection. To provide a preliminary evaluation of the Sentinel-2 algorithm implementation, we conducted a pixel-based comparison between Sentinel-2 and Landsat-8 surface reflectance data. The data were acquired on the same day for different sites in Europe and the comparison was limited to the spectral bands in common to the two satellites (bands 2, 3, 4, 5, 6, and 7 for Landsat-8, and bands 2, 3, 4, 8a, 11, and 12 for Sentinel-2). With respect to Landsat-8, we used the atmospherically-corrected Landsat Surface Reflectance Climate Data Record (CDR). Although considered provisional, the dataset reported a very good agreement with other satellite data (e.g., MODIS) and AERONET measurements [25]. The Landsat CDR data also compared favorably against manually fine-tuned atmospheric corrections [26].
Six test sites in Europe were chosen for the comparison between Sentinel-2 and Landsat-8 surface reflectance (located in Greece, Turkey, Austria, Germany, Czech Republic, and France). Within each test site, a number of randomly-selected points were chosen. Observations affected by clouds and cloud shadows were identified using the Sentinel-2 scene classification (SCL) and the Landsat-8 fmask [27]. Observations affected by cloud and cloud-shadow were excluded from the analysis. To take into account the differences in pixel size between Sentinel-2 and Landsat-8, we calculated the average reflectance value in a buffer of 30 m for Sentinel-2 data. This buffered reflectance was compared to a single pixel reflectance for Landsat-8 over a set of 4400 Landsat-8 pixels.
Results show an overall R2 = 0.90 and RMSE = 0.031 when using all the six homologue bands, with RMSE ranging from 0.023 for the green band to 0.043 for the near-infrared band. A detailed overview of the comparison is provided for two contrasting (summer/winter) acquisition dates in Figure 4. A spatial subset of the two acquisitions for the red and near-infrared bands is shown in the scatterplots in Figure 4. Details regarding the image data are provided in Table 2.
For Greece, considering the six homologue bands, results show a R2 of 0.96 and RMSE of 0.03 reflectance units. For Austria, results show a R2 of 0.91 and RMSE of 0.027.
Figure 5 shows some exemplary spectral profiles from atmospherically-corrected Landsat-8 and Sentinel-2 pixels acquired on the same date. The spectral profiles represent different land cover types including vegetation, soil, and water. They show a very good match over the six homologue spectral bands.
Amongst the various randomly selected pixels, occasionally, we observed larger differences between the atmospherically-corrected reflectances of the two satellites (Figure 6 left). Checking those observations revealed that our comparison included pixels affected by undetected clouds (scene classification or fmask). Some larger divergences were also observed over heterogonous pixel locations and over complex surface terrains (Figure 7 left). The differences are probably a direct result of the different spatial resolutions of the two satellite sensors.
A field campaign was organized on 24 June 2016 in an agricultural area in Austria [28] to measure surface reflectance with a field spectro-radiometer in coincidence (±2 days) of two Sentinel-2 overpasses (tile 33UXP on 22 and 25 June, respectively). A second campaign was organized on 31 August in the same area and a Sentinel-2 image was acquired on the same day. The spectral reflectance was measured at ground over homogeneous targets using a Spectral Evolution PSR-2500 radiometer operating in the range 350–2500 nm with a spectral resolution of 3.5 nm (in visible, VIS, and near-infrared, NIR) and 22 nm (in the short-wave infrared, SWIR) [29]. The manufacturer reports a calibration accuracy of 5% (400 nm), 4% (700 nm), and 7% for (2200 nm). Spectral data were collected between 10:30 and 12:30 (satellite overpass at 11:30) by averaging 10 scans for each target over an area of approximately 10 × 10 m. The points were geo-located using GPS measurements. A calibrated white reference panel (Spectralon) was used to measure solar irradiance at regular intervals during the measurement period. The instrument was deployed with a 14° lens at a distance of 1 m from the top of the surface (resulting in a field of view of 25 cm). In post-processing, the spectra were smoothed using the Whittaker smoother [30] with a Lambda of 500.
Figure 8 and Figure 9 shows some examples of the comparison for different targets for the two campaigns. For most targets a very good agreement between Sentinel-2 signatures and the reflectance measured with the PSR-2500 can be found. Figure 8 also highlight the changes of the surface reflectance within the two acquisition dates (22 and 25 June, respectively).

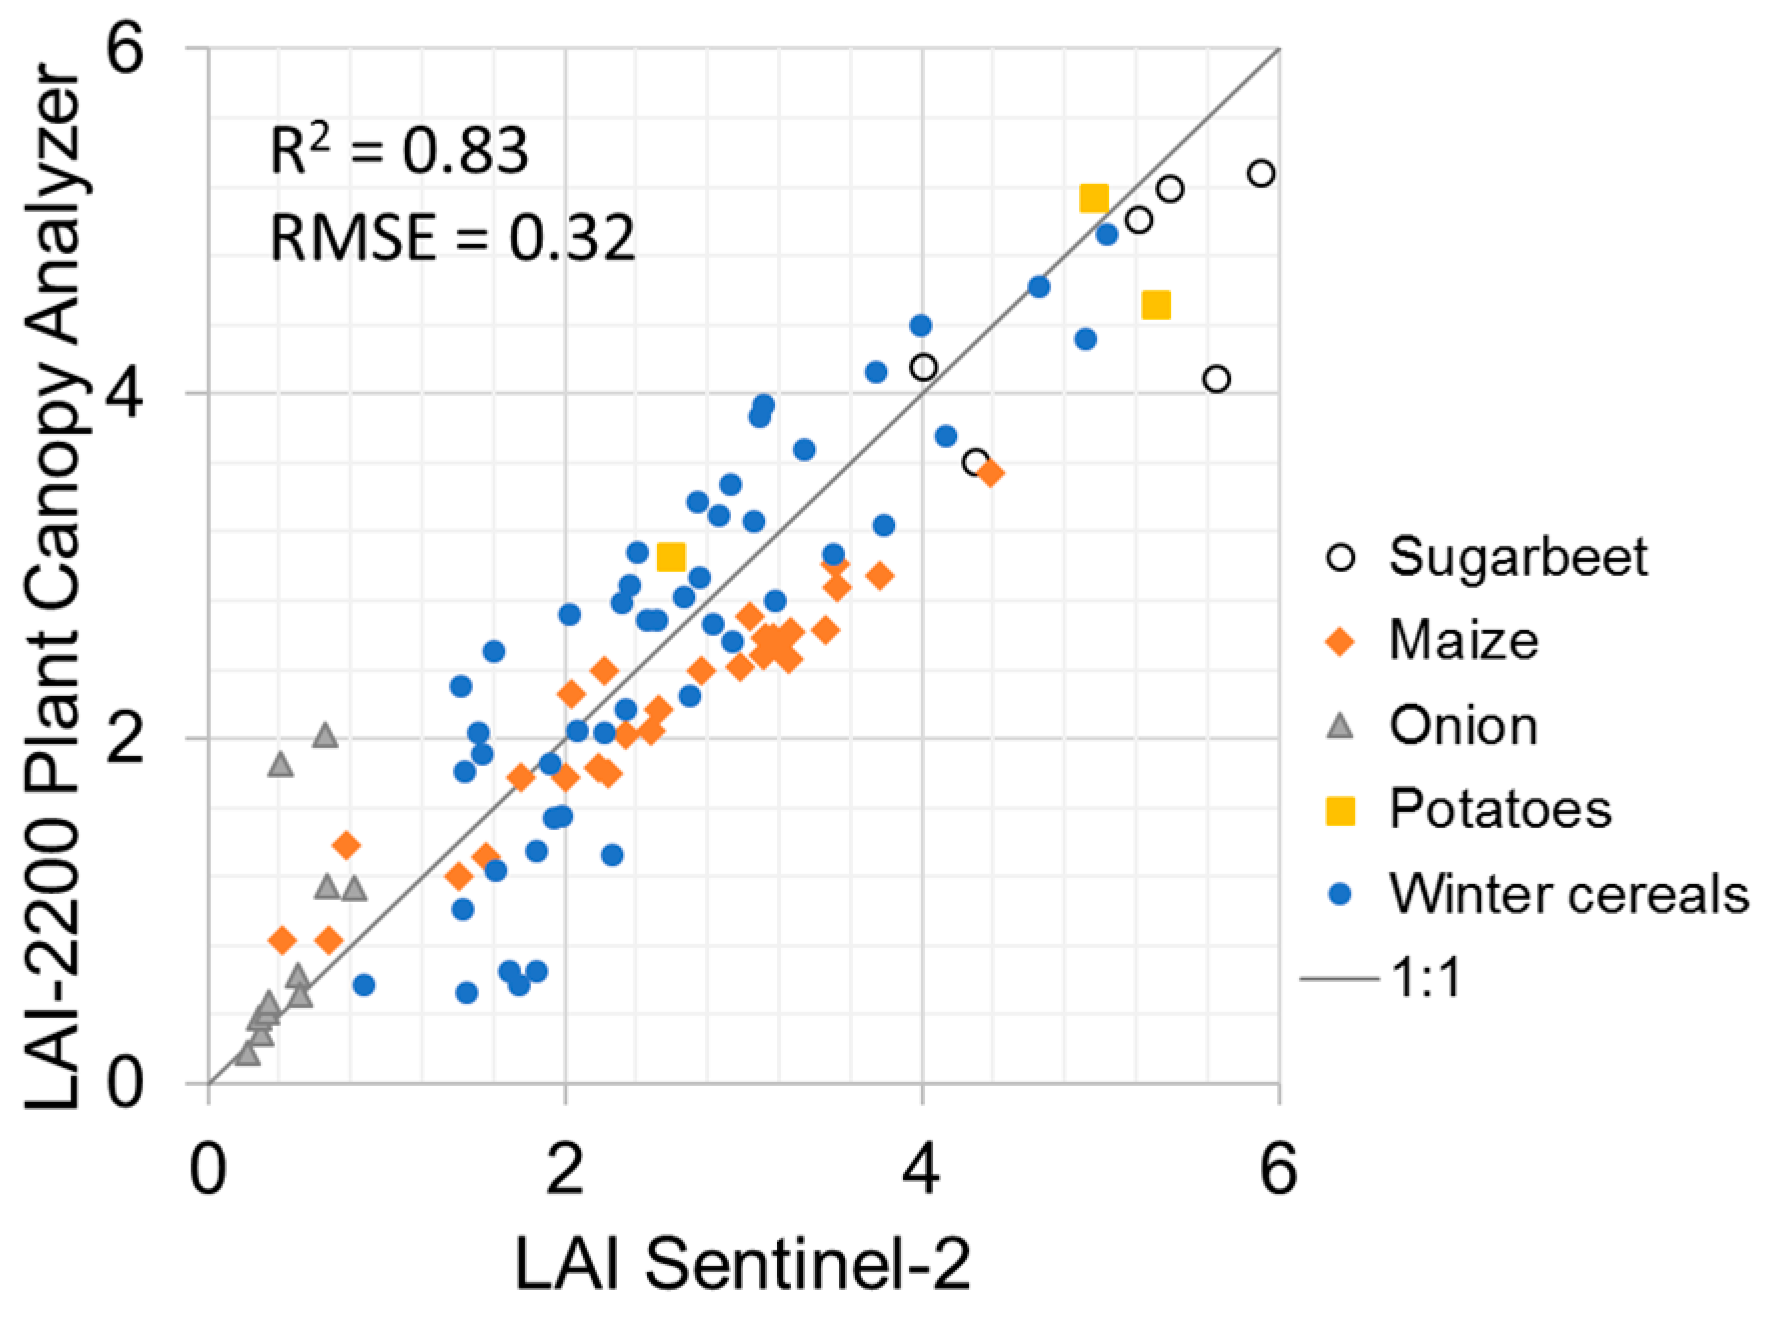
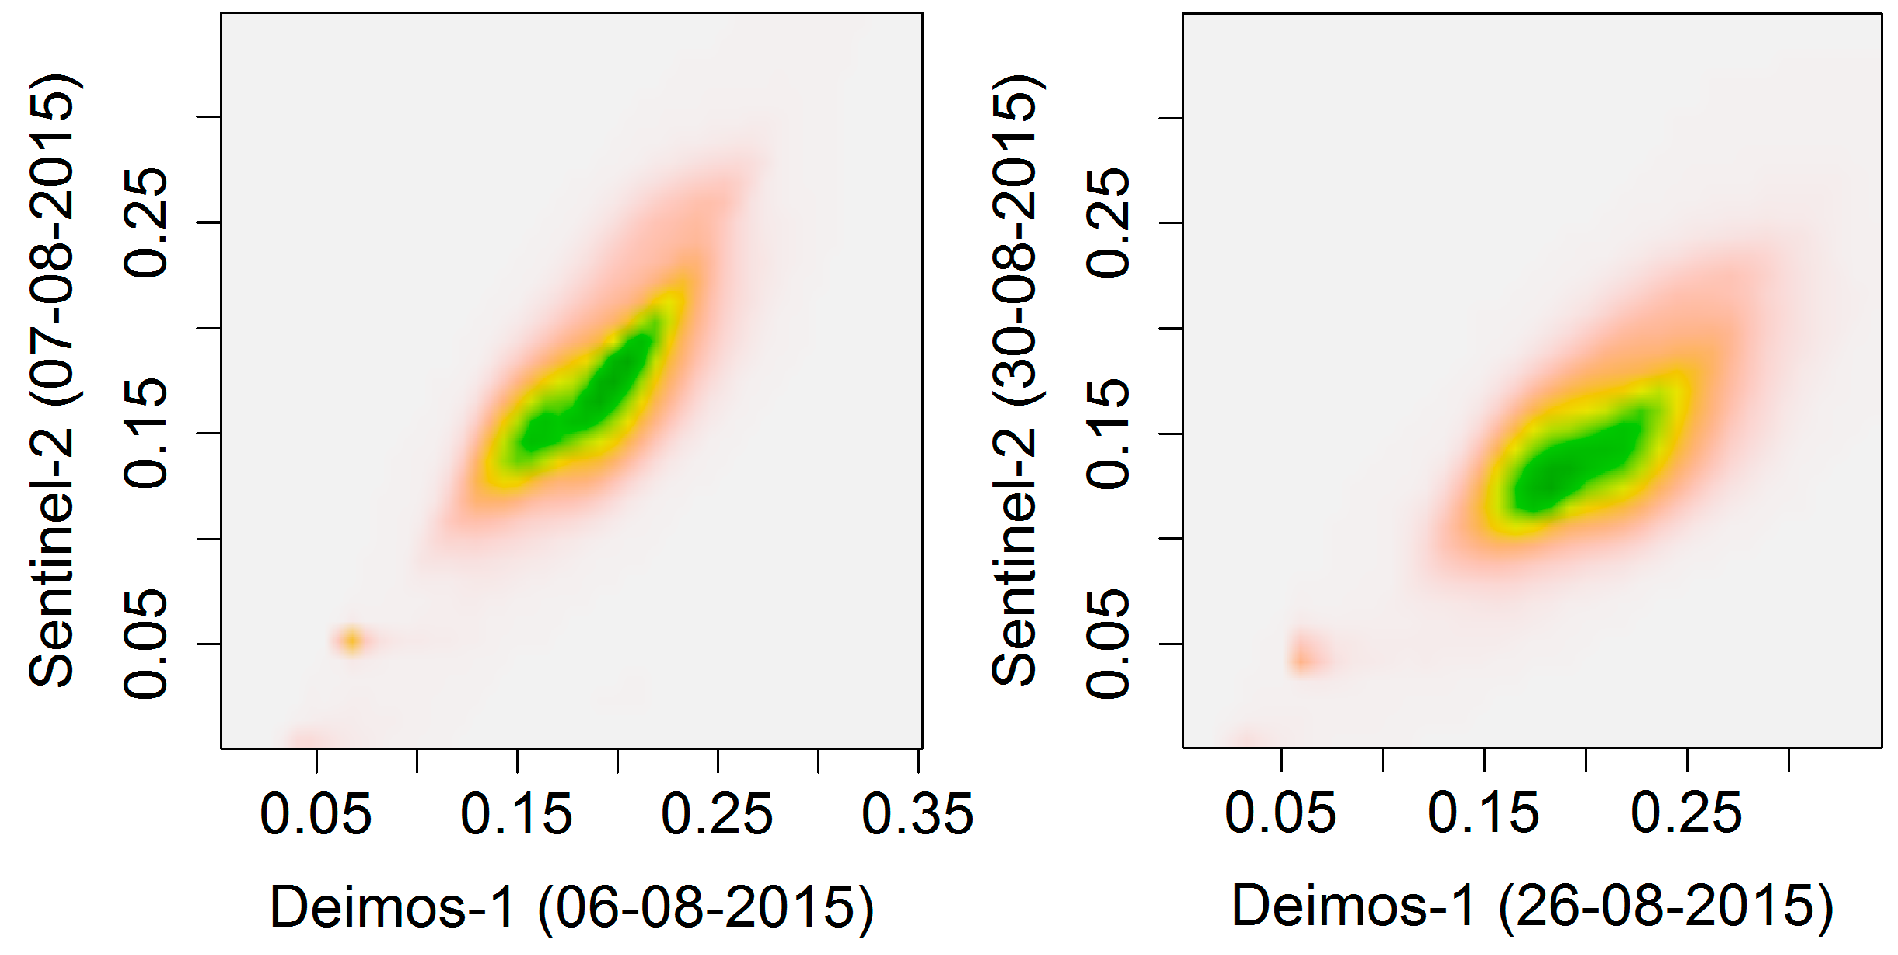
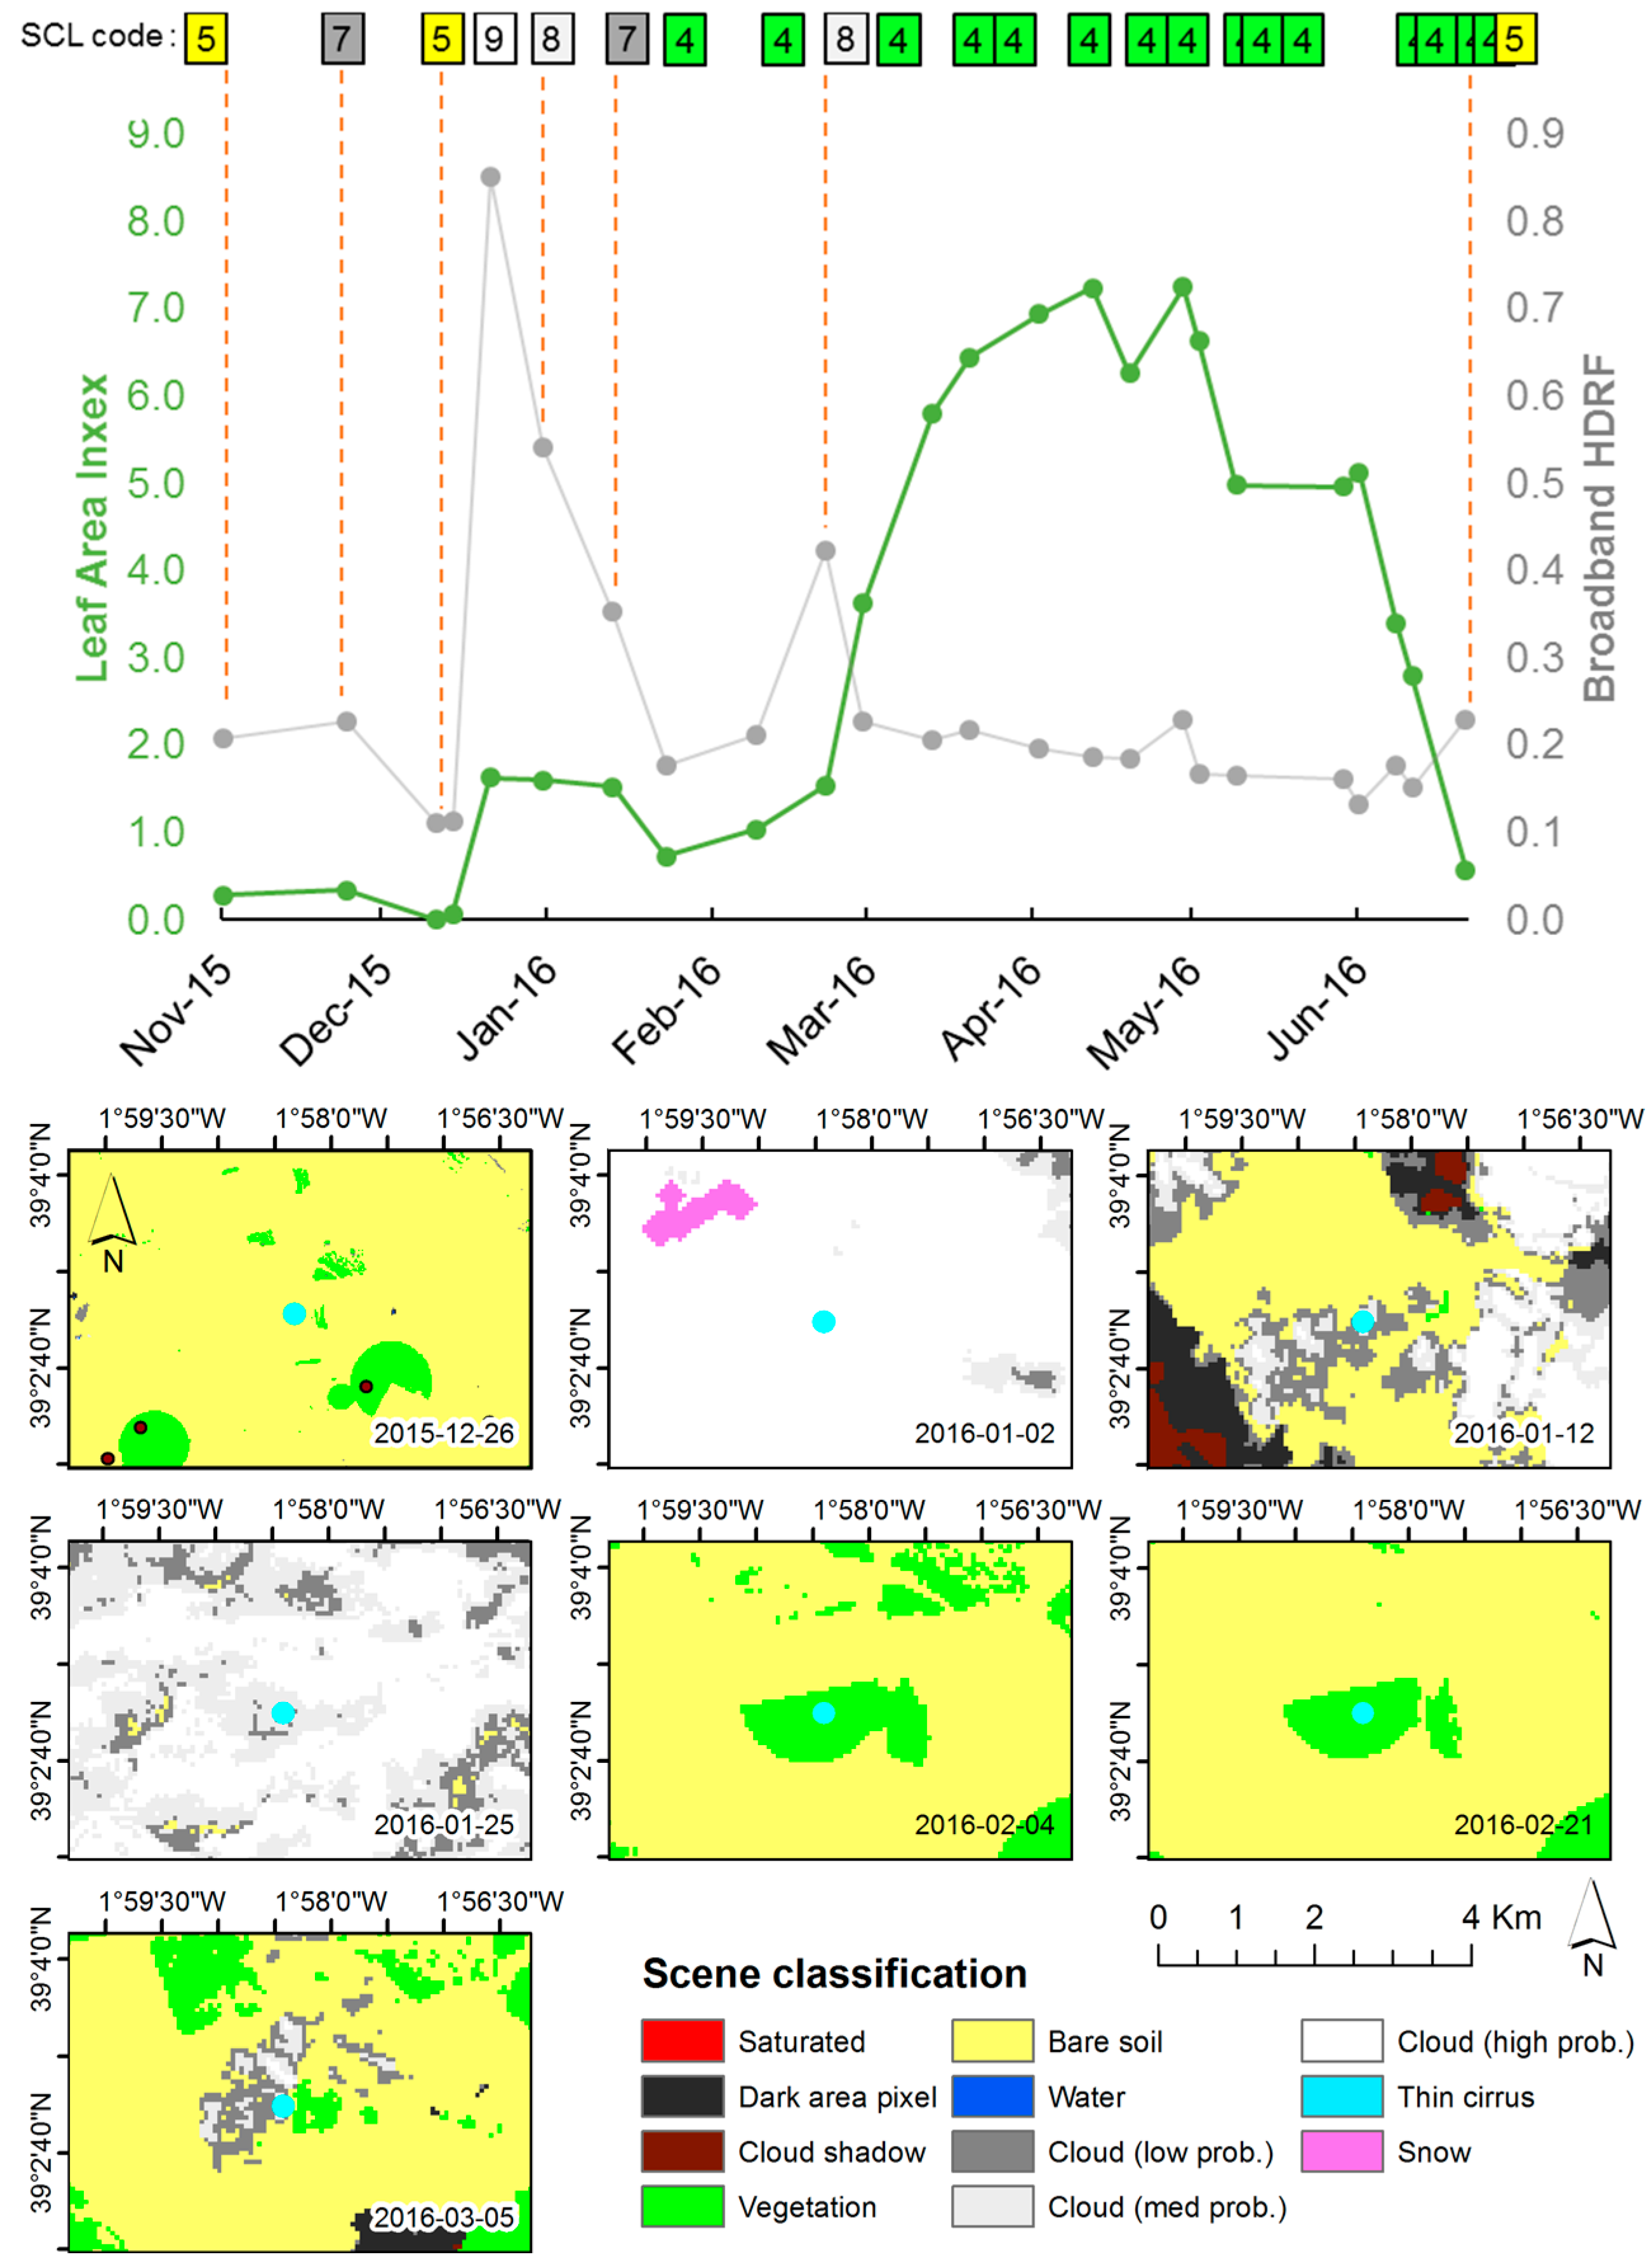
3.3. Leaf Area Index

For vegetation characterization and applications such as precision farming and irrigation management, the crop’s leaf area index (LAI) is an important structural variable with direct links to crop growth, water and energy balance. We assessed the quality of the Sentinel-2 derived LAI through preliminary comparison with non-destructive (optical) field reference measurements.
LAI reference measurements were acquired with the Licor LAI-2200 Plant Canopy Analyzer [31] from April to June 2016 over five different crops (Sugarbeet, Maize, Onion, Potatoes and Winter wheat) for a total of 95 measurements. The field measurements were used to validate LAI retrievals from six different Sentinel-2 acquisitions (tile 33UXP) over the study region of Marchfeld [14]. The maximum time span between satellite acquisitions and ground measurements was 6 days (7 April). Results in Figure 10 show a very good agreement (R2 = 0.83) and a RMSE of 0.32 m2/m2 (12% of mean value).

3.4. The Broadband Hemispherical-Directional Reflectance Factor (HDRF)

The broadband HDRF was compared to ground measurements of albedo obtained with a Campbell CNR-1 net radiometer installed at 2 m height from top of canopy. Table 3 shows the comparison for four different satellite acquisitions over two crop types. In general, we observe a good agreement over a broad range of LAI values.
The Sentinel-2 broadband HDRF (obtained on 7 and 30 August 2015) was also compared with two existing maps of the HDRF obtained from DEIMOS-1 [32] (acquired on 6 and 26 August 2015) using the ATCOR-2 value-added product module [33]. Results show (Figure 11) a good agreement between the two datasets, with a lower agreement for 30 August, probably due to the longer time span (5 days) between the two acquisitions.
As final check, we looked at time profiles of broadband HDRF, LAI and the scene classification classes (Figure 12). The selected pixel is from cropland located in the Barrax region, Spain, from November 2015 to end of June 2016. We observe a temporal evolution of LAI that is consistent with the crop growing pattern for winter crops. Peaks in broadband HDRF values are consistent with the scene classification.

4. Conclusions and Outlook

This technical note presented the first data service platform for the provision of atmospherically corrected Level-2A Sentinel-2 data and value-added products with a focus on vegetation monitoring. A user-friendly web interface is available to submit processing requests and access individual products. A dedicated application programming interface (API) supports bulk data processing and it is accessible using common programming languages, such as R or Python. End-users can find the full documentation and service features on the service web page and a dedicated R package at the software repository https://github.com/IVFL-BOKU/sentinel2.
During the algorithm implementation phase, a number of consistency checks were performed using existing satellite data, observations from Landsat-8 and dedicated ground measurements of LAI, spectral reflectance, and broadband HDRF. The results obtained from this preliminary performance analysis are very encouraging. They confirmed the spectral consistency with Landsat-8 and with ground reflectance measurements and showed, for the first time, the high potential and quality of Sentinel-2 data for the retrieval of LAI.
The data service platform operates on-demand and is ready to accept processing requests from end-users. They can choose any region of interests, temporal window, and product(s) of interest. After a fast registration process, end-users receive test account to generate and retrieve atmospherically-corrected Sentinel-2 scenes and value-added products (one voucher for each 100 × 100 km2 granule). For larger data volumes, end-users will need to pay a contribution to cover costs for data archiving, processing, and maintenance of the algorithms.
In the future, we plan to extend the portfolio of value-added products, to offer the possibility to plug-in different algorithms, and to integrate Sentinel-2 and Landsat-8 data processing, especially for the production of smoothed and gap-filled time series ([34] under review). As a minimum service, we plan to regularly process and store all Sentinel-2 scenes for Europe so that users can directly access the new images as they become available.

Acknowledgments

This work was partly financed by the project HQ-S2, FFG application ID 6277184. The ground campaign and the integration of algorithms for value-added products has been performed within the context of the H2020 FATIMA project (grant agreement No 633945). We also acknowledge the support from the ERASMUS+ programme for Claudia Pipitone and Luca Zappa, visitors at BOKU from the University of Palermo and from the University of Milano, respectively.

Author Contributions

Francesco Vuolo conceived and designed the analysis and wrote the paper; Mateusz Żółtak contributed to the data preparation and analysis; Claudia Pipitone performed the comparison between Landsat-8 and Sentinel-2 surface reflectance; Hannah Wenng and Luca Zappa acquired and analyzed the LAI data; Markus Immitzer performed the spectral measurements and data analysis; Marie Weiss and Frederic Baret provided the LAI algorithm and contributed to the paper writing; Clement Atzberger supervised the work and contributed to the paper writing.

Conflicts of Interest

The authors declare no conflict of interest.

Appendix

Some examples to query the catalogue of metadata, to download images, and to generate RGB false color composites are provided using R programming environment. For example, the query for the Granules in the UTM zone 33U acquired for the year 2016 and having a cloud cover lower than 40% is:
library(jsonlite)
Url = ‘https://s2.boku.eodc.eu/granule?dateMin=2016-01-01&utm=33U&cloudCovMax=40’
granules = fromJSON(Url)
The query can be restricted to search and download atmospherically corrected images acquired on 25 June for the granule in the UTM zone “33UXP”. The response also includes a list of value-added products.
library(jsonlite)
login = URLencode(‘putYourLoginHere’, TRUE)
pswd = URLencode(‘putYourPasswordHere’, TRUE)
Url = sprint (‘https://%s:%[email protected]/image?dateMin=2016-06-25&dateMax=2016-06-25&utm=33UXP&atmCorr=1’, login, pswd)
images = fromJSON(Url)
for(i in seq_along(images$imageId)){
localFilename = paste0(images$utm[i], ‘_’, images$band[i], ‘_’, images$resolution[i], ‘.’, images$format[i])
download.file(images$url[i], localFileName, mode = ‘wb’, quiet = TRUE)}
HTTP requests can also be used to activate pre-defined processing services on the server side. For instance, RGB true or false color composites can be created on-demand as follows:
library(curl)
library(jsonlite)
options(timeout = 600)
login = URLencode(‘putYourLoginHere’, TRUE)
pswd = URLencode(‘putYourPasswordHere’, TRUE)
Url = sprintf(‘https://%s:%[email protected]/image?dateMin=2016-06-22&dateMax=2016-06-22&utm=33UXP&atmCorr=1&band=’, login, pswd)
rId = fromJSON(paste0(Url, ‘B04’))$imageId[1]
gId = fromJSON(paste0(Url, ‘B03’))$imageId[1]
bId = fromJSON(paste0(Url, ‘B02’))$imageId[1]
rgbUrl = sprintf(‘http://%s:%[email protected]/RGB?r=%d&g=%d&b=%d’, rId, gId, bId)
curl_download (rgbUrl, ‘33UXP_2016-06-22_true_rgb.tiff’)

References

  1. Drusch, M.; del Bello, U.; Carlier, S.; Colin, O.; Fernandez, V.; Gascon, F.; Hoersch, B.; Isola, C.; Laberinti, P.; Martimort, P.; et al. Sentinel-2: ESA’s Optical High-Resolution Mission for GMES Operational Services. Remote Sens. Environ. 2012, 120, 25–36. [Google Scholar] [CrossRef]
  2. Immitzer, M.; Vuolo, F.; Atzberger, C. First Experience with Sentinel-2 Data for Crop and Tree Species Classifications in Central Europe. Remote Sens. 2016, 8, 166. [Google Scholar] [CrossRef]
  3. Radoux, J.; Chomé, G.; Jacques, D.; Waldner, F.; Bellemans, N.; Matton, N.; Lamarche, C.; d’Andrimont, R.; Defourny, P. Sentinel-2’s Potential for Sub-Pixel Landscape Feature Detection. Remote Sens. 2016, 8, 488. [Google Scholar] [CrossRef]
  4. Pesaresi, M.; Corbane, C.; Julea, A.; Florczyk, A.; Syrris, V.; Soille, P. Assessment of the Added-Value of Sentinel-2 for Detecting Built-up Areas. Remote Sens. 2016, 8, 299. [Google Scholar] [CrossRef] [Green Version]
  5. Lefebvre, A.; Sannier, C.; Corpetti, T. Monitoring Urban Areas with Sentinel-2A Data: Application to the Update of the Copernicus High Resolution Layer Imperviousness Degree. Remote Sens. 2016, 8, 606. [Google Scholar] [CrossRef]
  6. Paul, F.; Winsvold, S.; Kääb, A.; Nagler, T.; Schwaizer, G. Glacier Remote Sensing Using Sentinel-2. Part II: Mapping Glacier Extents and Surface Facies, and Comparison to Landsat 8. Remote Sens. 2016, 8, 575. [Google Scholar] [CrossRef]
  7. Du, Y.; Zhang, Y.; Ling, F.; Wang, Q.; Li, W.; Li, X. Water Bodies’ Mapping from Sentinel-2 Imagery with Modified Normalized Difference Water Index at 10-m Spatial Resolution Produced by Sharpening the SWIR Band. Remote Sens. 2016, 8, 354. [Google Scholar] [CrossRef] [Green Version]
  8. Bhandari, S.; Phinn, S.; Gill, T. Preparing Landsat Image Time Series (LITS) for Monitoring Changes in Vegetation Phenology in Queensland, Australia. Remote Sens. 2012, 4, 1856–1886. [Google Scholar] [CrossRef]
  9. Fisher, J.I.; Mustard, J.F. Cross-Scalar Satellite Phenology from Ground, Landsat, and MODIS Data. Remote Sens. Environ. 2007, 109, 261–273. [Google Scholar] [CrossRef]
  10. Liang, S.; Fang, H.; Morisette, J.T.; Chen, M.; Shuey, C.J.; Walthall, C.L.; Daughtry, C.S.T. Atmospheric Correction of Landsat ETM + Validation and Applications: II. Validation and applications. IEEE Trans. Geosci. Remote Sens. 2002, 40, 2736–2746. [Google Scholar] [CrossRef]
  11. Atzberger, C.; Richter, K. Spatially Constrained Inversion of Radiative Transfer Models for Improved LAI Mapping from Future Sentinel-2 Imagery. Remote Sens. Environ. 2012, 120, 208–218. [Google Scholar] [CrossRef]
  12. Brest, C.L.; Goward, S.N. Deriving Surface Albedo Measurements from Narrow Band Satellite Data. Int. J. Remote Sens. 1987, 8, 351–367. [Google Scholar] [CrossRef]
  13. Qu, Y.; Liang, S.; Liu, Q.; He, T.; Liu, S.; Li, X. Mapping Surface Broadband Albedo from Satellite Observations: A Review of Literatures on Algorithms and Products. Remote Sens. 2015, 7, 990–1020. [Google Scholar] [CrossRef]
  14. Vuolo, F.; D’Urso, G.; de Michele, C.; Bianchi, B.; Cutting, M. Satellite-Based Irrigation Advisory Services: A Common Tool for Different Experiences from Europe to Australia. Agric. Water Manag. 2015, 147, 82–95. [Google Scholar] [CrossRef]
  15. Sentinel-2 Data Service Platform. Available online: https://s2.boku.eodc.eu/ (accessed on 9 November 2016).
  16. Wagner, W.; Wotawa, G.; Stowasser, R.; Staudinger, M.; Hoffmann, C.; Walli, A.; Federspiel, C.; Aspetsberger, M.; Atzberger, C.; Briese, C.; et al. Addressing Grand Challenges in Earth Observation Science : The Earth Observation Data Centre for Water Resources Monitoring. ISPRS Tech. Comm. VII Mid-Term Symp. 2014, II-7, 81–88. [Google Scholar] [CrossRef]
  17. Müller-Wilm, U. Sentinel-2 MSI—Level-2A Prototype Processor Installation and User Manual. Available online: http://step.esa.int/thirdparties/sen2cor/2.2.1/S2PAD-VEGA-SUM-0001-2.2.pdf (accessed on 6 October 2016).
  18. European Space Agency. Sen2Cor 2.2.1—Software Release Note; European Space Agency: Paris, France, 2016. [Google Scholar]
  19. Kaufman, Y.J.; Wald, A.E.; Remer, L.A.; Gao, B.-C.; Li, R.-R.; Flynn, L. The MODIS 2.1-μm Channel-Correlation with Visible Reflectance for Use in Remote Sensing of Aerosol. IEEE Trans. Geosci. Remote Sens. 1997, 35, 1286–1298. [Google Scholar] [CrossRef]
  20. Schläpfer, D.; Borel, C.C.; Keller, J.; Itten, K.I. Atmospheric Precorrected Differential Absorption Technique to Retrieve Columnar Water Vapor. Remote Sens. Environ. 1998, 65, 353–366. [Google Scholar] [CrossRef]
  21. Baret, F.; Weiss, M.; Bicheron, P.; Berthelot, B. Sentinel-2 MSI Products WP1152 Algorithm Theoretical Basis Document for Product Group B; INRA-EMMAH: Avignon, France, 2010. [Google Scholar]
  22. Jacquemoud, S.; Verhoef, W.; Baret, F.; Bacour, C.; Zarco-Tejada, P.; Asner, G.P.; Francois, C.; Ustin, S. PROSPECT+SAIL Models: A Review of Use for Vegetation Characterization. Remote Sens. Environ. 2009, 113, S56–S66. [Google Scholar] [CrossRef]
  23. Verhoef, W. Light-Scattering by Leaf Layers with Application to Canopy Reflectance Modeling—The Sail Model. Remote Sens. Environ. 1984, 16, 125–141. [Google Scholar] [CrossRef]
  24. D’Urso, G.; Belmonte, A.C. Operative Approaches To Determine Crop Water Requirements From Earth Observation Data: Methodologies And Applications. AIP Conf. Proc. 2006, 852, 14–25. [Google Scholar]
  25. Vermote, E.; Justice, C.; Claverie, M.; Franch, B. Preliminary Analysis of the Performance of the Landsat 8/OLI Land Surface Reflectance Product. Remote Sens. Environ. 2015, 185, 46–56. [Google Scholar] [CrossRef]
  26. Vuolo, F.; Mattiuzzi, M.; Atzberger, C. Comparison of the Landsat Surface Reflectance Climate Data Record (CDR) and Manually atmospherically Corrected data in a Semi-Arid European Study Area. Int. J. Appl. Earth Obs. Geoinf. 2015, 42, 1–10. [Google Scholar] [CrossRef]
  27. Zhu, Z.; Wang, S.; Woodcock, C.E. Improvement and Expansion of the Fmask Algorithm: Cloud, Cloud Shadow, and Snow Detection for Landsats 4–7, 8, and Sentinel 2 Images. Remote Sens. Environ. 2015, 159, 269–277. [Google Scholar] [CrossRef]
  28. Vuolo, F.; Neugebauer, N.; Bolognesi, S.; Atzberger, C.; D’Urso, G. Estimation of Leaf Area Index Using DEIMOS-1 Data: Application and Transferability of a Semi-Empirical Relationship between two Agricultural Areas. Remote Sens. 2013, 5, 1274–1291. [Google Scholar] [CrossRef]
  29. Spectral Evolution, Lawrence, USA. Available online: http://www.spectralevolution.com/ (accessed on 9 November 2016).
  30. Eilers, P.H.C. A Perfect Smoother. Anal. Chem. 2003, 75, 3631–3636. [Google Scholar] [CrossRef] [PubMed]
  31. LI-COR Inc. LAI-2000 Plant Canopy Analyzer Instruction Manual Lincoln; LI-COR Inc.: Lincoln, NE, USA, 1992. [Google Scholar]
  32. Deimos-Imaging. Our Satellite: DEIMOS-1. Available online: http://www.deimos-space.com/ (accessed on 9 November 2016).
  33. GEOSYSTEMS. Atcor for Imagine 2013. Available online: http://www.geosystems.de/en/produkte/atcor-for-imagine/download/ (accessed on 6 October 2016).
  34. Vuolo, F.; Ng, W.-T.; Atzberger, C. Innovative approach for smoothing and gap-filling of high resolution multi-spectral time series: Example of Landsat data. IEEE Trans. Geosci. Remote Sens. 2016. under review. [Google Scholar]
Figure 1. Examples of a Sentinel-2 100 × 100 km2 images (tile 33UXP, covering the region between Vienna and Bratislava, acquired on 6 May 2016) and value-added products available at the data service platform. Note that clouds extracted from the Level-1C cloud mask are displayed (as hashed symbol) in all other products. (a) RGB false color composite; (b) Scene classification; (c) Individual band; (d) Broadband hemispherical-directional reflectance factor (HDRF); (e) Leaf Area Index.
Remotesensing 08 00938 g001
Figure 2. Examples of 60 m spatial resolution bands B1 (443 nm), B9 (940 nm), and B10 (1375 nm) dedicated to atmospheric correction and cirrus cloud detection (Sentinel-2 image subset acquired on 22 June 2016) and retrieved water vapor (WV) and aerosol optical thickness (AOT). On the bottom row, examples of true and false color RGB composites produced for the same acquisition are shown. The legend for the scene classification is given in Figure 1.
Remotesensing 08 00938 g002
Figure 3. Web interface to explore the data archive, access Sentinel-2 data and value-added products. The map shows the footprint of the atmospherically-corrected granules processed over part of Europe in July 2016.
Remotesensing 08 00938 g003
Figure 4. Scatterplots between BoA Landsat-8 and Sentinel-2 reflectance in red and near-infrared for two test sites (top row: Greece, 8 August 2015 tile 34SEH; bottom row: Austria, 31 December 2015, tile 33UUP). The reflectance from Sentinel-2 at 10 m spatial resolution was averaged within a buffer of 30 m to match the pixel size of Landsat-8. BoA reflectance values are scaled by 10,000.
Remotesensing 08 00938 g004
Figure 5. Examples of comparison between BoA Landsat-8 and Sentinel-2 reflectance for randomly-selected points (including vegetation, soil and water). The images were acquired on the same day. The reflectance from Sentinel-2 at 10 m spatial resolution was averaged within a buffer of 30 m to match the pixel size of Landsat-8. BoA reflectance values are scaled by 10,000.
Remotesensing 08 00938 g005
Figure 6. Examples of spectral mismatch between Sentinel-2 and Landsat-8 BoA reflectances due to undetected clouds or problems of atmospheric correction in regions adjacent to clouds. BoA reflectance values are scaled by 10,000.
Remotesensing 08 00938 g006
Figure 7. Spectral mismatch between Landsat-8 and Sentinel-2 observed over heterogeneous and complex surface terrain. The maps on the right show a zoom in on point “210”. BoA reflectance values are scaled by 10,000.
Remotesensing 08 00938 g007
Figure 8. Comparison between field spectral measurements on 24 June and Sentinel-2 data acquired on 22 June and 25 June 2016 over an agricultural region East of Vienna, Austria (Sentinel-2 tile 33UXP) from upper left to lower right: bare soil, winter wheat 1, potato, harvested field, winter wheat 2, and soya. Reflectance values are scaled by 10,000.
Remotesensing 08 00938 g008
Figure 9. Comparison between field spectral measurements on 31 August and Sentinel-2 data acquired on the same day (Sentinel-2 tile 33UXP) from upper left to lower right: asphalt, bare soil, crop residue, two soya fields at different phenological stages, and meadow. Reflectance values are scaled by 10,000.
Remotesensing 08 00938 g009
Figure 10. Scatterplot between ground and satellite-based LAI estimation for Marchfeld (n = 95). The data were acquired from April to June 2016 and comprise six different Sentinel-2 scenes.
Remotesensing 08 00938 g010
Figure 11. Scatterplots between Sentinel-2 and Deimos-1 broadband HDRF for two different dates.
Remotesensing 08 00938 g011
Figure 12. Time series of LAI and broadband HDRF for an exemplary cropland pixel in Barrax, Spain (588,916; 4,322,882, UTM/WGS84). The numbers on top of the chart indicate the scene classification code (Bare soil = 5; Cloud cover with low to high probability: 7–9). All other points are classified as vegetation (4, in green).
Remotesensing 08 00938 g012
Table 1. Products available on the Sentinel-2 data service platform (http://s2.boku.eodc.eu). Bold crosses (x) indicate the original spatial resolution. Note that band B10 is not produced at Level-2A.
Product NameCenter Wavelength (nm)Spatial Resolution (m)
102060
BoA reflectanceB01443 x
B02490xxx
B03560xxx
B04665xxx
B05705 xx
B06740 xx
B07783 xx
B08842xxx
B8a865 xx
B09940 x
B101375 x
B111610 xx
B122190 xx
SCLn.a. xx
AOTn.a.xxx
WVPn.a.xxx
VISn.a. x
LAIn.a.x
Broadband HDRFn.a.x
Table 2. Contemporaneous Landsat-8 and Sentinel-2 acquisitions used for comparison.
Landsat-8Sentinel-2
GreeceTile185/03334SEH
Acquisition date8 August 2015
Acquisition time9.16 AM9.25 AM
Sun Zenith Angle30°27°
AustriaTile192/02633UUP
Acquisition date31 December 2015
Acquisition time9.57 AM10.22 AM
Sun Zenith Angle74°72°
Table 3. Measured albedo (net radiometer) versus broadband HDRF from Sentinel-2 (weighted sum).
Crop TypeAcquisition DateLeaf Area Index (Sentinel-2)Broadband HDRF (Sentinel-2)Measured Albedo (CNR-1) at Noon
Soya7 August 20153.20.240.22
Soya30 August 2015>6.00.280.26
Maize25 June 20161.90.160.16
Maize2 July 20162.90.170.17

