Next Issue
Volume 8, June
Previous Issue
Volume 8, April


Geosciences, Volume 8, Issue 5 (May 2018) – 43 articles

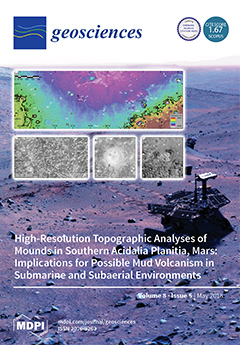
Cover Story (view full-size image): Putative oceans and mud volcanism on Mars, particularly in the northern plains, have been topics of debate for at least the past 30 years. This paper focuses on densely distributed mounds in the southern Acidalia Planitia, and investigated their topographic data by generating high-resolution digital elevation models. The results, and their estimated physical properties and source depths of mound-forming materials, are consistent with mud or igneous volcanism in either a subaqueous or subaerial setting, which may have harbored habitable environments on Mars. View this paper
  • Issues are regarded as officially published after their release is announced to the table of contents alert mailing list.
  • You may sign up for e-mail alerts to receive table of contents of newly released issues.
  • PDF is the official format for papers published in both, html and pdf forms. To view the papers in pdf format, click on the "PDF Full-text" link, and use the free Adobe Reader to open them.
Order results
Result details
Section
Select all
Export citation of selected articles as:

Editorial

Jump to: Research, Review

4 pages, 180 KiB  
Editorial
Volcanic Plumes: Impacts on the Atmosphere and Insights into Volcanic Processes
by Andrew J. S. McGonigle 1,2,3,*, Pasquale Sellitto 4,5 and Giuseppe G. Salerno 6
1 Department of Geography, University of Sheffield, Winter Street, Sheffield S10 2TN, UK
2 School of Geosciences, The University of Sydney, Sydney NSW2006, Australia
3 Istituto Nazionale di Geofisica e Vulcanologia, Sezione di Palermo, Via Ugo La Malfa 153, 90146 Palermo, Italy
4 Laboratoire de Météorologie Dynamique, Institut Pierre Simon Laplace, École Normale Supérieure, PSL Research University, École Polytechnique, Université Paris-Saclay, Sorbonne Université, UPMC Université Paris 6, CNRS, 75005 Paris, France
5 Remote Sensing Group, UK Research and Innovation, Science and Technology Facilities Council, Rutherford Appleton Laboratory, Harwell, Oxford OX11 0QX, UK
6 Istituto Nazionale di Geofisica e Vulcanologia, Osservatorio Etneo, I95123 Catania, Italy
Geosciences 2018, 8(5), 158; https://doi.org/10.3390/geosciences8050158 - 30 Apr 2018
Viewed by 3118
Abstract
Here we introduce a Special Issue of Geosciences focused on the scientific research field of ‘Volcanic Plumes: Impacts on the atmosphere and insights into volcanic processes’ [...] Full article

Research

Jump to: Editorial, Review

29 pages, 25099 KiB  
Article
Late Quaternary Soil Development Enhances Aeolian Landform Stability, Moenkopi Plateau, Southern Colorado Plateau, USA
by Amy L. Ellwein 1,*, Leslie D. McFadden 2, Joseph A. McAuliffe 3 and Shannon A. Mahan 4
1 The Rocky Mountain Biological Laboratory, Crested Butte, CO 81224, USA
2 Department of Earth and Planetary Sciences, The University of New Mexico, Albuquerque, NM 87131, USA
3 Desert Botanical Garden, Phoenix, AZ 85008, USA
4 U.S. Geological Survey, Denver Federal Center, MS 974, Denver, CO 80225, USA
Geosciences 2018, 8(5), 146; https://doi.org/10.3390/geosciences8050146 - 24 Apr 2018
Cited by 7 | Viewed by 5728
Abstract
The Moenkopi dune field in northeastern Arizona covers roughly 1250 km2, but most of the field is inactive. Dune deposits on the Moenkopi Plateau (MP) have remained inactive throughout the Holocene despite periods of elevated aridity or historical reductions of vegetation [...] Read more.
The Moenkopi dune field in northeastern Arizona covers roughly 1250 km2, but most of the field is inactive. Dune deposits on the Moenkopi Plateau (MP) have remained inactive throughout the Holocene despite periods of elevated aridity or historical reductions of vegetation cover by livestock grazing. We argue that this inactivity is not because of any diminishment of driving forces in the aeolian system (e.g., insufficient winds), but rather because of increased cohesion due to soil development that enhances resistance to wind erosion. Abundant aeolian sediments were supplied to the Black Mesa region by the Little Colorado River and its tributaries during the late Pleistocene (MIS 2 and 3), which enabled the development of climbing dunes and transport of sand over the Adeii Eechii Cliffs and onto the MP. These deposits (Qe1) stabilized during the Pleistocene/Holocene climatic transition (~12–7.5 ka) because of reduced sediment supply and high dust flux which resulted in rapid soil formation. Erosion of climbing dunes/sand ramps from the Adeii Eechii Cliffs eliminated delivery of large quantities of new sand to the MP during the mid to late Holocene. Soil development within the Qe1 mantle increased sediment cohesion and prevented widespread aeolian reactivation during the Holocene, despite the occurrence of conditions (wind speed, climate, etc.) under which dune reactivation would be expected. Drylands comprise roughly 40% of the land cover of earth and climate models predict their expansion. Pedogenic stability is not commonly considered in climate-based models used to predict aeolian activity. To improve predictions of future dune activity in drylands, the degree of soil development in aeolian deposits should be considered when evaluating sediment availability in aeolian systems. Full article
(This article belongs to the Special Issue Aeolian Processes and Geomorphology)
Show Figures

Graphical abstract

20 pages, 7582 KiB  
Article
Airflow Dynamics over a Beach and Foredune System with Large Woody Debris
by Michael J. Grilliot 1,2, Ian J. Walker 1,3,* and Bernard O. Bauer 1,4
1 Hakai Institute, P.O. Box 309, Heriot Bay, BC V0P 1H0, Canada
2 Department of Geography, University of Victoria, Victoria, BC V8P 5C2, Canada
3 School of Geographical Sciences & Urban Planning & School of Earth & Space Exploration, Arizona State University, Tempe, AZ 85287-5302, USA
4 Earth, Environmental and Geographic Sciences, The University of British Columbia|Okanagan, Kelowna, BC V1V 1V7, Canada
Geosciences 2018, 8(5), 147; https://doi.org/10.3390/geosciences8050147 - 24 Apr 2018
Cited by 20 | Viewed by 5006
Abstract
Airflow dynamics over beach-foredune systems can be complex. Although a great deal is known about the effects of topographic forcing and vegetation cover on wind-field modification, the role of large woody debris (LWD) as a roughness element and modifier of boundary layer flow [...] Read more.
Airflow dynamics over beach-foredune systems can be complex. Although a great deal is known about the effects of topographic forcing and vegetation cover on wind-field modification, the role of large woody debris (LWD) as a roughness element and modifier of boundary layer flow is relatively understudied. Individual pieces of LWD are non-porous elements that impose bluff body effects and induce secondary flow circulation that varies with size, density, and arrangement. Large assemblages of LWD are common on beaches near forested watersheds and collectively have a degree of porosity that increases aerodynamic roughness in ways that are not fully understood. A field study on a mesotidal sandy beach with a scarped foredune (Calvert Island, British Columbia, Canada) shows that LWD influences flow patterns and turbulence levels. Overall mean and fluctuating energy decline as flow transitions across LWD, while mean energy is converted to turbulent energy. Such flow alterations have implications for sand transport pathways and resulting sedimentation patterns, primarily by inducing deposition within the LWD matrix. Full article
(This article belongs to the Special Issue Aeolian Processes and Geomorphology)
Show Figures

Figure 1

12 pages, 2145 KiB  
Article
Glacier Changes on the Pik Topografov Massif, East Sayan Range, Southeast Siberia, from Remote Sensing Data
by Eduard Y. Osipov 1,* and Olga P. Osipova 2
1 Limnological Institute of the Siberian Branch of the Russian Academy of Sciences (SB RAS), 3, Ulan-Batorskaya Str., Irkutsk 664033, Russia
2 V.B. Sochava Institute of Geography of the Siberian Branch of the Russian Academy of Sciences (SB RAS), 1, Ulan-Batorskaya Str., Irkutsk 664033, Russia
Geosciences 2018, 8(5), 148; https://doi.org/10.3390/geosciences8050148 - 24 Apr 2018
Cited by 4 | Viewed by 3697
Abstract
Small mountain glaciers represent the most abundant class in many glaciarized areas around the world; however, less is known about their recent area changes under climatic variability of the last decades. The recent fluctuations of glaciers located in the inner parts of continents [...] Read more.
Small mountain glaciers represent the most abundant class in many glaciarized areas around the world; however, less is known about their recent area changes under climatic variability of the last decades. The recent fluctuations of glaciers located in the inner parts of continents are the least studied. In this study we present the results of repeated mapping of seven small (<1.5 km2) glaciers located in a continental setting on the northern slope of the Pik Topografov massif, East Sayan Range, southeast Siberia. The multitemporal glacier inventory was derived from the late summer Landsat TM/ETM+ scenes acquired between 1986 and 2010. Glacier outlines were mapped with thresholded ratio (TM3/TM5) method. Topographic inventory parameters were measured from SRTM DEM. Glacier outlines of the Little Ice Age maximum (LIA, ~1850) were reconstructed from terminal moraines widely distributed around the glacier snouts. The results indicate a total ice area decrease from 8.1 km2 in the LIA to 3.8 km2 in 2010 (53%, 0.33% year−1). We revealed accelerated area shrinkage between 1991 and 2001 (almost two times higher than during the period 1986–2010), while between 2001 and 2010, the ice area did not change significantly. Overall, the glacier changes are consistent with the regional climatic trends (winter precipitation and summer temperature). Local topographic settings significantly impacted the glacier dynamics. Full article
(This article belongs to the Special Issue Remote Sensing of Land Ice)
Show Figures

Figure 1

11 pages, 6875 KiB  
Article
UNESCO Global Geoparks, Geotourism and Communication of the Earth Sciences: A Case Study in the Chablais UNESCO Global Geopark, France
by Sophie Catherine Justice
Chablais UNESCO Global Geopark, 74200 Thonon-les-Bains, France
Geosciences 2018, 8(5), 149; https://doi.org/10.3390/geosciences8050149 - 25 Apr 2018
Cited by 55 | Viewed by 8695
Abstract
The last twenty years have seen considerable developments in geotourism, a form of sustainable tourism. This has been also a period of significant development for UNESCO Global Geoparks (UGGps), on one hand with the creation of the International Geoscience and Geoparks Programme, and [...] Read more.
The last twenty years have seen considerable developments in geotourism, a form of sustainable tourism. This has been also a period of significant development for UNESCO Global Geoparks (UGGps), on one hand with the creation of the International Geoscience and Geoparks Programme, and the other, in the number and diversity of UGGps recognised across the world. Geoparks have particular characteristics, such as a spatial engagement across an area, as well as the long-term commitment associated with this type of label. UGGps take a broad approach to geotourism, and seek to engage with all demographics, including “unsuspecting” geotourists. This is particularly relevant when considering that the Geopark profile has evolved since the introduction of the UNESCO label, and that a number UGGps are pre-existing tourist destinations and have diverse economies and strong growth. UGGps draw on professional, multidisciplinary teams that combine scientific knowledge, science communication, and outreach events to achieve effective heritage transmission through actions that target schools, the local population, and the general public. These are not traditional structures and do not have behavioural constraints imposed on them as experienced by some educational structures or museums. The present case study is an example of the type of innovation seen in UGGps, whereby novel solutions are employed in order to touch as wide a public as possible. The action presented is a winter outreach event for the general public in the Chablais UNESCO Global Geopark (France), that was developed in partnership with the Portes du Soleil association of 12 ski resorts. This consisted of an orienteering/treasure hunt game across one of the world’s largest ski domains, that included panels with anecdotes presenting different aspects of the Chablais geoheritage. It demonstrates that it is possible to engage with a sporting public that is seeking experiences and is not expecting to sacrifice time or exert effort to deepen knowledge or gain cultural insight. Interestingly, the study shows that careful event design, including concise language choice and a strict avoidance of technical vocabulary, results in the effective transmission of heritage information. The game participants were not geotourists, and yet displayed a good appetite for Earth science and cultural heritage knowledge. The study concluded that the sporting general public retained information about the geoheritage of the area, was open to participating in future Chablais UGGp events, and that they were interested in returning both to explore other aspects of the territory, and to visit in other seasons. The Chablais UGGp assessed the success and quality of the event and confirmed the relevance of a well-considered and layered geotourism strategy for territories with an UGGp label. Full article
(This article belongs to the Special Issue Selected Papers from the “14th European Geoparks Conference”)
Show Figures

Figure 1

13 pages, 2625 KiB  
Article
Assessing the Protective Capacity of Aquifers Using Very-Low-Frequency Electromagnetic Survey
by Oghenero Ohwoghere-Asuma 1,*, Kizito Ejiro Aweto 1, Felix I. Chinyem 1 and Hyacinth O. Nwankwoala 2
1 Department of Geology, Delta State University, Abraka 330106, Nigeria
2 Department of Geology, University of Port Harcourt, River State 5323, Nigeria
Geosciences 2018, 8(5), 150; https://doi.org/10.3390/geosciences8050150 - 26 Apr 2018
Cited by 12 | Viewed by 5183
Abstract
The protective capacity of aquifers is a prerequisite for groundwater quality in areas prone to contamination from the ground surface. Aquifers without protective layers are more susceptible to contaminations from point and non-point sources. The protective capacity of an aquifer significantly correlates with [...] Read more.
The protective capacity of aquifers is a prerequisite for groundwater quality in areas prone to contamination from the ground surface. Aquifers without protective layers are more susceptible to contaminations from point and non-point sources. The protective capacity of an aquifer significantly correlates with the thickness of clay and organic materials that mantled it. To assess aquifer protective capacity, electrical conductivity property of saturated clay was determined from filtered imaginary and real components of Very Low-Frequency Electromagnetic (VLF-EM). The filtered real components against distance and current density pseudo-section produced from real components were concomitantly used for interpretation. Clays capping aquifers were delineated from those without capping from low and high values of filtered imaginary and real components and current density pseudo-section. The distribution of clay laterally across the area indicates that aquifers are poorly protected and susceptible to contaminations from a point and non-point sources. The apparent agreement between inferred geology from VLF-EM interpretation, borehole data and resistivity data underscores the efficacy of VLF-EM as an important tool that can be used or combined with other geophysical methods and borehole information/data for assessment of the protective capacity of the aquifer. Full article
Show Figures

Figure 1

19 pages, 24831 KiB  
Article
High-Resolution Topographic Analyses of Mounds in Southern Acidalia Planitia, Mars: Implications for Possible Mud Volcanism in Submarine and Subaerial Environments
by Ryodo Hemmi 1,* and Hideaki Miyamoto 1,2
1 The University Museum, The University of Tokyo, 7-3-1 Hongo, Bunkyo-ku, Tokyo 113-8656, Japan
2 Department of Systems Innovation, School of Engineering, The University of Tokyo, 7-3-1 Hongo, Bunkyo-ku, Tokyo 113-8656, Japan
Geosciences 2018, 8(5), 152; https://doi.org/10.3390/geosciences8050152 - 27 Apr 2018
Cited by 22 | Viewed by 8626
Abstract
A northern ocean of Mars is still debated and, if it existed, it may have accompanied valley networks and/or outflow channels, which may have led to the emplacement of a large amount of water to the northern lowlands during the Noachian and/or Hesperian [...] Read more.
A northern ocean of Mars is still debated and, if it existed, it may have accompanied valley networks and/or outflow channels, which may have led to the emplacement of a large amount of water to the northern lowlands during the Noachian and/or Hesperian times. However, it is unclear how and under what conditions (submarine or subaerial) geologic features such as mounds and giant polygons formed in the northern lowlands. The densely-distributed mounds in Chryse and Acidalia Planitia, >1000 km-wide basins of the northern plains, were suggested to be ancient mud volcanoes formed in an aqueous setting, which is controversial (i.e., mud vs. igneous and submarine vs. subaerial). However, these mounds have not been quantitatively well characterized, particularly with respect to their detailed topography. Here we generated forty digital elevation models (DEMs) with resolution of up to 1 m/pixel from High Resolution Imaging Science Experiment (HiRISE) stereo image pairs, and we accurately measured the morphometric parameters of ~1300 mounds within the southern part of the Acidalia basin. Their heights and diameters resulted in good accordance with those of mud and igneous volcanoes in submarine/subaerial settings on Earth. Maximum depths of their source reservoirs vary from ~30 to ~450 m for a subaqueous setting and from ~110 to ~860 m for a subaerial setting, both of which are consistent with fluid expulsion from the ~100–4500 m-thick flood deposits (Vastitas Borealis Formation, VBF). On the basis of the morphometric values, we estimated rheological properties of materials forming the mounds and found them consistent with a mud flow origin, which does not rule out an igneous origin. The conditions of possible submarine mud or igneous volcanoes may have harbored less hazardous environments for past life on Mars than those on an ocean-free surface. Full article
(This article belongs to the Special Issue Submarine Volcanic Hazards: Ancient and Modern Perspectives)
Show Figures

Figure 1

19 pages, 17798 KiB  
Article
Implications of Landslide Typology and Predisposing Factor Combinations for Probabilistic Landslide Susceptibility Models: A Case Study in Lajedo Parish (Flores Island, Azores—Portugal)
by Rui Fagundes Silva 1,2,*, Rui Marques 1,2 and João Luís Gaspar 2
1 Centre for Information and Seismovolcanic Surveilance of the Azores, University of the Azores, Rua Mãe de Deus, 9500-501 Ponta Delgada, Portugal
2 Research Institute for Volcanology and Risk Assessment, University of the Azores, Rua Mãe de Deus, 9500-501 Ponta Delgada, Portugal
Geosciences 2018, 8(5), 153; https://doi.org/10.3390/geosciences8050153 - 27 Apr 2018
Cited by 11 | Viewed by 5502
Abstract
The main objective of this study is to better understand and quantify the consequences for landslide susceptibility assessment caused by (i) the discrimination (or not) of landslide typology and (ii) the use of different predisposing factor combinations. The study area for this research [...] Read more.
The main objective of this study is to better understand and quantify the consequences for landslide susceptibility assessment caused by (i) the discrimination (or not) of landslide typology and (ii) the use of different predisposing factor combinations. The study area for this research was Lajedo parish (Flores Island, Azores—Portugal). For the landslide susceptibility modeling, 12 predisposing factors and a historical landslide inventory with a total of 474 individual landslide rupture areas were used as inputs, and the Information Value method was then applied. It was concluded that susceptibility models developed specifically for each landslide typology achieve better results when compared to the model developed for the total inventory, which suffers from a bias caused by the strong spatial abundance of one landslide typology. A total of 4095 susceptibility models were tested for each typology, and the best models were selected according to their goodness of fit. The best model for both falls and slides has seven predisposing factors, some of which do not correspond to the factors that have the best individual discriminatory capabilities. The number of expected and observed unique terrain conditions for each model allowed us to conclude that with the successive addition of predisposing factors, there is an inability of the territory to generate new observed unique terrain conditions. This consequence was directly related to the inability to increase the goodness of fit of the computed models. For each landslide typology, the predictive capacity of the best susceptibility model was assessed by computing the Prediction Rate Curves and the Area Under the Curve. Full article
(This article belongs to the Special Issue Natural Hazards and Risks Assessment)
Show Figures

Figure 1

29 pages, 14525 KiB  
Article
Geomorphometric Characterization of Pockmarks by Using a GIS-Based Semi-Automated Toolbox
by Joana Gafeira 1,*, Margaret F. J. Dolan 2 and Xavier Monteys 3
1 British Geological Survey (BGS), The Lyell Centre, Research Avenue South, Edinburgh EH14 4AP, UK
2 Geological Survey of Norway (NGU), Postal Box 6315 Torgarden, NO-7491 Trondheim, Norway
3 Geological Survey Ireland (GSI), Beggars Bush, Haddington Road, Dublin 4, Ireland
Geosciences 2018, 8(5), 154; https://doi.org/10.3390/geosciences8050154 - 27 Apr 2018
Cited by 33 | Viewed by 8612
Abstract
Pockmarks are seabed depressions developed by fluid flow processes that can be found in vast numbers in many marine and lacustrine environments. Manual mapping of these features based on geophysical data is, however, extremely time-consuming and subjective. Here, we present results from a [...] Read more.
Pockmarks are seabed depressions developed by fluid flow processes that can be found in vast numbers in many marine and lacustrine environments. Manual mapping of these features based on geophysical data is, however, extremely time-consuming and subjective. Here, we present results from a semi-automated mapping toolbox developed to allow more efficient and objective mapping of pockmarks. This ArcGIS-based toolbox recognizes, spatially delineates, and morphometrically describes pockmarks. Since it was first developed, the toolbox has helped to map and characterize several thousands of pockmarks on the UK continental shelf, especially within the central North Sea. This paper presents the latest developments in the functionality of the toolbox and its adaptability for application to other geographic areas (Barents Sea, Norway, and Malin Deep, Ireland) with varied pockmark and seabed morphologies, and in different geological settings. The morphometric characterization of vast numbers of pockmarks allows an unprecedented statistical analysis of their morphology. The outputs from the toolbox provide an objective, quantitative baseline for combining this information with the geological and oceanographical knowledge of individual areas, which can provide further insights into the processes responsible for their development and their influence on local seabed conditions and habitats. Full article
(This article belongs to the Special Issue Marine Geomorphometry)
Show Figures

Figure 1

19 pages, 1648 KiB  
Article
Reliable Predictors of Arsenic Occurrence in the Southern Gulf Coast Aquifer of Texas
by Kartik Venkataraman * and John W. Lozano
Department of Engineering and Computer Science, Tarleton State University, Stephenville, TX 76402, USA
Geosciences 2018, 8(5), 155; https://doi.org/10.3390/geosciences8050155 - 27 Apr 2018
Cited by 1 | Viewed by 6250
Abstract
Arsenic contamination of groundwater in the Southern Gulf Coast Aquifer of Texas is a critical public health concern as much of the area is rural in nature with decentralized water supplies. Previous studies have pointed to volcanic deposits as the regional source of [...] Read more.
Arsenic contamination of groundwater in the Southern Gulf Coast Aquifer of Texas is a critical public health concern as much of the area is rural in nature with decentralized water supplies. Previous studies have pointed to volcanic deposits as the regional source of arsenic but no definitive or reliable predictors of arsenic maximum contaminant level (MCL) exceedance have been identified. In this study, we have studied the effect of various hydrogeochemical parameters as well as soil and land-use variables on arsenic MCL exceedance using logistic regression (LR) techniques. The LR models display good accuracy of 75% or higher but suffer from a high rate of false negatives, highlighting the challenges in capturing the spatial irregularities of arsenic in this region. Despite not displaying high statistical significance, pH appears to be an important variable in the LR models—its effect on arsenic exceedance is not clear and warrants further investigation. The results of the study also show that groundwater vanadium and fluoride are consistently the only significant variables in the models developed; the positive coefficients for both these elements indicates a common geogenic source for arsenic, fluoride and vanadium, corroborating the findings of earlier studies. Full article
(This article belongs to the Special Issue Groundwater Pollution)
Show Figures

Figure 1

21 pages, 19002 KiB  
Article
Major Strike-Slip Faults Identified Using Satellite Data in Central Borneo, SE Asia
by Afroz Ahmad Shah 1,*, Mohd Noor Zhafri 1, Jumat Delson 1 and Batmanathan Navakanesh 2
1 Departmet of Physical and Geological Sciences, Universiti of Brunei Darussalam, Gadong BE1410, Brunei
2 Department of Applied Geology, Curtin University Sarawak, Miri 98009, Malaysia
Geosciences 2018, 8(5), 156; https://doi.org/10.3390/geosciences8050156 - 27 Apr 2018
Cited by 18 | Viewed by 12769
Abstract
We use freely available Google satellite data, instrumental seismicity, fault plane solutions, and previously mapped structural and geological maps to identify new fault zones in central Borneo. We have mapped a number of ~NW-SE trending dextral strike-slip faults and ~NE-SW to ~N-S trending [...] Read more.
We use freely available Google satellite data, instrumental seismicity, fault plane solutions, and previously mapped structural and geological maps to identify new fault zones in central Borneo. We have mapped a number of ~NW-SE trending dextral strike-slip faults and ~NE-SW to ~N-S trending sinistral strike-slip fault zones. The geomorphic expression of faulting is shown by the well-developed triangular facets, fault rupture scarps, truncated sedimentary beds, topographic breaks, displaced ridges, deflected streams, faulted Plio-Pleistocene volcanic deposits, and back-tilted Holocene to Recent sedimentary deposits. Some of the mapped faults are actively growing, and show text-book examples of dextral and sinistral offset, which ranges from ~450 m to tens of km. The dextral strike-slip fault systems are clearly developed in the central and eastern portions of Borneo where they cut through the folded sedimentary sequences for >220 km. The ~NE-SW to ~N-S trending sinistral strike-slip faults are dominantly developed in the eastern portion of central Borneo for >230 km. The geomorphic expression of faulting is clear and the fault scarps are ~SE facing for the sinistral fault system, and ~NE facing for the dextral fault system. The age of the faulting is constrained by the cross-cutting relationship where the fault cuts through Plio-Pleistocene volcanic deposits for >30 km, which suggests a neotectonic nature of faulting. The strike-slip fault systems that we have mapped here provide the first geomorphic evidence of large-scale strike-slip faulting in Borneo and suggest the presence of a major sinistral strike-slip fault that runs for >900 km through the center of Borneo, and forms a backbone onto which most of the mapped structures root. The mapped structures clearly suggest that plate tectonic forces dominantly control the geological structures that we have mapped and support the regional oblique convergence that is oblique with respect to the major trend of the Crocker Range, which forms the spine of the Borneo Island. Full article
Show Figures

Figure 1

13 pages, 3011 KiB  
Article
Adsorption of Pb and Cu from Aqueous Solutions by Raw and Heat-Treated Attapulgite Clay
by Konstantina Pyrgaki 1,*, Panagiota Messini 1 and Vassilis Zotiadis 2
1 Department of Geology & Geoenvironment, National and Kapodistrian University of Athens, Panepistimiopolis Zographou, 15784 Athens, Greece
2 Edafomichaniki S.A., Em. Papadaki 19, N. Iraklio, 14121 Athens, Greece
Geosciences 2018, 8(5), 157; https://doi.org/10.3390/geosciences8050157 - 27 Apr 2018
Cited by 20 | Viewed by 6202
Abstract
The main objective of the present study is the investigation of the adsorption efficiency of raw and heat-treated attapulgite clay for removing Pb and Cu from aqueous solutions. The removal of each metal was studied separately with the use of one-substance solutions. The [...] Read more.
The main objective of the present study is the investigation of the adsorption efficiency of raw and heat-treated attapulgite clay for removing Pb and Cu from aqueous solutions. The removal of each metal was studied separately with the use of one-substance solutions. The effect of certain factors, including solution pH and ionic strength, contact time, adsorbent concentration, temperature of treatment of the adsorbent, and initial metal concentration, was studied. In alkaline conditions, pH > 8.0, precipitation of Pb(OH)2 and Cu(OH)2 takes place, whereas at pH range 4.0–8.0 removal of metals is probably due to adsorption processes. Metal removal increases by 20% for Pb and by 80% for Cu with the increase of attapulgite content from 2 g·L−1 to 15 g·L−1. The removal of metals decreases with increasing solution ionic strength due to competition of Na with Pb and Cu for the available sites. Significant changes in the adsorption capacity of the used attapulgite clay occur after calcination in temperatures >550 °C due to destruction of the crystal lattice of the material and nano-porosity change. Finally, Pb adsorption is described well by both Langmuir and Freundlich isotherm models. According to the Langmuir model, the maximum adsorption capacity for Pb is 30 mg·g−1 and 4.41 mg·g−1 for Cu. The Freundlich model fitted better the experimental data of Cu. Full article
Show Figures

Figure 1

15 pages, 10297 KiB  
Article
Estimation of Nitrate Trends in the Groundwater of the Zagreb Aquifer
by Zoran Kovač 1,*, Zoran Nakić 1, Drago Špoljarić 2, David Stanek 2 and Andrea Bačani 1,†
1 Faculty of Mining, Geology and Petroleum Engineering, University of Zagreb, 10000 Zagreb, Croatia
2 Intellomics Ltd., 10000 Zagreb, Croatia
Deceased in February 2018.
Geosciences 2018, 8(5), 159; https://doi.org/10.3390/geosciences8050159 - 2 May 2018
Cited by 17 | Viewed by 4215
Abstract
Nitrates present one of the main groundwater contaminants in the world and in the Zagreb aquifer. The Zagreb aquifer presents the main source of potable water for the inhabitants of the City of Zagreb and it is protected by the Republic of Croatia. [...] Read more.
Nitrates present one of the main groundwater contaminants in the world and in the Zagreb aquifer. The Zagreb aquifer presents the main source of potable water for the inhabitants of the City of Zagreb and it is protected by the Republic of Croatia. The determination of contaminants trends presents one of the main tools in groundwater body status and risk assessment. In this paper, the use of regression analysis on the aggregated data, together with confidence and prediction intervals, at different observation scales has been evaluated. Nitrate concentrations are generally decreasing in almost all areas, observed at different observation scales. It has been shown that linear regression can be efficiently used in the estimation of nitrates trends. Results showed that the calculation of confidence and prediction intervals can provide more useful conclusions than the calculation of the trend’s statistical significance. Also, the results suggest that confidence and prediction intervals can be used in groundwater body chemical status and risk assessment, respectively. Data smoothing and data aggregation are generally desirable, but have certain limitations. If too much data is aggregated, trend estimation by regression analysis can point to false conclusions. Evaluation of trends at different observational scales can provide more realistic trend estimation, as well as more precise identification of areas where groundwater protection measures should be implemented. Full article
(This article belongs to the Special Issue Groundwater Pollution)
Show Figures

Figure 1

10 pages, 1154 KiB  
Article
Correlation Analysis of Seasonal Temperature and Precipitation in a Region of Southern Italy
by Ennio Ferrari 1,*, Roberto Coscarelli 2 and Beniamino Sirangelo 3
1 Department of Computer Engineering, Modeling, Electronics, and Systems Science (DIMES), University of Calabria, 87036 Rende (CS), Italy
2 Research Institute for Geo-hydrological Protection (CNR-IRPI), National Research Council of Italy, 87036 Rende (CS), Italy
3 Department of Environmental and Chemical Engineering (DIATIC), University of Calabria, 87036 Rende (CS), Italy
Geosciences 2018, 8(5), 160; https://doi.org/10.3390/geosciences8050160 - 2 May 2018
Cited by 5 | Viewed by 4667
Abstract
The investigation of the statistical links between changes in temperature and rainfall, though not widely achieved in the past, is an interesting issue because their physical interdependence is difficult to point out. Aiming at detecting possible trends with a pooled approach, a correlative [...] Read more.
The investigation of the statistical links between changes in temperature and rainfall, though not widely achieved in the past, is an interesting issue because their physical interdependence is difficult to point out. Aiming at detecting possible trends with a pooled approach, a correlative analysis of temperature and rainfall has been carried out by comparing changes in their standardized anomalies from two different 30-year time periods. The procedure has been applied to the time series of seasonal mean temperature and cumulative rainfall observed in four sites of the Calabria region (Southern Italy), with reference to the series which verify the normality hypothesis. Specifically, the displacements of the ellipses, representing the probability density functions of the bivariate normal distribution assumed for the climatic variables, have been quantified and tested for each season, passing from the first subperiod to the following one. The main results concern a decreasing trend of both the temperature and the rainfall anomalies, predominantly in the winter and autumn seasons. Full article
(This article belongs to the Special Issue Hydrological Hazard: Analysis and Prevention)
Show Figures

Figure 1

15 pages, 3458 KiB  
Article
Virtual Crop Water Export Analysis: The Case of Greece at River Basin District Level
by Nikolaos Mellios 1, Jason F. L. Koopman 2 and Chrysi Laspidou 1,*
1 Department of Civil Engineering, University of Thessaly, 38334 Volos, Greece
2 Wageningen Economic Research, 2502 LS The Hague, The Netherlands
Geosciences 2018, 8(5), 161; https://doi.org/10.3390/geosciences8050161 - 3 May 2018
Cited by 6 | Viewed by 6775
Abstract
An analysis of virtual crop water export through international trade is conducted for Greece, downscaled to the River Basin District (RBD) level, in order to identify critical “hotspots” of localized water shortage in the country. A computable general equilibrium model (MAGNET) was used [...] Read more.
An analysis of virtual crop water export through international trade is conducted for Greece, downscaled to the River Basin District (RBD) level, in order to identify critical “hotspots” of localized water shortage in the country. A computable general equilibrium model (MAGNET) was used to obtain the export shares of crops and associated irrigation water was calculated for all major crops in Greece. A distinction between virtual crop water locally consumed and traded internationally was made for all Greek RBDs. Cotton was identified as a large water consumer and virtual water exporter, while GR08 and GR10 were identified as the RBDs mostly impacted. The value of virtual water exported was calculated for all crop types and fruits and vegetables were identified as the crop most beneficial, since they consume the least water for the obtained value. Full article
Show Figures

Figure 1

18 pages, 6821 KiB  
Article
Numerical Simulation of Flow and Scour in a Laboratory Junction
by Javad Ahadiyan 1, Atefeh Adeli 2, Farhad Bahmanpouri 3,* and Carlo Gualtieri 4
1 Water Sciences Engineering Faculty, Department of Hydraulic Structures, Shahid Chamran University of Ahvaz (SCU), Ahvaz 61357-83151, Iran
2 Hydraulic Structures at Shahid Chamran University of Ahvaz (SCU), Ahvaz 61357-83151, Iran
3 Hydraulic Engineering at Civil, Architectural and Environmental Engineering Department (DICEA), University of Naples Federico II (UNINA), 80125 Napoli NA, Italy
4 Environmental Hydraulics at Civil, Architectural and Environmental Engineering Department (DICEA), University of Naples Federico II (UNINA), 80125 Napoli NA, Italy
Geosciences 2018, 8(5), 162; https://doi.org/10.3390/geosciences8050162 - 3 May 2018
Cited by 7 | Viewed by 4354
Abstract
Confluences are a common feature of riverine systems; the area of converging flow streamlines and potential mixing of separate flows. The hydrodynamics about confluences have a highly complex three-dimensional flow structure. This paper presents the results of a numerical study using the CCHE2D [...] Read more.
Confluences are a common feature of riverine systems; the area of converging flow streamlines and potential mixing of separate flows. The hydrodynamics about confluences have a highly complex three-dimensional flow structure. This paper presents the results of a numerical study using the CCHE2D code to investigate the influence of junction angle and discharge ratio on the flow and erosion patterns. The hydraulic and geometric parameters which affect the maximum relative scouring depth are analyzed. The model is first calibrated and validated. Then three discharge ratios, seven junction angles and five width ratios are considered and compared. Results generally agree with experimental data and show that the process of scouring depends on all these parameters. Numerical results demonstrate that a decrease in the ratio of the tributary width to the main channel width results in an increase in the size of the separation zone. Furthermore, the increase in the width ratio leads to a decrease in the maximum depth of bed erosion. Finally, the maximum depth of bed erosion at the confluence increases with the increasing angle of the junction. Full article
Show Figures

Figure 1

17 pages, 10648 KiB  
Article
Temporal and Spatial Variability of Sediment Transport in a Mountain River: A Preliminary Investigation of the Caldone River, Italy
by Davide Brambilla, Monica Papini and Laura Longoni *
Department of Civil and Environmental Engineering, Politecnico di Milano, 20133 Milan, Italy
Geosciences 2018, 8(5), 163; https://doi.org/10.3390/geosciences8050163 - 4 May 2018
Cited by 7 | Viewed by 5326
Abstract
Sediment transport is a key evolution process of rivers and water basins. This process can pose flood hazards to nearby areas. The Eulerian and Lagrangian methods are usually employed to describe sediment transport in mountain rivers. The application of different methods was proposed [...] Read more.
Sediment transport is a key evolution process of rivers and water basins. This process can pose flood hazards to nearby areas. The Eulerian and Lagrangian methods are usually employed to describe sediment transport in mountain rivers. The application of different methods was proposed by scientists to analyze specific aspects of solid transport, however a complete understanding still alludes us. After a brief review of the most common methods, the coupling of three different methods is proposed and tested in order to study sediment dynamics, and its spatial and temporal variability, in mountain rivers. Tracers, painted bed patches, and digital elevation model (DEM) comparisons are used to characterize sediment transport at both a micro-scale short-term and a macro-scale long-term level on a test reach on Caldone River, Italy. Information about travel distance, critical diameters, active width, and morphological evolution was sought. We focused on how water discharge is changing the relationships between different measurement techniques. High discharge events force the channel to behave in a unique way, while low discharge events generate more intrinsic variability. Only measurement technique coupling can overcome this issue. Results are encouraging and show the potential of a mixed Eulerian-Lagrangian approach. Full article
Show Figures

Figure 1

20 pages, 3039 KiB  
Article
Validating Rainfall-Runoff Modelling Using Satellite-Based and Reanalysis Precipitation Products in the Sre Pok Catchment, the Mekong River Basin
by Thu Ha Nguyen 1, Ilyas Masih 2,*, Yasir A. Mohamed 2,3 and Pieter Van der Zaag 2,4
1 Southern Institute for Water Planning, Ho Chi Minh City 700000, Vietnam
2 IHE Delft Institute for Water Education, 2611 AX Delft, The Netherlands
3 Hydraulic Research Center, P.O. Box 318, Wad Medani, Sudan
4 Department of Water Management, Faculty of Civil Engineering and Geosciences, Delft University of Technology, 2628 CD Delft, The Netherlands
Geosciences 2018, 8(5), 164; https://doi.org/10.3390/geosciences8050164 - 4 May 2018
Cited by 21 | Viewed by 5382
Abstract
The limitation in quantity and quality of climate data, in particular rainfall measurements, directly affects the reliability of hydrological models, which negatively impacts on the quality of water resources planning and management. This is obviously true in poorly-gauged or in transboundary river catchments [...] Read more.
The limitation in quantity and quality of climate data, in particular rainfall measurements, directly affects the reliability of hydrological models, which negatively impacts on the quality of water resources planning and management. This is obviously true in poorly-gauged or in transboundary river catchments with limited practice of data sharing among the riparian states. Satellite-based and reanalysis rainfall products are increasingly recognised as a promising information source to supplement ground observations. This research aims to study the feasibility of using satellite-based and reanalysis rainfall data for rainfall-runoff modelling in the Sre Pok catchment-a poorly gauged catchment located in Vietnam and Cambodia. First, three selected rainfall products (Tropical Rainfall Measuring Mission-TRMM, CPC MORPHing Technique-CMORPH, and European Reanalysis-ERA-Interim) were compared against ground rainfall data of 13 rain-gauges, located inside and in the vicinity of the study catchment. The validation results show that the studied global datasets have a reasonably good correlation with ground observation at monthly time scale (NSE = 0.3 to 0.8, R2 = 0.4 to 0.8), but relatively poor correlation at daily scale (NSE = −0.4 to 0.3, R2 = 0.1 to 0.4). Next, a semi-distributed rainfall-runoff model based on HBV-Light was developed to validate these datasets in the Krong Ana sub-catchment of the Sre Pok. The results illustrate satisfactory to very good model performances at monthly time scale for the satellite-based and reanalysis rainfall inputs (NSE = 0.58 to 0.77, R2 = 0.59 to 0.78 for the calibration period from 2004 to 2007, while NSE = 0.59 to 0.80, R2 = 0.64 to 0.84 for the validation period from 2008 to 2010). However, only TRMM and ERA-Interim give acceptable results at daily scale with NSE = 0.52 to 0.67, R2 = 0.53 to 0.67 for the calibration period, and NSE = 0.41 to 0.61, R2 = 0.45 to 0.65 for the validation period. The study concludes that the tested satellite-based and reanalysis rainfall products, especially TRMM and ERA-Interim, could mimic reasonably well the monthly rainfall pattern in the study region. It also demonstrates a great opportunity to use satellite-based and reanalysis rainfall for runoff modelling at monthly time scale in the Sre Pok catchment and other poorly-gauged (transboundary) catchments in the region, for example in the Mekong and Red River Basins. Full article
Show Figures

Figure 1

12 pages, 2176 KiB  
Article
Soil Erosion Induced by the Introduction of New Pasture Species in a Faxinal Farm of Southern Brazil
by Valdemir Antoneli 1, Everson A. Rebinski 1, João Anesio Bednarz 1, Jesús Rodrigo-Comino 2,3,*, Saskia Deborah Keesstra 4,5, Artemi Cerdà 6 and Manuel Pulido Fernández 7
1 Department of Geography, Universidade Estadual do Centro-Oeste (UNICENTRO), Irati, P.C. 84500-000 Paraná, Brazil
2 Instituto de Geomorfología y Suelos, Department of Geography, University of Málaga, 29071 Málaga, Spain
3 Department of Physical Geography, Trier University, 54286 Trier, Germany
4 Soil, Water and Land Use Team, Wageningen Environmental Research, Wageningen UR, 6708PB Wageningen, The Netherlands
5 Civil, Surveying and Environmental Engineering, The University of Newcastle, Callaghan 2308, Australia
6 Soil Erosion and Degradation Research Group (SEDER), Department of Geography, University of Valencia, 46010 Valencia, Spain
7 GeoEnvironmental Research Group, Department of Arts and Territory Sciences, University of Extremadura, 10071 Cáceres, Spain
Geosciences 2018, 8(5), 166; https://doi.org/10.3390/geosciences8050166 - 7 May 2018
Cited by 33 | Viewed by 5644
Abstract
The faxinal management system is an endangered agro-silvopastoral system which forms part of the local traditional management in the Paraná federal state (Brazil). Significant changes in land management since the 1970s caused farmers to look for alternatives to increase the productivity of their [...] Read more.
The faxinal management system is an endangered agro-silvopastoral system which forms part of the local traditional management in the Paraná federal state (Brazil). Significant changes in land management since the 1970s caused farmers to look for alternatives to increase the productivity of their farms. The introduction of new pasture species is causing land degradation problems, of which soil erosion is the most important challenge. Therefore, in this study, we assessed the environmental consequences of introducing exotic pasture species, such as Brachiaria decumbens. To achieve this goal, ten erosion plots were installed with exotic and native pastures (Paspalum notatum Flüggé) to quantify soil and water losses in paired plots. Total rainfall per event, soil properties (soil cover, texture, organic matter, bulk density, porosity, and soil penetration resistance), and pasture production were also estimated. Our results showed a decrease in organic matter and porosity and an increase of the bulk density in the exotic pasture plots. Soil erosion monitoring showed higher soil losses for the exotic cultivated plots (359.8 g m−2 or 3.6 mg ha−1) than for the native plots (90.7 g m−2 or 0.91 mg ha−1). The highest percentage of bare soil surfaces and compaction coincided with the highest soil erosion rates measured in the exotic pastures. However, the mean fodder production in the exotic plots was almost five times higher (987 kg DM ha−1) than in the native ones (204 kg DM ha−1). These findings confirm that farmers have an internal conflict. They want to optimize the production of fodder, but this leads to high soil erosion rates and reduces soil fertility in the medium- and long-term. The traditional, less productive pastoral system is more sustainable from an environmental and cultural point of view. However, this system may not be sustainable from an economic point of view. Full article
(This article belongs to the Special Issue Mechanics of Erosion: Process Response to Change)
Show Figures

Figure 1

17 pages, 2429 KiB  
Article
Mass Balance of Cenozoic Andes-Amazon Source to Sink System—Marañón Basin, Peru
by Gérôme Calvès 1,*, Ysabel Calderón 2, Christian Hurtado Enriquez 3, Stéphane Brusset 1, William Santini 1,4 and Patrice Baby 1,4
1 Géosciences Environnement Toulouse-Observatoire Midi-Pyrénées (GET/OMP), Université Toulouse 3, Paul Sabatier, 14 Avenue Edouard Belin, 31400 Toulouse, France
2 PERUPETRO S.A., Av. Luis Aldana 380, San Borja, Lima 15000, Peru
3 Institute of Geosciences, University of Brasília, Brasília CEP 70.910-900, Brazil
4 Institut de recherche pour le développement (IRD), 13572 Marseille, France
Geosciences 2018, 8(5), 167; https://doi.org/10.3390/geosciences8050167 - 7 May 2018
Cited by 8 | Viewed by 5365
Abstract
We investigate the mass balance of the Cenozoic Andes-Amazon source to sink system using rock uplift proxies and solid sedimentation of the Marañón Basin in Peru. The evolution of sedimentation rates is calibrated with regional structural restored cross-section. The quantification of eroded sediments [...] Read more.
We investigate the mass balance of the Cenozoic Andes-Amazon source to sink system using rock uplift proxies and solid sedimentation of the Marañón Basin in Peru. The evolution of sedimentation rates is calibrated with regional structural restored cross-section. The quantification of eroded sediments from reliefs to sedimentary basin is achieved with ×10 Myr resolution and compared to present day proxies from the HYBAM (HYdrologie et Biogéochimie du Bassin Amazonien) Critical Zone Observatory. Erosion of the early Andean landforms started during the Upper Mesozoic period, but sediment rates significantly increase during the Neogene. This is in agreement with the calibrated increase of rock uplift in the Andean orogenic belt. Full article
(This article belongs to the Special Issue Tectonics and Morphodynamics)
Show Figures

Figure 1

15 pages, 2538 KiB  
Article
Columbite-Group Minerals from New York Pegmatites: Insights from Isotopic and Geochemical Analyses
by Marian V. Lupulescu 1,*, Jeffrey R. Chiarenzelli 2, Mark E. Pecha 3, Jared W. Singer 4 and Sean P. Regan 5
1 New York State Museum, Research and Collections, Albany, NY 12230, USA
2 Department of Geology, St. Lawrence University, Canton, NY 13617, USA
3 Department of Geosciences, University of Arizona, Tucson, AZ 85721, USA
4 Department of Earth and Environmental Sciences, Rensselaer Polytechnic Institute, Troy, NY 12180, USA
5 Eastern Geology and Paleoclimate Center, U.S. Geological Survey, P.O. Box 628, Montpelier, VT 05602, USA
Geosciences 2018, 8(5), 169; https://doi.org/10.3390/geosciences8050169 - 9 May 2018
Cited by 9 | Viewed by 5210
Abstract
Columbite crystals from niobium-yttrium-fluorine (NYF) pegmatites lacking zircon or containing metamict cyrtolite were analyzed for major and minor elements (Electron Microprobe (EMP)), trace elements (Laser Ablation-Inductively Coupled Plasma-Mass Spectrometry (LA-ICP-MS)), and U-Pb geochronology (Laser AblationMulti-Collector-Inductively Coupled Plasma-Mass Spectrometry (LA-MC-ICP-MS)). All four pegmatite localities [...] Read more.
Columbite crystals from niobium-yttrium-fluorine (NYF) pegmatites lacking zircon or containing metamict cyrtolite were analyzed for major and minor elements (Electron Microprobe (EMP)), trace elements (Laser Ablation-Inductively Coupled Plasma-Mass Spectrometry (LA-ICP-MS)), and U-Pb geochronology (Laser AblationMulti-Collector-Inductively Coupled Plasma-Mass Spectrometry (LA-MC-ICP-MS)). All four pegmatite localities sampled are hosted by the Proterozoic Fordham gneiss and/or Paleozoic Bedford gneiss (Columbite-(Fe); Kinkel and Baylis localities) and the Manhattan Schist of Lower Paleozoic age (Columbite-(Mn); Fort George and Harlem River Drive localities) and yield Neoacadian ages. The weighted average U-Pb ages are 372.2 ± 8.2 Ma (Baylis Quarry), 371.3 ± 7.3 and 383.4 ± 8.9 Ma (Kinkel Quarry); 383 ± 15 Ma (185th St. and Harlem River Drive); and 372 ± 10 Ma (Fort George). A partial metamict zircon (“cyrtolite”) from the Kinkel Quarry yielded a weighted average U-Pb age of 376.9 ± 4.3 Ma. The Neoacadian ages obtained agree with those determined by thermal ionization mass spectrometry (TIMS) for zircon from Lithium-Cesium-Tantalum (LCT) pegmatites from Connecticut and Maine. No pegmatites temporally associated with the Taconic orogeny were found. The size, lack of common Pb, uniform U concentrations across crystal cross-sections, sufficient but moderate uranium concentrations, lack of metamictization, and consistency in U-Pb isotopic ratios for columbite samples BCB-COL, NYSM #25232, and NYSM #525.8 suggests they show promise as potential standards for oxide mineral LA-MC-ICP-MS geochronological analyses, however, additional characterization using ID-TIMS would be necessary to develop as such. Full article
(This article belongs to the Special Issue Geochronology Applied to Metallogeny and Deposit Studies)
Show Figures

Figure 1

14 pages, 3805 KiB  
Article
Development of Three-Dimensional Soil-Amplification Analysis Method for Screening for Seismic Damage to Buried Water-Distribution Pipeline Networks
by Kohei Fujita 1,*, Tsuyoshi Ichimura 1, Motoki Kazama 2, Susumu Ohno 3 and Shingo Sato 4
1 Earthquake Research Institute and Department of Civil Engineering, The University of Tokyo, Tokyo 113-0032, Japan
2 Department of Civil and Environmental Engineering, Graduate School of Engineering, Tohoku University, Sendai 980-8579, Japan
3 International Research Institute of Disaster Science, Tohoku University, Sendai 980-0845, Japan
4 Fukken Gijyutsu Consultant Co., Ltd., Sendai 980-0012, Japan
Geosciences 2018, 8(5), 170; https://doi.org/10.3390/geosciences8050170 - 9 May 2018
Viewed by 4173
Abstract
A soil-amplification analysis method is developed that uses high-resolution ground data and a three-dimensional nonlinear dynamic finite-element method to screen for possible areas of seismic damage to buried water-distribution pipeline networks. The method is applied to a cut-and-fill developed area in Japan, whose [...] Read more.
A soil-amplification analysis method is developed that uses high-resolution ground data and a three-dimensional nonlinear dynamic finite-element method to screen for possible areas of seismic damage to buried water-distribution pipeline networks. The method is applied to a cut-and-fill developed area in Japan, whose water-distribution pipeline network was severely damaged in the 2011 off the Pacific Coast of Tohoku Earthquake. The obtained soil amplification is compared with known points of pipeline damage to check the validity of the analysis. A sensitivity test is also conducted to account for uncertainties in the properties of the ground material. From the results, it is expected that the developed soil-amplification method could be used to screen for possible damage to buried pipelines in a given area, and used to support methods for estimating damage to buried pipelines based on observations and seismic indices. Full article
Show Figures

Figure 1

17 pages, 16147 KiB  
Article
Multicamera, Multimethod Measurements for Hydromorphologic Laboratory Experiments
by Alessio Radice * and Barbara Zanchi
Department of Civil and Environmental Engineering, Politecnico di Milano, Milan 20133, Italy
Geosciences 2018, 8(5), 172; https://doi.org/10.3390/geosciences8050172 - 10 May 2018
Cited by 8 | Viewed by 3940
Abstract
The realization of hydromorphologic laboratory experiments on the propagation of aggrading or degrading sediment fronts requires simultaneous measurements of the sediment feeding rate, the profile of the free surface, and the flume bed elevation. In this study, five action cameras and different image-processing [...] Read more.
The realization of hydromorphologic laboratory experiments on the propagation of aggrading or degrading sediment fronts requires simultaneous measurements of the sediment feeding rate, the profile of the free surface, and the flume bed elevation. In this study, five action cameras and different image-processing techniques were employed to measure all the needed quantities automatically and with adequate temporal resolution. The measurement of the sediment feeding rate was determined by particle image velocimetry as a surrogate, correlated quantity: the surface velocity of the sediment flow along a vibrating channel was used as an upstream feeder. The profile of the free surface was measured by shooting an array of piezometers connected to the flume. Each piezometer pipe contained a buoyant black sphere that could be recognized by using tools for particle identification, thus determining the elevation of the free surface above the piezometric probe. Finally, the bed profile along the flume was measured at any instant by edge detection, locating the transition from a water layer to a sediment layer in images taken from the side of the flume. The paper describes the instrumentation and the methods, finally presenting the results obtained from a prototypal experiment. Potentialities and limitations of the proposed methods are discussed, together with some prospects on future use in systematic experimental campaigns. Full article
(This article belongs to the Special Issue Laboratory Geosciences: Modelling Surface Processes)
Show Figures

Figure 1

25 pages, 10542 KiB  
Article
Systematic Evaluation of Different Infrastructure Systems for Tsunami Defense in Sendai City
by Kwanchai Pakoksung *, Anawat Suppasri and Fumihiko Imamura
International Research Institute of Disaster Science, Tohoku University, 468-1 Aramaki-Aza, Aoba-ku, Sendai 980-0845, Japan
Geosciences 2018, 8(5), 173; https://doi.org/10.3390/geosciences8050173 - 10 May 2018
Cited by 23 | Viewed by 6104
Abstract
The aim of this study is to assess the performances of different infrastructures as structural tsunami countermeasures in Sendai City, based on the lessons from the 11 March 2011, Great East Japan Tsunami, which is an example of a worst-case scenario. The tsunami [...] Read more.
The aim of this study is to assess the performances of different infrastructures as structural tsunami countermeasures in Sendai City, based on the lessons from the 11 March 2011, Great East Japan Tsunami, which is an example of a worst-case scenario. The tsunami source model Ver. 1.2 proposed by Tohoku University uses 10 subfaults, determined based on the tsunami height and the run-up heights measured for all tsunami affected areas. The TUNAMI-N2 model is used to simulate 24 cases of tsunami defense in Sendai City based on a combination of 5 scenarios of structural measures, namely, a seawall (existing and new seawall), a greenbelt, an elevated road and a highway. The results of a 2D tsunami numerical analysis show a significant difference in the tsunami inundations in the areas protected by several combinations of structures. The elevated road provides the highest performance of the single schemes, whereas the highest performance of the 2-layer schemes is the combination of an existing seawall and an elevated road. For the 3-layer scenarios, the highest performance is achieved by the grouping of an existing seawall, a new seawall, and an elevated road. The combination of an existing seawall, a new seawall, a greenbelt and an elevated road is the highest performing 4-layer scenario. The Sendai City plan, with a 5-layer scenario, reduces the tsunami inundation area by 20 sq. km with existing structural conditions. We found that the combination of an existing seawall, a greenbelt, an elevated road and a highway (a 4-layer scheme) is the optimum case to protect the city against a tsunami similar to the 2011 Great East Japan Tsunami. The proposed approach can be a guideline for future tsunami protection and the evaluation of countermeasure schemes. Full article
(This article belongs to the Special Issue Interdisciplinary Geosciences Perspectives of Tsunami)
Show Figures

Figure 1

14 pages, 4916 KiB  
Article
Mapping the Loss of Mt. Kenya’s Glaciers: An Example of the Challenges of Satellite Monitoring of Very Small Glaciers
by Rainer Prinz 1,*, Armin Heller 2, Martin Ladner 2,3, Lindsey I. Nicholson 4 and Georg Kaser 4
1 Department of Geography and Regional Science, University of Graz, Heinrichstrasse 36, 8010 Graz, Austria
2 Institute of Geography, University of Innsbruck, Innrain 52, 6020 Innsbruck, Austria
3 Austrian Alpine Club, Olympiastrasse 37, 6020 Innsbruck, Austria
4 Institute of Atmospheric and Cryospheric Sciences, University of Innsbruck, Innrain 52, 6020 Innsbruck, Austria
Geosciences 2018, 8(5), 174; https://doi.org/10.3390/geosciences8050174 - 11 May 2018
Cited by 27 | Viewed by 11175
Abstract
Since the last complete glacier mapping of Mt. Kenya in 2004, strong glacier retreat and glacier disintegration have been reported. Here, we compile and present a new glacier inventory of Mt. Kenya to document recent glacier change. Glacier area and mass changes were [...] Read more.
Since the last complete glacier mapping of Mt. Kenya in 2004, strong glacier retreat and glacier disintegration have been reported. Here, we compile and present a new glacier inventory of Mt. Kenya to document recent glacier change. Glacier area and mass changes were derived from an orthophoto and digital elevation model extracted from Pléiades tri-stereo satellite images. We additionally explore the feasibility of using freely available imagery (Sentinel-2) and an alternative elevation model (TanDEM-X-DEM) for monitoring very small glaciers in complex terrain, but both proved to be inappropriate; Sentinel-2 because of its too coarse horizontal resolution compared to the very small glaciers, and TanDEM-X-DEM because of errors in the steep summit area of Mt. Kenya. During 2004–2016, the total glacier area on Mt. Kenya decreased by 121.0 × 10³ m² (44%). The largest glacier (Lewis) lost 62.8 × 10³ m² (46%) of its area and 1.35 × 10³ m³ (57%) of its volume during the same period. The mass loss of Lewis Glacier has been accelerating since 2010 due to glacier disintegration, which has led to the emergence of a rock outcrop splitting the glacier in two parts. If the current retreat rates prevail, Mt. Kenya’s glaciers will be extinct before 2030, implying the cessation of the longest glacier monitoring record of the tropics. Full article
(This article belongs to the Special Issue Remote Sensing of Land Ice)
Show Figures

Figure 1

13 pages, 3986 KiB  
Article
Numerically Calculated 3D Space-Weighting Functions to Image Crustal Volcanic Structures Using Diffuse Coda Waves
by Edoardo Del Pezzo 1,2, Angel De La Torre 3, Francesca Bianco 2, Jesús Ibanez 1, Simona Gabrielli 4 and Luca De Siena 4,*
1 Instituto Andaluz de Geofisica, University of Granada, Campus de Cartuja, 18071 Granada, Spain
2 Istituto Nazionale di Geofisica e Vulcanologia, sezione di Napoli, Via Diocleziano 328, 80125 Napoli, Italy
3 Departamento de Teoria de la Senal Telematica y Comunicaciones, C/Periodista Daniel Saucedo Aranda, s/n, Universidad de Granada, Campus de Cartuja, 18071 Granada, Spain
4 Department of Geology and Petroleum Geology, School of Geosciences, University of Aberdeen, AB24 3UE, Aberdeen, UK
Geosciences 2018, 8(5), 175; https://doi.org/10.3390/geosciences8050175 - 11 May 2018
Cited by 28 | Viewed by 4934
Abstract
Seismic coda measurements retrieve parameters linked to the physical characteristics of rock volumes illuminated by high frequency scattered waves. Space weighting functions (SWF) and kernels are different tools that model the spatial sensitivity of coda envelopes to scattering and absorption anomalies in these [...] Read more.
Seismic coda measurements retrieve parameters linked to the physical characteristics of rock volumes illuminated by high frequency scattered waves. Space weighting functions (SWF) and kernels are different tools that model the spatial sensitivity of coda envelopes to scattering and absorption anomalies in these rock matrices, allowing coda-wave attenuation ( Q c o d a ) imaging. This note clarifies the difference between SWF and sensitivity kernels developed for coda wave imaging. It extends the SWF previously developed in 2D to the third dimension by using radiative transfer and the diffusion equation, based on the assumption that variations of Q c o d a depend solely on variations of the extinction length. When applied to active data (Deception Island, Antarctica), 3D SWF images strongly resemble 2D images, making this 3D extension redundant. On the other hand, diffusion does not efficiently model coda waveforms when using earthquake datasets spanning depths between 0 and 20 km, such as at Mount St. Helens volcano. In this setting, scattering attenuation and absorption suffer tradeoffs and cannot be separated by fitting a single seismogram energy envelope for SWF imaging. We propose that an approximate analytical 3D SWF, similar in shape to the common coda kernels used in literature, can still be used in a space weighted back-projection approach. While Q c o d a is not a physical parameter of the propagation medium, its spatially-dependent modeling allows improved reconstruction of crustal-scale tectonic and geological features. It is even more efficient as a velocity independent imaging tool for magma and fluid storage when applied to deep volcanism. Full article
(This article belongs to the Special Issue Volcano Seismology)
Show Figures

Figure 1

12 pages, 1785 KiB  
Article
Low Cost, Lightweight Gravity Coring and Improved Epoxy Impregnation Applied to Laminated Maar Sediment in Vietnam
by Jan P. Schimmelmann 1,*, Hướng Nguyễn-Văn 2, Dương Nguyễn-Thuỳ 2 and Arndt Schimmelmann 3
1 Institute of Geography, University of Bremen, Celsiusstrasse 2, D-28359 Bremen, Germany
2 Faculty of Geology, VNU University of Science (HUS), 334 Nguyen Trai, Thanh Xuan District, Hanoi, Vietnam
3 Department of Earth and Atmospheric Sciences, Indiana University, Bloomington, IN 47405-1403, USA
Geosciences 2018, 8(5), 176; https://doi.org/10.3390/geosciences8050176 - 11 May 2018
Cited by 7 | Viewed by 7361
Abstract
In response to the need for lightweight and affordable sediment coring and high-resolution structural documentation of unconsolidated sediment, we developed economical and fast methods for (i) recovering short sediment cores with undisturbed topmost sediment, without the need for a firmly anchored coring platform, [...] Read more.
In response to the need for lightweight and affordable sediment coring and high-resolution structural documentation of unconsolidated sediment, we developed economical and fast methods for (i) recovering short sediment cores with undisturbed topmost sediment, without the need for a firmly anchored coring platform, and (ii) rapid epoxy-impregnation of crayon-shaped subcores in preparation for thin-sectioning, with minimal use of solvents and epoxy resin. The ‘Autonomous Gravity Corer’ (AGC) can be carried to remote locations and deployed from an inflatable or makeshift raft. Its utility was tested on modern unconsolidated lacustrine sediment from a ~21 m deep maar lake in Vietnam’s Central Highlands near Pleiku. The sedimentary fabric fidelity of the epoxy-impregnation method was demonstrated for finely laminated artificial flume sediment. Our affordable AGC is attractive not only for work in developing countries, but lends itself broadly for coring in remote regions where challenging logistics prevent the use of heavy coring equipment. The improved epoxy-impregnation technique saves effort and costly chemical reagents, while at the same time preserving the texture of the sediment. Full article
(This article belongs to the Special Issue New Theoretical and Applied Advances in Paleolimnology)
Show Figures

Figure 1

15 pages, 828 KiB  
Article
Towards a New Paradigm in Water Management: Cochabamba’s Water Agenda from an Ethical Approach
by Francesc Bellaubi 1,* and Rocío Bustamante 2
1 Consultant, Prenzlauer Promenade 183, 13189 Berlin, Germany
2 Lecturer/Researcher, Centro Andino del Agua, Universidad Mayor de S. Simón, Facultad de Agronomía, Av. Petrolera Km 5, Cochabamba, Bolivia
Geosciences 2018, 8(5), 177; https://doi.org/10.3390/geosciences8050177 - 14 May 2018
Cited by 10 | Viewed by 4991
Abstract
The Cochabamba Water War (2000) is well renowned for being a part of the civil society versus water service delivery debate. From a situation of service privatization, limited access, and an inexistent institutional framework in 2000, the current situation in the Cochabamba Valley [...] Read more.
The Cochabamba Water War (2000) is well renowned for being a part of the civil society versus water service delivery debate. From a situation of service privatization, limited access, and an inexistent institutional framework in 2000, the current situation in the Cochabamba Valley faces increasing water scarcity within a weak institutional set up. To alleviate the situation, the government of Evo Morales has been actively funding projects considering an Integrated Water Resources Management (IWRM) but confronting customary water rights in rural communities and thus increasing the level of conflict between water uses. Amid these two water management practices appears the Agenda del Agua Cochabamba (AdA)—the Cochabamba Water Agenda—claiming water as part of the commons and not a resource. This paper explains the paradigm’s values behind the conflicting IWRM and water rights’ water management practices and analyses the AdA under a governability framework identifying the barriers and drivers for its implementation. Full article
(This article belongs to the Special Issue Ethics and Geoethics in Geosciences)
Show Figures

Figure 1

14 pages, 8677 KiB  
Article
Hazard Assessment of Storm Events for the Portuguese Northern Coast
by Mariana Peixoto Gomes 1, Lara Santos 1, José Luís Pinho 1 and José S. Antunes do Carmo 2,*
1 Department of Civil Engineering, School of Engineering, University of Minho, 4710-057 Braga, Portugal
2 Department of Civil Engineering, FCTUC—Polo II, University of Coimbra, 3030-788 Coimbra, Portugal
Geosciences 2018, 8(5), 178; https://doi.org/10.3390/geosciences8050178 - 14 May 2018
Cited by 9 | Viewed by 4227
Abstract
Coastal zones currently face severe weaknesses and are subject to high-risk situations. Tropical storm events can contribute to the occurrence of these high-risk situations by causing storm surges with high water levels and, consequently, episodes of wave-overtopping and coastal flooding. This work considers [...] Read more.
Coastal zones currently face severe weaknesses and are subject to high-risk situations. Tropical storm events can contribute to the occurrence of these high-risk situations by causing storm surges with high water levels and, consequently, episodes of wave-overtopping and coastal flooding. This work considers a series of storm scenarios and analyzes their impacts through numerical modeling. Firstly, historical storm tracks and intensities are characterized for the Portuguese northern coast in terms of probability of occurrence. Secondly, several storm events with a high potential of occurrence are generated using a specific tool of the DelftDashboard interface for Delft3D software. Hydrodynamic models are then used to generate an ensemble of simulations to assess the storms’ effects on coastal water levels. Based on the statistical data of the numerical modeling results, a synthesis of the coastal storms’ impacts at different locations within the study area is performed. Depending on the storm category, surge heights can reach 1.10 m above tide levels under simulated conditions on the Portuguese northwestern coast. Full article
(This article belongs to the Special Issue Natural Hazards and Risks Assessment)
Show Figures

Figure 1

15 pages, 2977 KiB  
Article
Metadata Life Cycles, Use Cases and Hierarchies
by Ted Habermann
The HDF Group, Champaign, IL 61820, USA
Geosciences 2018, 8(5), 179; https://doi.org/10.3390/geosciences8050179 - 15 May 2018
Cited by 12 | Viewed by 10028
Abstract
The historic view of metadata as “data about data” is expanding to include data about other items that must be created, used, and understood throughout the data and project life cycles. In this context, metadata might better be defined as the structured and [...] Read more.
The historic view of metadata as “data about data” is expanding to include data about other items that must be created, used, and understood throughout the data and project life cycles. In this context, metadata might better be defined as the structured and standard part of documentation, and the metadata life cycle can be described as the metadata content that is required for documentation in each phase of the project and data life cycles. This incremental approach to metadata creation is similar to the spiral model used in software development. Each phase also has distinct users and specific questions to which they need answers. In many cases, the metadata life cycle involves hierarchies where latter phases have increased numbers of items. The relationships between metadata in different phases can be captured through structure in the metadata standard, or through conventions for identifiers. Metadata creation and management can be streamlined and simplified by re-using metadata across many records. Many of these ideas have been developed to various degrees in several Geoscience disciplines and are being used in metadata for documenting the integrated life cycle of environmental research in the Arctic, including projects, collection sites, and datasets. Full article
(This article belongs to the Special Issue Geodata Management)
Show Figures

Figure 1

12 pages, 2968 KiB  
Article
A Hybrid Empirical Green’s Function Technique for Predicting Ground Motion from Induced Seismicity: Application to the Basel Enhanced Geothermal System
by Benjamin Edwards 1,*, Nadine Staudenmaier 2, Carlo Cauzzi 2 and Stefan Wiemer 2
1 Earth, Ocean and Ecological Sciences, 4 Brownlow St., University of Liverpool, Liverpool L69 3GP, UK
2 Swiss Seismological Service, ETH Zurich, 5 Sonneggstrasse, 8092 Zurich, Switzerland
Geosciences 2018, 8(5), 180; https://doi.org/10.3390/geosciences8050180 - 15 May 2018
Cited by 4 | Viewed by 4634
Abstract
A method is described for the prediction of site-specific surface ground motion due to induced earthquakes occurring in predictable and well-defined source zones. The method is based on empirical Green’s functions (EGFs), determined using micro-earthquakes at sites where seismicity is being induced (e.g., [...] Read more.
A method is described for the prediction of site-specific surface ground motion due to induced earthquakes occurring in predictable and well-defined source zones. The method is based on empirical Green’s functions (EGFs), determined using micro-earthquakes at sites where seismicity is being induced (e.g., hydraulic fracturing and wastewater injection during shale oil and gas extraction, CO2 sequestration, and conventional and enhanced geothermal injection). Using the EGF approach, a ground-motion field (e.g., an intensity map) can be calculated for a potentially felt induced event originating within the seismic zone. The approach allows site- and path-specific effects to be mapped into the ground-motion field, providing a local ground-motion model that accounts for wave-propagation effects without the requirement of 3D velocity models or extensive computational resources. As a test case, the ground-motion field for the mainshock (ML = 3.4, M = 3.2) resulting from the Basel Enhanced Geothermal System (EGS) was simulated using only seismicity recorded prior to the event. We focussed on peak ground velocity (PGV), as this is a measure of ground motion on which Swiss norms for vibration disturbances are based. The performance of the method was significantly better than a previously developed generic ground-motion prediction equation (GMPE) for induced earthquakes and showed improved performance through intrinsic inclusion of site-specific effects relative to predictions for a local GMPE. Both median motions and the site-to-site ground-motion variability were captured, leading to significantly reduced misfit relative to the generic GMPE. It was shown, however, that extrapolation beyond units of a couple of magnitude leads to significant uncertainty. The method is well suited to a real-time predictive hazard framework, for which shaking estimates are dynamically updated in light of newly recorded seismicity. Full article
Show Figures

Figure 1

14 pages, 3144 KiB  
Article
From Deterministic to Probabilistic Forecasts: The ‘Shift-Target’ Approach in the Milan Urban Area (Northern Italy)
by Gabriele Lombardi 1,*, Alessandro Ceppi 1, Giovanni Ravazzani 1, Silvio Davolio 2 and Marco Mancini 1
1 Department of Civil and Environmental Engineering, DICA, Politecnico di Milano, 20133 Milano, Italy
2 Institute of Atmospheric Sciences and Climate, National Research Council of Italy, CNR-ISAC, 40129 Bologna, Italy
Geosciences 2018, 8(5), 181; https://doi.org/10.3390/geosciences8050181 - 15 May 2018
Cited by 15 | Viewed by 4934
Abstract
The number of natural catastrophes that affect people worldwide is increasing; among these, the hydro-meteorological events represent the worst scenario due to the thousands of deaths and huge damages to private and state ownership they can cause. To prevent this, besides various structural [...] Read more.
The number of natural catastrophes that affect people worldwide is increasing; among these, the hydro-meteorological events represent the worst scenario due to the thousands of deaths and huge damages to private and state ownership they can cause. To prevent this, besides various structural measures, many non-structural solutions, such as the implementation of flood warning systems, have been proposed in recent years. In this study, we suggest a low computational cost method to produce a probabilistic flood prediction system using a single forecast precipitation scenario perturbed via a spatial shift. In fact, it is well-known that accurate forecasts of heavy precipitation, especially associated with deep moist convection, are challenging due to uncertainties arising from the numerical weather prediction (NWP), and high sensitivity to misrepresentation of the initial atmospheric state. Inaccuracies in precipitation forecasts are partially due to spatial misplacing. To produce hydro-meteorological simulations and forecasts, we use a flood forecasting system which comprises the physically-based rainfall-runoff hydrological model FEST-WB developed by the Politecnico di Milano, and the MOLOCH meteorological model provided by the Institute of Atmospheric Sciences and Climate (CNR-ISAC). The areas of study are the hydrological basins of the rivers Seveso, Olona, and Lambro located in the northern part of Milan city (northern Italy) where this system works every day in real-time. In this paper, we show the performance of reforecasts carried out between the years 2012 and 2015: in particular, we explore the ‘Shift-Target’ (ST) approach in order to obtain 40 ensemble members, which we assume equally likely, derived from the available deterministic precipitation forecast. Performances are shown through statistical indexes based on exceeding the threshold for different gauge stations over the three hydrological basins. Results highlight how the Shift-Target approach complements the deterministic MOLOCH-based flood forecast for warning purposes. Full article
(This article belongs to the Special Issue Hydrological Hazard: Analysis and Prevention)
Show Figures

Figure 1

22 pages, 10453 KiB  
Article
HF/VHF Radar Sounding of Ice from Manned and Unmanned Airborne Platforms
by Emily Arnold 1,2,*, Fernando Rodriguez-Morales 2, John Paden 2, Carl Leuschen 2,3, Shawn Keshmiri 1,2, Stephen Yan 4, Mark Ewing 1,2, Rick Hale 1,2, Ali Mahmood 2,3, Aaron Blevins 1,2, Akhilesh Mishra 2,3, Teja Karidi 2,3, Bailey Miller 1,2 and John Sonntag 5
1 Aerospace Engineering Department, University of Kansas, Lawrence, KS 66045, USA
2 Center for Remote Sensing of Ice Sheets, University of Kansas. Lawrence, KS 66045, USA
3 Electrical Engineering & Computer Science Department, University of Kansas, Lawrence, KS 66045, USA
4 Department of Electrical and Computer Engineering, University of Alabama, Tuscaloosa, AL 35487, USA
5 AECOM Corporation, Greenbelt, MD 20782, USA
Geosciences 2018, 8(5), 182; https://doi.org/10.3390/geosciences8050182 - 16 May 2018
Cited by 18 | Viewed by 7771
Abstract
Ice thickness and bed topography of fast-flowing outlet glaciers are large sources of uncertainty for the current ice sheet models used to predict future contributions to sea-level rise. Due to a lack of coverage and difficulty in sounding and imaging with ice-penetrating radars, [...] Read more.
Ice thickness and bed topography of fast-flowing outlet glaciers are large sources of uncertainty for the current ice sheet models used to predict future contributions to sea-level rise. Due to a lack of coverage and difficulty in sounding and imaging with ice-penetrating radars, these regions remain poorly constrained in models. Increases in off-nadir scattering due to the highly crevassed surfaces, volumetric scattering (due to debris and/or pockets of liquid water), and signal attenuation (due to warmer ice near the bottom) are all impediments in detecting bed-echoes. A set of high-frequency (HF)/very high-frequency (VHF) radars operating at 14 MHz and 30–35 MHz were developed at the University of Kansas to sound temperate ice and outlet glaciers. We have deployed these radars on a small unmanned aircraft system (UAS) and a DHC-6 Twin Otter. For both installations, the system utilized a dipole antenna oriented in the cross-track direction, providing some performance advantages over other temperate ice sounders operating at lower frequencies. In this paper, we describe the platform-sensor systems, field operations, data-processing techniques, and preliminary results. We also compare our results with data from other ice-sounding radars that operate at frequencies both above (Center for Remote Sensing of Ice Sheets (CReSIS) Multichannel Coherent Depth Sounder (MCoRDS)) and below (Jet Propulsion Laboratory (JPL) Warm Ice Sounding Explorer (WISE)) our HF/VHF system. During field campaigns, both unmanned and manned platforms flew closely spaced parallel and repeat flight lines. We examine these data sets to determine image coherency between flight lines and discuss the feasibility of forming 2D synthetic apertures by using such a mission approach. Full article
(This article belongs to the Special Issue Remote Sensing of Land Ice)
Show Figures

Figure 1

14 pages, 3012 KiB  
Article
Rock Magnetic, Petrography, and Geochemistry Studies of Lava at the Ijen Volcanic Complex (IVC), Banyuwangi, East Java, Indonesia
by Aditya Pratama 1,*, Satria Bijaksana 1, Mirzam Abdurrachman 2 and Nono Agus Santoso 1
1 Faculty of Mining and Petroleum Engineering, Institut Teknologi Bandung, Bandung 40132, Indonesia
2 Faculty of Earth Sciences and Technology, Institut Teknologi Bandung, Bandung 40132, Indonesia
Geosciences 2018, 8(5), 183; https://doi.org/10.3390/geosciences8050183 - 17 May 2018
Cited by 11 | Viewed by 8209
Abstract
Lava has complex geochemical characteristics based on differences in eruption centers, eruptive events, and flow emplacement. Characterization of lava is useful for understanding the geological conditions of a volcanic region. To complement geochemical methods, rock magnetic methods are being used to analyze lava. [...] Read more.
Lava has complex geochemical characteristics based on differences in eruption centers, eruptive events, and flow emplacement. Characterization of lava is useful for understanding the geological conditions of a volcanic region. To complement geochemical methods, rock magnetic methods are being used to analyze lava. To explore the potential uses of rock magnetic methods for lava characterization, a series of magnetic measurements were completed in lava samples from eight locations in the Ijen Volcanic Complex (IVC) in Banyuwangi, East Java, Indonesia. These locations were grouped into two eruption centers: Ijen Crater and Mount Anyar. The magnetic measurements included frequency-dependent magnetic susceptibility, thermomagnetic, anhysteretic remanent magnetization (ARM), isothermal remanent magnetization (IRM), and hysteresis curve analyses. These measurements were supplemented using X-ray fluorescence, petrography analyses, and Scanning Electron Microscopy with Energy Dispersive Spectroscopy (SEM-EDS). Based on their lithology, lava samples were categorized into basalt, basaltic andesite, and basaltic trachyandesite. The dominant magnetic mineral contained in the sample was iron-rich titanomagnetite and titanium-rich titanomagnetite with a magnetic pseudo-single-domain and small amounts of superparamagnetic grain minerals in some samples. The significant difference in mass specific susceptibility (χLF) is caused by differences in the crystallization process. The differences in susceptibility frequency dependence (χFD) highlighted the differences in the magma cooling rate, demonstrated by the differences in the percentage of opaque mineral groundmass. The rock magnetic method was proven to support the geochemistry and petrography methods used to characterize lava and identify the causes of differences in lava characteristics. Full article
Show Figures

Figure 1

21 pages, 18339 KiB  
Article
Bathymetry and Canyons of the Eastern Bering Sea Slope
by Mark Zimmermann 1,* and Megan M. Prescott 2
1 National Marine Fisheries Service, NOAA, Alaska Fisheries Science Center, 7600 Sand Point Way NE, Bldg. 4, Seattle, WA 98115-6349, USA
2 Lynker Technologies, Under contract to Alaska Fisheries Science Center, 7600 Sand Point Way NE, Bldg. 4, Seattle, WA 98115-6349, USA
Geosciences 2018, 8(5), 184; https://doi.org/10.3390/geosciences8050184 - 21 May 2018
Cited by 17 | Viewed by 14755
Abstract
We created a new, 100 m horizontal resolution bathymetry raster and used it to define 29 canyons of the eastern Bering Sea (EBS) slope area off of Alaska, USA. To create this bathymetry surface we proofed, edited, and digitized 18 million soundings from [...] Read more.
We created a new, 100 m horizontal resolution bathymetry raster and used it to define 29 canyons of the eastern Bering Sea (EBS) slope area off of Alaska, USA. To create this bathymetry surface we proofed, edited, and digitized 18 million soundings from over 200 individual sources. Despite the vast size (~1250 km long by ~3000 m high) and ecological significance of the EBS slope, there have been few hydrographic-quality charting cruises conducted in this area, so we relied mostly on uncalibrated underway files from cruises of convenience. The lack of hydrographic quality surveys, anecdotal reports of features such as pinnacles, and reliance on satellite altimetry data has created confusion in previous bathymetric compilations about the details along the slope, such as the shape and location of canyons along the edge of the slope, and hills and valleys on the adjacent shelf area. A better model of the EBS slope will be useful for geologists, oceanographers, and biologists studying the seafloor geomorphology and the unusually high productivity along this poorly understood seafloor feature. Full article
(This article belongs to the Special Issue Marine Geomorphometry)
Show Figures

Graphical abstract

15 pages, 3308 KiB  
Article
Experimental Modelling of the Caprock/Cement Interface Behaviour under CO2 Storage Conditions: Effect of Water and Supercritical CO2 from a Cathodoluminescence Study
by Emmanuel Jobard 1, Jérôme Sterpenich 1,*, Jacques Pironon 1, Jérôme Corvisier 1,2 and Aurélien Randi 1
1 Laboratoire GeoRessources, Université de Lorraine, UMR 7359, BP 70239, 54506 Vandoeuvre lès Nancy, France
2 Mines Paristech, 35 rue Saint Honoré, 77305 Fontainebleau CEDEX, France
Geosciences 2018, 8(5), 185; https://doi.org/10.3390/geosciences8050185 - 18 May 2018
Cited by 8 | Viewed by 3592
Abstract
In the framework of CO2 geological storage, one of the critical points leading to possible important CO2 leakage is the behaviour of the different interfaces between the rocks and the injection wells. This paper discussed the results from an experimental modelling [...] Read more.
In the framework of CO2 geological storage, one of the critical points leading to possible important CO2 leakage is the behaviour of the different interfaces between the rocks and the injection wells. This paper discussed the results from an experimental modelling of the evolution of a caprock/cement interface under high pressure and temperature conditions. Batch experiments were performed with a caprock (Callovo-Oxfordian claystone of the Paris Basin) in contact with a cement (Portland class G) in the presence of supercritical CO2 under dry or wet conditions. The mineralogical and mechanical evolution of the caprock, the Portland cement, and their interface submitted to the attack of carbonic acid either supercritical or dissolved in a saline water under geological conditions of pressure and temperature. This model should help to better understand the behaviour of interfaces in the proximal zone at the injection site and to prevent risks of leakage from this critical part of injection wells. After one month of ageing at 80 °C under 100 bar of CO2 pressure, the caprock, the cement, and the interface between the caprock and cement are investigated with Scanning Electron Microscopy (SEM) and cathodoluminescence (CL). The main results reveal (i) the influence of the alteration conditions: with dry CO2, the carbonation of the cement is more extended than under wet conditions; (ii) successive phases of carbonate precipitation (calcite and aragonite) responsible for the loss of mechanical cohesion of the interfaces; (iii) the mineralogical and chemical evolution of the cement which undergoes successive phases of carbonation and leaching; (iv) the limited reactivity of the clayey caprock despite the acidic attack of CO2; and (v) the influence of water on the transport mechanisms of dissolved species and thus on the location of mineral precipitations. Full article
(This article belongs to the Special Issue Geological Storage of Gases as a Tool for Energy Transition)
Show Figures

Figure 1

23 pages, 4367 KiB  
Article
Fatalities Caused by Hydrometeorological Disasters in Texas
by Srikanto H. Paul *, Hatim O. Sharif and Abigail M. Crawford
Department of Civil and Environmental Engineering, University of Texas at San Antonio, San Antonio, TX 78249, USA
Geosciences 2018, 8(5), 186; https://doi.org/10.3390/geosciences8050186 - 18 May 2018
Cited by 25 | Viewed by 12318
Abstract
Texas ranks first in the U.S in number of fatalities due to natural disasters. Based on data culled from the National Oceanic and Atmospheric Administration (NOAA) from 1959 to 2016, the number of hydrometeorological fatalities in Texas have increased over the 58-year study [...] Read more.
Texas ranks first in the U.S in number of fatalities due to natural disasters. Based on data culled from the National Oceanic and Atmospheric Administration (NOAA) from 1959 to 2016, the number of hydrometeorological fatalities in Texas have increased over the 58-year study period, but the per capita fatalities have significantly decreased. Spatial review found that non-coastal flooding is the predominant hydrometeorological disaster in a majority of the Texas counties located in “Flash Flood Alley” and accounts for 43% of all hydrometeorological fatalities in the state. Flooding fatalities occur most frequently on “Transportation Routes” followed by heat fatalities in “Permanent Residences”. Seasonal and monthly stratification identifies Spring and Summer as the deadliest seasons, with the month of May registering the highest number of total fatalities dominated by flooding and tornado fatalities. Demographic trends of hydrometeorological disaster fatalities indicated that approximately twice as many male fatalities occurred from 1959-2016 than female fatalities, but with decreasing gender disparity over time. Adults are the highest fatality risk group overall, children are most at risk to die in flooding, and the elderly at greatest risk of heat-related death. Full article
(This article belongs to the Special Issue Hydrological Hazard: Analysis and Prevention)
Show Figures

Figure 1

17 pages, 3010 KiB  
Article
Selected Metal Content and Binding Behaviour in Riverbed Sediments of the Kavala–Philippi Area (Northern Greece)
by Katerina Giouri 1,*, Vasilios Melfos 1, Lamprini Papadopoulou 1, Michael Vavelidis 1 and Dimitrios Alifragkis 2
1 Department of Mineralogy-Petrology-Economic Geology, School of Geology, Aristotle University of Thessaloniki, 54124 Thessaloniki, Greece
2 Laboratory of Forest Soil Science, School of Forestry and Natural Environment, Aristotle University of Thessaloniki, 54124 Thessaloniki, Greece
Geosciences 2018, 8(5), 187; https://doi.org/10.3390/geosciences8050187 - 19 May 2018
Cited by 1 | Viewed by 3964
Abstract
The broader Philippi area (NE Macedonia, Northern Greece), which was chosen for the present study, is characterized by the presence of various metals. An approach to the correlation of selected parameters (grain-size distribution, Al2O3, CaO, Fe2O3 [...] Read more.
The broader Philippi area (NE Macedonia, Northern Greece), which was chosen for the present study, is characterized by the presence of various metals. An approach to the correlation of selected parameters (grain-size distribution, Al2O3, CaO, Fe2O3, MnO, SiO2 content, environmentally available concentrations of Cu and Zn) was carried out in samples collected downstream of Palea Kavala River and Kryoneri and Philippi streams. The abundance of Cu, Fe, Mn, and Zn in relation to four binding fractions (exchangeable, bound to carbonates, Fe–Mn oxides, organic matter complexes) was also investigated. The enrichment of the studied metals was determined by evaluating the enrichment factor (EF) and geo-accumulation index (Igeo). Considering the results, Si was the most abundant major element oxide in sediments, followed by Al, Ca, Fe, and Mn. The sediments are dominated by sand and reveal minor Cu and Fe enrichment and moderate Mn and Zn enrichment. Statistical analyses revealed a significant correlation between Cu, Fe, Mn, and Zn, suggesting their common sources. They probably originate naturally, since the weathering of metal assemblages occurring in the broader Philippi area, comprising minerals such as chalcopyrite, pyrite, goethite, pyrolusite and sphalerite, may contribute to the concentrations of these elements in the sediments. Full article
Show Figures

Figure 1

19 pages, 2531 KiB  
Article
Georeferenced Agricultural Data for Statistical Reuse
by Katalin Tóth
European Commission, Joint Research Centre, Directorate for Sustainable Resources, Food Security Unit—D5, CAPLAND Group, TP266, via E. Fermi 2749, I-21027 ISPRA, VA, Italy
Geosciences 2018, 8(5), 188; https://doi.org/10.3390/geosciences8050188 - 20 May 2018
Cited by 2 | Viewed by 4934
Abstract
The guidelines to the Public Sector Information (PSI) Directive states: “opening up public sector information (PSI) for reuse brings major socioeconomic benefits”, which has been recognised in various domains. However, the reuse may be limited due to organisational and technical reasons. This study [...] Read more.
The guidelines to the Public Sector Information (PSI) Directive states: “opening up public sector information (PSI) for reuse brings major socioeconomic benefits”, which has been recognised in various domains. However, the reuse may be limited due to organisational and technical reasons. This study addresses the collaboration between the statistical and the agricultural domain using the example of the Integrated Administration and Control System (IACS) and the Integrated Farm Statistics (IFS). After the comparison of the spatial data requirements in IACS and IFS, a conceptual collaboration model was developed that makes clear how the challenges of interoperability can be resolved by technical arrangements and work organisation. Full article
(This article belongs to the Special Issue Geodata Management)
Show Figures

Figure 1

Review

Jump to: Editorial, Research

19 pages, 913 KiB  
Review
Transport of Mineral Dust and Its Impact on Climate
by Kerstin Schepanski
Leibniz Institute for Tropospheric Research (TROPOS), Permoser Str. 15, 04318 Leipzig, Germany
Geosciences 2018, 8(5), 151; https://doi.org/10.3390/geosciences8050151 - 26 Apr 2018
Cited by 157 | Viewed by 14752
Abstract
Mineral dust plays a pivotal role in the Earth’s system. Dust modulates the global energy budget directly via its interactions with radiation and indirectly via its influence on cloud and precipitation formation processes. Dust is a micro-nutrient and fertilizer for ecosystems due to [...] Read more.
Mineral dust plays a pivotal role in the Earth’s system. Dust modulates the global energy budget directly via its interactions with radiation and indirectly via its influence on cloud and precipitation formation processes. Dust is a micro-nutrient and fertilizer for ecosystems due to its mineralogical composition and thus impacts on the global carbon cycle. Hence, dust aerosol is an essential part of weather and climate. Dust suspended in the air is determined by the atmospheric dust cycle: Dust sources and emission processes define the amount of dust entrained into the atmosphere. Atmospheric mixing and circulation carry plumes of dust to remote places. Ultimately, dust particles are removed from the atmosphere by deposition processes such as gravitational settling and rain wash out. During its residence time, dust interacts with and thus modulates the atmosphere resulting into changes such as in surface temperature, wind, clouds, and precipitation rates. There are still uncertainties regarding individual dust interactions and their relevance. Dust modulates key processes that are inevitably influencing the Earth energy budget. Dust transport allows for these interactions and at the same time, the intermittency of dust transport introduces additional fluctuations into a complex and challenging system. Full article
(This article belongs to the Special Issue Aeolian Processes and Geomorphology)
Show Figures

Figure 1

26 pages, 2538 KiB  
Review
Big Data in Natural Disaster Management: A Review
by Manzhu Yu *, Chaowei Yang and Yun Li
NSF Spatiotemporal Innovation Center, George Mason University, 4400 University Drive, Fairfax, VA 22030, USA
Geosciences 2018, 8(5), 165; https://doi.org/10.3390/geosciences8050165 - 5 May 2018
Cited by 291 | Viewed by 51177
Abstract
Undoubtedly, the age of big data has opened new options for natural disaster management, primarily because of the varied possibilities it provides in visualizing, analyzing, and predicting natural disasters. From this perspective, big data has radically changed the ways through which human societies [...] Read more.
Undoubtedly, the age of big data has opened new options for natural disaster management, primarily because of the varied possibilities it provides in visualizing, analyzing, and predicting natural disasters. From this perspective, big data has radically changed the ways through which human societies adopt natural disaster management strategies to reduce human suffering and economic losses. In a world that is now heavily dependent on information technology, the prime objective of computer experts and policy makers is to make the best of big data by sourcing information from varied formats and storing it in ways that it can be effectively used during different stages of natural disaster management. This paper aimed at making a systematic review of the literature in analyzing the role of big data in natural disaster management and highlighting the present status of the technology in providing meaningful and effective solutions in natural disaster management. The paper has presented the findings of several researchers on varied scientific and technological perspectives that have a bearing on the efficacy of big data in facilitating natural disaster management. In this context, this paper reviews the major big data sources, the associated achievements in different disaster management phases, and emerging technological topics associated with leveraging this new ecosystem of Big Data to monitor and detect natural hazards, mitigate their effects, assist in relief efforts, and contribute to the recovery and reconstruction processes. Full article
Show Figures

Figure 1

25 pages, 8300 KiB  
Review
Variability of Shelf Growth Patterns along the Iberian Mediterranean Margin: Sediment Supply and Tectonic Influences
by Ruth Durán 1,*, Francisco José Lobo 2, Marta Ribó 3, Marga García 2 and Luis Somoza 4
1 Instituto de Ciencias del Mar, CSIC, Passeig Marítim de la Barceloneta, 37-49, 08003 Barcelona, Spain
2 Instituto Andaluz de Ciencias de la Tierra, CSIC-Universidad de Granada, Avenida de las Palmeras n° 4, 18100 Armilla, Spain
3 Department of Environmental Sciences, Macquarie University, 2109 Sydney, Australia
4 Marine Geology Division, Geological Survey of Spain (IGME), Ríos Rosas 23, 28003 Madrid, Spain
Geosciences 2018, 8(5), 168; https://doi.org/10.3390/geosciences8050168 - 7 May 2018
Cited by 8 | Viewed by 7214
Abstract
Clinoform depositional features along the Iberian Mediterranean margin are investigated in this study, with the aim of establishing the causes of their varied shapes and other characteristics. We have analyzed the broad-scale margin physiography and seismic stratigraphic patterns based on high-resolution bathymetric data [...] Read more.
Clinoform depositional features along the Iberian Mediterranean margin are investigated in this study, with the aim of establishing the causes of their varied shapes and other characteristics. We have analyzed the broad-scale margin physiography and seismic stratigraphic patterns based on high-resolution bathymetric data and previously interpreted seismic data. In addition, we have evaluated regional supply conditions and the uplift-subsidence regime of the different shelf sectors. The upper Quaternary record is strongly dominated by shelf-margin regressive wedges affected by the prevailing 100 ka cyclicity. However, the margins exhibit considerable lateral variability, as the result of the balance between the amount of sediment supply and the uplift-subsidence relationship. Three major shelf sectors with distinct morpho-sedimentary features have been defined. The relatively narrow northern shelves (Roses, La Planassa and Barcelona) are supplied by discrete river outlets that collectively constitute a linear source and are mainly affected by tectonic tilting. The wide middle shelves (Ebro Shelf, the Gulf of Valencia, and the Northern Arc) receive the sediment supply from the large Ebro River and other medium rivers. Although the tectonic regime changes laterally (strong subsidence in the north and uplift in the south), shelf growth is maintained by lateral advection of sediments. The southern shelves (the Southern Arc and the northern Alboran Shelf) are very abrupt and narrow because of the uplifting Betic Cordillera, and the torrential fluvial regimes that determine a very efficient sediment by-pass toward the deep basin. Submarine canyons deeply incised in the continental margin constitute a key physiographic feature that may enhance the transport of sediment to the deep sea or individualize shelf sectors with specific sedimentation patterns, as occurs in the Catalan margin. Full article
Show Figures

Figure 1

34 pages, 7659 KiB  
Review
Role of Aeolian Dust in Shaping Landscapes and Soils of Arid and Semi-Arid South Africa
by Joseph R. McAuliffe *, Leslie D. McFadden and M. Timm Hoffman
Desert Botanical Garden, Department of Research, Conservation and Collections, Phoenix, AZ 85008, USA 2 Department of Earth and Planetary Sciences, University of New Mexico, Albuquerque, NM 87131, USA
Geosciences 2018, 8(5), 171; https://doi.org/10.3390/geosciences8050171 - 10 May 2018
Cited by 20 | Viewed by 8985
Abstract
The deposition of fine aeolian sediment profoundly influences the morphology of several different landscapes of the arid and semi-arid western portion of South Africa. Such landscapes and features include: (1) regularly-spaced mounds known as heuweltjies of the succulent Karoo region, (2) barren stone [...] Read more.
The deposition of fine aeolian sediment profoundly influences the morphology of several different landscapes of the arid and semi-arid western portion of South Africa. Such landscapes and features include: (1) regularly-spaced mounds known as heuweltjies of the succulent Karoo region, (2) barren stone pavements in the more arid regions, and (3) hillslopes with smooth, curvilinear slope profiles that are mantled with coarse, stony colluvium. Investigations of each of these are presented, together with comparisons of similar features found within arid and semi-arid portions of Western North America. Recent findings suggest that the formation of the distinct, regularly-spaced heuweltjies involves a linked set of biological and physical processes. These include nutrient accumulation by termites and the production of dense vegetation patches, which, in turn, serve as a trap for aeolian sediments. Dust deposition is also responsible for the formation of stone pavements as demonstrated by research conducted principally in the Mojave Desert region of the United States. Mineralogical and geochronological studies have demonstrated that the stone clasts remain on the surface as fine aeolian sediments are translocated downward beneath the clasts resulting in a silt-rich soil horizon directly beneath the clasts. Pavements examined in South Africa have the same morphological features that can only be explained by the same process. The formation of soils on hillslopes mantled with stony colluvium are commonly viewed as having formed through the in-situ weathering of the stony colluvium. However, like pavements, mantles of coarse, stony colluvium are effective dust traps that provide the long-term stability required for advanced development of thick, fine-grained soils. This process contributes to the evolution of smooth, vegetated, curvilinear slope profiles. In each of these examples, the accumulation of dust has a profound influence, not only in soil formation, but also on the development of dominant landform characteristics. A greater awareness of these processes will contribute considerably to the growth of knowledge about soils and landscape development in the drylands of South Africa. Full article
(This article belongs to the Special Issue Aeolian Processes and Geomorphology)
Show Figures

Figure 1

Previous Issue
Next Issue
Back to TopTop