Article

Mass Balance of Cenozoic Andes-Amazon Source to Sink System—Marañón Basin, Peru

by
Gérôme Calvès
1,*,
Ysabel Calderón
2,
Christian Hurtado Enriquez
3,
Stéphane Brusset
1,
William Santini
1,4 and
Patrice Baby
1,4
1
Géosciences Environnement Toulouse-Observatoire Midi-Pyrénées (GET/OMP), Université Toulouse 3, Paul Sabatier, 14 Avenue Edouard Belin, 31400 Toulouse, France
2
PERUPETRO S.A., Av. Luis Aldana 380, San Borja, Lima 15000, Peru
3
Institute of Geosciences, University of Brasília, Brasília CEP 70.910-900, Brazil
4
Institut de recherche pour le développement (IRD), 13572 Marseille, France
*
Author to whom correspondence should be addressed.
Geosciences 2018, 8(5), 167; https://doi.org/10.3390/geosciences8050167
Submission received: 4 April 2018 / Revised: 27 April 2018 / Accepted: 1 May 2018 / Published: 7 May 2018
(This article belongs to the Special Issue Tectonics and Morphodynamics)

Abstract

:
We investigate the mass balance of the Cenozoic Andes-Amazon source to sink system using rock uplift proxies and solid sedimentation of the Marañón Basin in Peru. The evolution of sedimentation rates is calibrated with regional structural restored cross-section. The quantification of eroded sediments from reliefs to sedimentary basin is achieved with ×10 Myr resolution and compared to present day proxies from the HYBAM (HYdrologie et Biogéochimie du Bassin Amazonien) Critical Zone Observatory. Erosion of the early Andean landforms started during the Upper Mesozoic period, but sediment rates significantly increase during the Neogene. This is in agreement with the calibrated increase of rock uplift in the Andean orogenic belt.

1. Introduction

Quantification of sedimentary basin is one of the numerous steps to understand the interaction and resulting product of the solid earth with the external envelopes of the Earth (Sediment Routing Systems; e.g., [1]). Foreland basins represent one of the repositories of the mountain building history and its evolution [2]. Vertical movements and horizontal shortening of the sedimentary wedge [3] are the main topics of interest of foreland basin studies, whereas the movements of mass and flux associated with sedimentary signal represent of least studied aspects of these geological structures [4]. Due to the focus of interest on the uplifted structures at the transition between the main relief and sedimentary basin, efforts have been made towards the qualification and quantification of erosion in the hinterland (e.g., [2,5]). The depositional record of the foreland sedimentation and erosion in a growing mountain range is associated with unconformities that make the deconvolution of geological processes difficult to establish [6].
The northern Central Andes of Peru are characterized by the absence of Altiplano, the flat slab subduction of the Nazca oceanic plate [7,8,9] and an extensive deformation of the eastern Andean orogenic wedge with an amount of shortening greater than 140 km [10]. As a result, this region shows the easternmost propagation of the Subandean orogenic front [11] and record the foreland basin system [12] related to the rise of the Andean orogenic wedge and its erosion.
Total suspended sediment yield exported from the current Andean orogenic wedge to the Amazon retro-foreland basin has been estimated by the HYBAM (HYdrologie et Biogéochimie du Bassin Amazonien) international network (http://www.ore-hybam.org/) at different latitudes (Figure 1A) [13,14,15,16].
In northern Bolivia and Brazil, the foreland basin system is wide and approximately 30–50% of the exported mass of sediments is deposited in the foredeep depozone [13,16]. The average production for the entire foreland basin catchment is estimated at 640 Mt·year−1 (±30%) by the latest measures of Vauchel et al. [16]. In contrast, in the Amazonian Oriente foreland basin of Ecuador (Figure 1B), sediment budget along the Napo River shows an unusual increase in the suspended sediment flux from 12 Mt·year−1 to 42 Mt·year−1 [14]. With a 9 years dataset, Armijos et al. [18,19] further confirmed this increase (8 to 42 Mt·year−1). This phenomenon is associated with active tectonics, uplift and erosion of the entire foreland basin systems. Sediment budget studies in northern Bolivia and Ecuador show, therefore, an extreme latitudinal variability in the Andean-Amazonian foreland basin systems, with subzones experimenting either uplift or subsidence.
South of the uplifted and eroded Oriente basin, the long term sedimentary record of the Marañón Basin is preserved through important sedimentary archives [17] (Figure 1C,D). From the Cretaceous to the Eocene period (Figure 1C) the Marañón Basin shows a depocenter located between the present day eastern slope of the Andes and the cratonic domains to the east. The Eocene to recent isopach map illustrates the change of dynamics of the sedimentation, with an important amount of sediments (>3000 m) focused in the foredeep depozone (Figure 1D). The sedimentation extends further out of the study area, as expressed by the evolution of the Amazonian Basin and its transcontinentalization since the Miocene [20].
Despite important work on present day/recent flux of sediments from the Andes to the Amazonian Basin, limited studies have been capturing the geological time scale sedimentation rates related to the growth and erosion of the Andes [21,22]. Within the Central Andean foreland during the Miocene period to recent times [21], the sedimentation rate has significantly increased ~7.9–6 Ma (Figure 2).
This increase is associated with coarse sediments of a fluvial megafan deposited under climate change and monsoon-like intensification. On the western side of the Andes, the sedimentation rate in the preserved record of the Lima Basin [22] show a longer sequence with cyclic variations of sedimentation and erosion (Figure 2). Three peaks are recorded at ~23 Ma, ~12 Ma and at the initiation of the Pliocene. Enhanced erosion in the Oligocene is documented in the Lima Basin but no documentation of this has been published in the foreland Amazonian foreland domain. We aim to fill this gap by our work.
In northern Peru, the latitudinal variability in the Andean-Amazonian foreland basin systems is well illustrated by the Marañón foreland systems architecture [12], which passes from a wedge-top depozone in the south to a foredeep depozone in the north (Figure 3). The orogenic wedge of the Marañón foreland basin systems is formed by the Eastern Cordillera and the Santiago, Moyabamba and Huallaga Subandean basins, and developed since the late Oligocene [9].
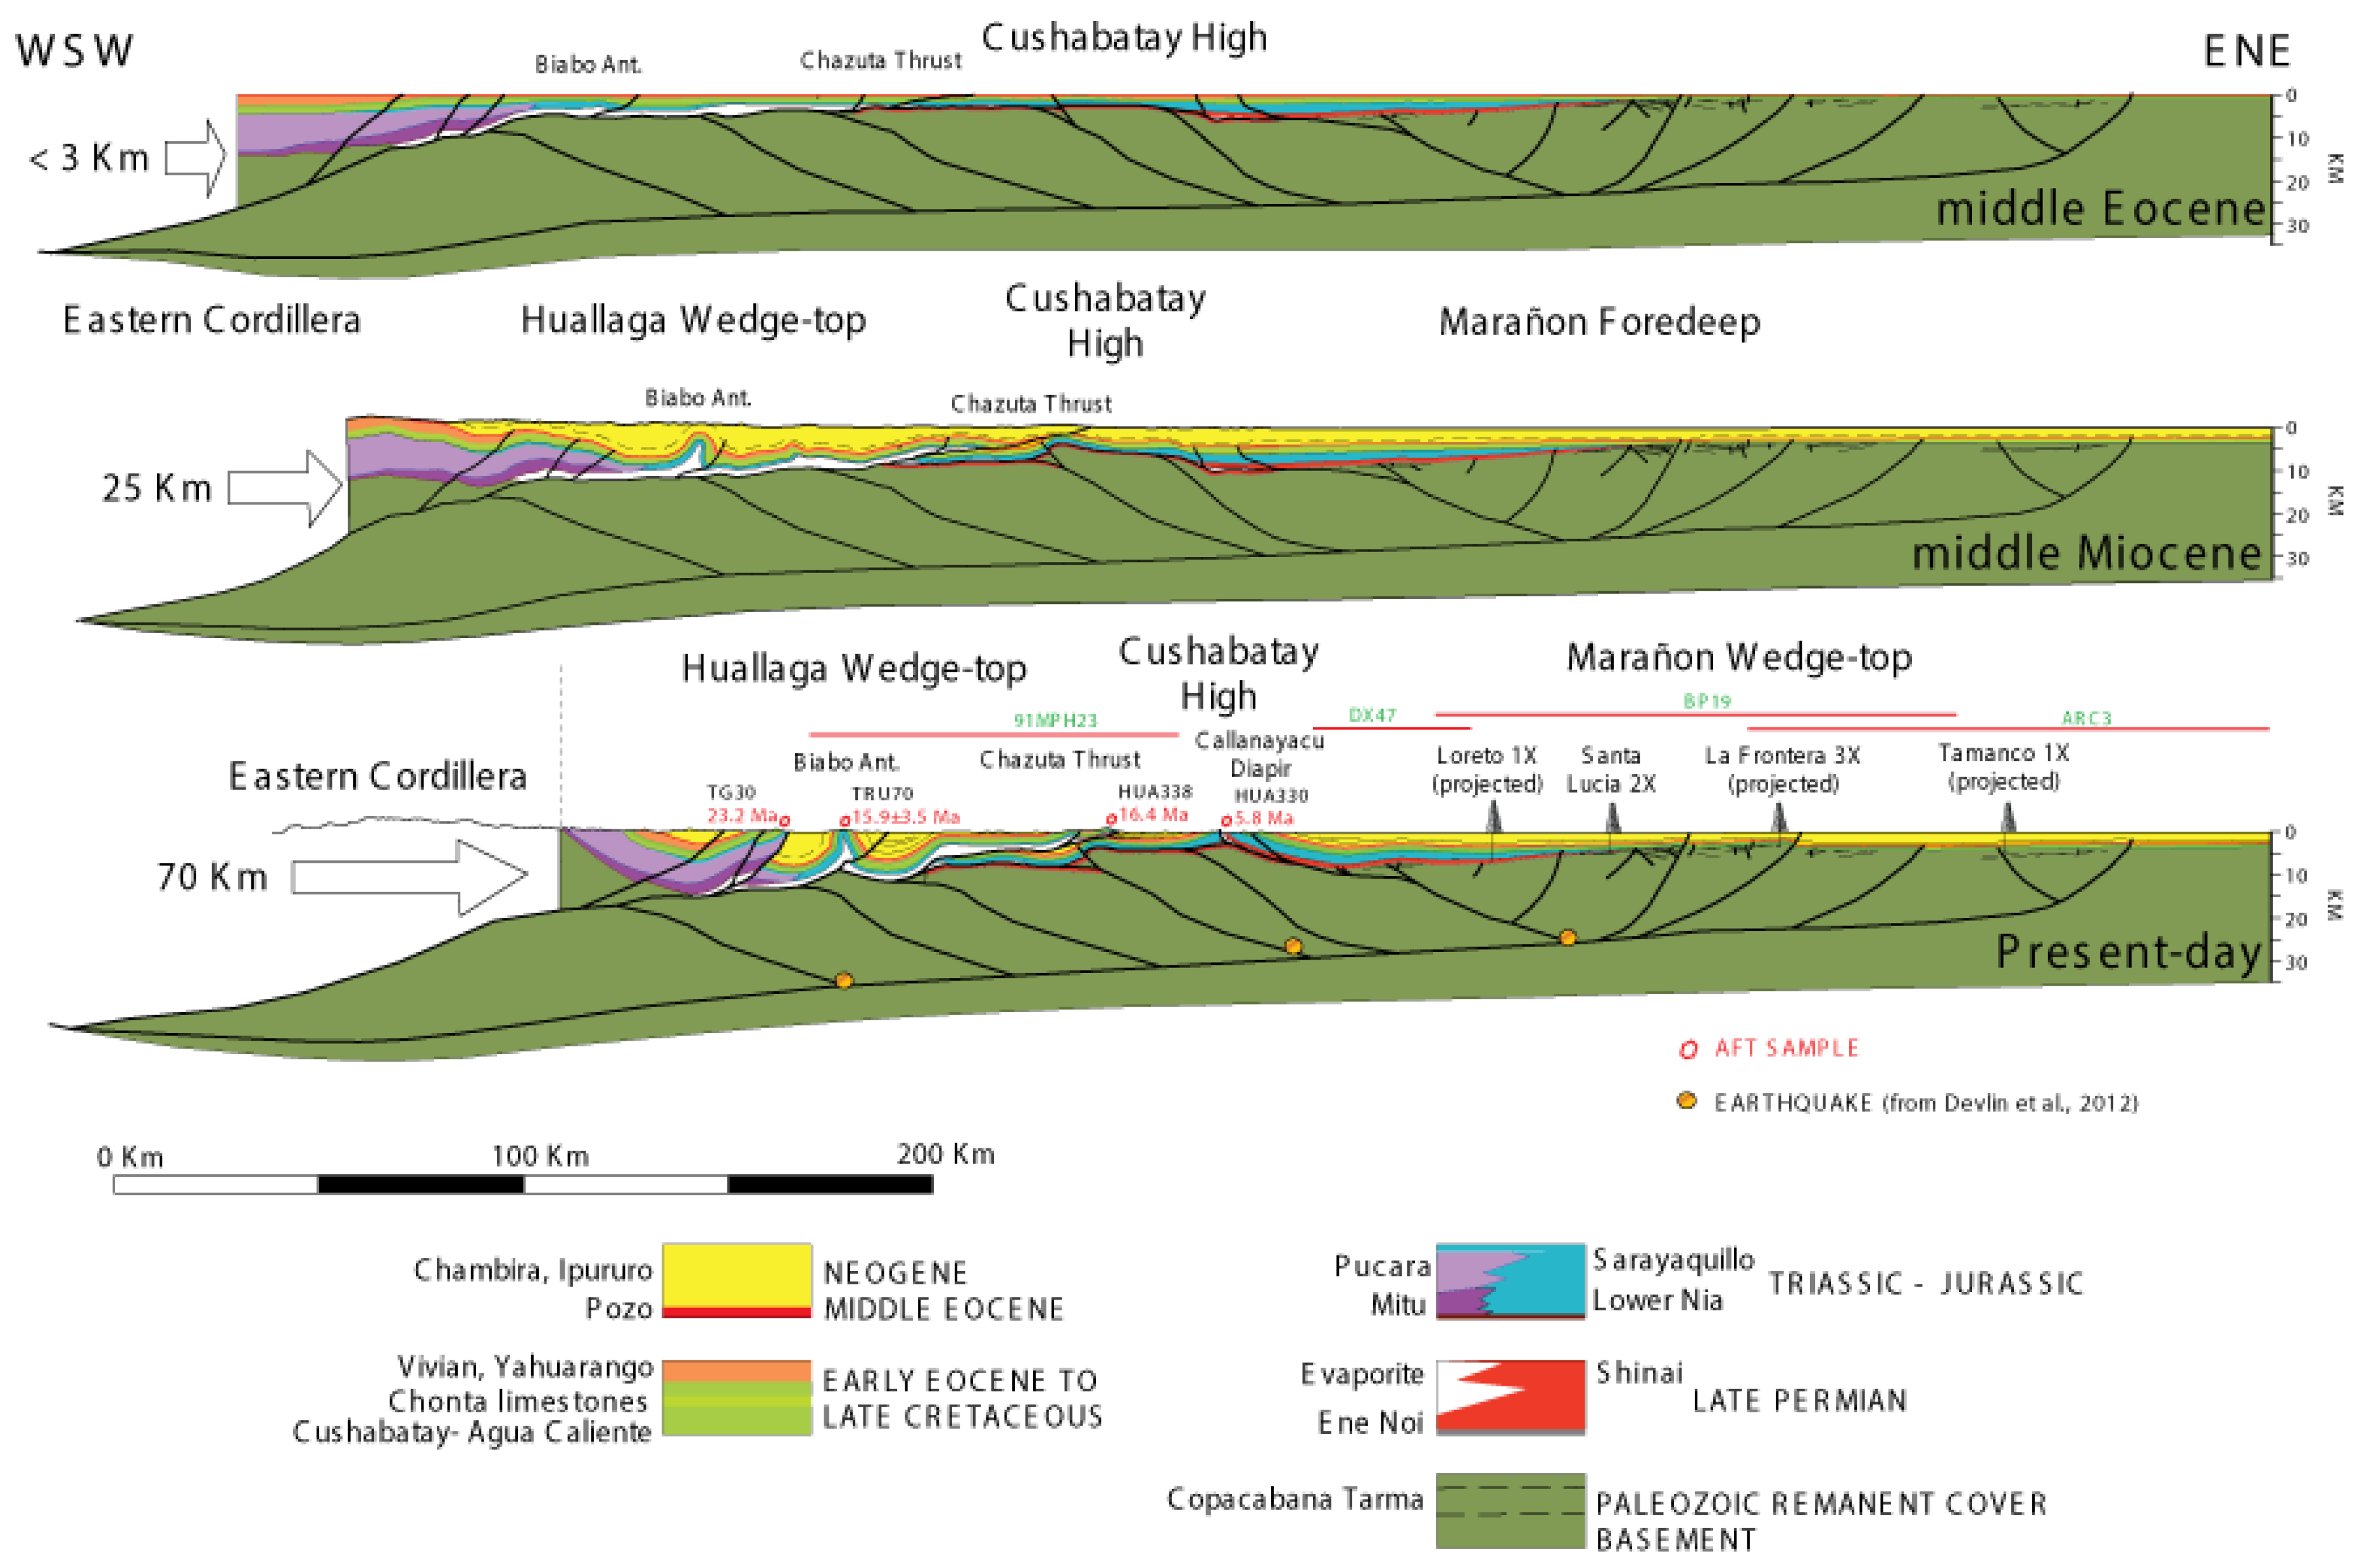
Thrust deformation was controlled by interference of thick-skinned and thin-skinned tectonics related to a regional late Permian salt décollement. In its southern part, the Marañón foreland basin systems is well constrained by surface and sub-surface data, which facilitates constructing a three-step restoration calibrated from thermochronology [8] (Figure 3). The first stage corresponds to the middle Eocene restoration, which corresponds to the end of a period of strong erosion sealing an early Eocene compressive weak deformation. A considerable increase of the deformation has been evidenced since the middle Miocene. The total amount of shortening has been estimated at 70 km in the current stage.
The aim of this study is (1) to obtain a regional knowledge of the Marañón Basin sedimentary infill in terms of foreland basin evolution (sink), (2) constrain the Upper Mesozoic and Cenozoic chronostratigraphic framework to establish this evolution, (3) estimate the sedimentation rates for each long term sequence in the foreland basin system along with the exhumation history (source) to outline the mass balance of this portion of the Andean source to sink system during the Cenozoic.

2. Materials and Methods

Lithology and physical properties have been compiled from 21 exploration boreholes drilled within the Marañón Basin (Figure 1B). Biostratigraphic studies have been used to build the stratigraphic framework over the study area [26,27,28]. We consider in this study the Albian, late Cretaceous and Cenozoic series deposited on the Andean Basal Foreland Unconformity (BFU; Figure 2). Wireline sonic logs have been used to depth convert the seismic framework and to compute the porosity depth profiles [29,30] from 15 wells of the Marañón Basin (Figure 4). Three main lithological classes (clastic, carbonate, organic matter) have been quantified from boreholes drilled across the regional cross-section R1, R3 and R5.
The regional cross section R1, R3 and R5 (Figure 1 and Figure 5) have been built from surface and subsurface data (seismic reflection and wells) (Figure 5).
For each structural cross-section and each foreland basin sequence, areas have been computed and clastic sedimentation rates have been calculated [32], and then applied in 3D in the Marañón Basin. Results of quantification are summarized in Table 1. Detailed aspects of the methods are within Appendix A.
An apatite fission track mean age database from the Andean domain has been compiled to calibrate the exhumation history and discuss the mass balance with the volume of sediments in the Marañón Basin (Figure 2). The compiled data [33,34,35,36,37,38,39,40,41,42,43,44,45,46,47,48] are summarized in a supplementary dataset (Table S1).

3. Results

3.1. Marañón Basin Foreland Sequences

Overall, we define and quantify 4 long term sequences based on biostratigraphy, lithological and provenance change:
  • Foreland sequence 1 (F1, Early Cretaceous (Albian) to late Cretaceous, 110–65 Ma) is the first long term sequence on the Cushabatay Basal Foreland Unconformity (Figure 2); it includes the Cushabatay-Raya, Agua Caliente-Chonta and Vivian-Cachiyacu-Huchpayacu fluvial to shallow marine cyclic transgressive sequences and is capped by the basal regional unconformity of the Paleocene Casa Blanca sandstones; Albian and Maastrichtian sandstones of this first sequence have a cratonic provenance as shown by the presence of Precambrian-inherited zircon grains [49].
  • Foreland sequence 2 (F2: Paleocene-early Eocene, 65–45 Ma) is the second long term sequence and is characterized by a continental environment (Figure 2); it recorded the first siliciclastic supply from the Andean uplift, and yield the first Cretaceous zircon grains [33]; it probably corresponds to the distal foreland deposits of the Marañón fold and thrust belt (presently preserved in the Western Cordillera uplift [23]).
  • Foreland sequence 3 (F3: Middle Eocene-Oligocene, 45–23 Ma) is the third long term sequence, which overlies the Basal Pozo regional erosional unconformity (Figure 2), interpreted as an unloading orogenic period [50]. This stage of the foreland basin systems is represented in the sequential restoration in Figure 3. The detrital zircon grains are sourced from the Cenozoic volcanism and the uplifting of the Western Cordillera [49].
  • Foreland sequence four (F4: Neogene, 23–0 Ma) is the last long term sequence recording an acceleration of the deformation and sedimentation (Figure 3), and is contemporaneous with the uplift of the Eastern Cordillera as confirmed by zircon grains provenance [49]. This period during the Miocene is characterized by lacustrine conditions alternating with episodes of fluvial drainage and marginal marine influence [51,52], and finally by a complex deltaic to fluvial environment. The present-day surface of the basin is marked by an important alluvial/fluvial network that conveys sediment from the Andes to the Amazon River, and finally to the Atlantic Ocean.

3.2. Marañón Basin Foreland Thickness

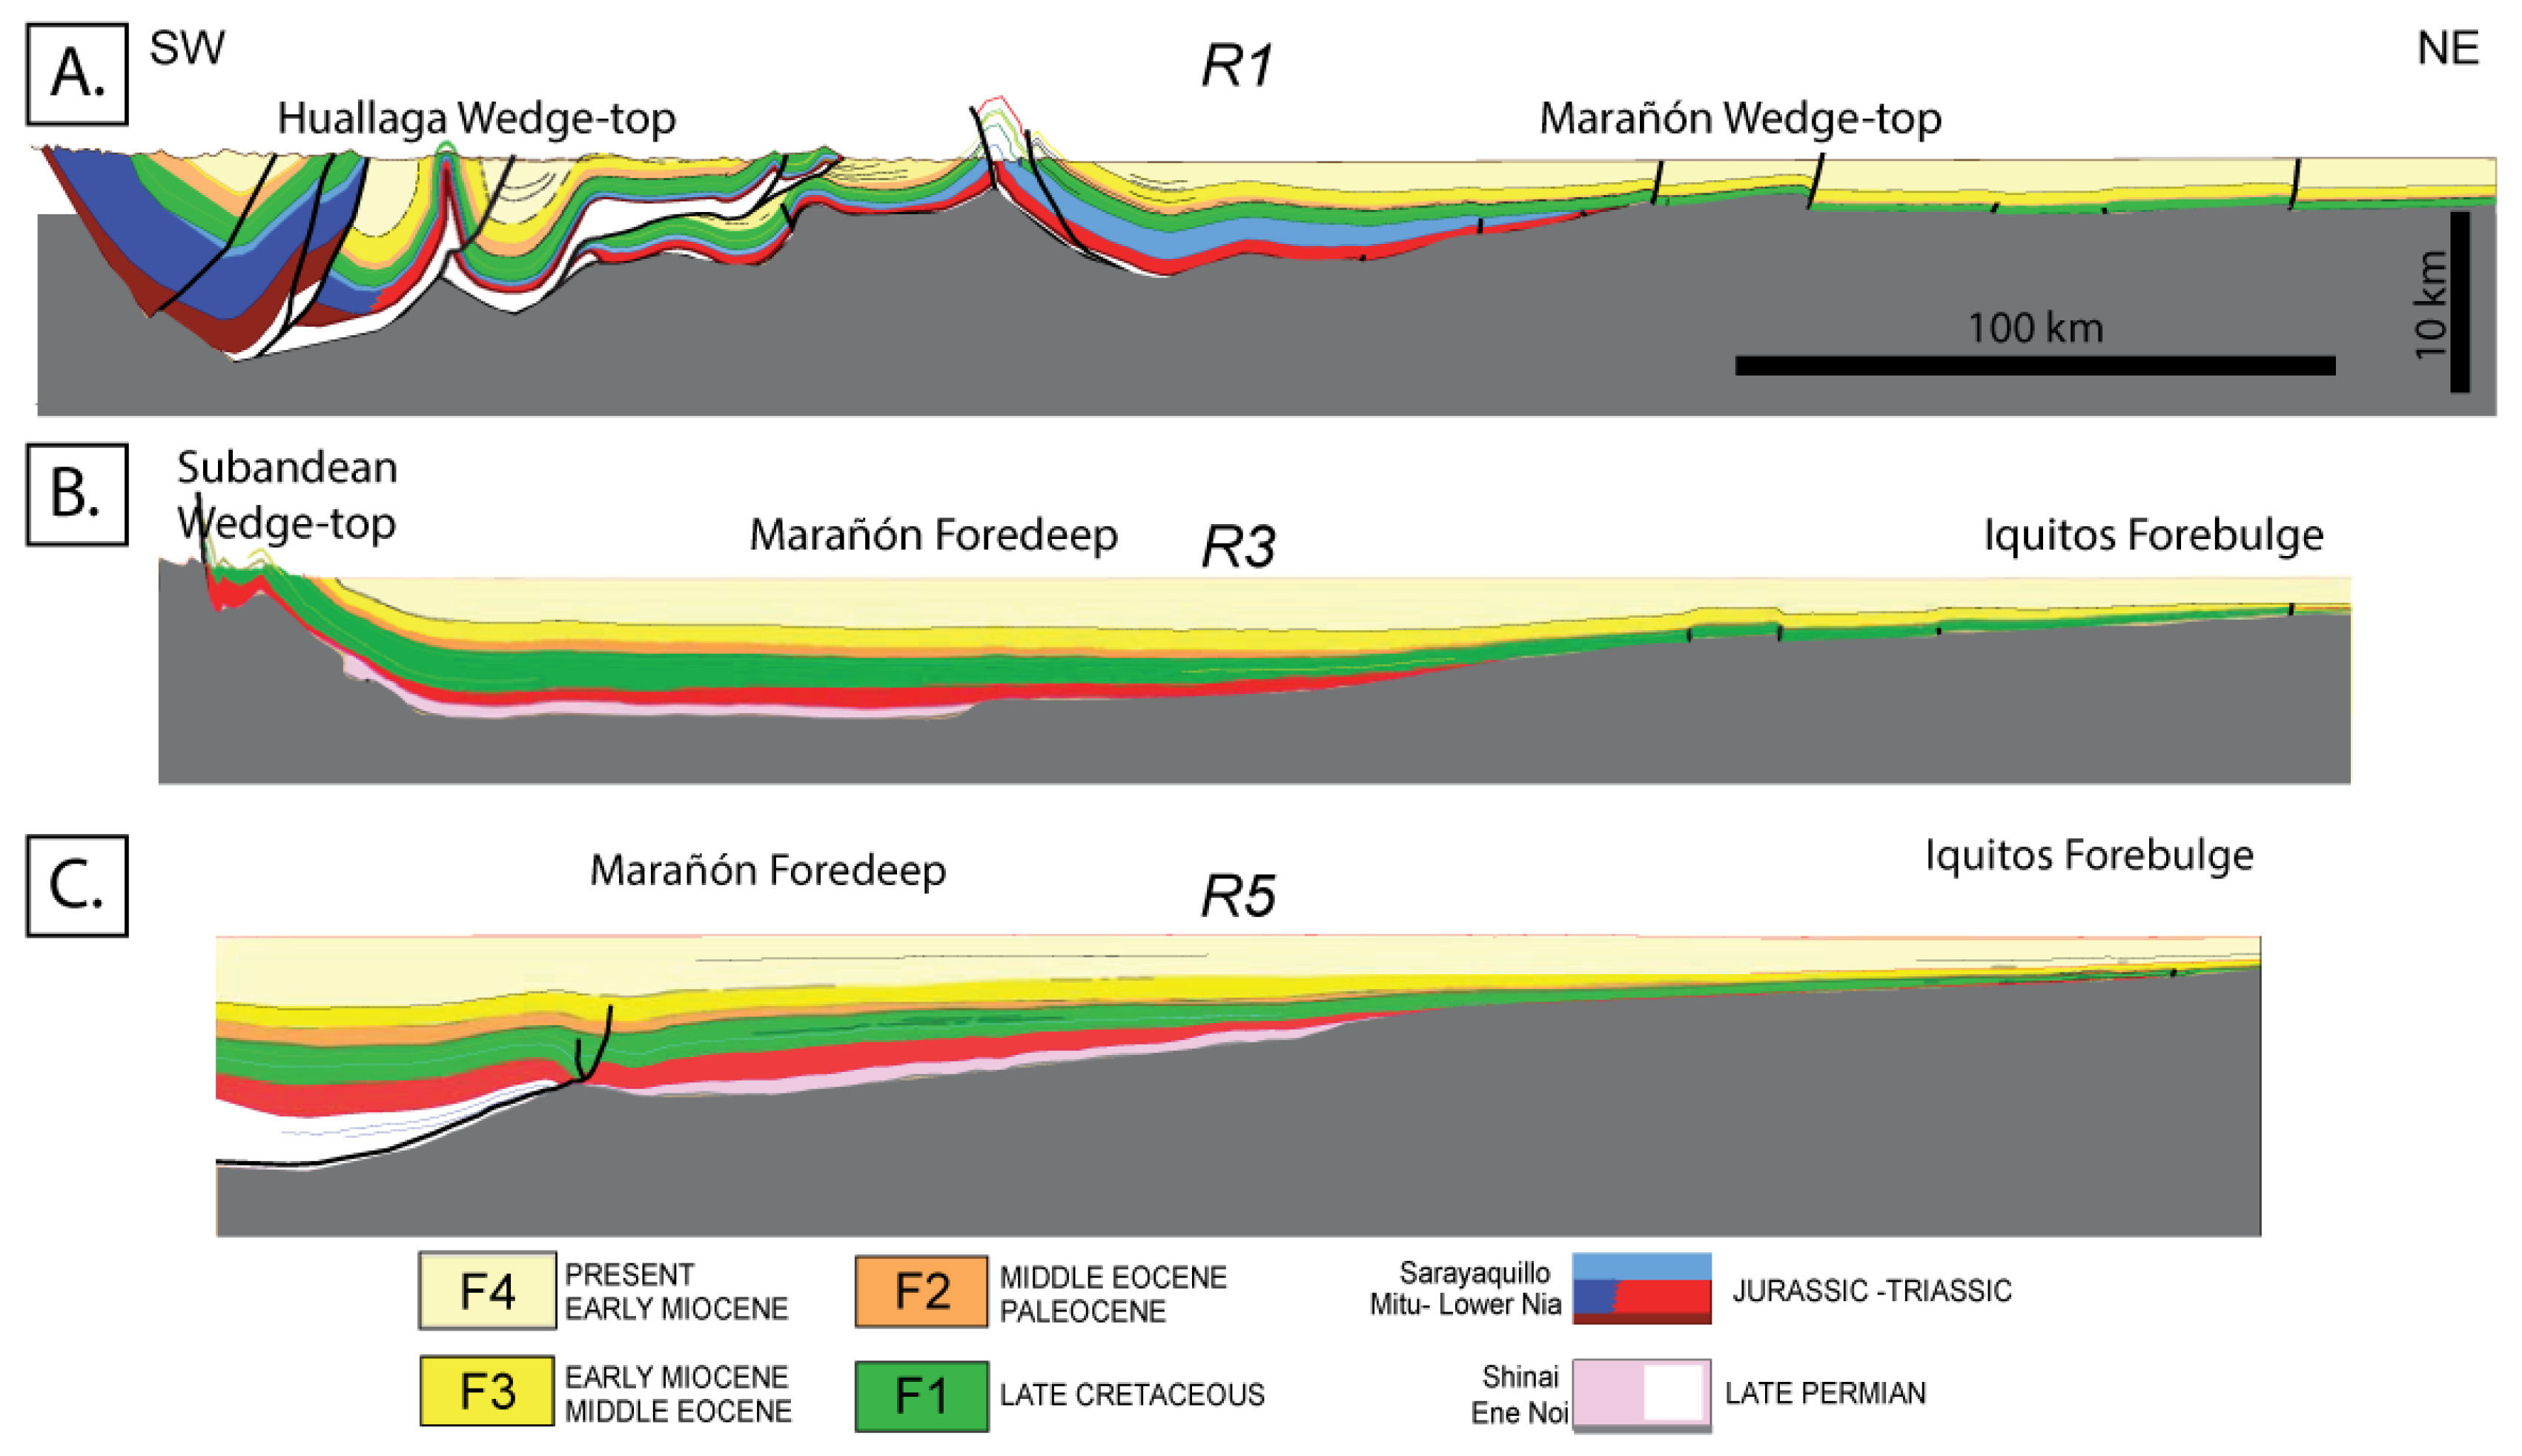
Three structural regional cross-sections (R1, R3 and R5), representative of the latitudinal evolution of the Marañón foreland basin, have been used to compute the 2D sedimentation rates. The four long term sequences have been delineated using the boundaries defined with seismic and wells. The cross-section R1 through the Huallaga-Marañón foreland shows that both basins are subjected to strong erosion. This amount of eroded thickness has been taken into account in our sediment budget. The cross-sections R3 and R5 represent the northern foredeep depozone of the Marañón Basin, where the foreland sequences are practically preserved.
The sediment thickness variation of the Marañón Basin (Figure 5) is illustrated with three SW-NE regional sections (R1, R3, R5). To the north, R1 section cross the Huallaga and Marañón wedge-top domains (Figure 1B, Figure 5A). The thickest deposits associated with sequence F1–F4 are within syncline structures with up to 7.12 km of sediments. Towards the NE, for the sequences F1 to F4, the Marañón Basin records a maximum thickness of 3.84 km of sediments that thins eastward to 2.56 km. Along R3 section (Figure 5B), the sequence F1–F4 is recorded at the front of the subandean wedge-top within the Marañón foredeep with 6.23 km of sediments. It is thinning towards the east with 2.56 km where the thin F1–F2 sequence (<60 m) at the Iquitos forebulge area is overlapped by a thicker F3–F4 sequence. Finally to the south of the study area, the R5 section shows the thickest sedimentary infill with 8.29 km for the sequences F1–F4 (Figure 5C). It thins gradually towards the NE to reach about 1.89 km, of which 1.67 km are associated with the F3–F4 sequences.

3.3. Physical Properties of the Marañón Basin Sediments

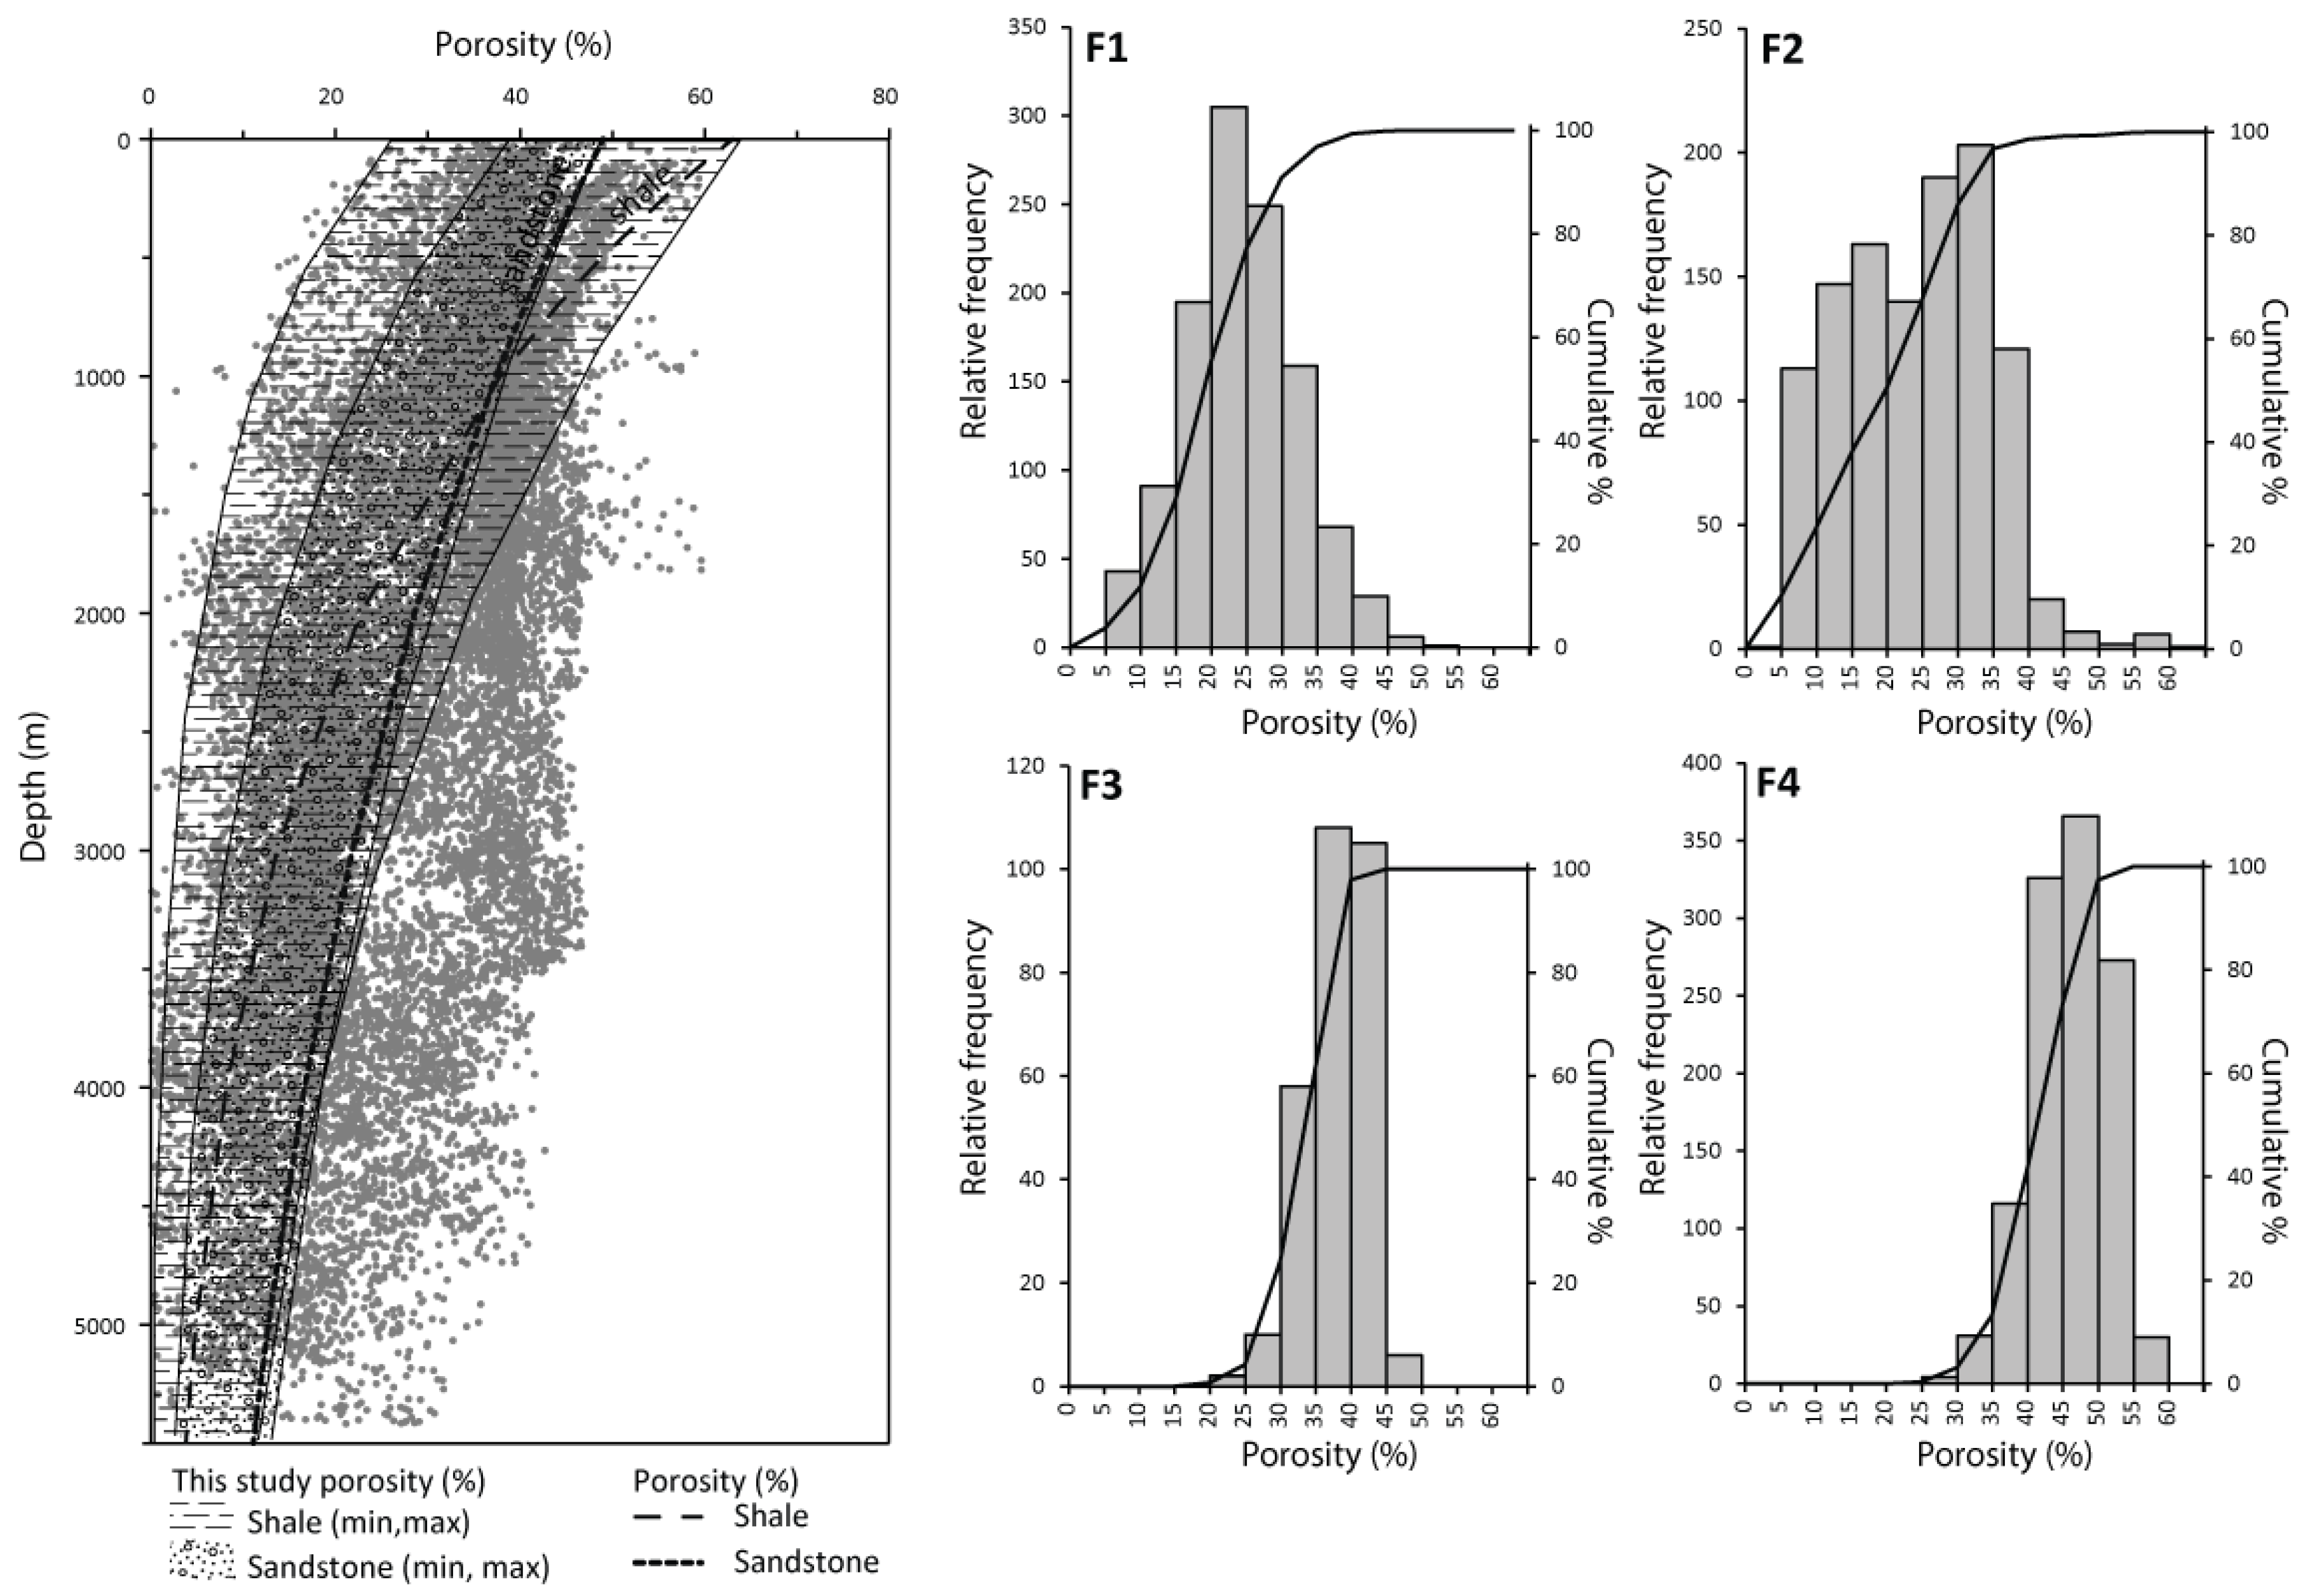
The physical properties and the computed results are summarized in Table 1. Porosity of all lithology decreases with depth with near surface porosity values from 25% to 60% and minimum value at the bottom of the drilled part of the basin ranging from 1 to <30% (Figure 4). The four foreland sequences have been sampled to correct for the porosity when computing the solid sediment estimates. The foreland sequence F1 median porosity is 18.9% (8% standard deviation). This sequence is dominated by clastic sediments with carbonate contribution restricted to the Chonta Formation. The foreland sequence F2 shows a slight increase of median porosity with 20% (10% s.d.). Its main lithology is clastics with a low fraction of organic matter. The foreland sequence F3 median porosity is 33% (4% s.d.) and it has the same lithological content as sequence F2. The foreland sequence F4 median porosity is 41% (5% s.d.) and its lithological content is dominated by clastics with the presence of 10% of carbonates and minor amounts of organic matter.

3.4. Quantification of Sedimentation Rates in the Foreland Basin Systems

The sedimentation rates along the cross-sections R1, R3 and R5 (Figure 5) and the whole Marañón Basin (Table 1) have been computed using the physical properties extracted from the subsurface data exposed above.
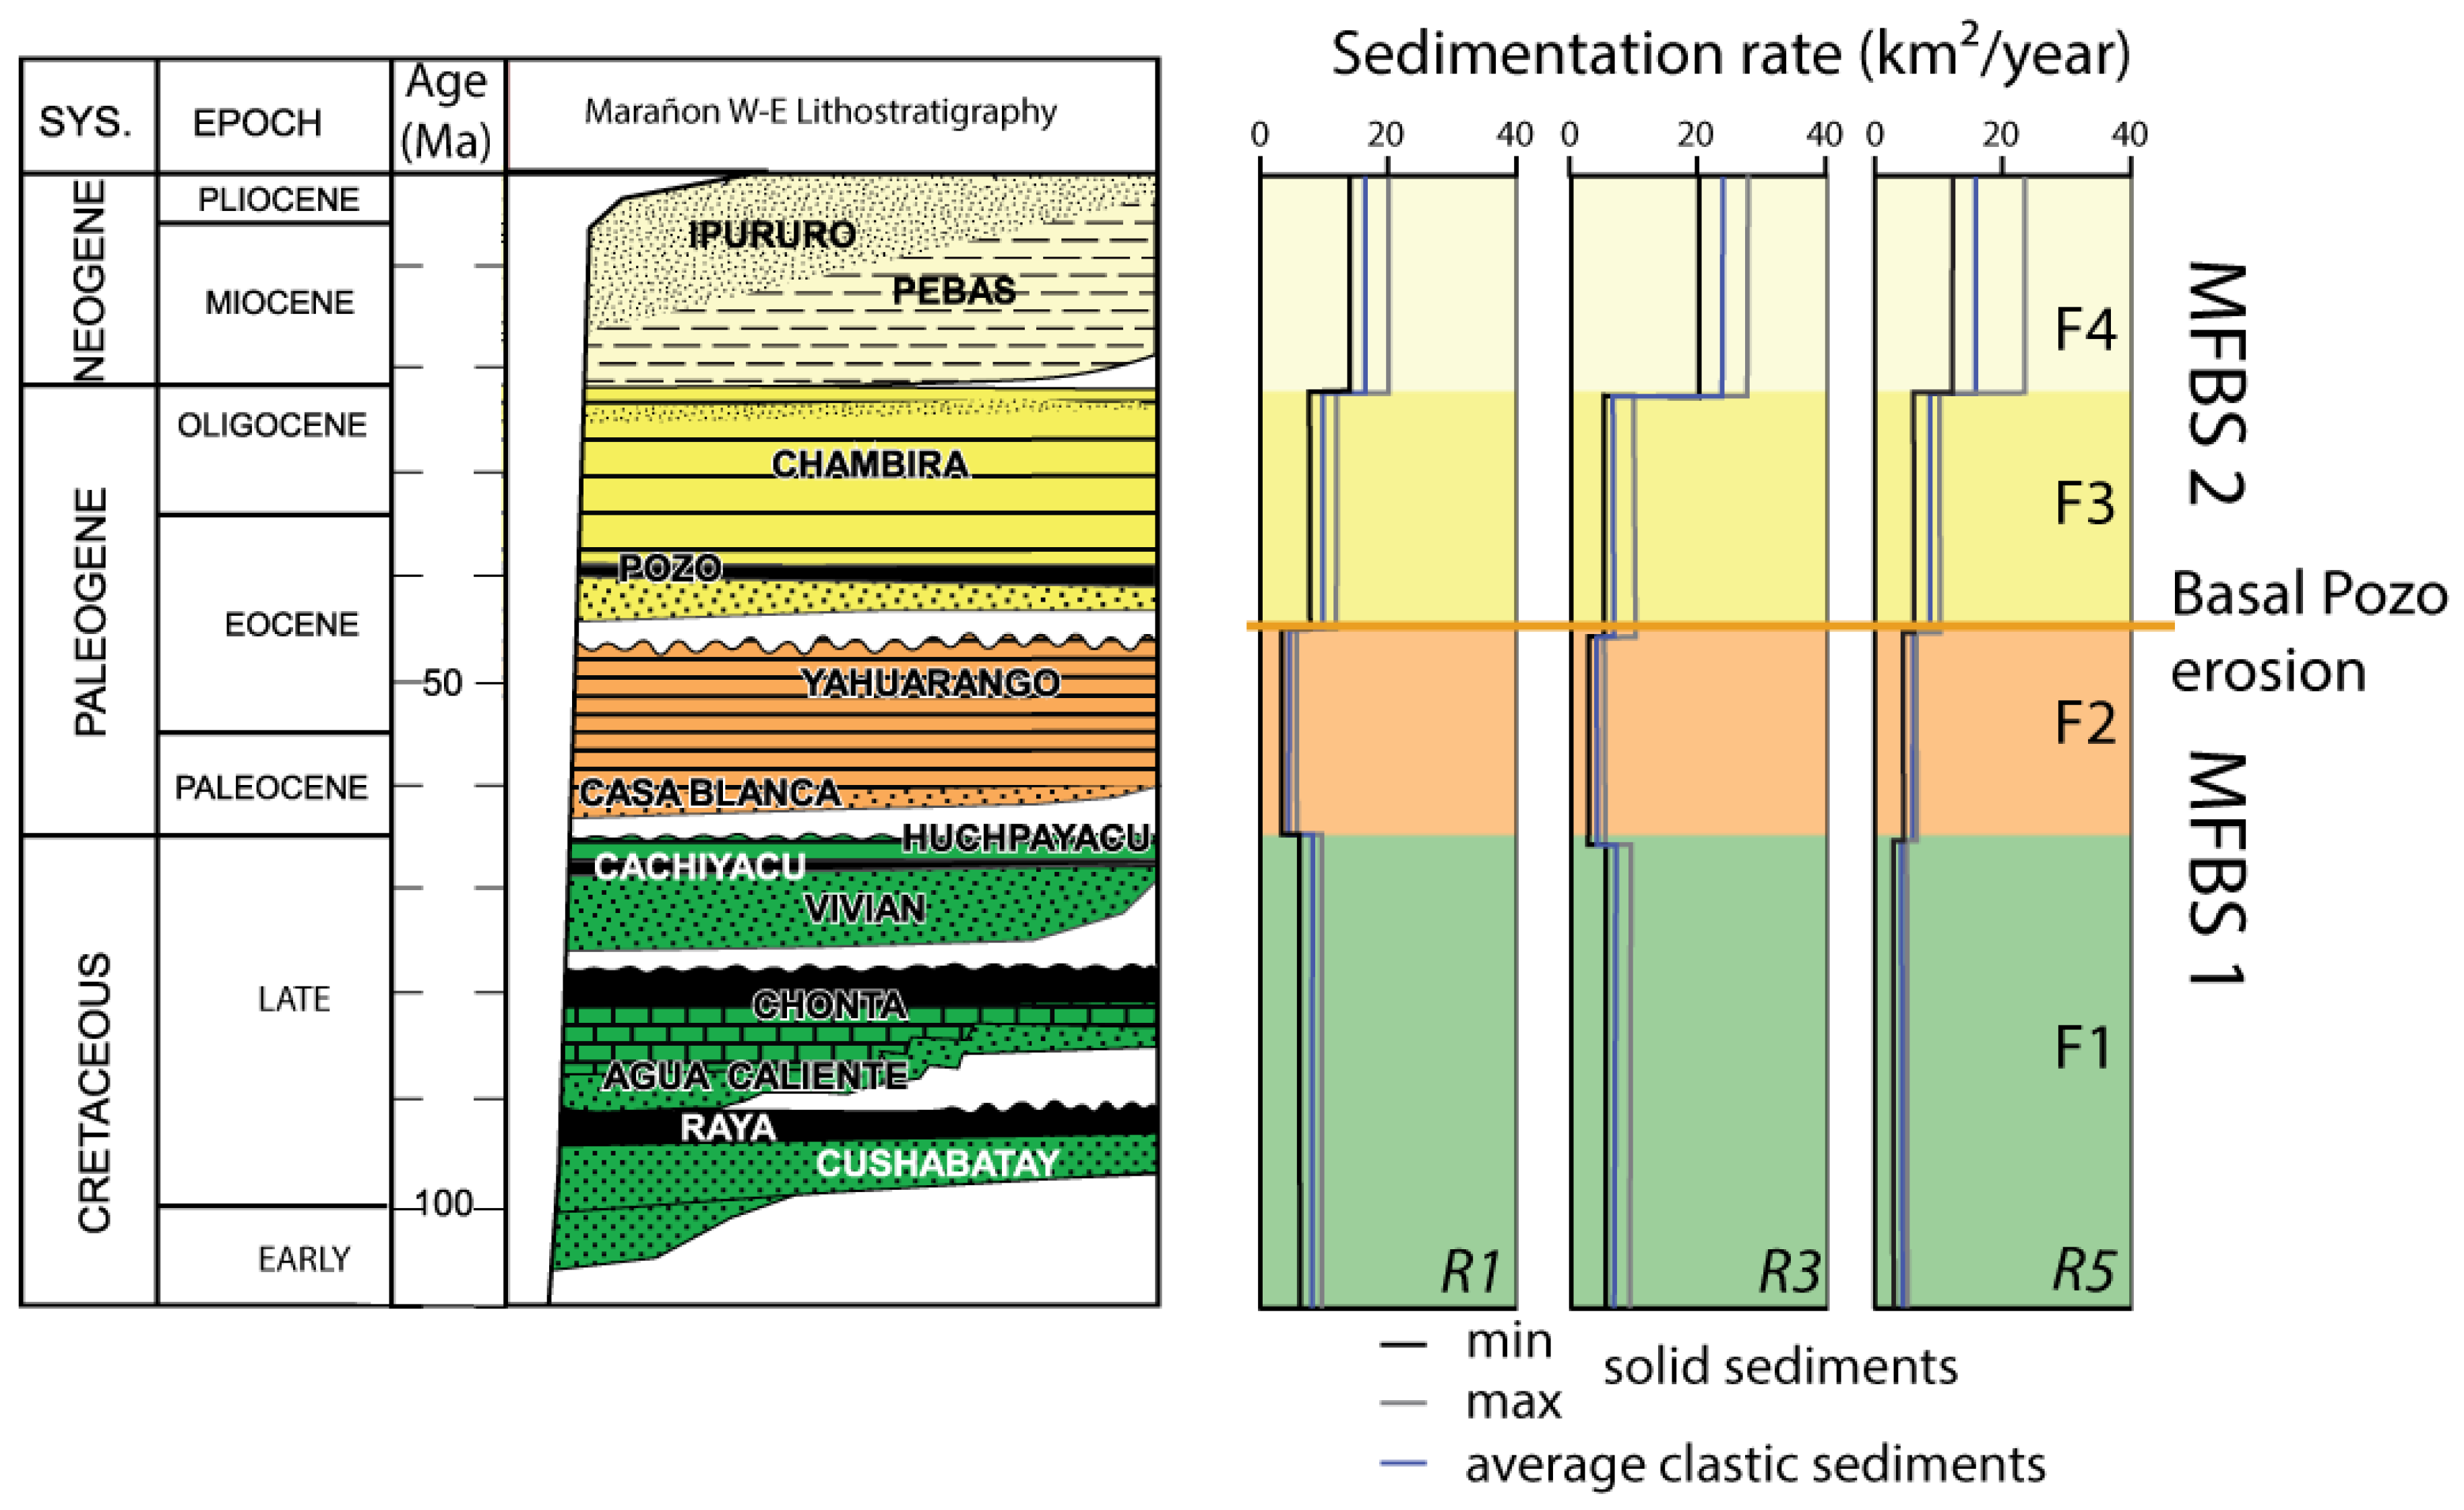
The sedimentation rate since the early Cretaceous (Albian, 110 Ma) based on the sections R1, and R3 show a decrease at the transition with the Paleogene (Figure 6), followed by an increase until recent times. On section R5 the sedimentation rates have increased since the early Cretaceous (Figure 6). Clastic deposition represents a higher fraction of sedimentation, with the figure never being lower than 75%. The carbonate or organics (coal, organic matter) do not represent a significant portion of the sediments that are preserved in the studied intervals (Table 1 and Appendix A)
To the South of the Marañón Basin (R1, Figure 6), the computed sedimentation rates show a slight decrease less than two times from the late Cretaceous to the Paleogene. This is followed by an increase higher than twice from the middle Eocene to the late Oligocene periods for solid sediment and clastic rates of sedimentation. The highest figure of sedimentation, higher by two to three folds, is occurring from the late Oligocene to the Neogene to recent sequence. This, despite the erosion observed in the section R1 (See Figure 5). Section R3 shows a stronger sedimentation rate during the Neogene. In sections R1 and R3, the sedimentation rate calculation of F2 is probably biased as a result of the Basal Pozo (base of F3) erosion that increases to the north (Figure 2). This may explain the computed sedimentation rates trend variation from R1 to R5 observed for the Paleogene.
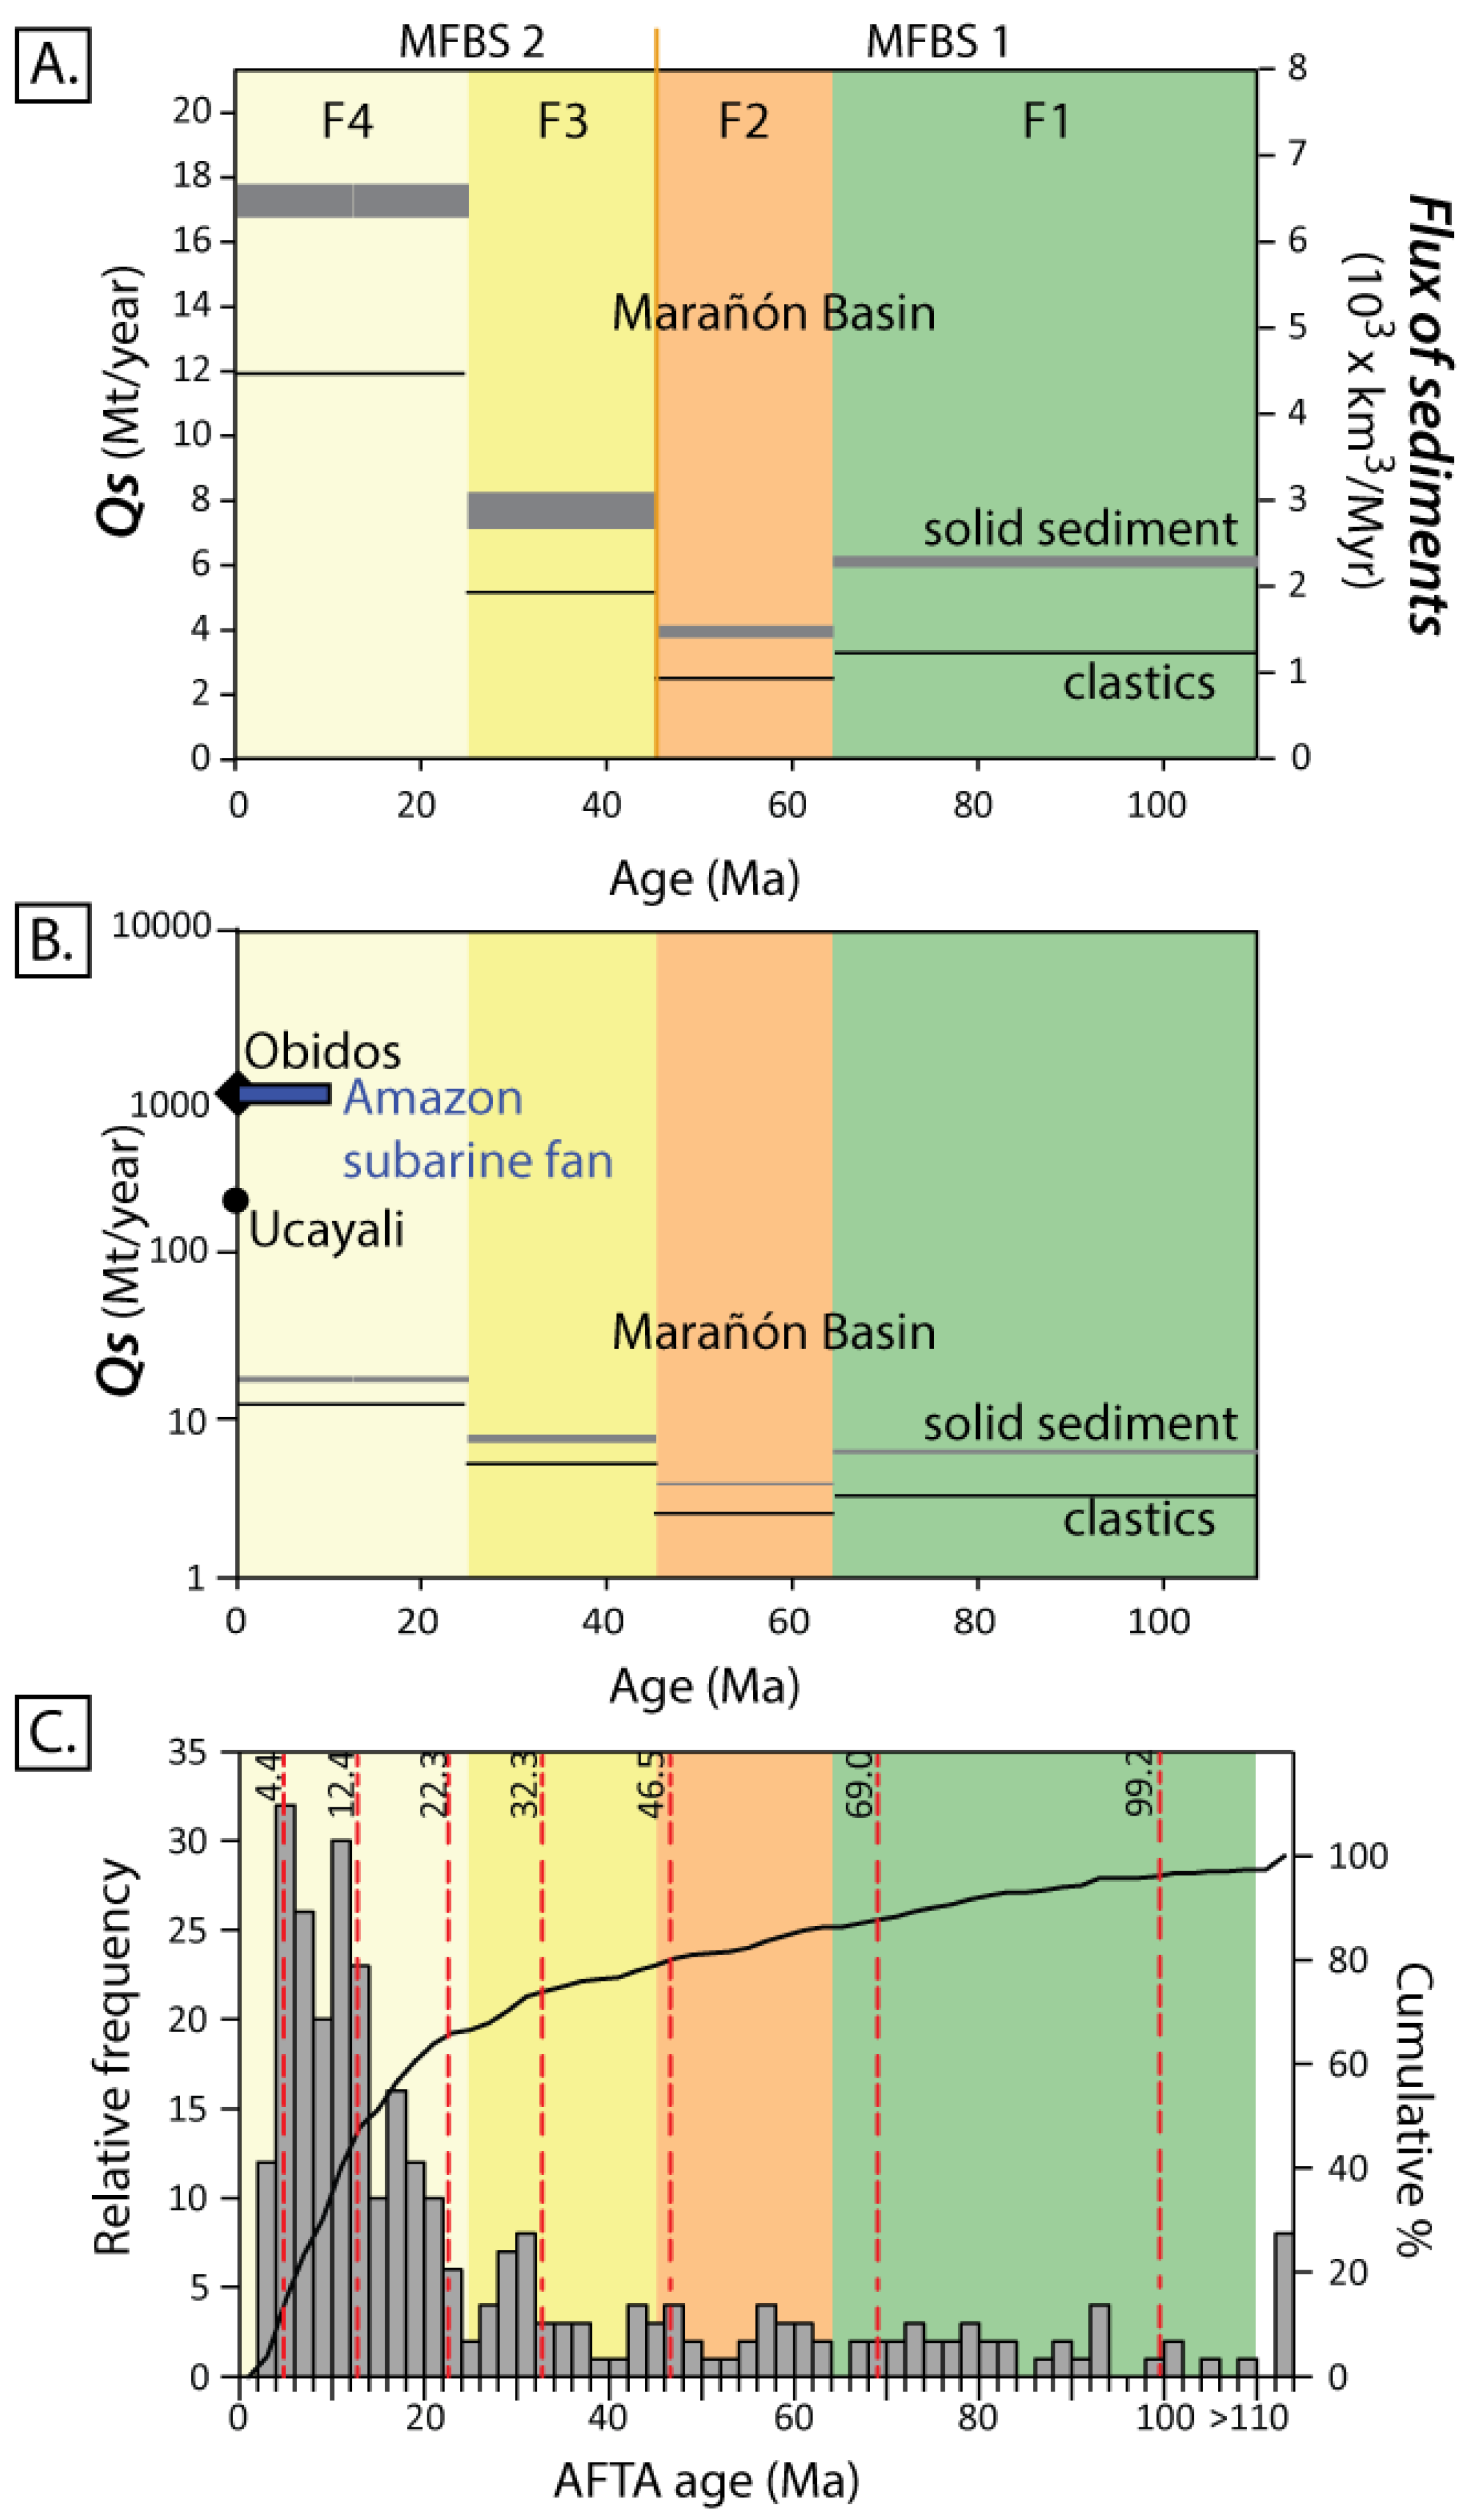
Once these results on regional cross section are transferred to the whole Marañón Basin, taking into account the isopach maps computed regionally (Table 1), we can document the basin-wide evolution of sediments flux and the Qs computed (Figure 7A).
As a modern suspended sediment load figure, we refer to the work of Filizola and Guyot [53] based on sediment concentration monitoring of the Amazon River catchment at Obidos (Brazil) (Figure 1A), coupled with water discharge measurements using Doppler technology. The modern sediment discharge assessment is ranging from 880 to 1200 Mt·year−1. In the Ucayali piggyback Basin, the reference represents the sediment flux deposited/preserved in the floodplain (Figure 7B), estimated at 220 Mt·year−1 by Santini et al. [15].
The figures of sediment supply (Qs) since the Albian have been a lower order of magnitude than the modern estimated of sediment discharge (Figure 7B). The Qs during the Cenozoic has been increasing by steps with two to three times the value of the previous sequence. The Neogene to recent show values 50 to 100 times lower than the present day observed sediment discharge of the River Amazon at Obidos, and are 18 times lower than the modern sedimentation rates in the neighboring Ucayali Basin. The Amazon Submarine fan volume shows an initiation during the Neogene of a paleodischarge of suspended material of 900–1100 Mt·year−1 [54] (Figure 7B).

3.5. Andean Relief Exhumation History from AFTA

Over the last 110 Myr the exhumation history of the Andean orogenic domain surrounding the Marañón Basin shows three stages of evolution (Figure 7C). The first stage following the unconformity associated with the BFU lasted until the end of the Eocene, with little to no significant rate of exhumation. This stage is followed by the first significant exhumation event from the end of the Eocene to the Base of the Neogene where the number of sampled age of exhumation decreases. The following stage marks the most important exhumation event of the Andean domain up to the Plio-Pleistocene. Denudation estimates from the AFTA modeling path that range from Northern Bolivia lead to an estimate of erosion since the Eocene of 0.16 ± 0.08 mm/year [34]. Between 10° S and 0°, mass estimates and excess erosion of the Andean reliefs show a value ranging from 1 to 1.8 mm/year [55]. These effects on mass balance of this discrepancy in denudation/erosion estimates will be discussed below and compared with the preserved volumetric in the sink.

4. Discussion and Conclusions

4.1. Andean Foreland Sequence and Source to Sink Evolution

The Marañón FBS deposits can be divided into four long term sequences (F1 to F4) defined from previous studies, wells stratigraphic correlations and regional unconformities identified on seismic data. The first foreland sequence F1 is the Albian and late Cretaceous in age (Cushabatay Formation) and overlies the Andean basal foreland unconformity (BFU). It consists of three fluvial to shallow marine cyclic transgressive sequences that are probably deposited in a backbulge depozone. Albian and Maastrichtian sandstones have cratonic provenance [49].
The Paleocene-early Eocene long term sequence F2 recorded the first siliciclastic supply from the Andean uplift, and represents a continental distal foredeep to backbulge depozone (see R1 sequential restoration of Figure 3). The thickness of F2 decreases towards the south, which is probably due to a strongest erosion of the Basal Pozo erosional surface. This middle Eocene regional erosional surface sealed the deformation and configuration of the first stage of the Huallaga–Marañón FBS. It recorded a quiescence of thrust tectonics and an unloading orogenic period also described in Ecuador and Colombia [50].
The middle Eocene–Oligocene F3 long term sequence recorded the beginning of the second stage of the Huallaga–Marañón FBS, and the uplifting of the Western Cordillera [48] (Figure 1B). The Marañón Basin evolved in a complex environment alternating between marginal marine and fluvial environments.
During the Neogene, the F4 sequence recorded the uplift of the Eastern Cordillera and an evolution of the Marañón Basin from distal to proximal foredeep depozone with increasing rate of sedimentation (Figure 6), contemporaneous with the formation of the Iquitos forebulge [56,57]. The early and middle Miocene period is still characterized by a complex environment alternating between marginal marine and fluvial environments [51,52], due probably to global high sea level and fast subsidence. The transcontinental Amazon River drainage occurred in the late Miocene [20,58] and provoked a radical change in the Marañón foredeep sedimentation that became exclusively fluvial [59]. During the Pliocene, the eastward propagation of thrust tectonics combined the Fitzcarrald Arch uplift [7] led to the uplift and erosion of the southern part of the Marañón Basin. The strongest Neogene sedimentation rate is represented in the foredeep depozone of the section R3.

4.2. Mass Balance

In the northern Marañón Basin, sedimentation rates computed from the regional cross-section R5 show a progressive increase from the Albian to the present that seems to represent a classic evolution of the FBS [11]. To the south (sections R3 and R1), the sedimentation rate shows a decrease during the Paleocene to middle Eocene sequence due to the middle Eocene erosional basal surface of F3 (Basal Pozo) that recorded a period of orogenic unloading interrupting the foreland basin sedimentation. A second Marañón foreland basin system started in the late Eocene-Oligocene. Sedimentation rates significantly increase during the Neogene, driven by a fast subsidence due to the orogenic loading of the uplifting Eastern Cordillera. The computed potential result of erosion of the source area related to the study area, with estimate a surface of 155 × 103 km2 to a maximum of 210 × 103 km2, and the published erosion figures (minimum 0.08 mm/year and maximum 1.8 mm/year) [34,55], the volume corresponding to the Eocene to recent times (45 Ma) is ranging from 558 × 103 km3 up to 17,010 × 103 km3. Compared to the preserved volume of sediments, ~420 ± 40 × 103 km3 in the Marañón Basin within sequences F3 and F4 (this study), these figures represent 1.3 to 40 times more sediments potentially produced . The higher figure will mean that a significant volume of sediments will have been exported out of the study area. Yet no such anomalous volume of sediments exists east of the Andes. Even the most recent (~10 Ma Miocene) significant sedimentary feature of the south American continent, i.e., the Amazon submarine Fan represent only 700 × 103 km3 [54].
The sedimentation rates calculated for the Neogene is 18 times lower than the modern sedimentation rates measured in the Ucayali Basin (Figure 7B). This difference of values is probably due to the complex evolution of the Marañón FBS that we have not completely deciphered. The identified potential erosion and unconformities in the Marañón Basin show that numerous events have occurred with non-preserved sedimentary archive at the location of study area. Part of this record could have been displaced outside or recycled within the study area, this is one of the most challenging aspects of the source to sink system and mass balance studies [60]. It shows also that it remains important periods of erosion, hiatuses and no sedimentation to be found.

Supplementary Materials

The following are available online at https://www.mdpi.com/2076-3263/8/5/167/s1, Table S1: Apatite fission track age data base from various sources in the vicinity of the study area.

Author Contributions

G.C., Y.C., P.B. conceived and designed the experiments and completed the data collection. Y.C., P.B., G.C., C.H.E., W.S. analyzed the data; G.C. compiled the AFTA database; G.C., Y.C., P.B., S.B., and W.S. wrote the paper.

Acknowledgments

Access to the subsurface data has been granted under the IRD—PERUPETRO collaboration framework. Midland Valley is acknowledged for providing Move software for kinematic structural modeling. The author’s financial support has been granted by the Institut Carnot ISIFOR.

Conflicts of Interest

The author declares no conflict of interest.

Appendix A

The appendix includes the detailed methods of time–depth conversion, porosity calculation, compaction correction and volume and rate estimation.

A.1. Time–Depth Conversion

From the seismic stratigraphic framework extracted in the Marañón Basin, a transformation from time to depth domain has been computed using time-depth information in the study area. To convert the seismically-derived TWT (two-way time) values into depth we use a time–velocity charts extracted from the seismic sections where we use the rms velocity.
For this study, we have compiled a data base using the rms velocities derived from processed seismic reflection that we used in this project.
The interpreted seismic stratigraphic surfaces have to be converted from time to depth. We have used a fixed method where we assume that the velocity increases linearly with depth. Our input parameters include an initial velocity (V0) and the rate of velocity change with depth (k) and the depth conversion is carried out using the following function where:
Z = V0 (eKT − 1)/k
where
z = the thickness of the layer in meters.
V0 = the initial velocity in meters per second.
k = the rate of velocity change with depth.
t = the one-way travel time (OWTT) in seconds.

A.2. Porosity Calculation

Porosities have been derived from sonic logs for the Cretaceous to Tertiary sequence of 15 hydrocarbon exploration wells in the Marañón Basin. In the absence of core data for some wells, porosities in the Marañón Basin must be determined from wireline logs. Sonic logs were run in the Marañón of all the 15 wells available wells, and we used also 4 cores data from the northern region of Marañón for calibration. The sonic tool measures the shortest time for a compressional wave to travel through the formation adjacent to the borehole wall. Sonic logs are generally presented in terms of traveling time, which is a velocity expressed in units of microseconds per foot (µs/ft). Sonic logs are commonly used to estimate porosity, which is one of the rock parameters controlling sonic velocity.
Almost all the wells show porosity decreasing with depth throughout the Marañón Basin and also it is represented in the frequency analyses for the four long terms sequences. One formula that have been used since 1956 was published by Wyllie et al. [61], where time average equation is the most widely used sonic porosity transform:
∆t log = ∆t ma (1 − φ Φ ) + Φ ∆t f,
Whence Φ = (∆t log − ∆t ma)/(∆t f − ∆t ma)
where Φ is the porosity, and ∆t log, ∆t ma, and ∆t f are the sonic log, matrix, and interstitial fluid interval transit times (reciprocals of velocity) respectively.
For porosities that are above approximately 30% [29], it is necessary to apply an empirical correction factor to the Equation (A1) because it over-estimates porosity. In the range 5–25% [29] the time average equation yields porosities which are too low. Raymer-Clemenceau et al. [29] introduced the concept of acoustic formation factor for more accurate porosity determination from sonic transit time data. The sandstone data provided by Raymer et al. [29] augmented by data from carbonate reservoirs led them to propose that:
(1 − Φ )x = F ac = ∆t log/∆t ma,
Whence Φ = 1 − (∆t ma/∆t log)1/x
where the symbols are as above, F ac is the acoustic formation factor and the exponent x is specific to matrix lithology. For this study interval transit times were converted to porosity using Equation (A2) with the appropriate calcite matrix transit time of 47.6 µs/ft, and exponent, x of 1.76 [30]. Logs recorded in imperial units were resampled every 5 ft.

A.3. Compaction Correction

Compaction (i.e., porosity decay) of recent soft sediment is an important source of uncertainty in quantifying the variation of sedimentary fluxes for different ages. We have estimated values of porosity from sample measurements on cores and used these to calibrate the porosity curves from wireline logging [61]. The porosity evolution with depth can be then used to the estimate uplifted and eroded sections of a sedimentary basin [62].
The solid sediment thickness estimate follows the methodology of many previous studies [32]. Knowing the carbonate and organic matter content of the different intervals we have removed these figures to each interval to obtain ‘true’ siliciclastic solid sediment. The porosity has been removed from the volume of each isopach to calculate solid sediment rock mass. Porosity, Φ, is assumed to vary exponentially with depth, z, according to:
Φ(z) = Φoe − z/k
where Φo is the initial porosity and k is the porosity decay length.
Using Equation (A4), the solid thickness, Tsol, of a unit is given by:
Tsol = z2 − z1 + Φok (e − z2/k – e − z1/k)
where z1 is the depth below the surface to the top of the unit and z2 is the depth below surface to the bottom of the unit. Constant values of k = 0.18 and Φo = 45 were determined from the measurements on samples from the Marañón Basin.

A.4. Volume and Rate Estimation

Volume were computed from the isopach maps sourced from the depth converted seismic and stratigraphic horizons. These volumes, the lithological information and physical properties, with age and duration of sequences have allowed us to compute the rates of sedimentation.

References

  1. Allen, P. Sediment Routing Systems: The Fate of Sediment from Source to Sink; Cambridge University Press: Cambridge, UK, 2017. [Google Scholar]
  2. Pelletier, J.D. Erosion-rate determination from foreland basin geometry. Geology 2007, 35, 5–8. [Google Scholar] [CrossRef]
  3. Vergés, J.; Marzo, M.; Santaeulària, T.; Serra-Kiel, J.; Burbank, D.W.; Muñoz, J.A.; Giménez-Montsant, J. Quantified vertical motions and tectonic evolution of the SE Pyrenean foreland basin. Geol. Soc. 1998, 134, 107–134. [Google Scholar] [CrossRef]
  4. Allen, P.A.; Armitage, J.J.; Carter, A.; Duller, R.A.; Michael, N.A.; Sinclair, H.D.; Whitchurch, A.L.; Whittaker, A.C. The Qs problem: Sediment volumetric balance of proximal foreland basin systems. Sedimentology 2013, 60, 102–130. [Google Scholar] [CrossRef]
  5. Bayona, G.; Cortés, M.; Jaramillo, C.; Ojeda, G.; Aristizabal, J.J.; Reyes-Harker, A. An integrated analysis of an orogen–sedimentary basin pair: Latest Cretaceous–Cenozoic evolution of the linked Eastern Cordillera orogen and the Llanos foreland basin of Colombia. Geol. Soc. Am. Bull. 2008, 120, 1171–1197. [Google Scholar] [CrossRef]
  6. Miall, A.D. The valuation of unconformities. Earth-Sci. Rev. 2016. [Google Scholar] [CrossRef]
  7. Espurt, N.; Baby, P.; Brusset, S.; Roddaz, M.; Hermoza, W.; Regard, V.; Bolaños, R. How does the Nazca Ridge subduction influence the modern Amazonian foreland basin? Geology 2007, 35, 515–518. [Google Scholar] [CrossRef]
  8. Calderón, Y.; Baby, P.; Hurtado, C.; Brusset, S. Thrust tectonics in the Andean retro-foreland basin of northern Peru: Permian inheritances and petroleum implications. Mar. Pet. Geol. 2017, 82, 238–250. [Google Scholar] [CrossRef]
  9. Calderón, Y.; Vela, Y.; Hurtado, C.; Bolaños, R.; Baby, P.; Eude, A.; Roddaz, M.; Brusset, B.; Calvès, G. Petroleum Systems Restoration of the Huallaga—Marañon Andean Retroforeland Basin, Peru, in Petroleum Systems Analysis—Case Studies, AAPG. Memoir 2017, 114, 95–116. [Google Scholar] [CrossRef]
  10. Eude, A.; Roddaz, M.; Brichau, S.; Brusset, S.; Calderon, Y.; Baby, P.; Soula, J.-C. Controls on timing of exhumation and deformation in the northern Peruvian eastern Andean wedge as inferred from low-temperature thermochronology and balanced cross section. Tectonics 2015, 34, 715–730. [Google Scholar] [CrossRef]
  11. DeCelles, P.G.; Giles, K.A. Foreland basin systems. Basin Res. 1996, 8, 105–123. [Google Scholar] [CrossRef]
  12. Pfiffner, A.O.; Gonzalez, L. Mesozoic–Cenozoic Evolution of the Western Margin of South America: Case Study of the Peruvian Andes. Geosciences 2013, 3, 262–310. [Google Scholar] [CrossRef]
  13. Baby, P.; Guyot, J.L.; Hérail, G. Tectonic control of erosion and sedimentation in the Amazon Basin of Bolivia. Hydrol. Process. 2009, 23, 3225–3229. [Google Scholar] [CrossRef]
  14. Laraque, A.; Bernal, C.; Bourrel, L.; Darrozes, J.; Christophoul, F.; Armijos, E.; Guyot, J.L. Sediment budget of the Napo River, Amazon basin, Ecuador and Peru. Hydrol. Process. 2009, 23, 3509–3524. [Google Scholar] [CrossRef]
  15. Santini, W.; Martinez, J.-M.; Espinoza-Villar, R.; Cochonneau, G.; Vauchel, P.; Moquet, J.-S.; Baby, P.; Espinoza, J.-C.; Lavado, W.; Carranza, J.; et al. Sediment budget in the Ucayali River basin, an Andean tributary of the Amazon River. Proc. IAHS 2015, 367, 320–325. [Google Scholar] [CrossRef]
  16. Vauchel, P.; Santini, W.; Guyot, J.L.; Moquet, J.S.; Martinez, J.M.; Espinoza, J.C.; Ronchail, J. A reassessment of the suspended sediment load in the Madeira River basin from the Andes of Peru and Bolivia to the Amazon River in Brazil, based on 10 years of data from the HYBAM monitoring programme. J. Hydrol. 2017, 553, 35–48. [Google Scholar] [CrossRef]
  17. Calderon, Y. Architecture Structurale, Bilans Sedimentaires et Potentiel Hydrocarburifere D’une Zone de Transition “Wedgetop-Foredeep” de Retro-Bassin D’avant-Pays: Exemple des Bassins Marañón et Huallaga du Nord-Perou. Ph.D. Thesis, Université Toulouse, Toulouse, France, 16 March 2018. [Google Scholar]
  18. Armijos, E.; Crave, A.; Vauchel, P.; Fraizy, P.; Santini, W.; Moquet, J.S.; Guyot, J.L. Suspended sediment dynamics in the Amazon River of Peru. J. S. Am. Earth Sci. 2013, 44, 75–84. [Google Scholar] [CrossRef]
  19. Armijos, E.; Laraque, A.; Barba, S.; Bourrel, L.; Ceron, C.; Lagane, C.; Guyot, J.L. Yields of suspended sediment and dissolved solids from the Andean basins of Ecuador. Hydrol. Sci. J. 2013, 58, 1478–1494. [Google Scholar] [CrossRef]
  20. Figueiredo, J.; Hoorn, C.; van der Ven, P.; Soares, E. Late Miocene onset of the Amazon River and the Amazon deep-sea fan: Evidence from the Foz do Amazonas Basin. Geology 2009, 37, 619–622. [Google Scholar] [CrossRef]
  21. Cornelius, U.E.; Manfred, R.S.; Axel, K.S. Increased sediment accumulation rates and climatic forcing in the central Andes during the late Miocene. Geology 2007, 35, 979–982. [Google Scholar] [CrossRef]
  22. Clift, P.D. Enhanced global continental erosion and exhumation driven by Oligo-Miocene climate change. Geophys. Res. Lett. 2010, 37. [Google Scholar] [CrossRef]
  23. Mégard, F. The Andean orogenic period and its major structures in central and northern Peru. J. Geol. Soc. 1984, 141, 893–900. [Google Scholar] [CrossRef]
  24. Noblet, C.; Lavenu, A.; Schneider, F. Etude géodynamique d’un bassin intramontagneux tertiaire sur décrochements dans les Andes du Sud de l’Equateur: L’exemple du bassin de Cuenca. Géodynamique 1988, 3, 117–138. [Google Scholar]
  25. Devlin, S.; Isacks, B.L.; Pritchard, M.E.; Barnhart, W.D.; Lohman, R.B. Depths and focal mechanisms of crustal earthquakes in the central Andes determined from teleseismic waveform analysis and InSAR. Tectonics 2012, 31, TC2002. [Google Scholar] [CrossRef]
  26. Martinez, E.; Fernández, J.; Calderon, Y.; Galdos, C. Evaluacion Geolofica y Geophysica: Cuenca Marañón, Proyecto de Asistencia para La Reglamentación del Sector Energético del Perú; Perupetro Technical Report; Perupetro: Lima, Peru, 2002. [Google Scholar]
  27. ConocoPhillips. Eastern Marañón Basin Petroleum Systems Evaluation; Block 123, First Exploration Period Commitment Report, ITPXXX, Perupetros’s Archive; ConocoPhillips: Houston, TX, USA, 2008. [Google Scholar]
  28. Talisman Energy. Marañón Regional Stratigraphic Study; Perupetros’s Catalog; Talisman Energy: Calgary, AB, Canada, 2011. [Google Scholar]
  29. Raymer, L.L.; Hunt, E.R.; Gardner, J.S. An Improved Sonic Transit Time-To-Porosity Transform. In Proceedings of the SPWLA 21st Annual Logging Symposium, Lafayette, LA, USA, 8–11 July 1980. [Google Scholar]
  30. Raiga-Clemenceau, J.; Martin, J.P.; Nicoletis, S. The Concept of Acostic Formation Factor for More Accurate Porosity Determination from Sonic Transit Time Data. In Proceedings of the SPWLA 27th Annual Logging Symposium, Houston, TX, USA, 9–13 June 1986. [Google Scholar]
  31. Sclater, J.G.; Christie, P.A.F. Continental stretching: An explanation of the Post-Mid-Cretaceous subsidence of the central North Sea Basin. J. Geophys. Res. Solid Earth 1980, 85, 3711–3739. [Google Scholar] [CrossRef]
  32. Calvès, G.; Toucanne, S.; Jouet, G.; Charrier, S.; Thereau, E.; Etoubleau, J.; Marsset, T.; Droz, L.; Bez, M.; Abreu, V.; et al. Inferring denudation variations from the sediment record; an example of the last glacial cycle record of the Golo Basin and watershed, East Corsica, western Mediterranean sea. Basin Res. 2013, 25, 197–218. [Google Scholar] [CrossRef] [Green Version]
  33. Baby, P.; Calderón, C.Y.; Hurtado, M.; Louterbach, N.; Espurt, S.; Brusset, M.; Roddaz, S.; Brichau, A.; Eude, G.; Calvès, A.; et al. The Peruvian subandean foreland basin system: Structural overview, geochronologic constraints, and unexplored plays, in Petroleum Basins and Hydrocarbon Potential of the Andes of Peru and Bolivia. AAPG Memoir 117 2018, in press. [Google Scholar]
  34. Barnes, J.B.; Ehlers, T.A.; McQuarrie, N.; O’Sullivan, P.B.; Pelletier, J.D. Eocene to recent variations in erosion across the central Andean fold-thrust belt, northern Bolivia: Implications for plateau evolution. Earth Planet. Sci. Lett. 2006, 248, 118–133. [Google Scholar] [CrossRef]
  35. Barnes, J.B.; Ehlers, T.A.; Insel, N.; McQuarrie, N.; Poulsen, C.J. Linking orography, climate, and exhumation across the central Andes. Geology 2012, 40, 1135–1138. [Google Scholar] [CrossRef]
  36. Espurt, N.; Brusset, S.; Baby, P.; Henry, P.; Vega, M.; Calderon, Y.; Saillard, M. Deciphering the Late Cretaceous-Cenozoic structural evolution of the North Peruvian forearc system. Tectonics 2018, 37, 251–282. [Google Scholar] [CrossRef]
  37. Gautheron, C.; Espurt, N.; Barbarand, J.; Roddaz, M.; Baby, P.; Brusset, S.; Tassan-Got, L.; Douville, E. Direct dating of thick- and thin-skin thrusts in the Peruvian Subandean zone through apatite (U–Th)/He and fission track thermochronometry. Basin Res. 2013, 25, 419–435. [Google Scholar] [CrossRef]
  38. Gunnell, Y.; Thouret, J.-C.; Brichau, S.; Carter, A.; Gallagher, K. Low-temperature thermochronology in the Peruvian Central Andes: Implications for long-term continental denudation, timing of plateau uplift, canyon incision and lithosphere dynamics. J. Geol. Soc. 2010, 167, 803–815. [Google Scholar] [CrossRef]
  39. Laubacher, G.; Naeser, C.W. Fission-track dating of granitic rocks from the Eastern Cordillera of Peru: Evidence for Late Jurassic and Cenozoic cooling. J. Geol. Soc. 1994, 151, 473–483. [Google Scholar] [CrossRef]
  40. Lease, R.O.; Ehlers, T.A. Incision into the Eastern Andean Plateau during Pliocene Cooling. Science 2013, 341, 774–776. [Google Scholar] [CrossRef] [PubMed]
  41. Louterbach, M. Propagation du Front Orogénique Subandin et Réponse Sédimentaire Associée dans le Bassin D’avant-Pays Amazonien (Madre de Dios, Pérou). Ph.D. Thesis, Université Paul Sabatier, Toulouse, France, 2014. [Google Scholar]
  42. McQuarrie, N.; Ehlers, T.A.; Barnes, J.B.; Meade, B. Temporal variation in climate and tectonic coupling in the central Andes. Geology 2008, 36, 999–1002. [Google Scholar] [CrossRef]
  43. Michalak, M.J.; Hall, S.R.; Farber, D.L.; Audin, L.; Hourigan, J.K. (U-Th)/He thermochronology records late Miocene accelerated cooling in the north-central Peruvian Andes. Lithosphere 2016, 8, 103–115. [Google Scholar] [CrossRef]
  44. Ruiz, G.M.H.; Carlotto, V.; Van Heiningen, P.V.; Andriessen, P.A.M. Steady-state exhumation pattern in the Central Andes—SE Peru. Geol. Soc. 2009, 324, 307–316. [Google Scholar] [CrossRef]
  45. Scherrenberg, A.F.; Kohn, B.P.; Holcombe, R.J.; Rosenbaum, G. Thermotectonic history of the Marañón Fold–Thrust Belt, Peru: Insights into mineralisation in an evolving orogen. Tectonophysics 2016, 667, 16–36. [Google Scholar] [CrossRef]
  46. Schildgen, T.F.; Hodges, K.V.; Whipple, K.X.; Reiners, P.W.; Pringle, M.S. Uplift of the western margin of the Andean plateau revealed from canyon incision history, southern Peru. Geology 2007, 35, 523. [Google Scholar] [CrossRef]
  47. Spikings, R.A.; Seward, D.W.; Ruiz, W.G.M. Low-temperature thermochronology of the northern Cordillera Real, Ecuador: Tectonic insights from zircon and apatite fission track analysis. Tectonics 2000, 19, 649–668. [Google Scholar] [CrossRef]
  48. Steinmann, M.; Hungerbühler, D.; Seward, D.; Winkler, W. Neogene tectonic evolution and exhumation of the southern Ecuadorian Andes: A combined stratigraphy and fission-track approach. Tectonophysics 1999, 307, 255–276. [Google Scholar] [CrossRef]
  49. Hurtado, C.A. Proveniência Sedimentar do Mesozoico-Cenozoico da Bacia Andino-Amazônica de Huallaga, Implicações Geodinâmicas e Paleogeográficas. Dissertação de Mestrado não Publicada; Instituto de Geociências, Universidade de Brasilia: Brasília, Brazil, 2017. [Google Scholar]
  50. Christophoul, F.; Baby, P.; Dávila, C. Stratigraphic responses to a major tectonic event in a foreland basin: The Ecuadorian Oriente Basin from Eocene to Oligocene times. Tectonophysics 2002, 345, 281–298. [Google Scholar] [CrossRef]
  51. Hoorn, C.; Wesselingh, F.P.; ter Steege, H.; Bermudez, M.A.; Mora, A.; Sevink, J.; Sanmartin, I.; Sanchez-Meseguer, A.; Anderson, C.L.; Figueiredo, J.P.; et al. Amazonian through time: Andean uplift, climate change, landscape evolution and biodiversity. Science 2010, 330, 927–931. [Google Scholar] [CrossRef] [PubMed] [Green Version]
  52. Jaramillo, C.; Romero, I.; D’Apolito, C.; Bayona, G.; Duarte, E.; Louwye, S.; Escobar, J.; Luque, J.; Carillo-Briceno, J.; Zapata, V.; et al. Miocene flooding events of western Amazonia. Sci. Adv. 2017, 3. [Google Scholar] [CrossRef] [PubMed]
  53. Filizola, N.; Guyot, J.L. The use of Doppler technology for suspended sediment discharge determination in the River Amazon/L’utilisation des techniques Doppler pour la détermination du transport solide de l’Amazone. Hydrol. Sci. J. 2004, 49, 143–153. [Google Scholar] [CrossRef]
  54. Wetzel, A. The transfer of river load to deep-sea fans: A quantitative approach. AAPG Bull. 1993, 77, 1679–1692. [Google Scholar]
  55. Montgomery, D.R.; Balco, G.; Willett, S.D. Climate, tectonics, and the morphology of the Andes. Geology 2001, 29, 579–582. [Google Scholar] [CrossRef]
  56. Jacques, J.M. A tectonostratigraphic synthesis of the sub-Andean basins: Implications for the geotectonic segmentation of the Andean Belt. J. Geol. Soc. Lond. 2003, 160, 687–701. [Google Scholar] [CrossRef]
  57. Roddaz, M.; Baby, P.; Brusset, S.; Hermoza, W.; Darrozes, J.M. Forebulge dynamics and environmental control in Western Amazonia: The case study of the Arch of Iquitos (Peru). Tectonophysics 2005, 399, 87–108. [Google Scholar] [CrossRef]
  58. Cobbold, P.R.; Mourgues, R.; Boyd, K. Mechanism of thin-skinned detachment in the Amazon Fan: Assessing the importance of fluid overpressure and hydrocarbon generation. Mar. Pet. Geol. 2004, 21, 1013–1025. [Google Scholar] [CrossRef]
  59. Roddaz, M.; Hermoza, W.; Mora, A.; Baby, P.; Parra, M.; Christophoul, F.; Brusset, S.; Espurt, N. Cenozoic Sedimentary Evolution of the Amazonian Foreland Basin System. In Amazonia: Landscape and Species Evolution: A Look into the Past; Hoorn, C., Wesselingh, F.P., Eds.; Wiley-Blackwell Publishing Ltd.: Oxford, UK, 2009. [Google Scholar]
  60. Romans, B.W.; Castelltort, S.; Covault, J.A.; Fildani, A.; Walsh, J.P. Environmental signal propagation in sedimentary systems across timescales. Earth-Sci. Rev. 2016, 153, 7–29. [Google Scholar] [CrossRef]
  61. Wyllie, M.R.J.; Gregory, A.R.; Gardner, L.W. Elastic wave velocities in heterogeneous and porous media. Geophysics 1956, 21, 41–70. [Google Scholar] [CrossRef]
  62. Hillis, R.R. Chalk porosity and Tertiary uplift, Western Approaches Trough, SW UK and NW French continental shelves. J. Geol. Soc. 1991, 148, 669–679. [Google Scholar] [CrossRef]
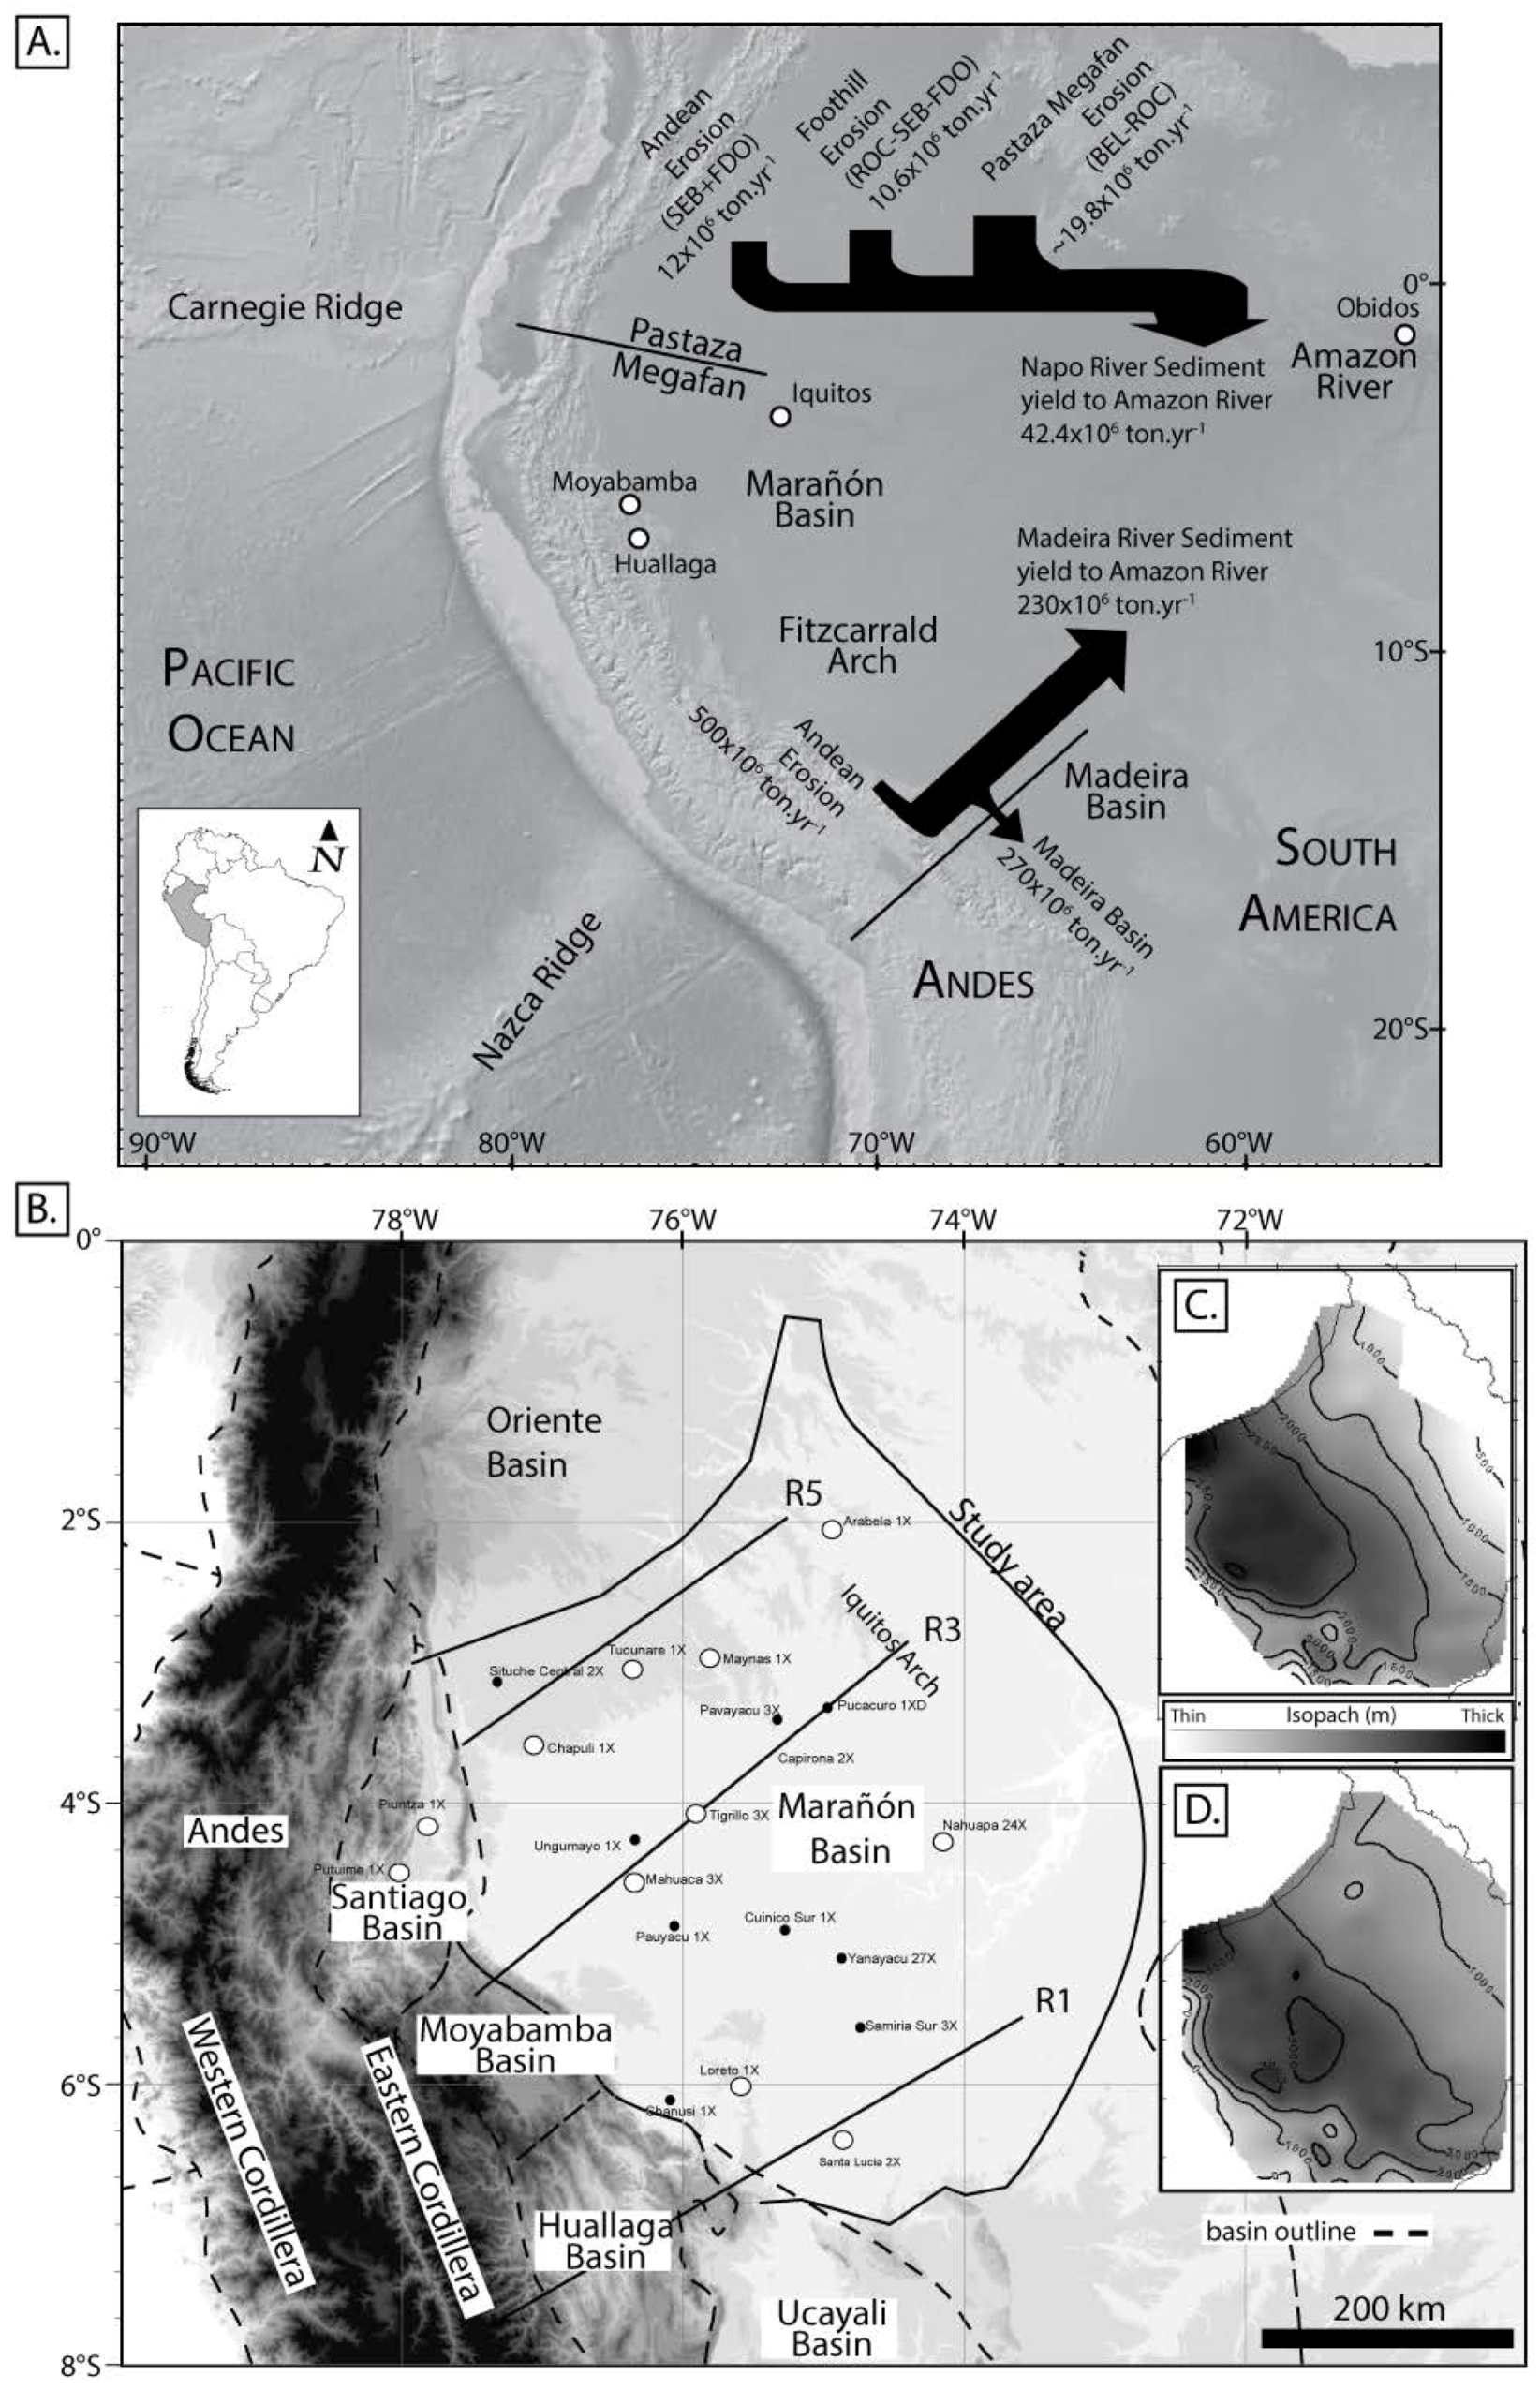
Figure 1. (A) Andean and Amazonian source to sink profile on the Napo and Madeira River basin, the flux is sourced from [13,14,15,16] (SEB, San Sebastian St.; FDO, Francisco de Orellana St.; ROC, Nuevo Rocafuerte St. and BEL, Bellavista St.); (B) Digital Elevation Map (DEM) map with stratigraphic and structural cross sections constructed for this study. Dotted lines represent the outline of the sedimentary basins: Marañón, Santiago, Huallaga and Oriente. Biostratigraphic studies from previous reports are showed in white filled circles; (C) Isopach maps of the Cretaceous–Early Paleogene periods and (D) Late Paleogene–recent [17].
Geosciences 08 00167 g001
Figure 2. Late Cretaceous and Cenozoic sequences on the Andean Basal Foreland Unconformity [8,9]. F1 to F4 appoint long term foreland basin sequences defined in this study. Andean tectonics phases are sourced from [23,24]. The sedimentation rates published nearby the study area [21,22]. BFU: Basal foreland unconformity; In2: Inca phase 2; Q1 and Q2:3: Quechua phase.
Geosciences 08 00167 g002
Figure 3. Huallaga-Marañón balanced cross-section (R1) and sequential restoration. Initial section (Middle Eocene) was obtained by flattening the base of the Pozo Formation (±45 Ma), which sealed the previous deformation and configuration of the Foreland Basin System (FBS). The intermediary stage corresponds to the Late Early Miocene stage and is calibrated by Apatite Fission Track AFT dating in the Chazuta Thrust and Biabo Anticline. AFT samples [17] are projected on present-day cross-section (see location on the map of Figure 1). Earthquake location and depth are sourced from Devlin et al. [25].
Geosciences 08 00167 g003
Figure 4. Physical properties of sediments for the whole drilled sections of the Marañón Basin, and clastic sediments porosities frequency of sequences F1 to F4. The sandstone and shale compaction curves are sourced from Sclater and Christie [31].
Geosciences 08 00167 g004
Figure 5. Regional cross sections R1 (A), R3 (B) and R5 (C). See Figure 1B for location [8,17].
Geosciences 08 00167 g005
Figure 6. Computed sedimentation rates along regional cross sections R1, R3 and R5. MFBS: Marañón Foreland Basin System.
Geosciences 08 00167 g006
Figure 7. (A) Sediment supply and flux computed for the Marañón Basin over the last 110 Ma; (B) Modern sediment supply corresponds to the flux measured at Obidos [53]. In the Ucayali Basin, the modern sedimentation rates represent 220 Mt·year−1 [15]. Note the logarithmic scale to allow for “comparison” of the modern (high) and geological (low) rates. Amazon submarine fan flux are sourced from Wetzel [54] and references within; (C) The relative frequency exhumation history is based on a compilation of apatite fission track ages published in the vicinity of the study area (see Supplementary Materials Table S1). The red dotted vertical lines are events synthesized by Hoorn et al. [51] of the exhumation history of the Andes based on Apatite Fission Track Analysis (AFTA) age cluster analysis.
Geosciences 08 00167 g007
Table 1. Marañón Basin volumetric, physical properties of sediments and sedimentation rates computed from regional cross sections R1, R3 and R5 and isopach maps.
Section UnitSequenceLength kmArea km²Porosity % Lithology % Solid Sediment Sedimentation Rates km²/Myr Clastic Sediment Sedimentation Rates km²/Myr
MinimumMaximumCarbonatesOrganic MatterClasticsMinimumMaximum
R1F444258616505590223326
F3 35820400595111411
F2 1458355095575
F1 52412401510757107
R3F4425892305010585223121
F3 314255050958128
F2 14410455095465
F1 5021040105857107
R5F4304683104410108014251
F3 277104050958121
F2 2201037100907101
F1 251103610585351
SurfaceVolume Qs (Clastics)
km3 km3/Myr Mt/year
Marañon BasinF43.3 × 10114.2 × 1051050105856282652012.1
F310405095284530845.2
F23.6 × 10112.4 × 1057.5355095142014792.5
F1104010585225923173.3