Article

Late Quaternary Soil Development Enhances Aeolian Landform Stability, Moenkopi Plateau, Southern Colorado Plateau, USA

by
Amy L. Ellwein
1,*,
Leslie D. McFadden
2,
Joseph A. McAuliffe
3 and
Shannon A. Mahan
4
1
The Rocky Mountain Biological Laboratory, Crested Butte, CO 81224, USA
2
Department of Earth and Planetary Sciences, The University of New Mexico, Albuquerque, NM 87131, USA
3
Desert Botanical Garden, Phoenix, AZ 85008, USA
4
U.S. Geological Survey, Denver Federal Center, MS 974, Denver, CO 80225, USA
*
Author to whom correspondence should be addressed.
Geosciences 2018, 8(5), 146; https://doi.org/10.3390/geosciences8050146
Submission received: 30 March 2018 / Revised: 18 April 2018 / Accepted: 19 April 2018 / Published: 24 April 2018
(This article belongs to the Special Issue Aeolian Processes and Geomorphology)

Abstract

:
The Moenkopi dune field in northeastern Arizona covers roughly 1250 km2, but most of the field is inactive. Dune deposits on the Moenkopi Plateau (MP) have remained inactive throughout the Holocene despite periods of elevated aridity or historical reductions of vegetation cover by livestock grazing. We argue that this inactivity is not because of any diminishment of driving forces in the aeolian system (e.g., insufficient winds), but rather because of increased cohesion due to soil development that enhances resistance to wind erosion. Abundant aeolian sediments were supplied to the Black Mesa region by the Little Colorado River and its tributaries during the late Pleistocene (MIS 2 and 3), which enabled the development of climbing dunes and transport of sand over the Adeii Eechii Cliffs and onto the MP. These deposits (Qe1) stabilized during the Pleistocene/Holocene climatic transition (~12–7.5 ka) because of reduced sediment supply and high dust flux which resulted in rapid soil formation. Erosion of climbing dunes/sand ramps from the Adeii Eechii Cliffs eliminated delivery of large quantities of new sand to the MP during the mid to late Holocene. Soil development within the Qe1 mantle increased sediment cohesion and prevented widespread aeolian reactivation during the Holocene, despite the occurrence of conditions (wind speed, climate, etc.) under which dune reactivation would be expected. Drylands comprise roughly 40% of the land cover of earth and climate models predict their expansion. Pedogenic stability is not commonly considered in climate-based models used to predict aeolian activity. To improve predictions of future dune activity in drylands, the degree of soil development in aeolian deposits should be considered when evaluating sediment availability in aeolian systems.

Graphical Abstract

1. Introduction

Aeolian deposits are ubiquitous on the southern Colorado Plateau [1,2,3] and strongly influence landscape evolution (e.g., [3,4,5]). Global climate change models predict increasing aridity in many dryland settings and many researchers (e.g., [6]) speculate that decreasing effective moisture will reactivate dune fields under these model scenarios. Decreased effective moisture produced either through increased temperature and/or reduced precipitation is specifically predicted to destabilize vegetative cover on currently stable dunes and consequently cause reactivation of the many North American dune fields, such as those in the Great Plains (e.g., [7,8,9,10,11]) and even high-latitude dunes on the Canadian prairies [12,13]. But what will happen to aeolian sand dunes that are stabilized, not only by vegetation, but also by pedogenic alteration?
To answer this question, we conducted an intensive soil-stratigraphic study, supported by optically stimulated luminescence (OSL) dates, on the aeolian sediment of the Moenkopi Plateau and surrounding areas. The Moenkopi Plateau of northeastern Arizona lies within of one of the largest North American dune fields (Figure 1) and features extensive aeolian landforms readily observed from high altitudes [14]. This region is an excellent study area because it: (1) is currently semiarid, but predicted to undergo decreasing effective moisture conditions with future climate change [15] and (2) contains both active dunes, stable dunes, and sand sheets [1,2] with well-developed surficial and buried soils [5,16], as well as areas where the modern fluvial system supplies sediment to the modern aeolian system and vice versa (fluvial-aeolian sediment recirculation) under current conditions [1,17,18,19]. The goals of this study were to resolve the depositional history, age, and paleoenvironmental setting of aeolian deposits and buried soils that represent episodes of deposition, erosion, and stability on the Moenkopi Plateau and evaluate their future stability under conditions of decreased effective moisture.
The conventional view of aeolian sand dune systems is that their formation or activity indicates arid conditions or decreasing effective moisture, and dune stability indicates either decreased wind power or increased effective moisture and subsequent vegetation and stabilization of aeolian landforms (e.g., [1,6,9,20]). While these relationships often hold true, other studies suggest that aeolian system dynamics are more complicated (e.g., [20,21,22,23]). In fact, increased aeolian activity in the southern Colorado Plateau dune fields may be more strongly related to increases in sediment supply than aridity [3,4,5,16,24].
Based on geomorphic and vegetation mapping, soil stratigraphy, and luminescence dating, this study emphasizes the importance of soil-stratigraphy in providing a structural framework with which to evaluate the long-term stability of aeolian systems. Additionally, an understanding of the interrelationships between these data sources elucidates the role of soil development as an important geomorphic process that promotes cohesion of aeolian sand deposits and therefore resistance to erosion or reactivation by wind. We argue that significant pedogenic alteration, specifically the development of horizons common in soils of arid to semiarid climates (e.g., clay- and carbonate-rich horizons with moderately developed soil structure and consistence) should be included in the list of critical factors that can enhance landform stability in aeolian systems.

2. Study Area and Previous Work

The broad low-relief Moenkopi Plateau ~100 km northeast of Flagstaff, AZ lies at elevations between 1600–1900 m and is mantled with and surrounded by extensive aeolian deposits. The ephemeral Little Colorado River and its tributaries, Moenkopi Wash and Dinnebito Wash, drain the surrounding area (Figure 1). The Moenkopi Plateau, ~400 m above the washes, is relatively undissected and largely removed from exotic alluvial or colluvial sources of sediment. The regional dip of sedimentary units is approximately 3° to the north-northeast [18]. The resistant Jurassic Navajo Sandstone defines the Adeii Eechii Cliffs escarpment along the southwestern edge of the Moenkopi Plateau (Figure 2). The Jurassic Glen Canyon Group and upper Triassic sandstones and shales are exposed to the southwest of the escarpment, and Cretaceous Mesa Verde Group sandstones are exposed on Howell Mesa and areas northeast of the plateau.
The aeolian deposits of the Moenkopi Plateau were a testing ground for early satellite image analysis [14,17,25], new dating methods (e.g., thermoluminescence dating of aeolian sand) [19], and highly instrumented monitoring of aeolian systems (i.e., the USGS Desert Winds Project), which led to related geologic research projects [18]. As a result, much is known about the aeolian deposits of the Moenkopi Plateau. Active and stabilized linear dunes, the most obvious aeolian landforms [1,14,16,18,19,26], trend roughly parallel to the dominant southwesterly winds [27] (Figure 3). Active linear dune crests, which average 40 m wide near the escarpment edge and extend downwind roughly 3–4 km [25], constitute a relatively small portion of the field [14] and occur along the Adeii Eechii Cliffs (Figure 3) [18] as well as other northwest-southeast trending escarpments, including Coal Mine Canyon and Appaloosa Ridge on Coal Mine Mesa (this study). Interdune areas, approximately 100 m wide [18,25], are currently stable sandsheets roughly 1–3 m thick. Dune slopes and crests become increasingly vegetated and stable to the northeast, downwind from the active portion of the field [18]. Though the interdune sandsheets are generally observed to be deposited directly on bedrock, Breed et al. [14] used well-log data to show that in places aeolian deposits on the Moenkopi Plateau are intercalated with alluvial sediments to a thickness of 10 m.
The Moenkopi Plateau supports a grassland-subshrub community dominated by several species of perennial grasses including Bouteloua gracilis (blue grama), Pleuraphis jamesii (galleta), Muhlenbergia pungens (sandhill muhly), Oryzopsis hymenoides (Indian ricegrass), and Hesperostipa comata (needle and thread grass). Shrubby species are uncommon on the aeolian deposits and include Ephedra sp. (mormon tea), Artemisia filifolia (sand sage), Yucca sp., Gutierrezia sp. (snakeweed), with Juniperus osteosperma (Utah juniper) at higher elevations and Atriplex canescens (four-winged saltbush) near ephemeral washes. Two invasive species, Bromus tectorum (cheat grass) and Salsola tragus (Russian thistle), are common in disturbed areas.
The climate of the study area is semiarid and windy with bimodal annual precipitation peaking during the monsoon season and again during the winter months. The USGS Gold Spring Geomet station along the Adeii Eechii Cliffs reports 143 mm MAP and 12.0 °C MAT (period of record 1980–1992) [28]. The historical summary from Cameron, AZ along the Little Colorado River (period of record 1962–1992) [27] shows that this lower elevation (station at ~1270 m) experiences lower effective moisture because of higher average temperatures (MAT = 14.2 °C, MAP = 144 mm). On the northwestern edge of the Moenkopi Plateau at Tuba City (~1500 m), nearly 37% of the yearly average precipitation falls during the monsoon season (July through early September) while May and June typically have the least precipitation (period of record 1900–2005) [27], mean annual precipitation (MAP) averages 163 mm with a mean average temperature (MAT) of 12.8 °C.
Winds of sand-moving velocity measured at the Gold Spring station are dominantly from the southwest with maximum average wind speeds occurring in April and May [18,28,29]. Winds at this site are more than sufficient to transport sand [28,29,30]. In fact, calculated drift potentials for the Gold Spring Station are among the highest reported globally [31] and the mobility index [32] predicts that aeolian landforms in the study area should be entirely active, with M values between 133–164 [30], yet the Moenkopi dunes are predominantly stable.

3. Materials and Methods

3.1. Mapping

The distribution of aeolian deposits was mapped using orthorectified Landsat images at ~28.5 m resolution and a mosaic of USGS black and white digital orthophoto quadrangles (DOQs) with 1 m resolution. Criteria used to map aeolian units included (1) relative brightness on DOQs, (2) spectral variations in Landsat bands, (3) vegetation type and density, and (4) the shape, distribution, and spatial scale of geomorphic features. Initial units were chosen during field reconnaissance. After extensive field reconnaissance and field checking of map units, aeolian deposits were mapped at ~1:50,000 on Landsat scenes using either a 4-2-1 or 2-4-7 band combination in RGB for optimum visualization of aeolian units and differentiation from non-aeolian materials. Initial mapping was refined at scales between 1:5000 and 1:20,000 using 1 m DOQs and a 10 m digital elevation model (DEM) mosaic. All data were georeferenced and compiled in ArcGIS for analysis.

3.2. Sediment Source Evaluation

Though a minor part of this study, we evaluated possible sediment sources for active linear dunes vs. stabilized sand sheets on the Moenkopi Plateau. In particular, we conducted a small study regarding the importance of the white (5Y8/2) weakly cemented Navajo Sandstone composed entirely of quartz grains (no heavy minerals) [18], which outcrops along the Adeii Eechii Cliffs, as a source for the most active linear dunes that head along the Adeii Eechii Cliffs.
Samples were described along three transects, from crest to interdune, along the length of a typical linear dune. Samples were taken from vertical hand-augered cores ending at either bedrock or 400 cm (maximum depth of auger). Field descriptions include dry color, sediment composition, grain size, sorting, rounding, soil texture, approximate depth of boundaries of units, effervescence, and approximate carbonate stage, as well as dominant vegetation and vegetation density at each site. We measured the bulk magnetic susceptibility of dune sediments and compared them to values from the Navajo Sandstone. We did not evaluate the mineralogy or grain size of soil magnetic carriers, instead we used magnetic susceptibility only as an independent measure of comparability. Bulk magnetic susceptibility was measured using an AGICO MFK1 kappabridge. Individual samples were packed into plastic cubes of known mass, the mass of the sample was determined, and then measured three times under a 300 A/m field to determine an average bulk magnetic susceptibility for each specimen. The resulting measured bulk susceptibility values were normalized to sample mass and reported in SI units.

3.3. Soil Stratigraphy and Laboratory Analyses

Field reconnaissance included examination of surficial materials and small cores taken with a hand auger, mapping field relationships, recording vegetation and soil associations, and checking access to potential sites in this large (~3000 km2), sparsely-populated study area. Aeolian stratigraphy and soil development were evaluated in detail at multiple representative sites in surficial soil pits dug by hand, as well as in pre-existing exposures such as blowouts and road cuts. Field descriptions of soil profiles include depth and thickness of soil horizons, horizon boundaries, soil colors, texture, structure, consistence, and morphology of clay films and pedogenic carbonate [33,34].
Bulk soil samples were collected from each horizon of a described profile or stratigraphic section, air-dried, and split for various analyses. Prior to particle size analysis, carbonate was extracted with a 15% hydrochloric acid solution, and organic matter was extracted with a 30% solution of hydrogen peroxide when necessary. Particle size analysis of the <2 mm fraction was performed using sodium pyrophosphate dispersion, sieve separation, and pipet extraction following settling time procedures [35] for several samples; others were determined as volume percentage by a laser-light scattering method [36] using a Malvern 2000 Laser Particle Size Analyzer (Malvern Panalytical, Almelo, the Netherlands). Carbonate content was measured using a manometric technique following procedures described in Machette [37].

3.4. Luminescence Dating

Aeolian quartz sand was dated using optically stimulated luminescence (OSL), which provides the timing of the last exposure of sediment to direct sunlight. OSL ages from this study and dated deposits from other regional aeolian chronostratigraphies (e.g., [3,5,16,19,38]) were used to develop correlated ages for soil profiles not dated in the study.
To determine the ages of stabilized aeolian sediments on the Moenkopi Plateau, we measured OSL on quartz recovered from homogeneous, massive, fine-grained sediments. Sediment samples for luminescence dating were collected in 5 cm-diameter by 15 cm-long metal tubes inserted horizontally into shaded and freshly excavated vertical surfaces. In the laboratory, subsamples for equivalent dose (DE) measurements (i.e., natural luminescence accumulations) were obtained from the center of the core tubes. Outer tube sediment of the samples was analyzed for water content, while another outer tube subsample was dried and submitted for high-resolution gamma spectrometry.
The systematics of OSL techniques are well known [39,40,41]. Luminescence samples were prepared for dating at the U.S. Geological Survey’s Luminescence Geochronology Laboratory in Denver, CO using standard protocols [42,43]. Briefly, under subdued orange-light conditions, applications of 4 M HCl and 45% hydrogen peroxide were applied to the samples followed by wet sieving isolated grains with diameters of 250–63 μm. After sieving and drying, heavy minerals and some feldspars were separated from the quartz with a Frantz magnetic separator using a high (1.5 A) current. A brief separation using heavy liquid of a 2.56 density was enough to float the potassium-rich feldspars for collection. The quartz was collected following the separation and subsequently etched with concentrated (48%) hydrofluoric acid for 40 min, to dissolve grain rinds affected by alpha particles and rid the sample of any remaining feldspars. This procedure is followed by 8 M HCl treatment to remove any precipitated fluorides.
Steel target discs were dabbed with a small circle of silica spray (1 mm, known as a “1 mm mask”) and a single grain thick layer of refined grains was dispersed onto steel discs. Approximately 50 to 150 grains were used for each disc. These discs were then loaded onto a carousel, ready for luminescence analyses. About 30–40 aliquots were measured to ensure the most reliable statistical trends [44].
Protocols and programs used for measuring the luminescence signals and equipment used to produce the measurements are the same as that used in Ellwein et al. (2011) [16] and Ellwein et al. (2015) [5]. Several tests were performed before obtaining replicate DE from each sample [5].
A single aliquot regenerative dose (SAR) protocol [45] was used to determine the DE for each quartz and feldspar aliquot using continuous-wave OSL (CW-OSL). Aliquots were as small as possible for each measurement, generally 25–50 grains per disc.
Dose rates were determined based on concentrations of K, Rb, U, and Th, which were measured both by using a laboratory high-resolution and high purity germanium detector
(HPGe) for gamma ray counts on bulk sediment samples. The cosmic-ray dose rate was estimated for each sample as a function of depth, elevation, and geomagnetic latitude, and added to the total dose rate [46]. The cosmic DR was combined with the alpha, beta, and gamma dose rates to give the total DR. The total DR was corrected for the effects of grain size and water content. If the material to be dated was quartz, the alpha contribution was disregarded since the quartz is etched in 45% hydrofluoric acid (HF) for 50 min, leading to removal of the outer edges of the mineral.
The bulk sediment was generally coarse-grained with a field moisture reading of 5–20% water. After drying, the sediment was weighed, reintroduced to water, centrifuged to simulate compaction, the water poured off, and re-weighed to obtain an approximation of potential total water content, referred to hereafter as saturation moisture. DR and ages were calculated using approximately 10% of the saturated moisture to simulate average yearly precipitation. Finally, all luminescence ages are presented in ka BP (0 y BP = 2000 A.D.), and uncertainties are given at the 67% (1σ) confidence level.

4. Results

4.1. Geomorphic Mapping: Aeolian Deposits and Sources

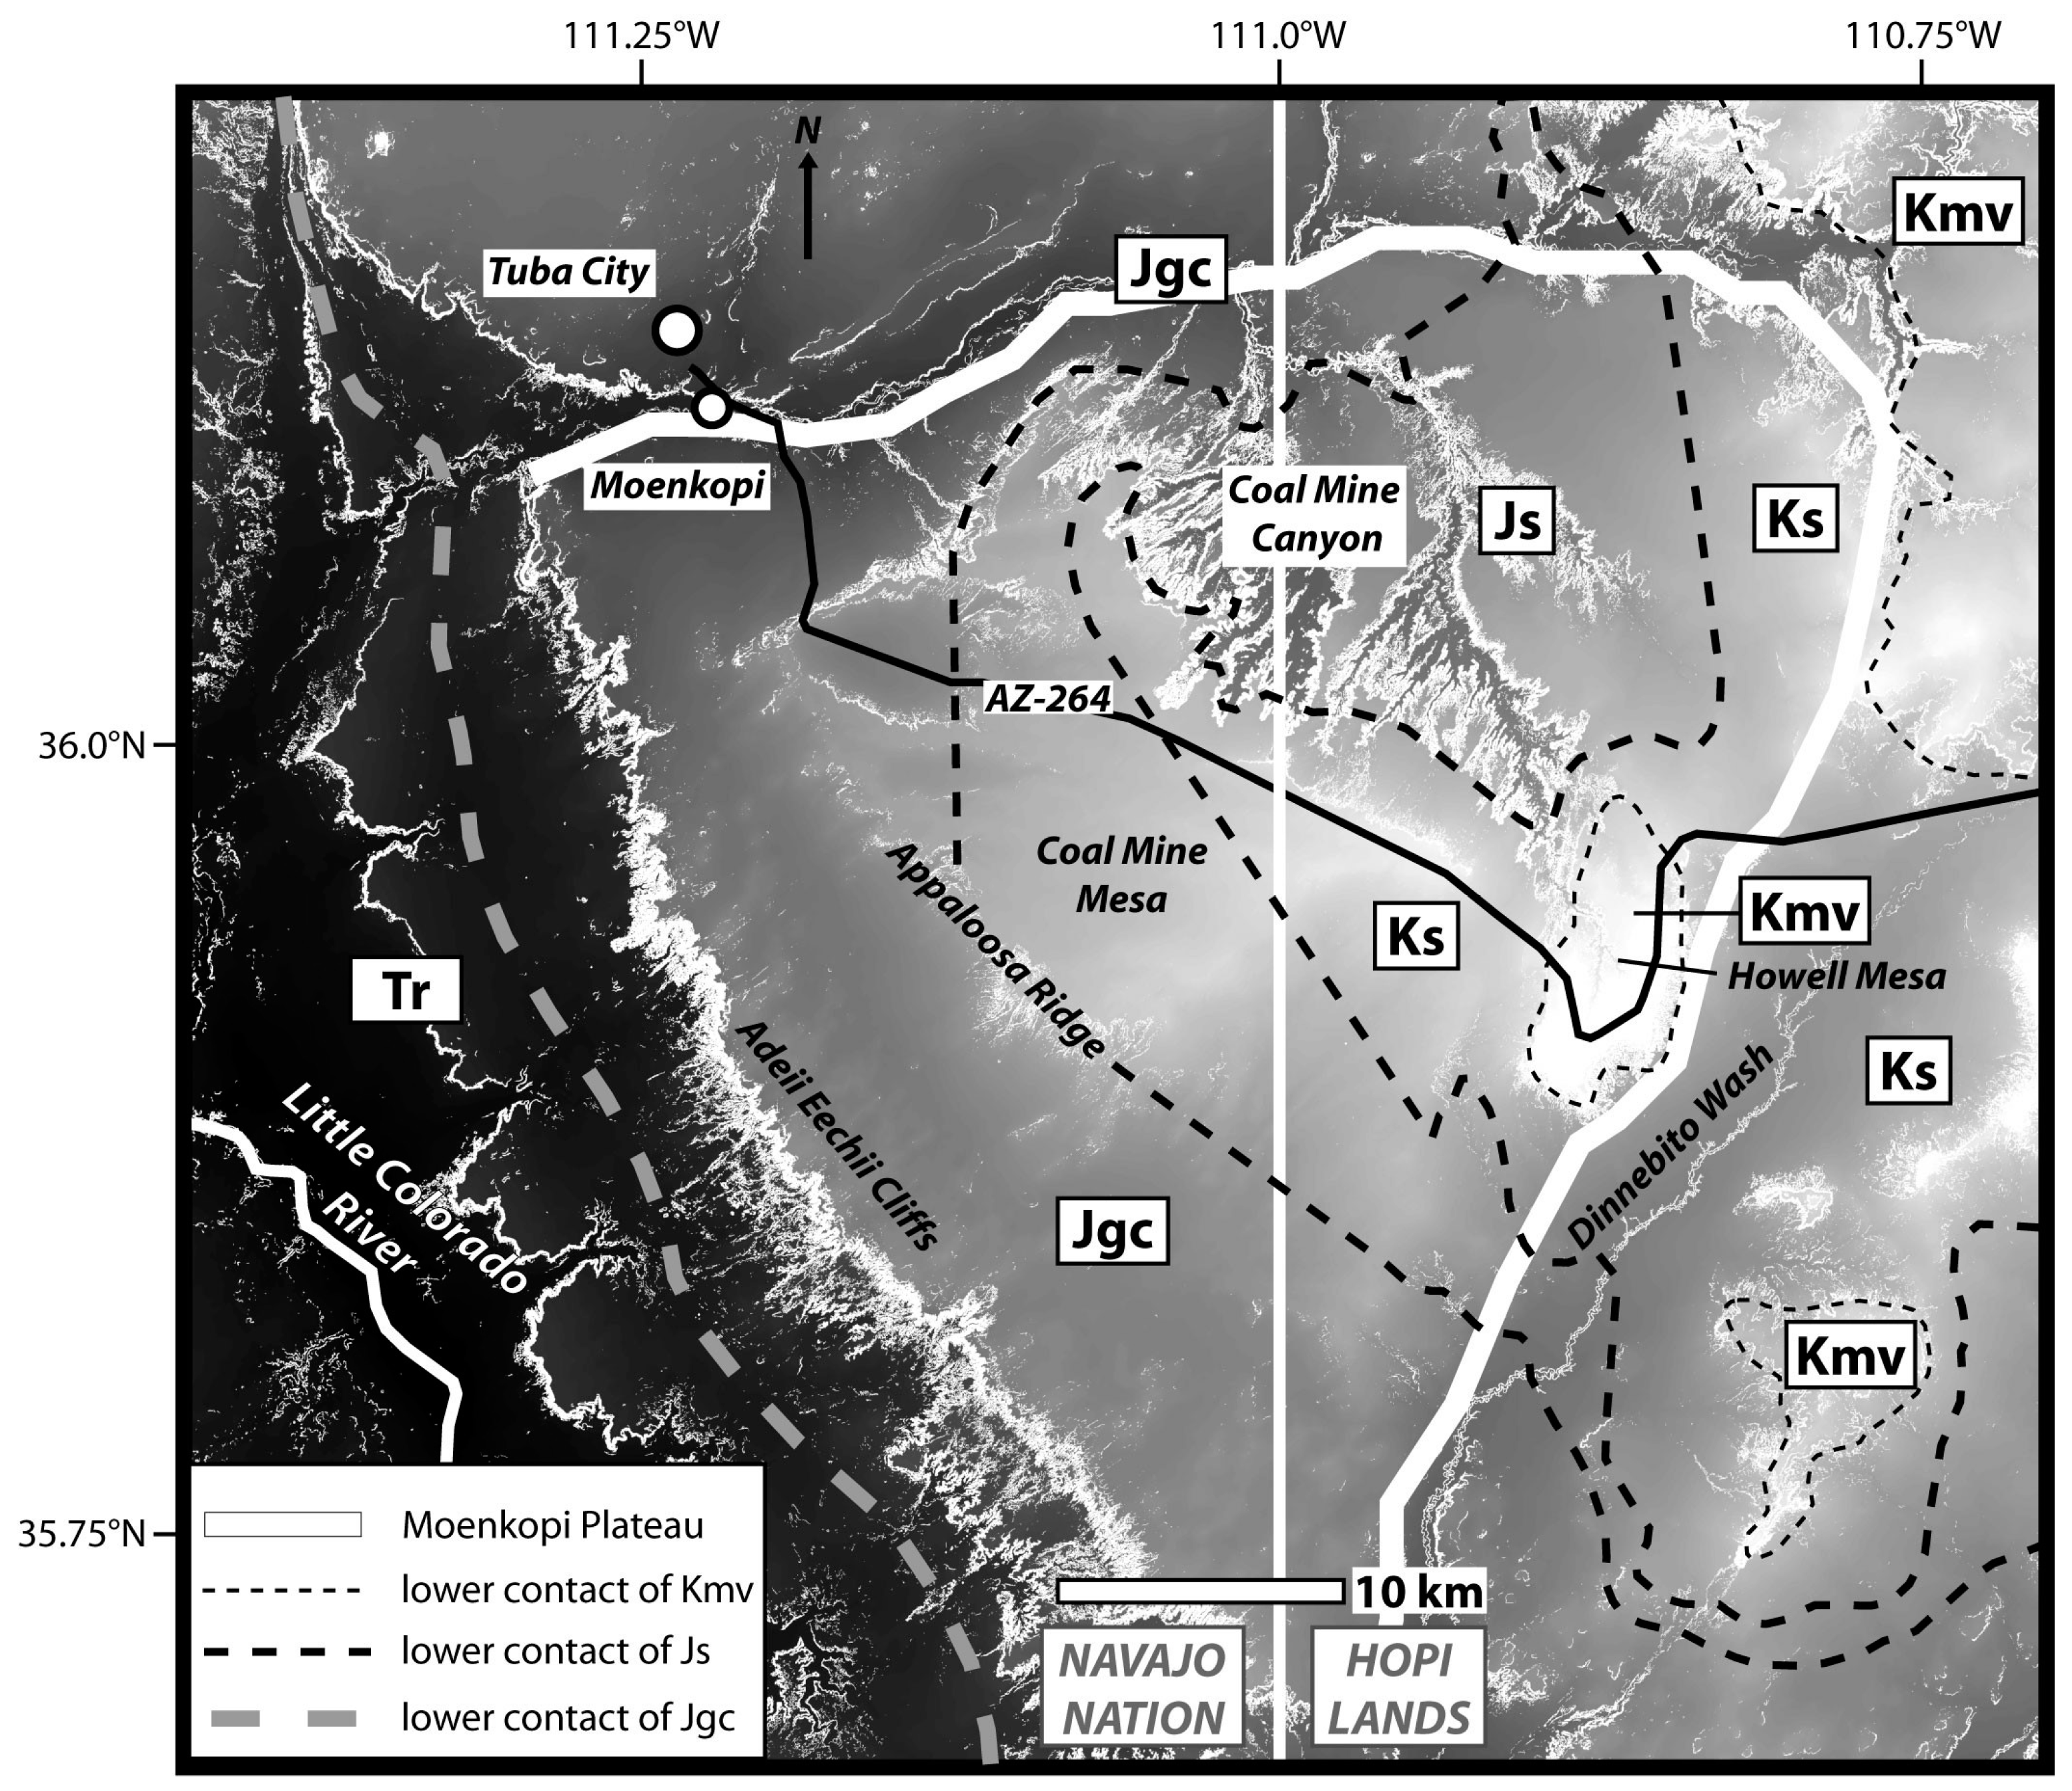
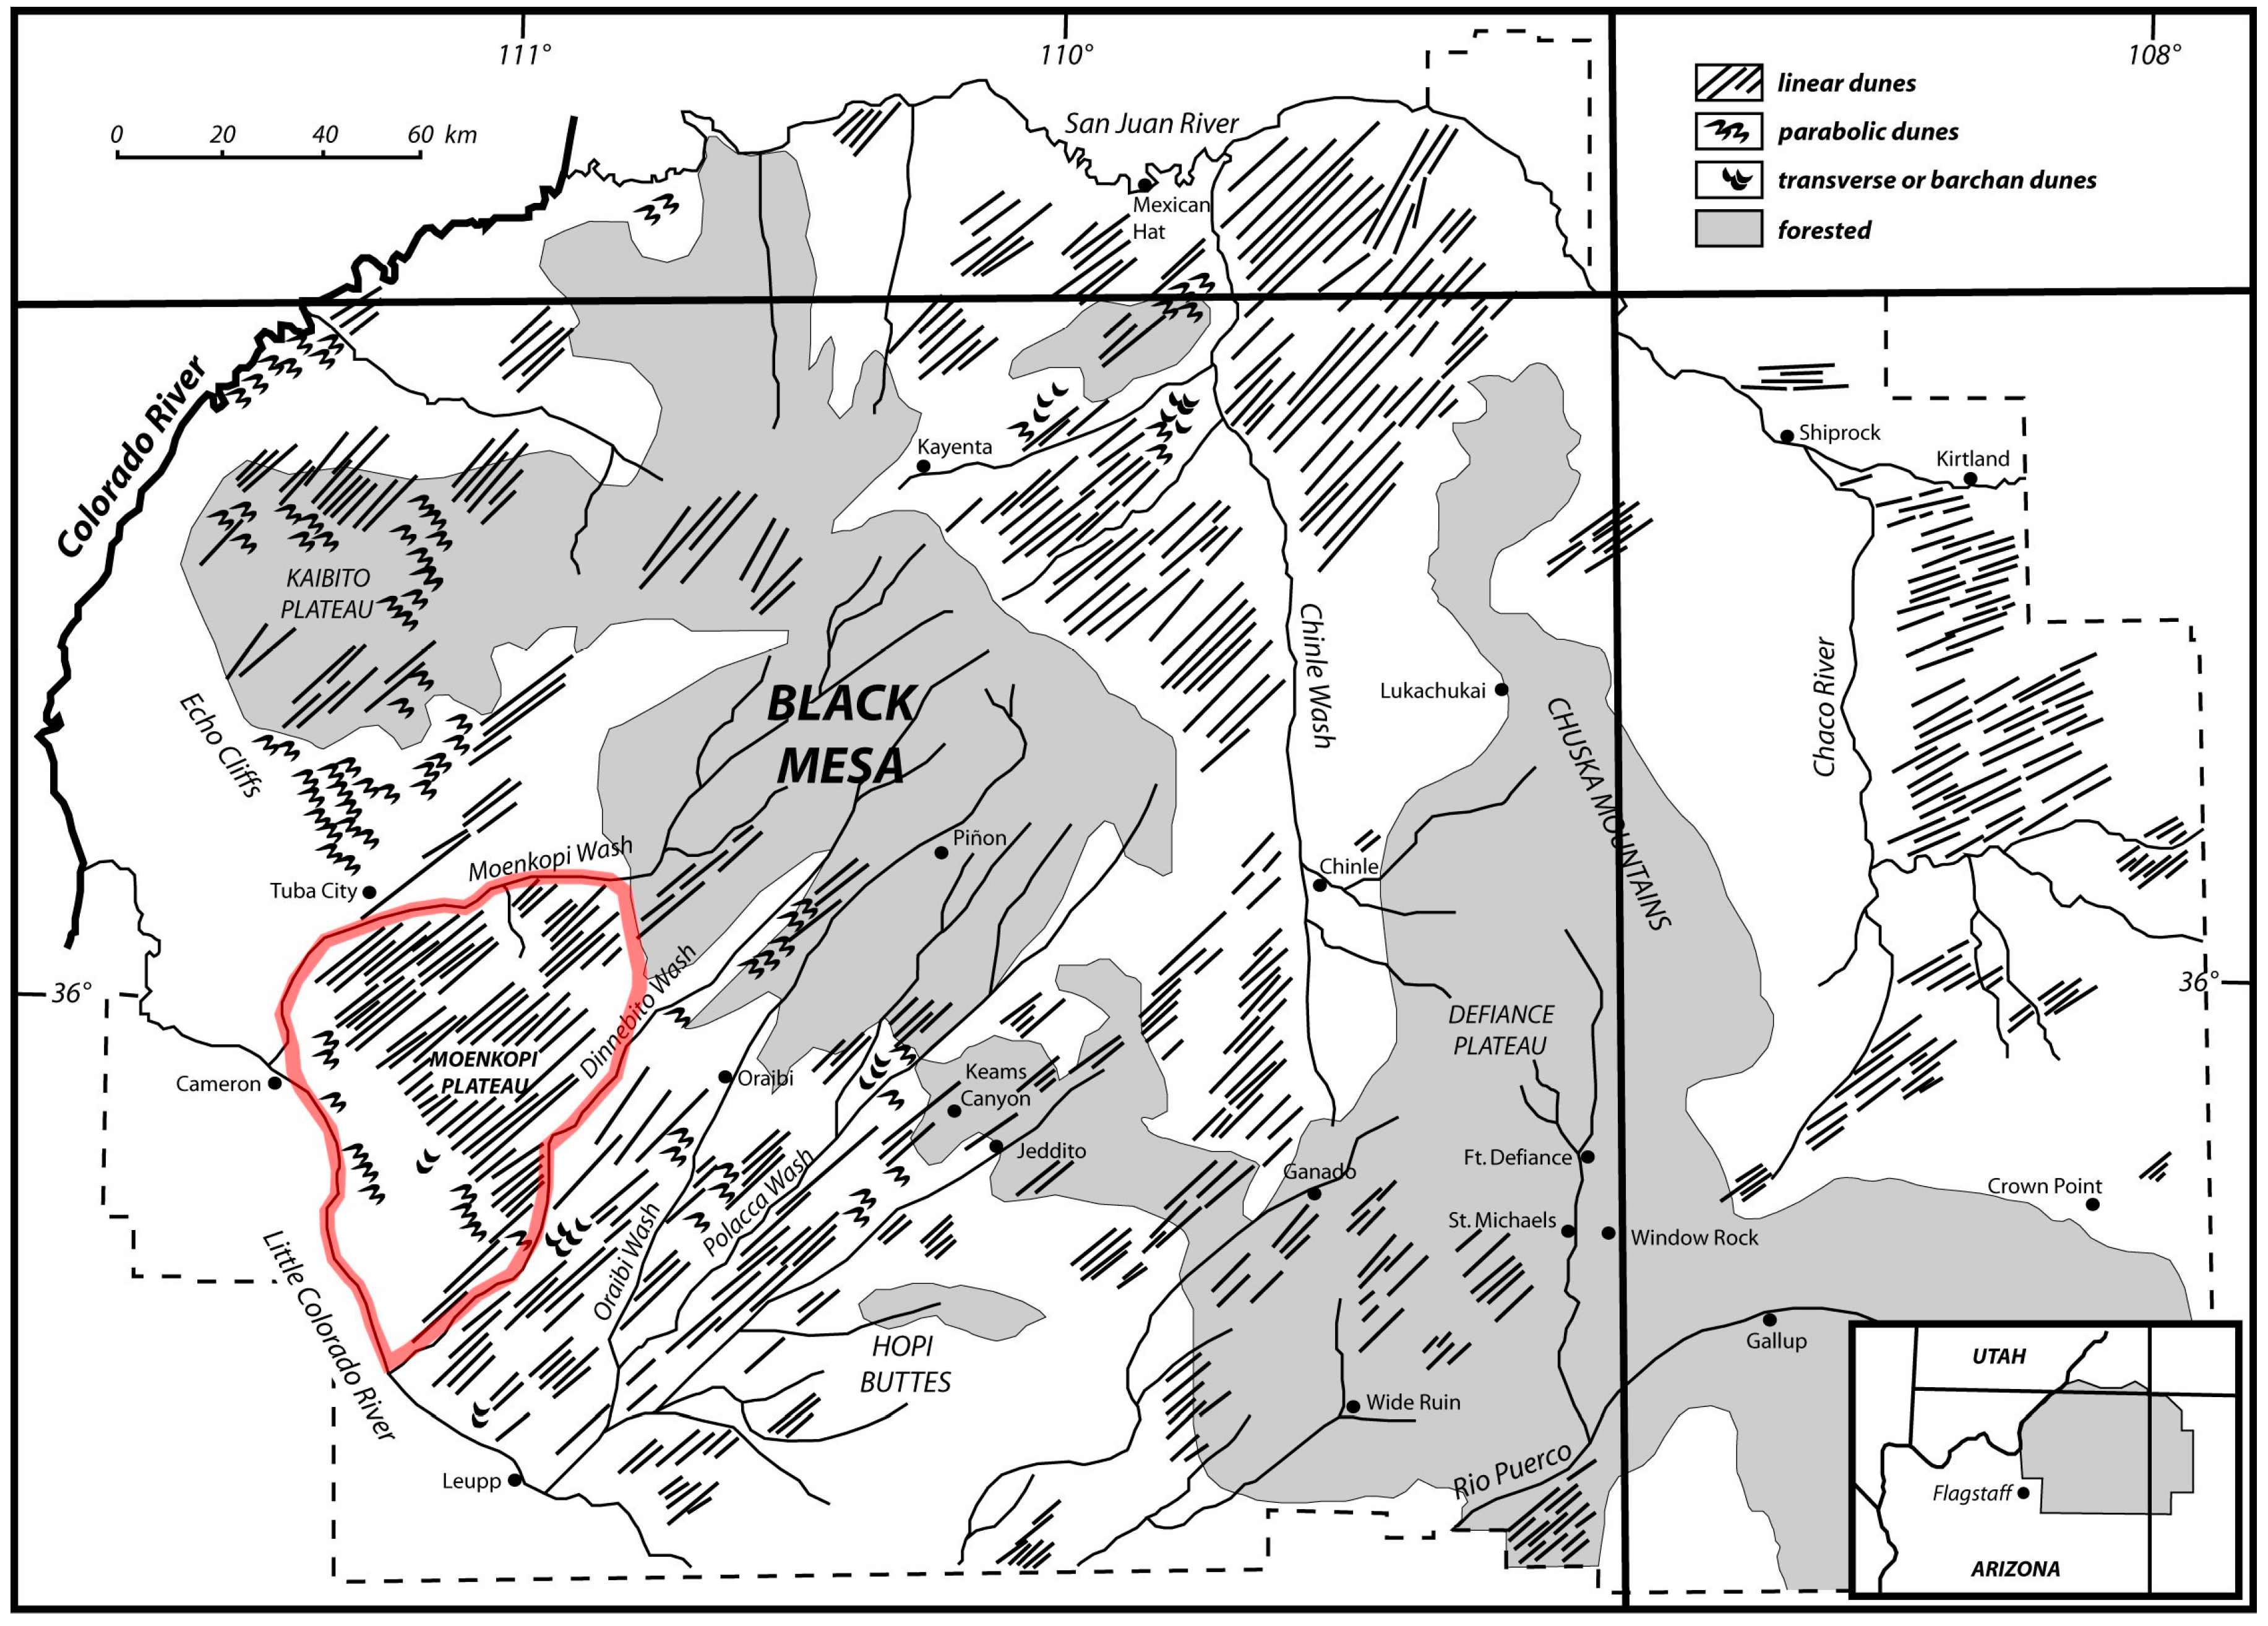
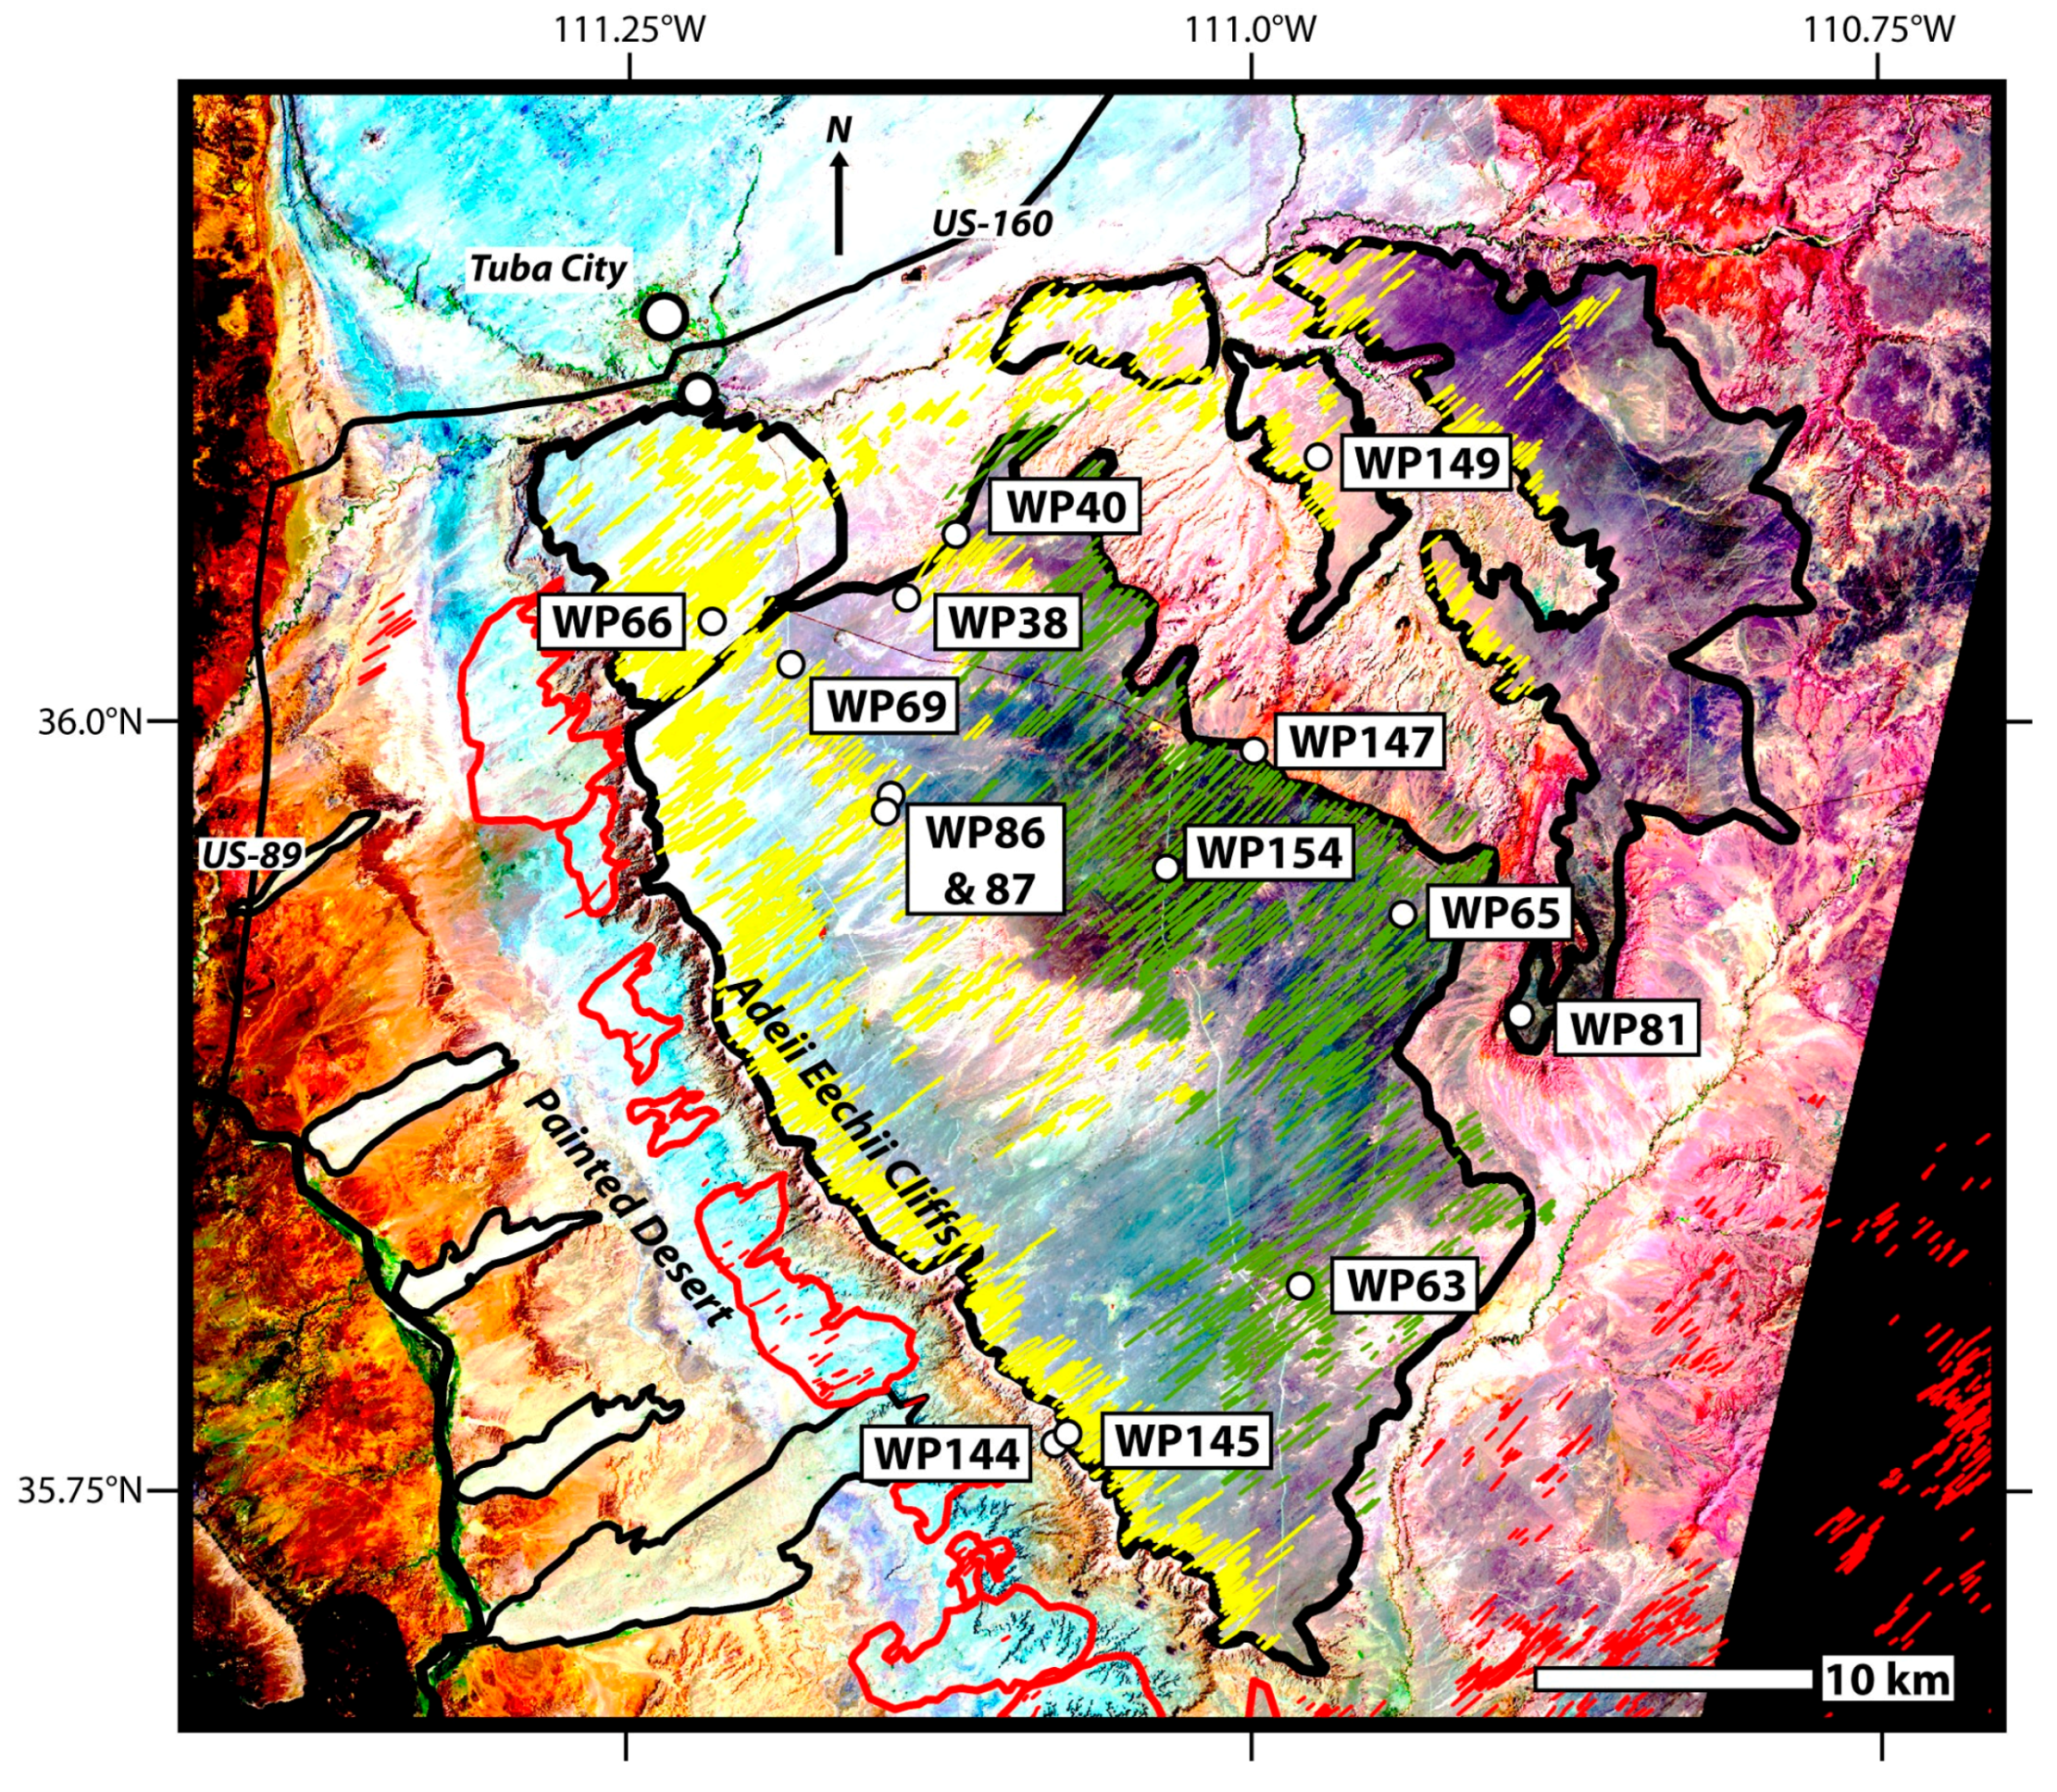
Upwind (southwest) of the Moenkopi Plateau, on the lower, more arid landscapes of the Painted Desert, linear dunes are uncommon and two major, dominantly active, aeolian map units were identified based on spectral response. Floodplain-adjacent dunes consist of thin sand sheets adjacent to local channels (Figure 4, polygons bordered by thin black lines). These sand sheets locally contain a wide variety of active aeolian landforms, such as barchan and parabolic dunes, small climbing and falling dunes, and complex dune forms that exhibit characteristics of more than one aeolian landform. Landsat imagery is particularly useful for mapping these floodplain-adjacent aeolian landforms because of their high spectral contrast with bedrock, suggesting that the source for these dunes is floodplain sediments of the Little Colorado River and its tributaries, not local bedrock. Where examined in the field, most floodplain-adjacent deposits are thinly vegetated (visually estimated at <20% cover) and significant pedogenic modification was either very weak (e.g., few, faint, incipient carbonate filaments) or absent (no significant structural development and no evidence of pedogenic carbonate). The other mapped aeolian unit in this landscape position, bedrock-adjacent dunes (red polygons in Figure 4), exhibits very little spectral contrast between bedrock and aeolian landforms; however, aeolian landforms are clearly identifiable in the 1 m DOQ mosaic. This unit is found exclusively within the section of the Jurassic Glen Canyon Group that contains the weakly cemented fine-grained aeolian sandstones of the Moenave Formation and the Wingate member of the Lukachukai Formation, which are dominantly composed of pale red to dark red or yellow quartz grains [18]. Grain size and composition of the active bedrock-adjacent dunes are essentially the same as the local aeolian sandstones.
Linear dunes and sand sheets are the predominant dune forms in the study area covering most of the surface of the Moenkopi Plateau, especially on slopes <5–10°. Linear dunes with active, lightly vegetated crests are easily identified on DOQs and Landsat imagery as bright northeast-trending streaks (mapped as yellow lines in Figure 4). Stabilized vegetated linear dunes and interdunes with moderate soil development (well-developed soil horizons with accumulations of pedogenic carbonate and translocated clay) appear much darker than active sparsely vegetated crests. Approximately 80% of Moenkopi Plateau aeolian deposits are stabilized; linear dunes with active crests are confined to areas immediately downwind of southwest facing escarpments (e.g., Adeii Eechii Cliffs and escarpments within the Coal Mine Canyon area) and the northwestern edge of the Moenkopi Plateau. Active linear dune crests are commonly 4–6 m above interdune area, whereas, in the stabilized parts of the study area, dune crests are typically only ~1–2 m high (green lines in 
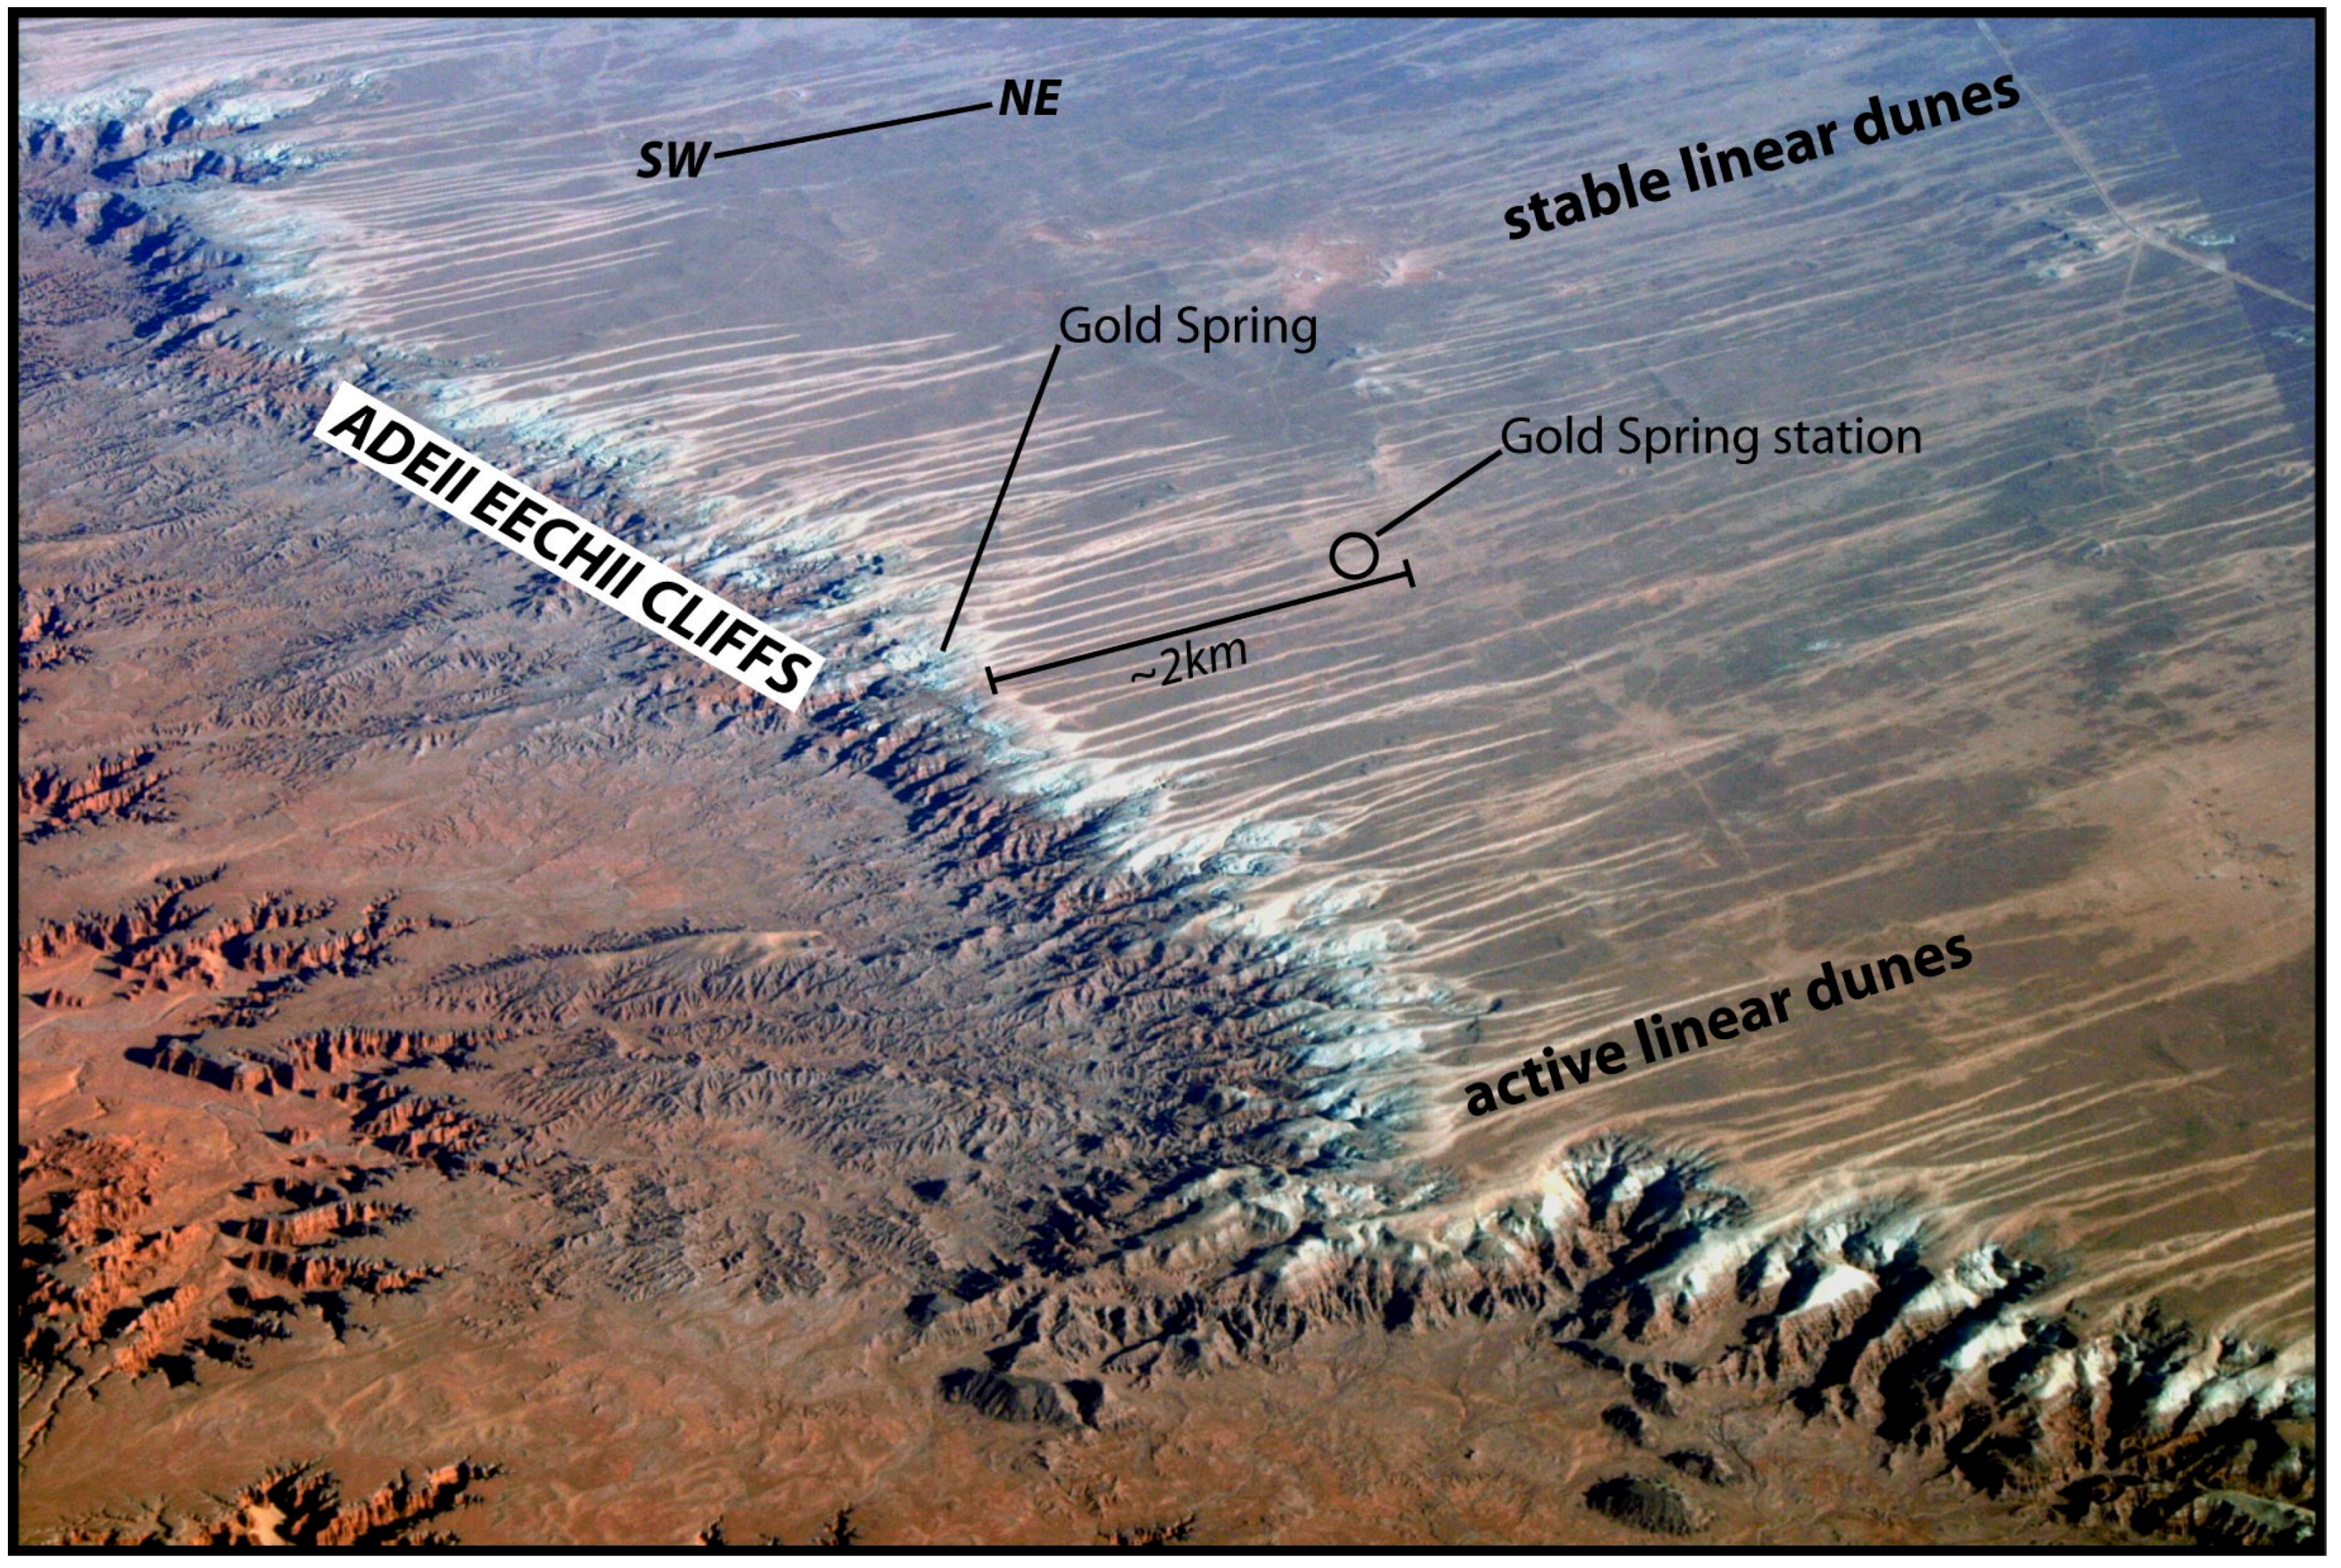
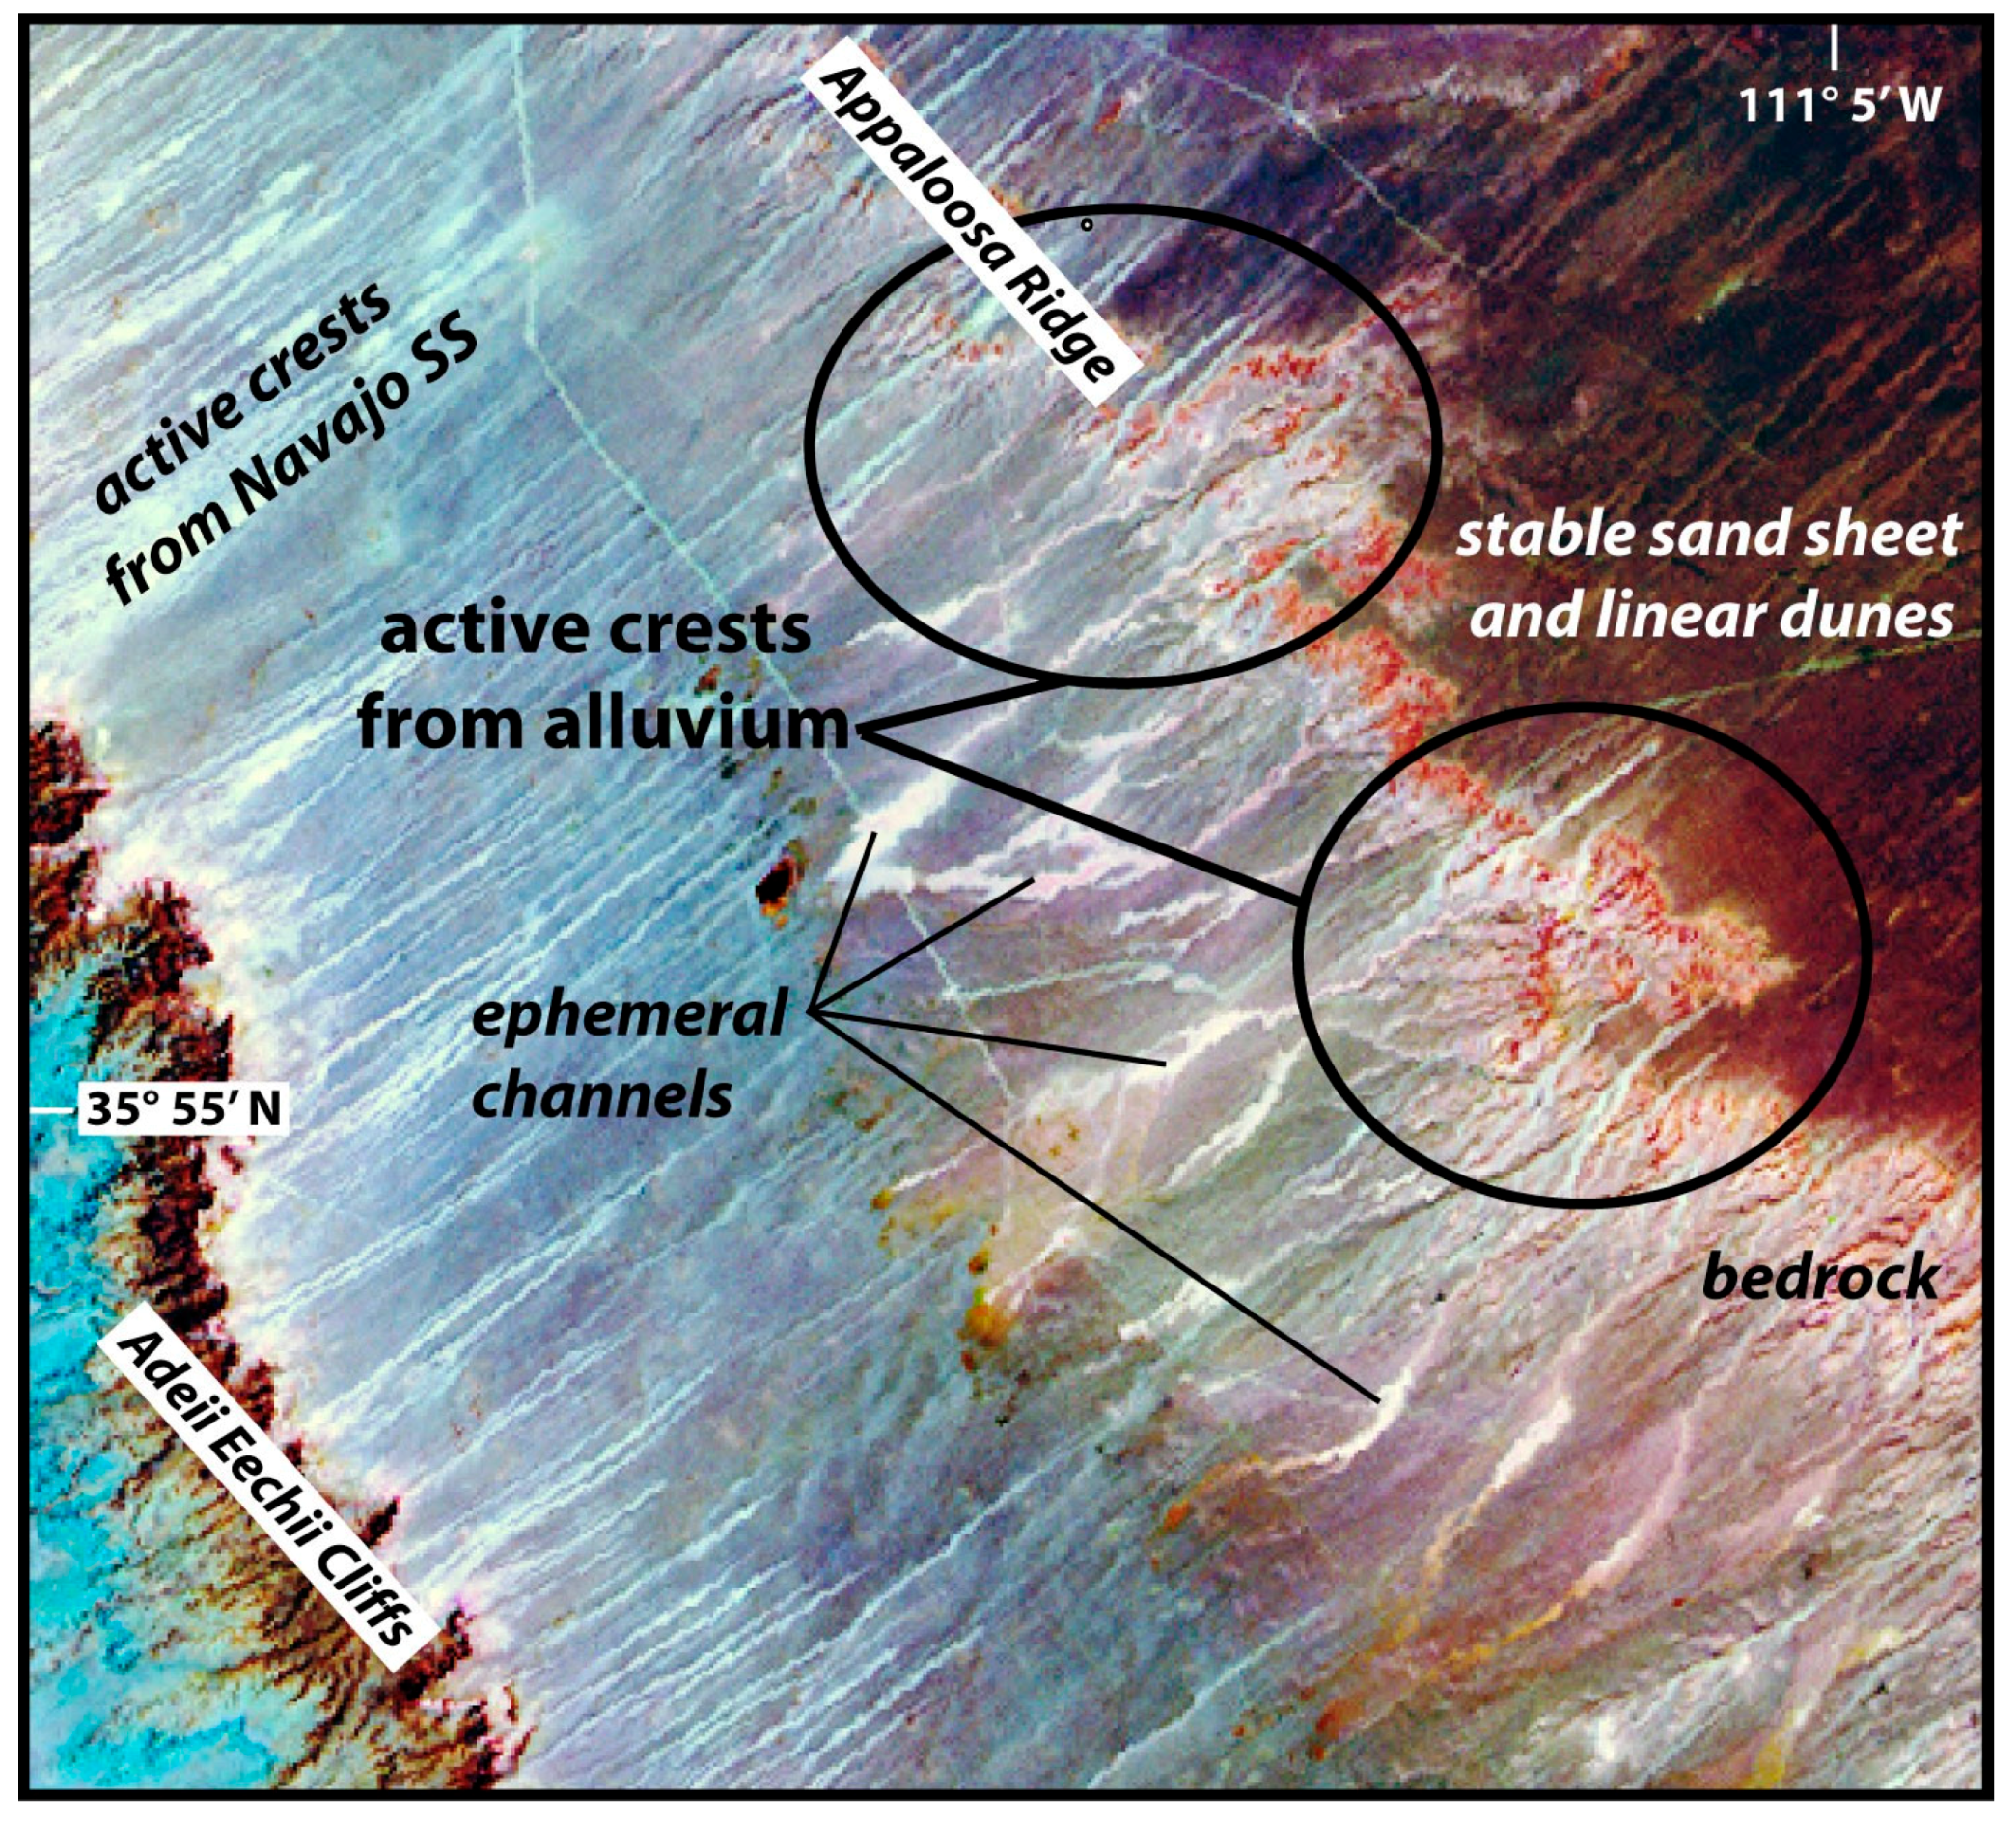
Figure 4). Image analysis shows that active linear dune crests along the Adeii Eechii Cliffs have similar spectral response to outcrops of the white Jurassic Navajo Sandstone positioned immediately upwind of active dune crests; active linear dune crests are also observed downwind from alluvial channels that drain bedrock slopes of Appaloosa Ridge towards the southwest (Figure 5).
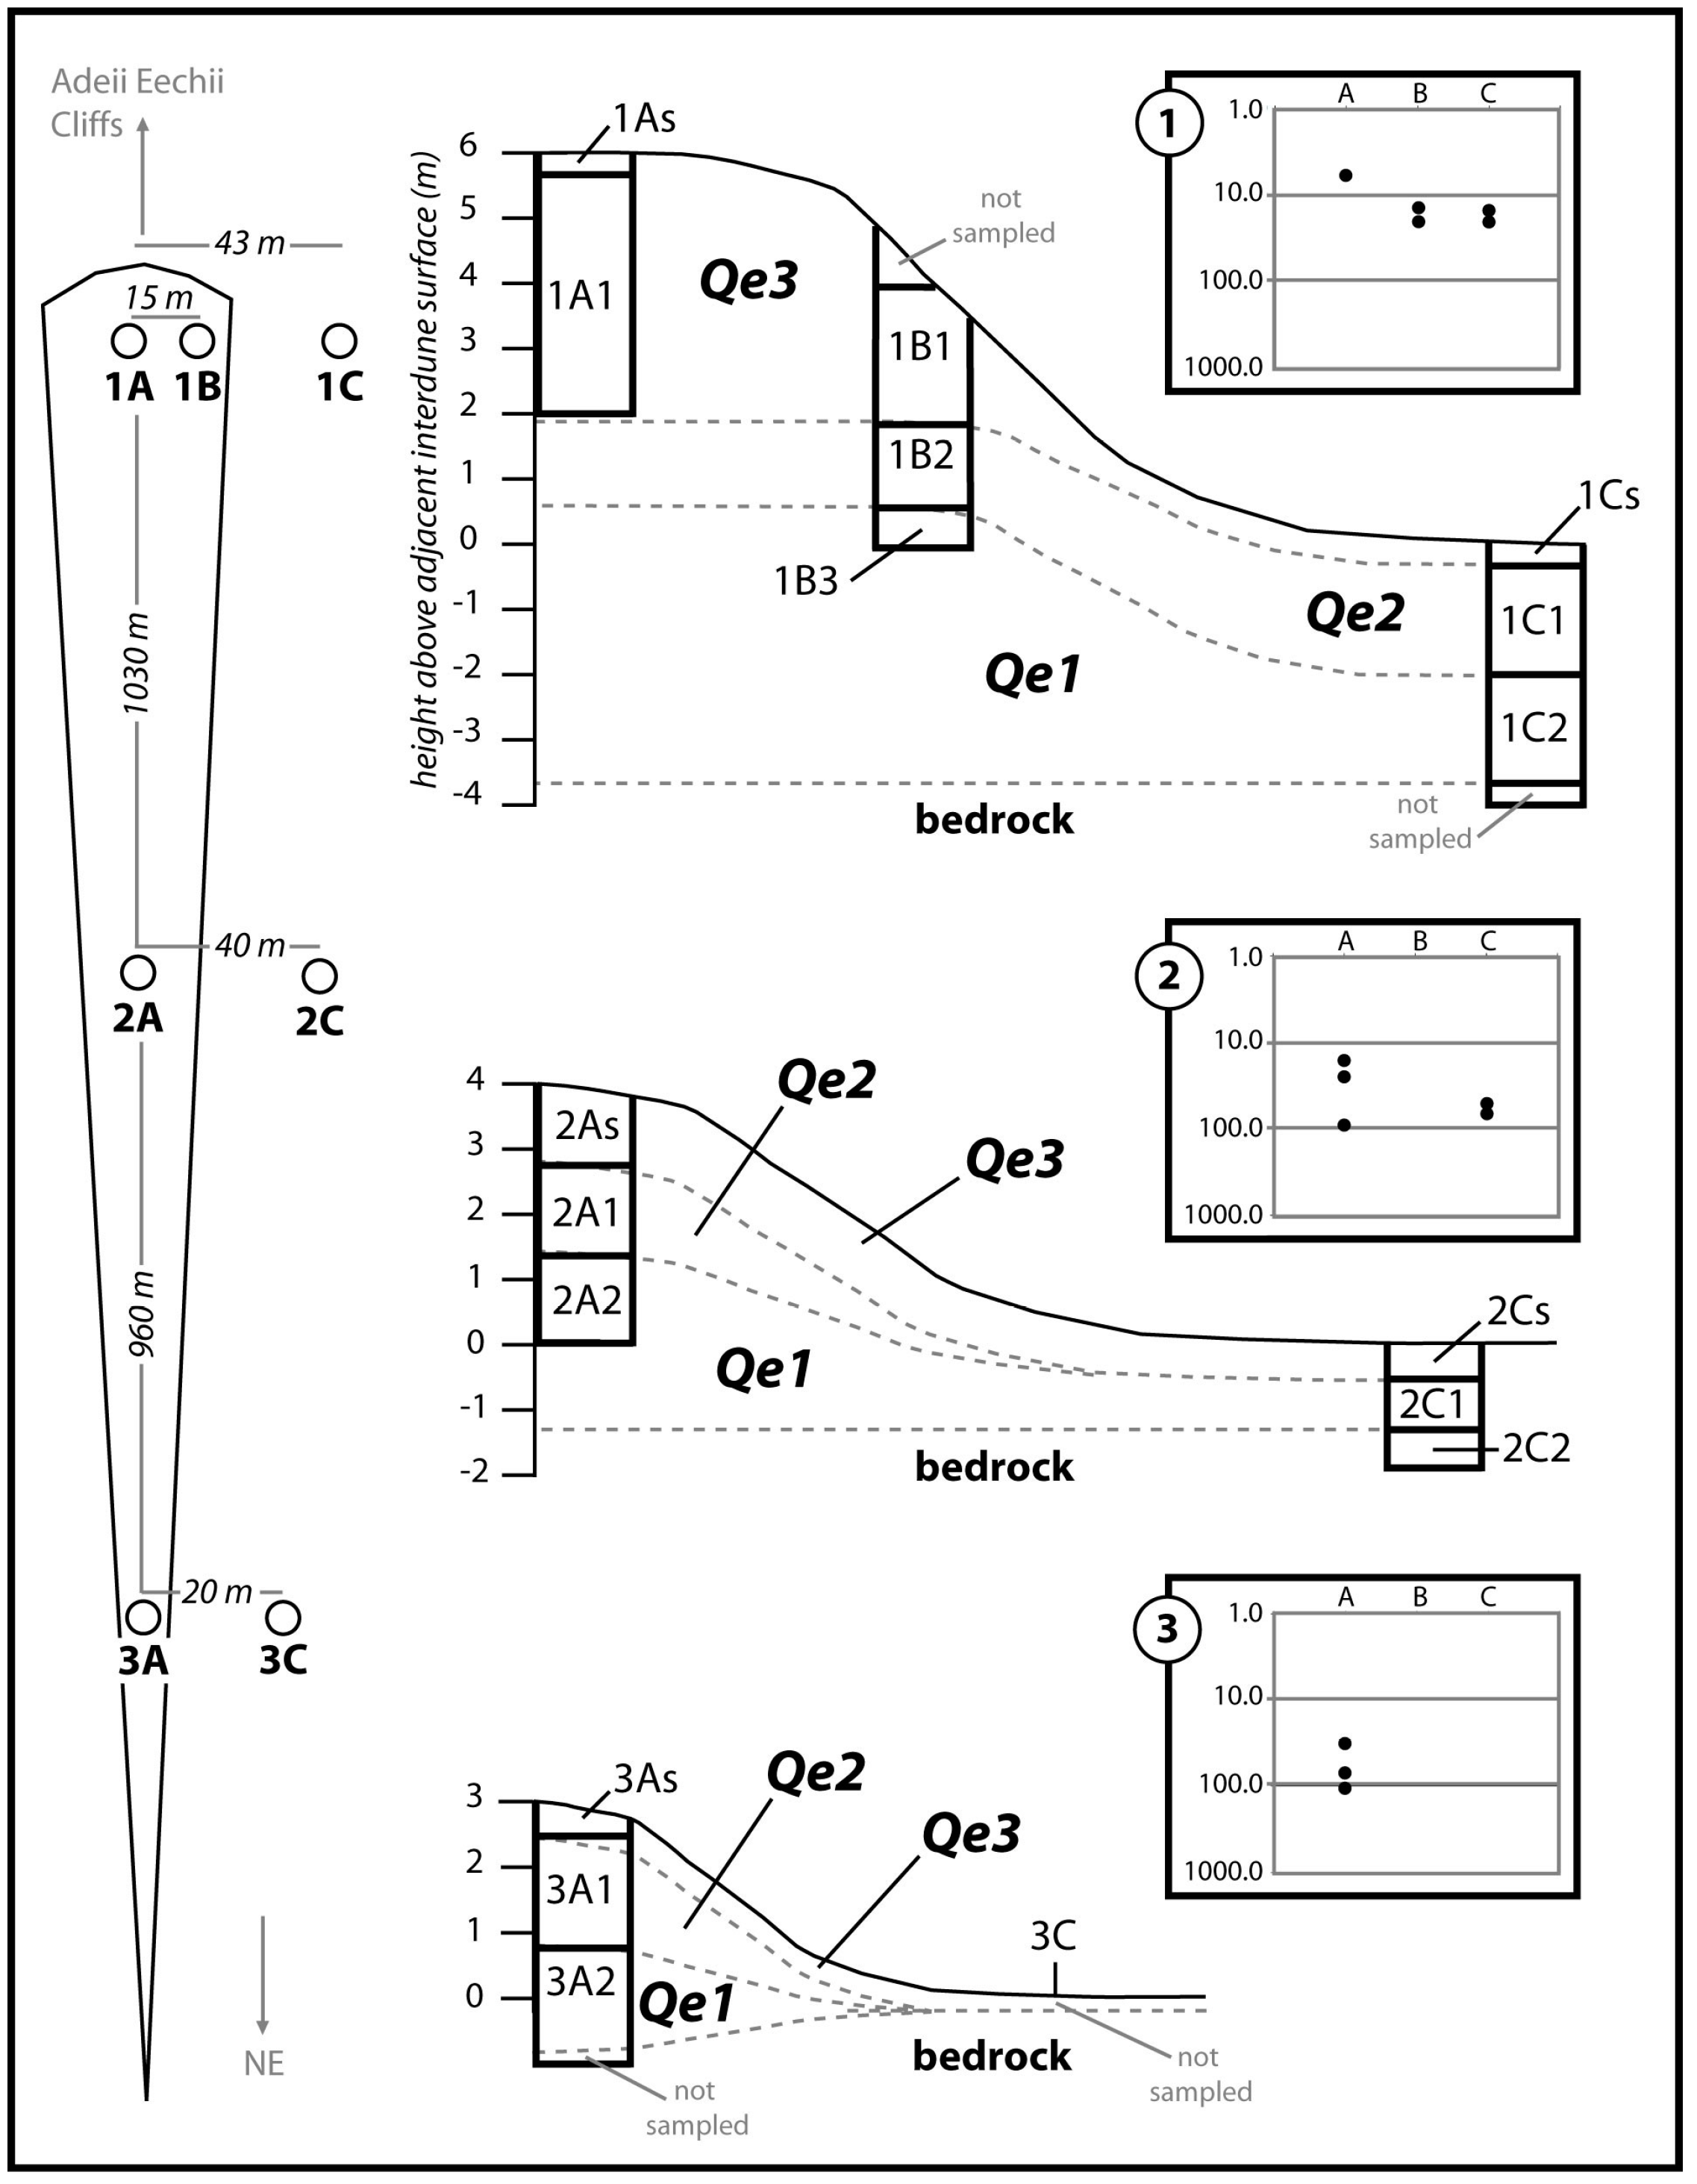
Our examination of the linear dune sediments near the Gold Springs meteorological station revealed that sand on the crest of the linear dune is very similar in grain size, sorting, and rounding to the Navajo Sandstone [18], outcrops of which are heavily fluted along the Adeii Eechii Cliffs. Crest sand samples (1A) have the lowest magnetic susceptibility values, which are most similar to Navajo Sandstone (inset charts in Figure 6), and do not contain the clear red quartz grains common in the other cored units (Table 1). From the first transect to the third, surface crest samples become redder and magnetic susceptibility values and vegetation density increase with distance downwind from the Adeii Eechii Cliffs (Table 2). In general, soil and sediment colors get redder with depth in all cores except the crest core at the head of the dune. Red quartz grains become more common both downwind and with depth in cores, suggesting mixing in the downwind direction and change in sediment source with depth. Field textural classifications show that active crest samples are classified as sand, but units below have increasing amounts of silt and clay. Effervescence and estimated carbonate stage increase with depth, as do magnetic susceptibility values, suggesting increasing concentrations of magnetic phases (e.g., hematite) presumably as dust is incorporated into older deposits that have undergone pedogenesis. The rate of change of described characteristics along the dune crest is much less than the rate of change from dune crest to interdune or the rate of change with increasing depth at any core site except 1A. In all cases, the oldest eolian sediments in the study area based on soil characteristics and OSL ages (see Qe1 below), contain fine, rounded, frosted, clear red quartz grains that based on petrographic analysis [18] are likely derived from either the late Triassic- early Jurassic Wingate Formation or Moenave Formation sandstones and not from the Navajo Formation Sandstone. Well log analyses suggest that the combined alluvial and aeolian cover on the Moenkopi Plateau can be up to 10 m thick in places [14], however, this pilot study indicates that aeolian sand along the Adeii Eechii escarpment is less than 4 m thick in the interdune position and thickest (6–10 m) along the linear dune crests. Alluvium was not observed at this site.
During field reconnaissance and site selection, we observed that almost all aeolian sediments on the Moenkopi Plateau had some component of the fine, rounded and frosted, clear red quartz grains shown to be derived from the aeolian sandstones located between the Little Colorado River and the Moenkopi Plateau [18]. The only exceptions were sites in the most active linear dunes (e.g., the uppermost ~90 cm at WP38, the top ~240 cm at WP63, and the entire section at WP149). WP38 is located downwind of an active channel eroding Jurassic sandstones and WP63 is located immediately upwind of heavily fluted exposures of the Navajo Sandstone. WP149 is located along an escarpment of Coal Mine Canyon that exposes strongly fluted upper Jurassic sandstones and active but small climbing dunes. The latter dunes are observed upwind of linear dunes with active crests. Proximity suggests a very local source for sand at these locations.
Climbing dunes or sand ramps are not observed along the majority of the Adeii Eechii Cliffs, except as small, eroded remnants (e.g., WP144). One exception is a climbing dune that occurs near the northwestern end of the escarpment (where the red polygon adjoins the thick black polygon, southwest of WP66 in Figure 4). Active sand (correlated to Qe3 below) immediately downwind of the ramp is spectrally similar to both the ramp and Moenave outcrops, suggesting a mainly local (immediately upwind) source for the sand composing the climbing dunes and the sand along the northwestern edge of the Moenkopi Plateau.

4.2. Aeolian Stratigraphy, Generalized Soil Characteristics, and Unit Ages

Extensive field reconnaissance led to identification of fourteen sites on the Moenkopi Plateau (Figure 4) with characteristics representative of aeolian soil stratigraphy observed throughout the study area. Soil profiles were exposed and described at each site and dominant vegetation was identified and recorded (Table 3). After extensive field work, dominant vegetation and vegetation density became useful in predicting the degree of soil development in underlying aeolian deposits before excavating soil pits. For example, vegetation density is highest on the stabilized dunes with the greatest soil development (the oldest deposits) and vegetation density is lowest, but biodiversity is highest, on active linear dune crests.
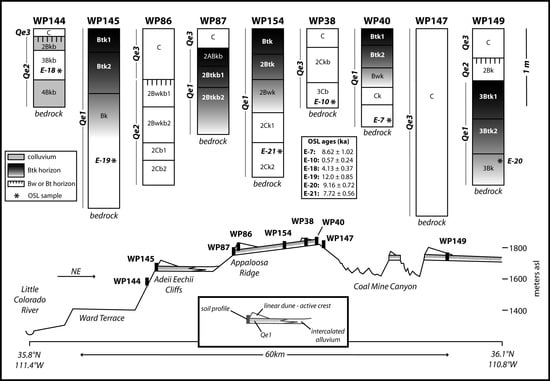
Soil profiles on the Moenkopi Plateau were grouped into three major units (Qe1, Qe2, and Qe3, from oldest to youngest) on the basis of patterns of soil and sediment characteristics, image analysis, vegetation type and density, and OSL dates. The related development of soil structure, consistence, and oriented clay films [33] were particularly good indicators of the relative ages of aeolian deposits. Three aeolian units were defined using these criteria before OSL ages were obtained; those dates confirmed the original relative age ranking.
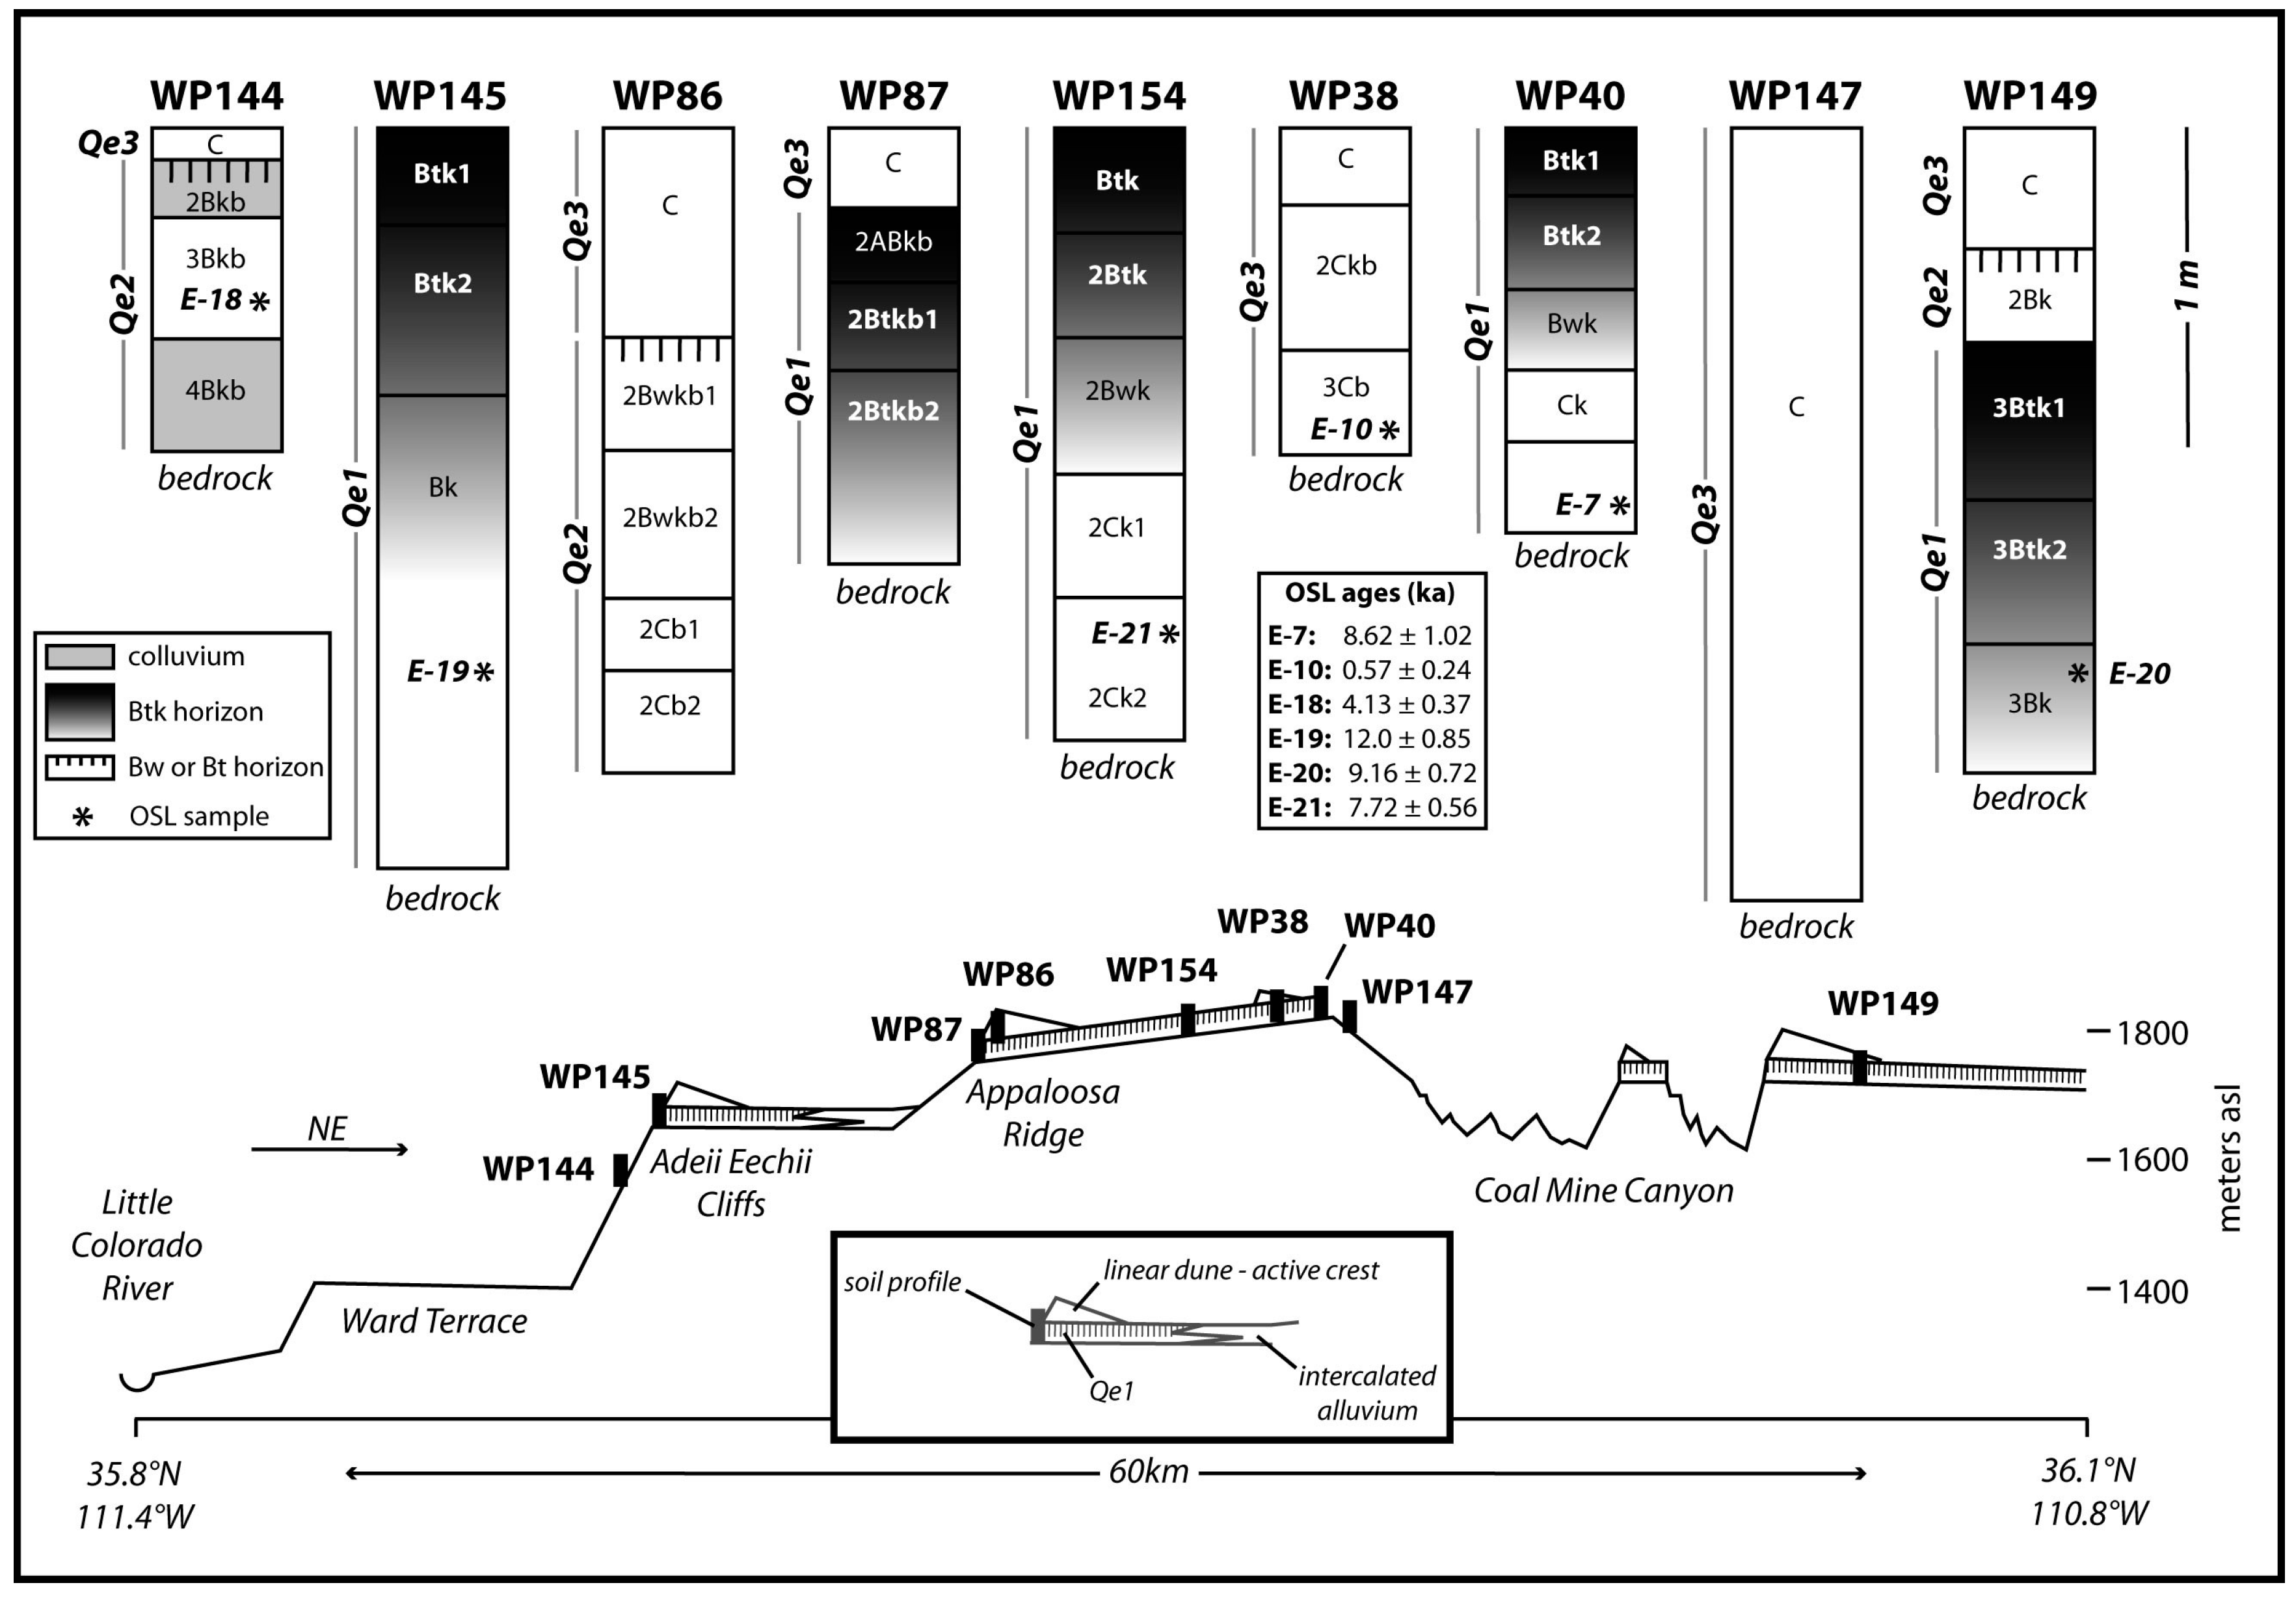
The most spatially and volumetrically extensive aeolian deposits on the Moenkopi Plateau exhibit the strongest soil development and oldest OSL ages. The unit associated with these deposits, Qe1, occurs as sand sheets with low relief linear dune crests mantling bedrock to an average thickness of 2–3 m. Six of fourteen representative soil profiles (WP40, 81, 87, 145, 149, 154; Figure 7) show that this unit is generally characterized by stage II calcic horizons [34] and weak to moderate argillic horizons based on soil morphology and particle size distribution (Table 4) [
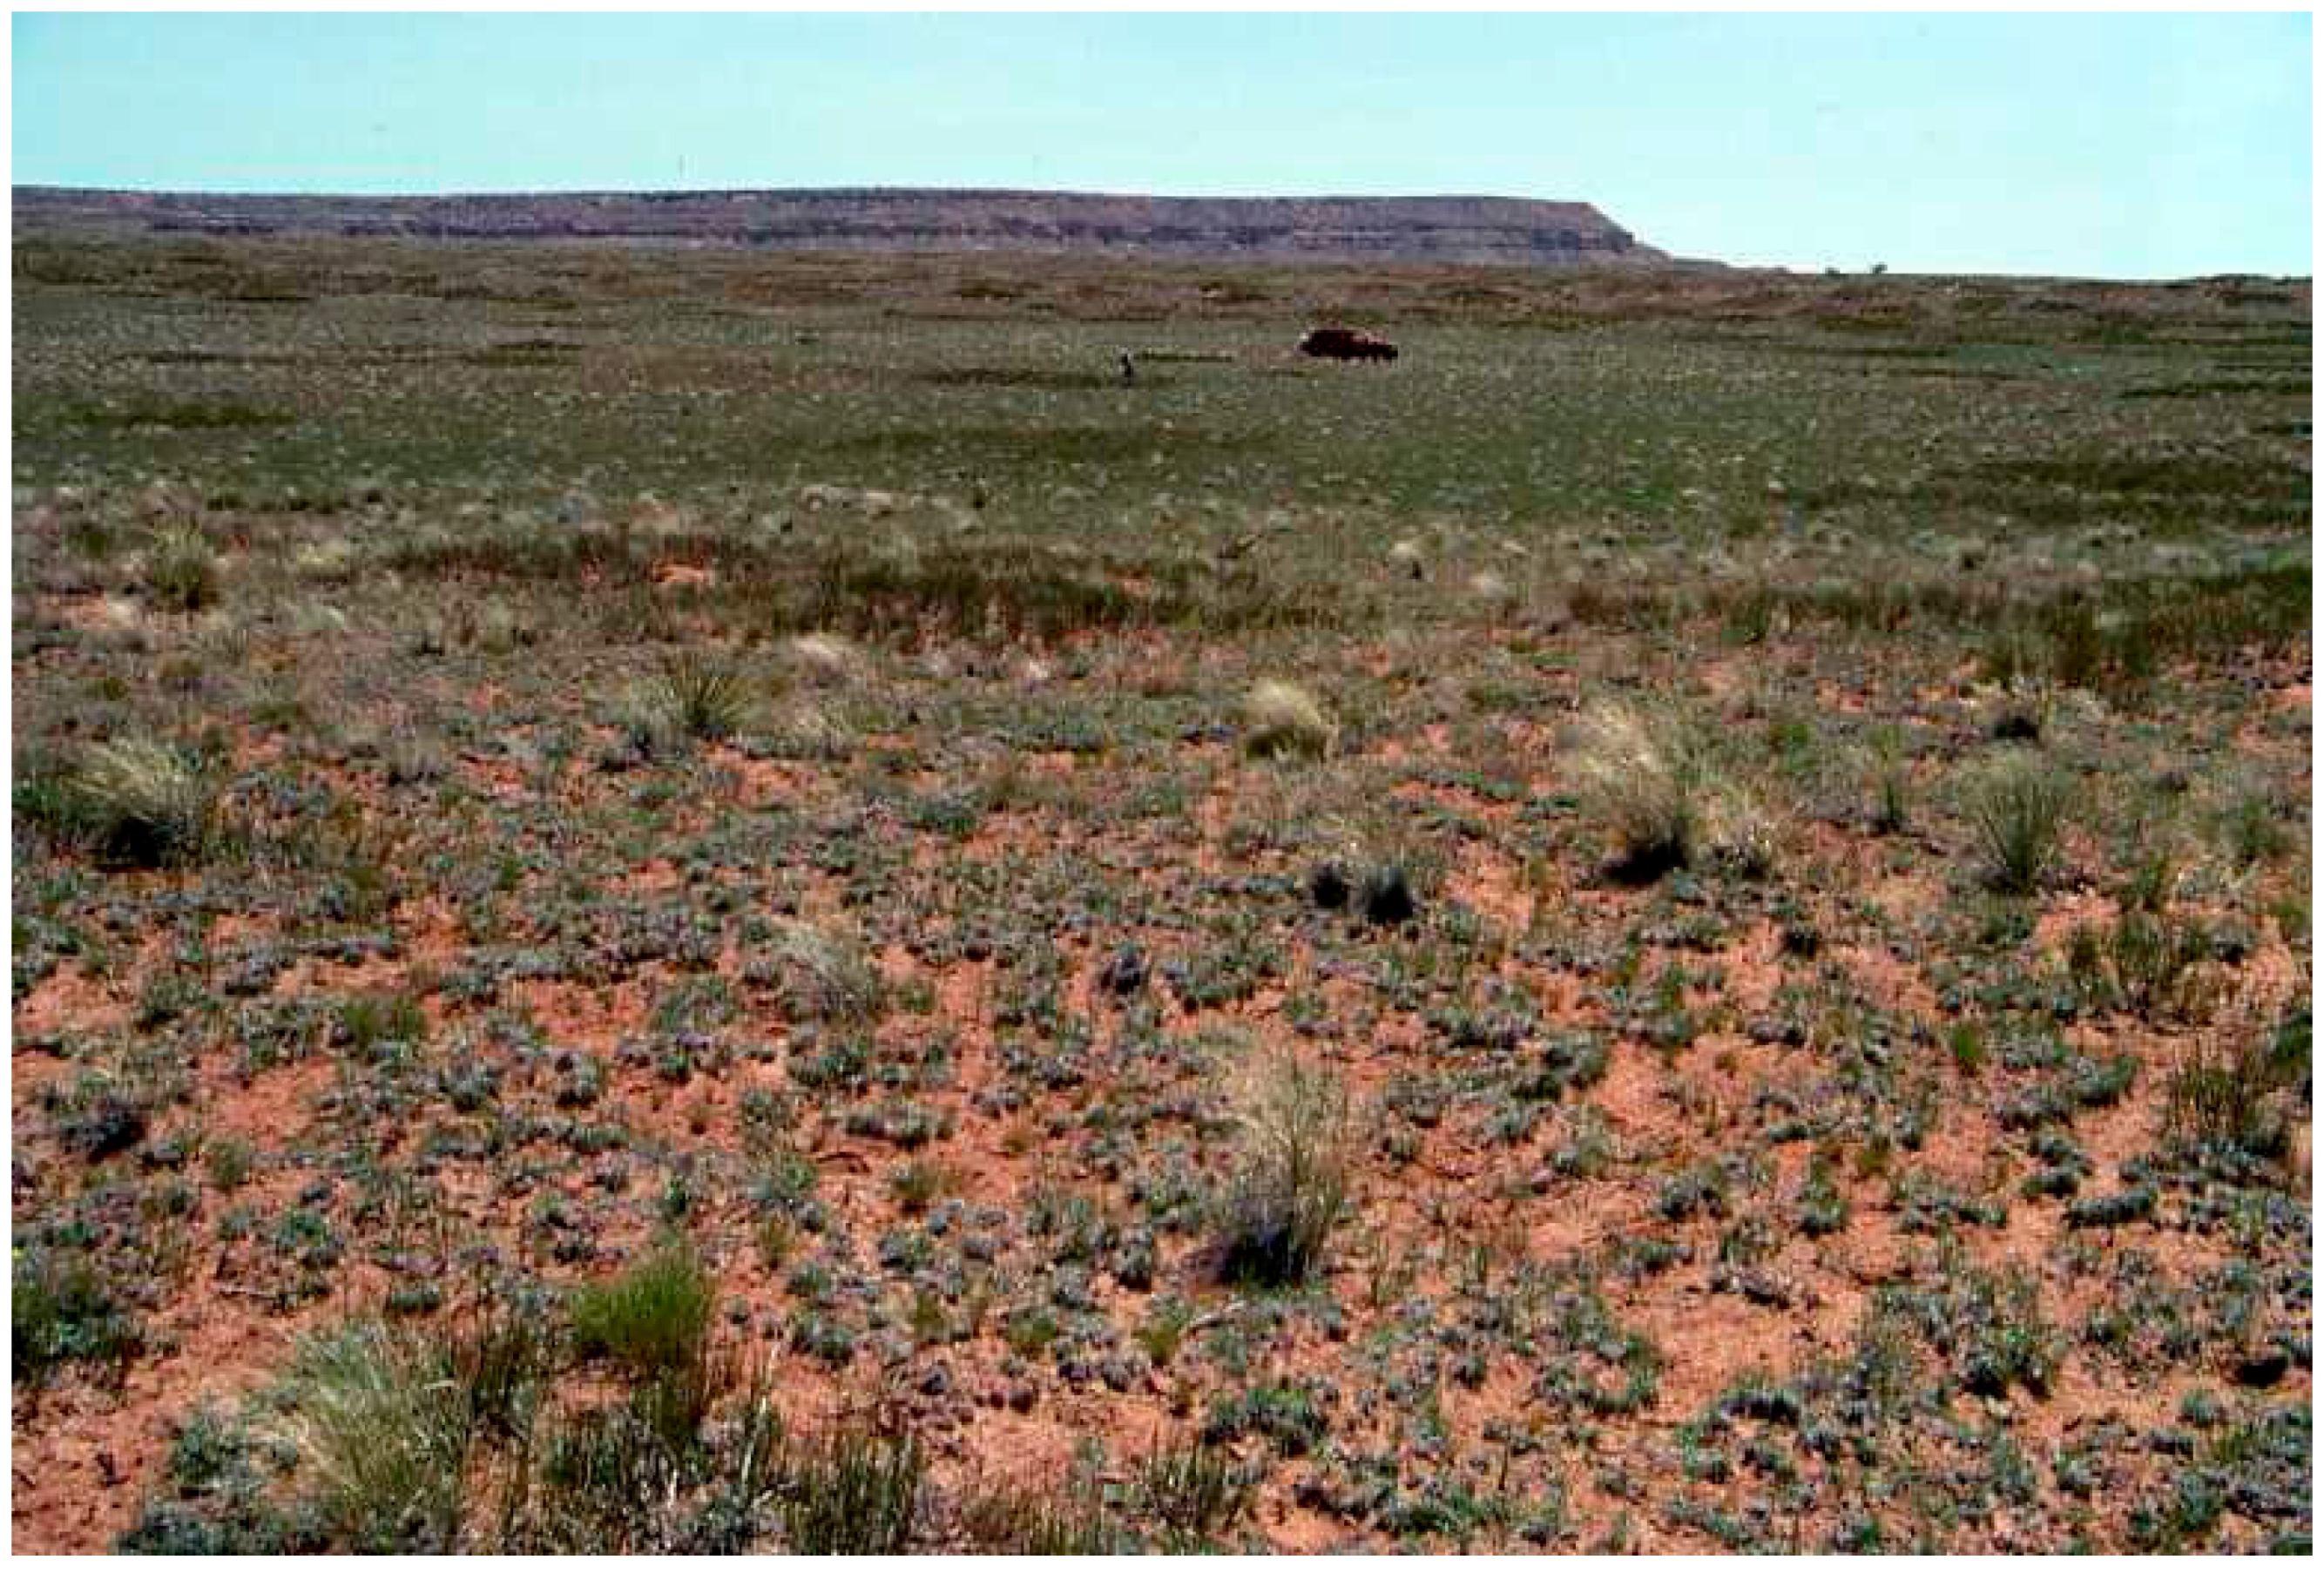
47]. Where the sandy parent material was not pedogenically modified throughout, the unmodified sediment colors range from yellowish red to brown (5YR to 7.5YR). Any original stratigraphy within deposits of unit Qe1, such as cross bedding, has been completely obliterated by subsequent pedogenesis and bioturbation. These stable aeolian landforms currently sustain a relatively dense B. gracilisP. jamesiiEphedra spp.—Yucca spp. community (~50–80% cover; Figure 8; Table 5), except where overlain by younger soil-stratigraphic units. OSL ages for the Qe1 soil stratigraphic unit range from ~12 to 7.5 ka (E-7, E-19, E-20, E-21; Table 5).
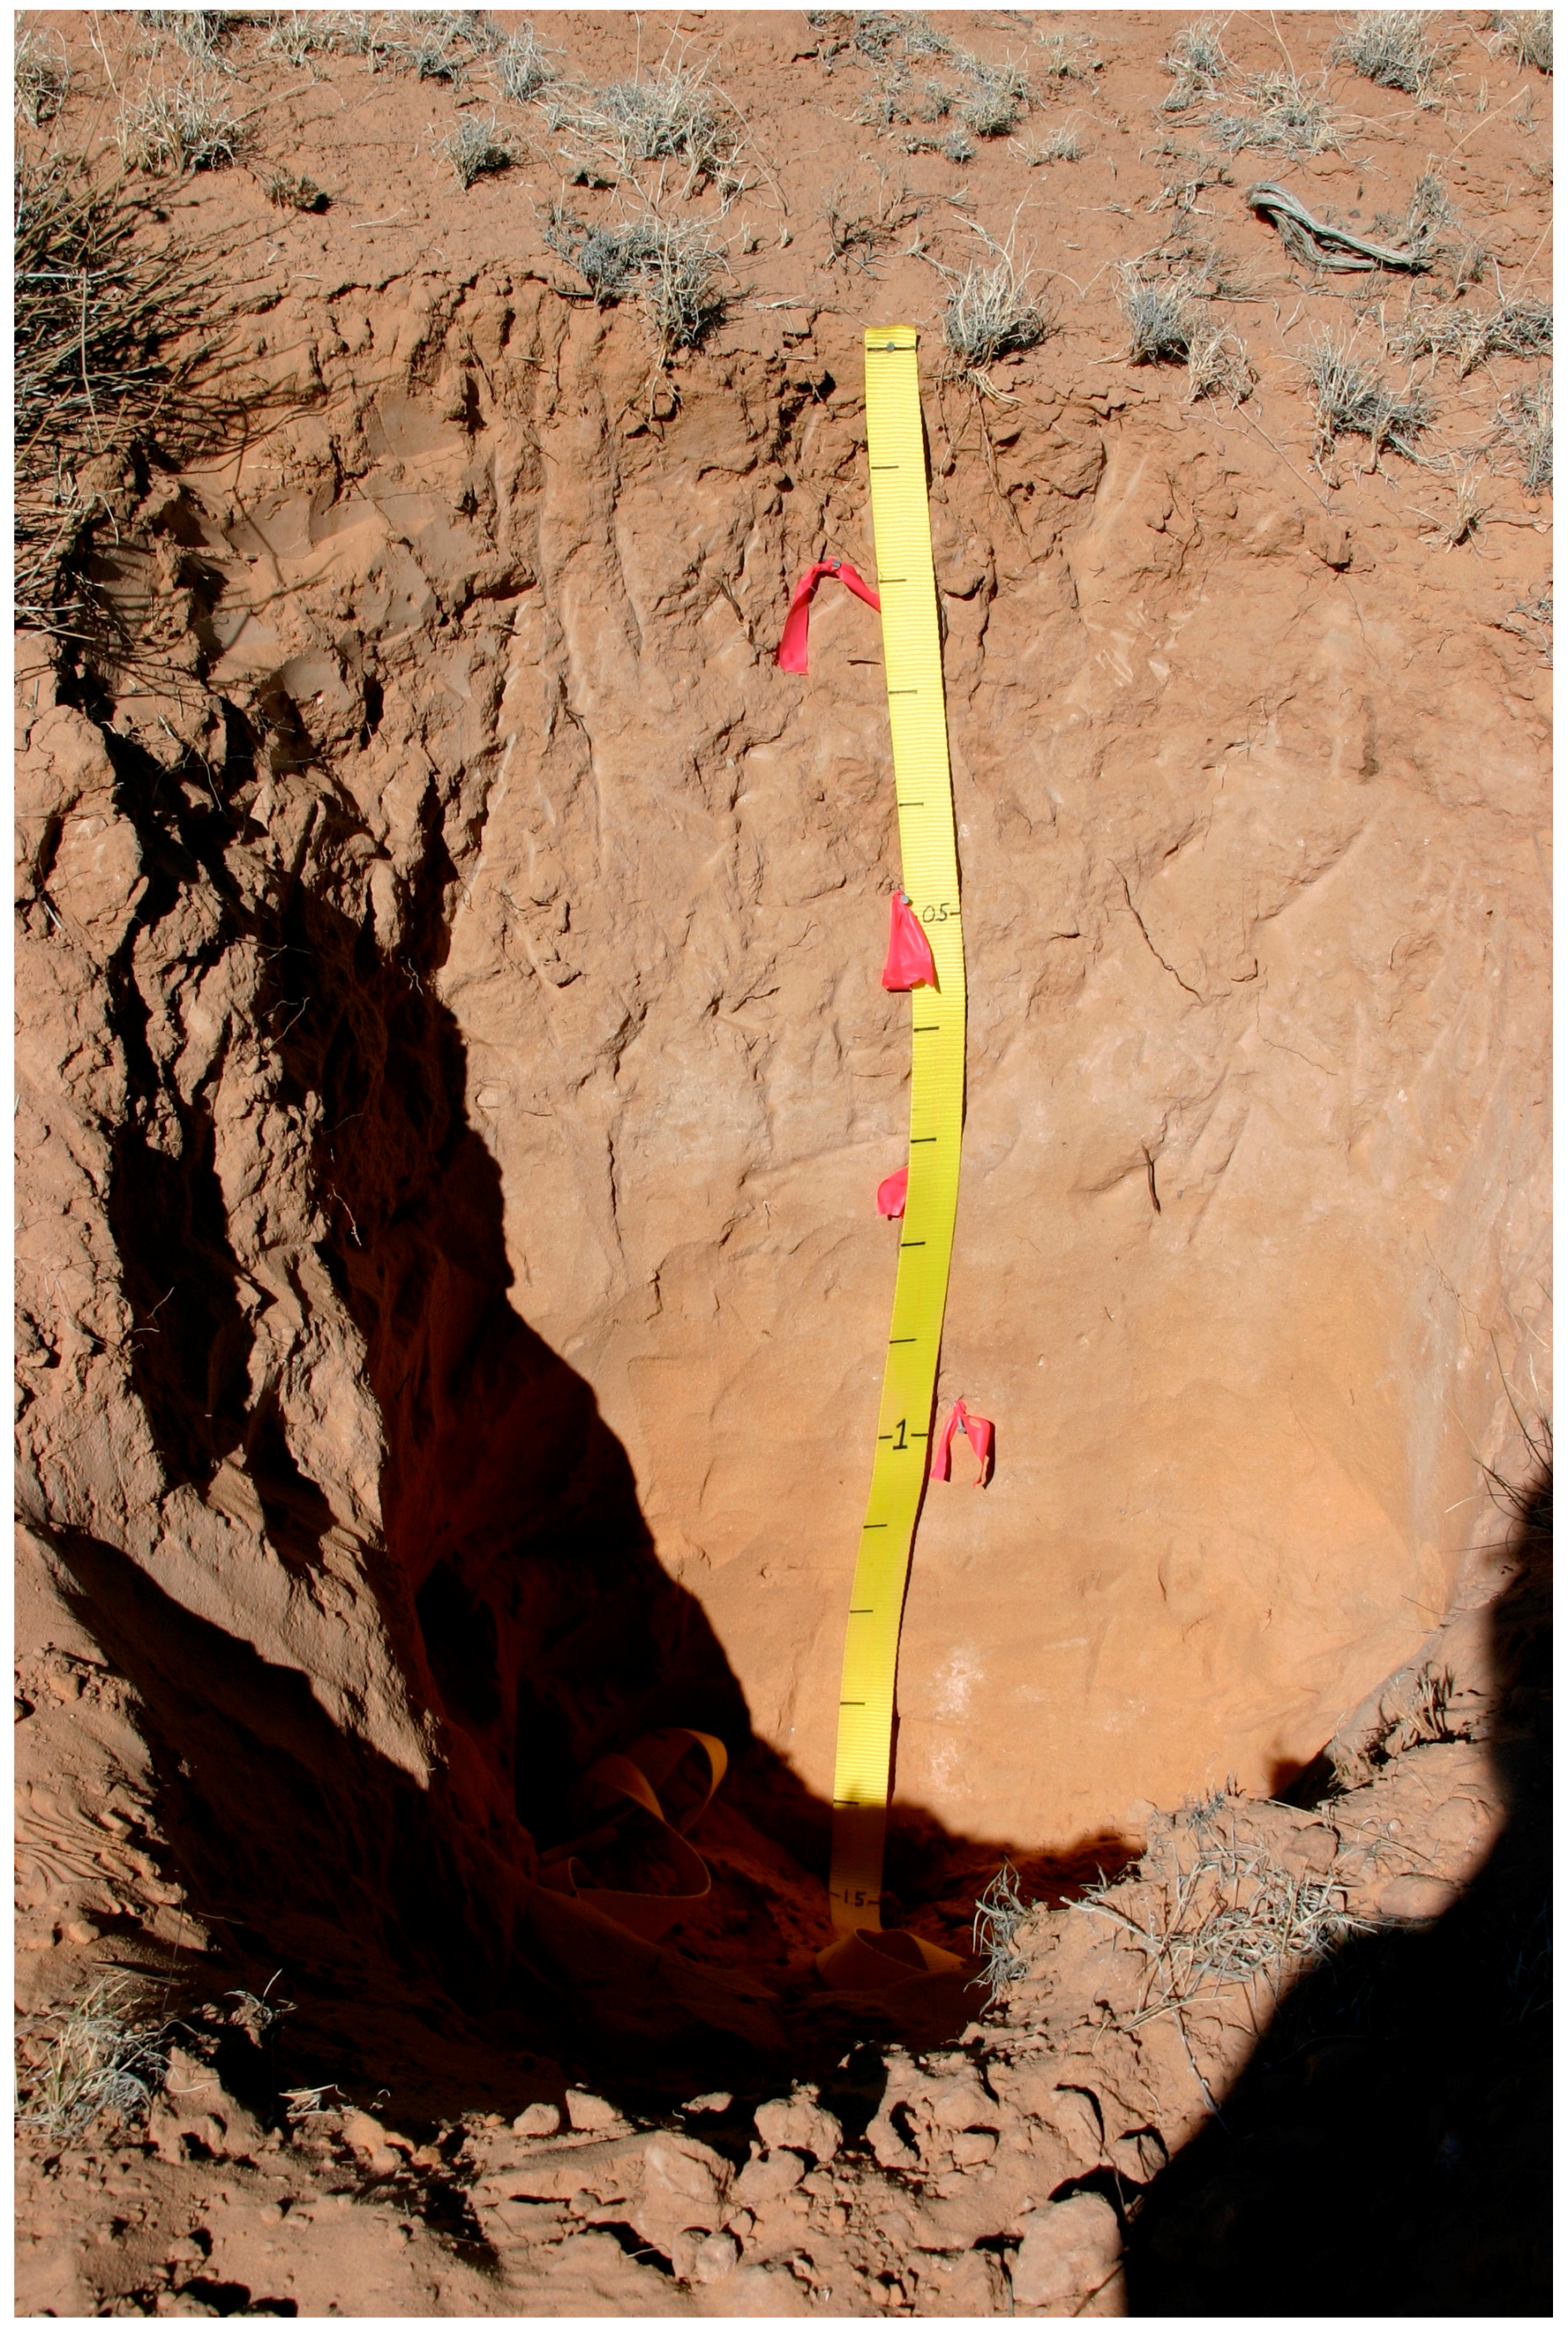
Qe2 has only been observed as a buried soil in this study area and is therefore solely identified on the basis of soil attributes observed in exposures and excavations. Because Qe2 is not exposed at the surface, it is not identified from its associated biotic community, vegetation density, distinctive aeolian landforms or patterns in imagery. Qe2 is the least extensive unit observed in the study area, only slightly more pedogenically altered than the youngest unit (Qe3) and observed and described only in trenches that expose the interior of active linear dune crests or in uncommon blowouts. Seven soil pits expose Qe2 deposits (WP63, 65, 66, 69, 86, 144, 149; Table 2) and are characterized by calcic horizons with stages that range from I− to I+ (Bk horizons) and B-horizon reddening (Bwk horizons). Qe2 is capped with weakly to pedogenically unmodified sand (Qe3, discussed below; Figure 9) along linear dune crests and is therefore associated with the high-relief landforms and vegetation patterns characteristic of active linear dune crests of Qe3 age. Qe2 deposits yield OSL ages of ~4.2 to 3.5 ka (E-6, E-9, E-18; Table 5).
The unit designated Qe3 includes the most recently deposited aeolian deposits associated with currently active aeolian landforms. Qe3 deposits occur in all landscape positions and are associated with the widest variety of aeolian landforms observed in the study area despite their relatively small volume. Qe3 exhibits the widest range in parent material colors from yellowish red, to brown, to yellowish brown (5YR, 7.5YR, 10YR), reflecting varied sediment sources, and either very weak color or soil carbonate stage development (incipient B horizon; Figure 9) or show no discernable pedogenesis. As a result, subtle sedimentary structures, such as trough and low-angle cross bedding, are only observed and/or preserved in Qe3 deposits. Qe3 is usually expressed on the Moenkopi Plateau as active linear dune crests ~1–2 m thick over previously stabilized (Qe1 and/or Qe2) linear dune crests. Active linear dune crests are up to 6 m higher than the interdune elevation, thinly vegetated (<30%) landforms that support a variety of grasses (e.g., Muhlenbergia pungens, Pleuraphis jamesii, Oryzopsis hymenoides), sand-adapted perennials (e.g., Tripterocalyx cyclopterus, Penstemon ambiguous, Poliomintha incana), and a wide variety of annual herbaceous plants, though only dominant plants were recorded. Phytogenically induced accumulations of aeolian sand beneath canopies of Ephedra sp. (coppice dunes) are common on linear dune flanks where crests are active. Though not described, field reconnaissance observations suggest that most aeolian landforms and deposits upwind from the Moenkopi Plateau, in The Painted Desert between the Little Colorado River and the Adeii Eechii Cliffs, cluster within unit Qe3. Three OSL ages (E-4, E-5, and E-10; Table 5) show that sampled sediments with Qe3 characteristics are younger than 2.8 ka.
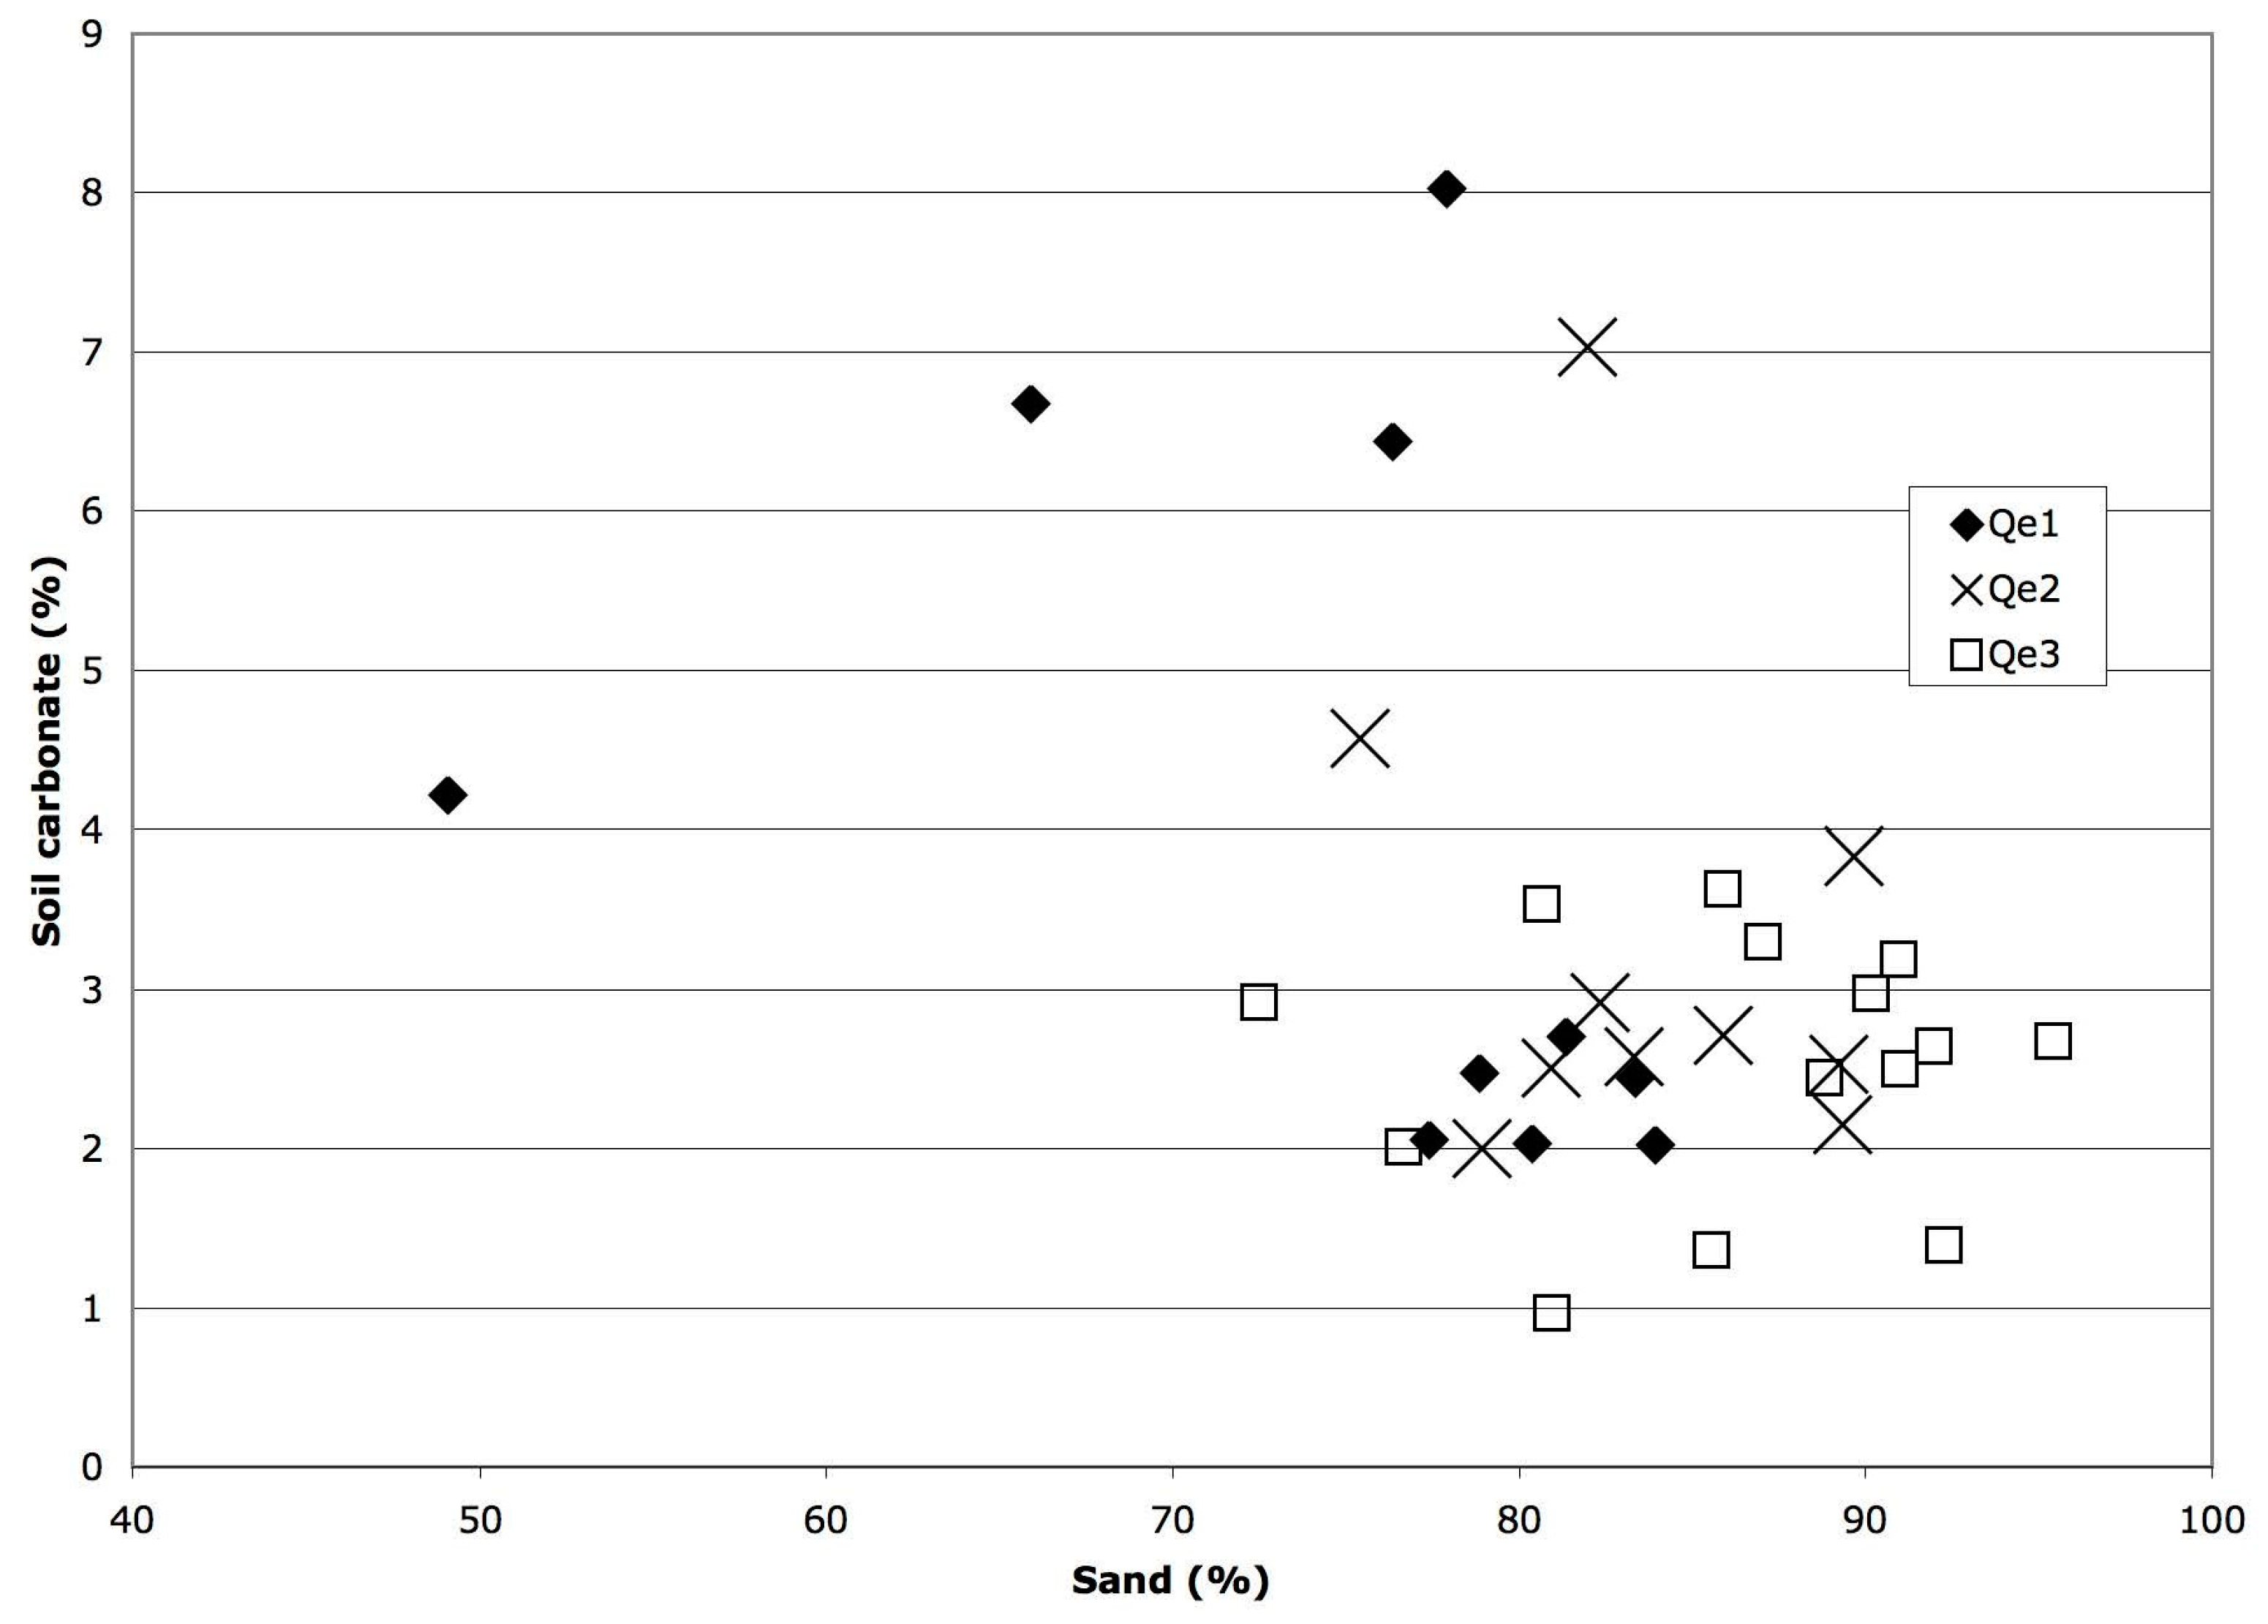
Aeolian transportation winnows and sorts sediments, and as such we might expect that the texture of original parent material comprising sand dunes would be well-sorted sand. Sustained soil development in a semiarid climate is characterized by substantial increases in clay, silt, and pedogenic carbonate. We observe these characteristic properties in our oldest deposits, Qe1. However, when we compare the ranges in these soil parameters from Qe1 to Qe2 and Qe3, we observe that the ranges overlap, rendering our units virtually indistinguishable using only soil texture and soil carbonate % (Figure 10). As soil horizons and soil structure are relatively undeveloped in Qe2 and Qe3, we attribute the overlap in soil texture and carbonate values to deflation/erosion of soils of Qe1 subsequent to Qe1 soil development. Therefore, Qe2 and Qe3 parent materials may, in some cases, represent local erosion of Qe1 sediments, which are then redeposited a short distance downwind and restabilized.

4.3. Soil Properties Associated with Enhanced Cohesion of Sediments

In this study, all Qe1 profiles are characterized by Bt horizons defined by the presence of oriented clay films (argillans) that form as clay particles are colloidally translocated into the B horizon [34]. Soil structure is typical of argillic horizons in Aridisols and is relatively advanced, when considering the parent material is well-sorted aeolian sand. Soil structural units (peds) are well developed with structural type ranging from angular blocky to prismatic (Table 6). When exposed through trenching, peds are easily observable and when sampled, the mass is composed mostly of entire peds (Figure 7). Oriented clay films were observed as bridges between or colloidal coatings on sand grains as well as lining soil structural boundaries (ped faces).
Dry consistence of Qe1 argillic horizons, evaluated in the field, ranges from slightly hard to very hard, with 75% of the argillic horizons ranked hard to very hard. Dry consistence is a measure of the “cohesion of soil particles to one another and the resistance of the soil mass to deformation” [34]. Every Qe1 soil profile (except WP87) has at least one argillic horizon with hard consistence (see [34] for definitions of soil morphological properties). At WP87, the maximum dry consistence was measured as slightly hard. The upper 0.5 m of the WP87 profile was notably moist at the time this profile was described in the field. Atmospheric humidity can strongly influence the erodibility of sediments [48] and may account for the lower than expected cohesion in WP87 despite relatively strong soil structure (i.e., cohesion is likely strongest when the soil moisture decreases).
In contrast, 13 of 18 Qe3 soil horizons are classified as C horizons with very weak to weak aggregation (structural grade) and very easily deformable peds in a nonaggregated matrix (noncoherent to weakly coherent dry consistence; Table 4; Figure 9). Essentially, Qe3 aeolian deposits have been stable for so little time that they have undergone only incipient pedogenesis.
Qe2 soil profiles are only slightly better developed than Qe3 soils. The most well-developed Qe2 soil horizons do not exhibit oriented clay films, but do have reddened and/or carbonate-rich B horizons (Bwk and Bk, respectively), which are evidence for additions of translocated fines and soluble salts. Qe2 soil horizons are generally weakly aggregated (subangular blocky with barely observable peds and when disturbed for sampling, few peds are observed and much of the material is unaggregated) and weakly coherent (soft to slightly hard dry consistence). WP144 is the only Qe2 soil profile exhibiting horizons with greater coherence (hard dry consistence) and elevated soil carbonate (see horizon 3Bkb in Table 4). This thin hillslope deposit is unusual in that it consists of intercalated aeolian and colluvial sediments (roughly 80% sand, 20% fines).
Boundaries between aeolian stratigraphic units are typically more sharply defined than boundaries between soil horizons within units (
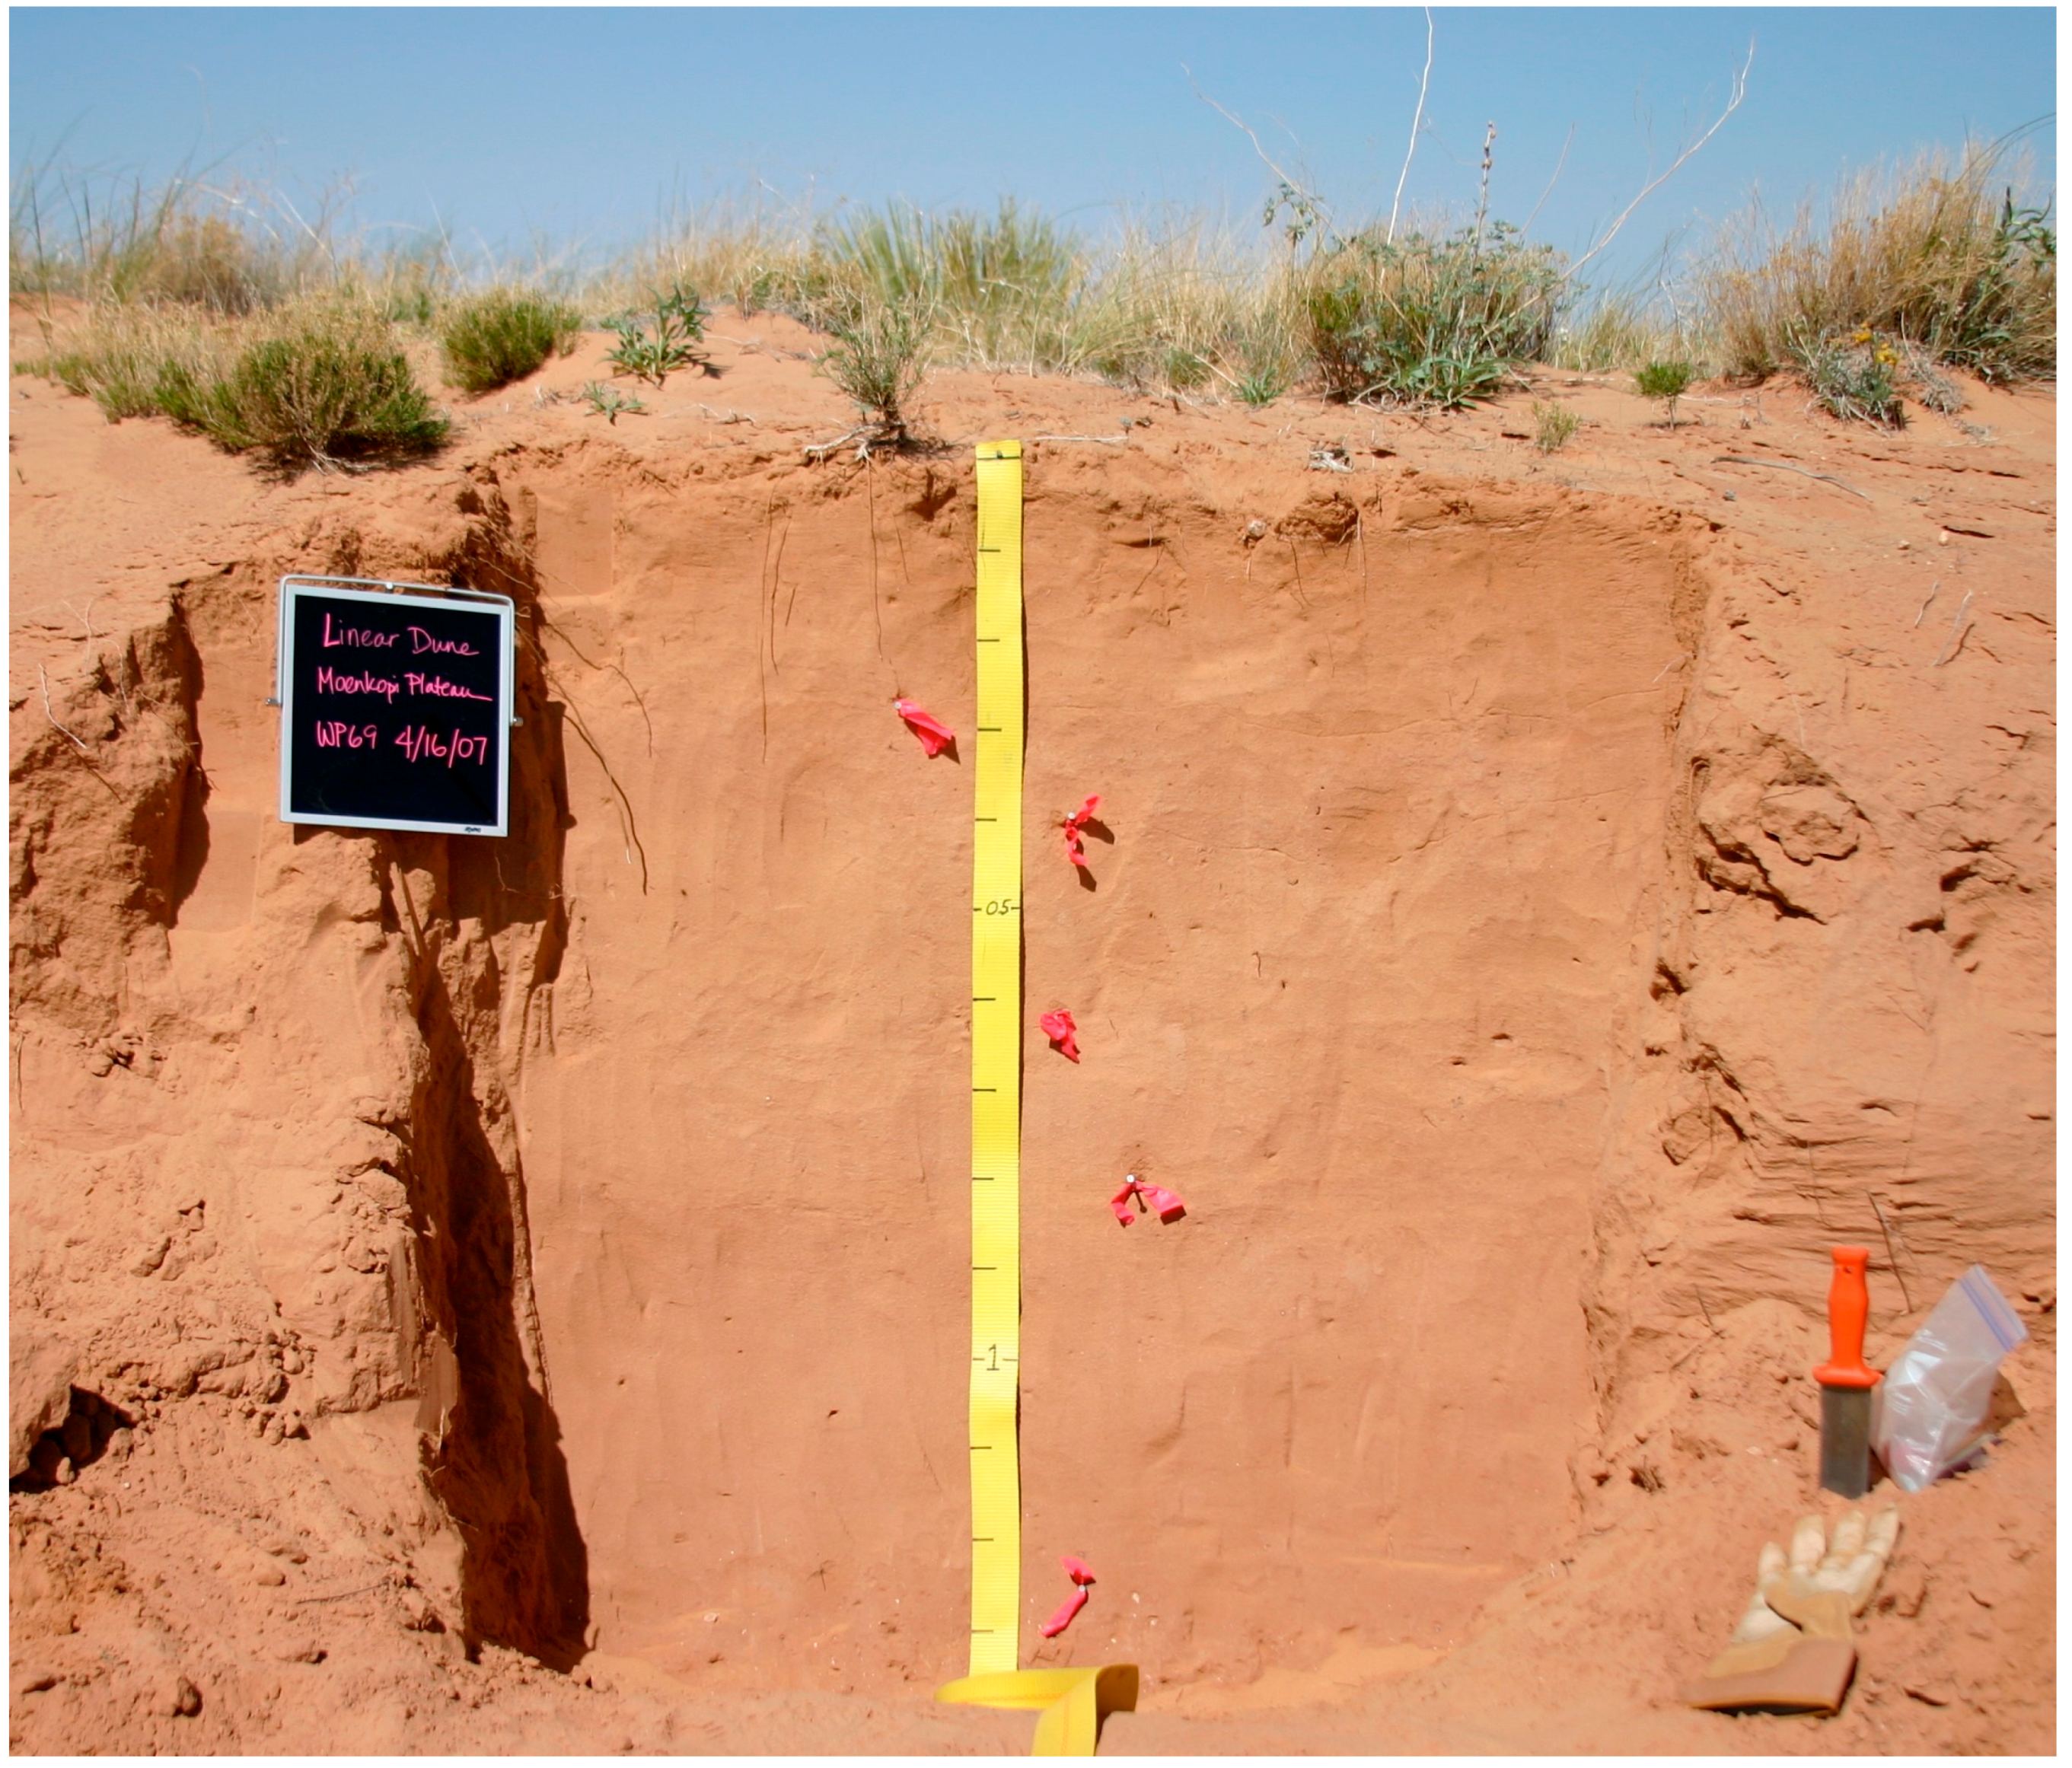
Table 7). Boundaries within an aeolian unit are typically gradational between soil horizons; however, abrupt contacts within a unit can occur where a unit consists of more than one deposit. For example, the Qe3 unit identified at WP69 is composed of two distinct deposits (parent materials 1 and 2) separated by an abrupt boundary. Qe1 deposits commonly have abrupt upper boundaries in well-developed B horizons (Btk) and often those horizons are at the surface very thinly covered with active sand trapped by vegetation. The sharp upper contact of Qe1 and lack of buried A horizons in Qe1 suggests that the uppermost horizons of Qe1 have been eroded.

5. Discussion

The modern instrumental record from the Moenkopi Plateau shows that wind strength is more than sufficient to reactivate sand dune deposits [30], yet the majority of the aeolian landforms on the plateau have remained dominantly stable since the early Holocene. Livestock grazing was at a maximum on the Navajo Nation in the early 1900s, with livestock reduction efforts in the 1930s significantly reducing grazing pressure (see an excellent review in [49]), but even extreme grazing pressure with its consequent reduction of vegetative cover did not generate an overall reactivation of the aeolian sediments on the Moenkopi Plateau. During the last millennium, tree ring records [50,51,52,53] show that the western US suffered several, abrupt, multidecadal “megadroughts” of much greater severity than historical droughts including the megadrought coincident with the abandonment of Chaco Canyon (summarized in [54], p. 109). Despite large reductions in effective moisture (either due to increased temperatures or decreased precipitation) during the Holocene, the Moenkopi Dunes have been dominantly stable (Figure 11).

5.1. Pedogenesis and Dune Morphodynamics

Qe1 deposits on the Moenkopi Plateau stabilized initially as sediment supply decreased from the Little Colorado River and Painted Desert, allowing vegetation to colonize sand sheets and linear dunes. Vegetation cover as scant as 15% significantly inhibits the transport of dune sand [55], starting a positive feedback loop. As vegetation increases, the additional surface roughness inhibits wind erosion and plants provide loci for sub-canopy deposition. This sheltering and trapping effect is most homogenous in grasslands, where vegetative cover is relatively high and the distribution of that cover is relatively uniform (for an excellent review, see [22]).
Increased vegetative cover also enhances the deposition of dust [56]. In the grasslands of Mongolia, an area that currently experiences high dust flux, an experimental study showed that a simulated grassland cover of 55–75% has the potential to accumulate 2.4–2.5 g/m2/day (2 g/m2/day for 15% cover [56]). Fine grained particle inputs to soils not only improve water-holding capacity, but are a critical source of nutrient exchange capacity and nutrient input of P, Mg, Na, K, Mo, Ca [22,56,57,58,59], especially in dune sand. Most importantly, though, dust inputs provide the soil colloids (clays) that allow more rapid development of a Bt horizon.
Large increases in dust influx on the Colorado Plateau during the Pleistocene–Holocene transition probably are related to the desiccation and deflation of large pluvial lakes in western North America [57,59] and/or deflation of fine sediments associated with distal fan areas and active channels [60,61]. Increased dustiness and increased dust trapping capability of vegetated surfaces accelerated soil formation in aeolian deposits across the Colorado Plateau [3,5,16,38]. Rapid additions of fine grained particle inputs not only encourage rapid vegetative colonization, but also accumulation of externally derived clay, Ca-bearing minerals, Ca2+ in rainfall and soluble salts primarily in uppermost soil horizons. Such soil-forming processes in drylands in diverse parent materials, so very strongly influenced by dust accumulation, favors accretionary and inflationary soil profile development, a mode of profile development that profoundly influences the genesis, geomorphic evolution, and patterns of plant community development on landforms and landscapes worldwide through large impacts on surface hydrology and erodibility [62]. This mode of soil development in initially loose, largely cohesionless parent materials, progressively increases soil cohesion, through, for example, precipitation of pedogenic carbonates or the accumulation of alluvial clay, particularly in surface and near surface horizons. Studies of soils in semiarid agricultural settings that are prone to wind erosion have shown that as soil aggregation increases substantially via these soil-forming processes, while wind erodibility decreases markedly. In fact, loamy soils that possess horizons such as the Btk horizons described in Qe1 deposits, have been shown to be less than 30% as erodible as sandy soils (i.e., soils described in Qe2 and Qe3 deposits) when completely cleared of vegetation [63].
The formation of well-developed B horizons produced the widespread and persistent stability of Qe1 even during the most arid periods of the Holocene. Interestingly, Colorado Plateau dune chronologies [3,5,16,19,38] record no aeolian deposits dating to the Holocene climatic optimum (~8–6 ka), when the southwestern US was most arid with lowest lake levels [64,65,66] and “desertlike” vegetation from pollen assemblages from the Canyonlands, Utah [38] was common. Reduction in vegetative cover during this period of reduced effective moisture probably exposed soils developed in the Qe1 deposits. The abrupt upper boundaries in Qe1 soils suggest erosion, probably removing only the thin, less cohesive A horizon, but not significantly eroding the more strongly cohesive materials of the underlying, clay-enriched B horizon. It is interesting to note that in this region, the clay-enriched B horizon is resisting wind erosion, rather than pedogenic carbonate-containing B horizons.

5.2. Sources of Aeolian Sediment on the Moenkopi Plateau

Paleoenvironmental reconstructions in and around the study area show that the late Pleistocene and into the Pleistocene-Holocene transition was cooler and wetter [64,65,67] producing greater alluvial sediment loads in rivers [68], and consequently, aeolian transport of these materials and deposition of Qe1 [5,16]. The large volume of sand in Qe1 and the distinctive bright red sand grains found in all Qe1 deposits suggest a regional source such as the Little Colorado River and associated local watersheds that drain the nearby Jurassic Glen Canyon sandstones. Climbing dunes and sand ramps from the Painted Desert to the Moenkopi Plateau are presently rare, but must have extensively flanked the Moenkopi Plateau to have facilitated the transport of massive amounts of sand in the late Pleistocene [5,16]. At some point during the Holocene, erosion removed the sand ramps, and without the extensive transport surfaces, the Painted Desert was removed as a source for aeolian deposits on the Moenkopi Plateau.
Qe2 and Qe3 deposits appear related to periods with greater effective moisture on the southern Colorado Plateau, as do other late Holocene aeolian deposits in the region [3,38], which are concurrent with valley alluviation and backfilling on Black Mesa [24,69,70]. Greater variability in summer precipitation, and in resulting discharge, leads to wider, less vegetated floodplains [9,71], increasing both sediment supply and availability for the aeolian system [9,21]. Hypothesized hillslope stripping during mid to late Holocene monsoon storms (as in [72]), combined with wide sand-dominated floodplains, would increase sediment available to the aeolian system. The Qe2 climbing dune core (4 ka) dates to the tail end of a long phase (5.8 to 4.2 ka) of increased floods [73] and about the same time as lake levels began to rise on the Kaibab Plateau [64] signaling increased effective moisture.
The relatively small volume of Qe2 and Qe3 deposits (Figure 11) is consistent with either (1) more extensive mid to late Holocene deposits that have since been eroded or (2) more localized, small volume event(s), whether aeolian sediments were transported to the Moenkopi Plateau via sand ramps or were derived locally from bedrock sources or from the uppermost horizons of Qe1. In the absence of evidence to the contrary, the second interpretation is reasonable. Active linear dunes along the Adeii Eechii Cliffs are built in part from local increases in sediment supply from local Navajo Sandstone outcrops, as evidenced in field relationships (soil and sediment properties), bulk magnetic susceptibility measurements along the Gold Spring linear dune transects, and the presence of prominent fluting features over large expanses of Navajo Sandstone outcrops along the Adeii Eechii Cliffs escarpment, though the timing of flute formation has not been established. Linear dunes with active crests are also locally associated with floodplains of internally drained washes on the Moenkopi Plateau (e.g., WP38, 86, 149; Figure 5) with small washes draining the bedrock-dominated hillslopes in the center of the Moenkopi Plateau. We infer from observations of satellite imagery and aerial photos that because of the slight northern tilt of bedrock units and the high infiltration rate of dunes, this part of the study area is internally drained and supports seasonal standing water under modern conditions (round dark patches in Figure 5). Sediments delivered to these unincised channels are readily available for aeolian transport, as shown by active linear dune crests downwind from this source on Appaloosa Ridge.
The overlap in soil texture and soil carbonate values for all units shown in Figure 10 suggests that the parent materials for Qe2 and Qe3 were not always restricted to well-sorted quartz sand devoid of carbonate; the eroded uppermost horizons of Qe1 are a likely local source of sand for some of these deposits. This inference is supported by (1) weak soil profile development (weak structure, consistence and carbonate morphology) in Qe2 and Qe3 soil profiles despite the fact that they may contain as much silt, clay, and carbonate as some Qe1 soils and (2) the sharp upper boundaries of Qe1 in well-developed Btk horizons, which suggest that aeolian deflation removed the less resistant, uppermost soil horizons of the Qe1 soil throughout the study area. Further wind erosion was limited by the significant cohesion imparted by the well-developed B horizons.

6. Conclusions

Dune field morphodynamics are often strongly related to climate, but in this study area they are clearly dependent on more than climatic variables (i.e., precipitation and its effects on vegetation cover; and wind velocity). The stability of the Moenkopi Dunes depends on a second kind of aeolian input that follows the original emplacement of aeolian landforms: dust. With the right conditions (e.g., persistent vegetation cover of perennial grasses enhancing dust-trapping potential), the input of dust contributes to development of B horizons that have structural integrity that, in this case, impeded large-scale dune field reactivation throughout the Holocene. Our study of soil development in aeolian deposits of the southern Colorado Plateau strongly suggests that dust incorporation into soils, advancing soil cohesion, is not unique and has likely occurred in many other dryland settings around the world, particularly in semiarid areas where dunes can support significant vegetation cover. Yet few studies incorporate a geologic/geomorphic assessment of soils and the stabilizing role of pedogenesis in predicting the future stability of aeolian landforms. To improve predictions of future dune activity, the degree of soil development in aeolian deposits should be considered when evaluating sediment availability in aeolian systems.

Author Contributions

Amy L. Ellwein, Leslie D. McFadden and Joseph A. McAuliffe conceived the study. Fieldwork by Leslie D. McFadden and Joseph A. McAuliffe in the 1990s provided a foundation for further detailed studies. Subsequently, Amy L. Ellwein designed, funded, and conducted field work, experiments, sampling, and most laboratory analyses; Leslie D. McFadden, Joseph A. McAuliffe, and Shannon A. Mahan advised throughout the research project. Shannon A. Mahan made substantial contributions to the design of the geochronological work as the luminescence expert; her acquisition, analysis, or interpretation of data was invaluable to the deduction of the rates of deposition. Amy L. Ellwein wrote the majority of the manuscript and prepared figures and tables; Shannon A. Mahan wrote the luminescence portion of the methods section. All authors played significant roles in revising the manuscript and have approved the submitted version.

Acknowledgments

Resources supporting this research were provided in part by the Center for Rapid Environmental Assessment and Terrain Evaluation (CREATE; Louis Scuderi) at the University of New Mexico (UNM), as well as grants and scholarships to Ellwein from the Geological Society of America (GSA), UNM, and the Department of Earth and Planetary Sciences (UNM). Jennifer New-Parker, Patrick Ellwein, and Timothy Wawryniec were invaluable field assistants. Harland Goldstein (USGS, Denver) performed some of the PSDA and soil carbonate laboratory analyses. The authors would like to thank two anonymous reviewers for their thorough and insightful reviews. Many thanks to Tim Wawrzyniec and John Geissman at the UNM Paleomagnetism Laboratory; Tim, we all miss you! Special thanks to the Navajo Nation and Hopi Tribe for permission to conduct this research on their lands. The lead author would particularly like to thank the generous folks at the Coalmine Canyon Chapter House for insisting she join them for Easter dinner instead of doing field work during a dust storm.

Conflicts of Interest

The authors declare no conflict of interest.

References

  1. Hack, J.T. Dunes of the western Navajo Country. Geogr. Rev. 1941, 31, 240–263. [Google Scholar] [CrossRef]
  2. Hack, J.T. The Changing Physical Environment of the Hopi Indians of Arizona; Peabody Museum of American Archaeology and Ethnology; Harvard University: Cambridge, MA, USA, 1942; ISBN 978-0527012885. [Google Scholar]
  3. Wells, S.G.; McFadden, L.D.; Schultz, J.D. Eolian landscape evolution and soil formation in the Chaco dune field, southern Colorado Plateau, New Mexico. Geomorphology 1990, 3, 517–546. [Google Scholar] [CrossRef]
  4. McFadden, L.D.; McAuliffe, J.R. Lithologically influenced geomorphic responses to Holocene climatic changes in the southern Colorado Plateau, Arizona: A soil-geomorphic and ecologic perspective. Geomorphology 1997, 19, 303–332. [Google Scholar] [CrossRef]
  5. Ellwein, A.L.; Mahan, S.A.; McFadden, L.D. Impacts of climate change on the formation and stability of late Quaternary sand sheets and falling dunes, Black Mesa region, southern Colorado Plateau, USA. Quat. Int. 2015, 362, 87–107. [Google Scholar] [CrossRef]
  6. Thomas, D.S.G.; Knight, M.; Wiggs, G.F.S. Remobilization of southern African desert dune systems by twenty-first century global warming. Nature 2005, 435, 1218–1221. [Google Scholar] [CrossRef] [PubMed]
  7. Muhs, D.R.; Maat, P.B. The potential response of eolian sands to greenhouse warming and precipitation reduction on the Great Plains of the United States. J. Arid Environ. 1993, 25, 351–361. [Google Scholar] [CrossRef]
  8. Madole, R.F. Stratigraphic evidence of desertification in the west-central Great Plains within the past 1000 yr. Geology 1994, 22, 483–486. [Google Scholar] [CrossRef]
  9. Muhs, D.R.; Holliday, V.T. Evidence of active dune sand on the Great Plains in the 19th century from accounts of early explorers. Quat. Res. 1995, 43, 198–208. [Google Scholar] [CrossRef]
  10. Muhs, D.R.; Wolfe, S.A. Sand dunes of the northern Great Plains of Canada and the United States. In Holocene Climatic and Environmental Change in the Palliser Triangle: A Geoscientific Context for Evaluating the Impacts of Climate Change on the Southern Canadian Prairies; Lemmen, D.S., Vance, R.E., Eds.; Geological Survey of Canada Bulletin: Ottawa, ON, Canada, 1999; Volume 534, pp. 183–197. ISBN 0660178877. [Google Scholar]
  11. Forman, S.L.; Marin, L.; Gomez, J.; Pierson, J. Late Quaternary eolian sand depositional record for southwestern Kansas: Landscape sensitivity to droughts. Paleogeogr. Paleoclimatol. Paleoecol. 2008, 265, 107–120. [Google Scholar] [CrossRef]
  12. Wolfe, S.A.; Huntley, D.J.; David, P.P.; Ollerhead, J.; Sauchyn, D.J.; MacDonald, G.M. Late 18th century drought-induced sand dune activity, Great Sand Hills, Saskatchewan. Can. J. Earth Sci. 2001, 38, 105–117. [Google Scholar] [CrossRef]
  13. Hugenholtz, C.H.; Wolfe, S.A. Recent stabilization of active sand dunes on the Canadian prairies and relation to recent climate variations. Geomorphology 2005, 68, 131–147. [Google Scholar] [CrossRef]
  14. Breed, C.S.; McCauley, J.F.; Breed, W.J.; McCauley, C.K.; Cotera, A.S., Jr. Eolian (wind-formed) landscapes. In Landscapes of Arizona: The Geological Story; Smiley, T.L., Nations, J.D., Péwé, T.L., Schafer, J.P., Eds.; University Press of America: Lanham, MD, USA, 1984; pp. 359–413. ISBN 081914178X. [Google Scholar]
  15. Garfin, G.; Franco, G.; Blanco, H.; Comrie, A.; Gonzalez, P.; Piechota, T.; Smyth, R.; Waskom, R. 2014: Ch. 20: Southwest. In Climate Change Impacts in the United States: The Third National Climate Assessment; Melillo, J.M., Richmond, T.C., Yohe, G.W., Eds.; U.S. Global Change Research Program: Washington, DC, USA, 2014; pp. 462–486. [Google Scholar] [CrossRef]
  16. Ellwein, A.L.; Mahan, S.A.; McFadden, L.D. New optically stimulated luminescence ages provide evidence of MIS3 and MIS2 eolian activity on Black Mesa, northeastern Arizona, USA. Quat. Res. 2011, 75, 395–398. [Google Scholar] [CrossRef]
  17. Breed, C.S.; Breed, W.J. Dunes and other windforms of central Australia, and a comparison with linear dunes on the Moenkopi Plateau, Arizona. In Apollo-Souyez Test Project Summary Science; Report v. 2, Earth Observations and Photography; El-Baz, F., Warner, D.M., Eds.; National Aeronautics and Space Administration Special Publication: Washington, DC, USA, 1979; Volume 412, pp. 319–358. [Google Scholar]
  18. Billingsley, G.H. Geology and Geomorphology of the Southwestern Moenkopi Plateau and Southern Ward Terrace, Arizona; U.S. Geological Survey: Reston, VA, USA, 1987. Available online: https://pubs.usgs.gov/bul/1672/report.pdf (accessed on 20 February 2018).
  19. Stokes, S.; Breed, C.S. A chronostratigraphic re-evaluation of the Tusayan Dunes, Moenkopi Plateau and southern Ward Terrace, northeastern Arizona. In The dynamics and Environmental Context of Aeolian Sedimentary Systems; Pye, K., Ed.; Geological Society: London, UK, 1993; pp. 75–90. [Google Scholar]
  20. Lancaster, N. Desert dune dynamics and development: Insights from luminescence dating. Boreas 2008, 37, 559–573. [Google Scholar] [CrossRef]
  21. Kocurek, G.; Lancaster, N. Aeolian system sediment state: Theory and Mojave Desert Kelso dune field example. Sedimentology 1999, 46, 505–515. [Google Scholar] [CrossRef]
  22. Okin, G.S.; Gillette, D.A.; Herrick, J.E. Multi-scale controls on and consequences of aeolian processes in landscape change in arid and semi-arid environments. J. Arid Environ. 2006, 63, 253–275. [Google Scholar] [CrossRef]
  23. Li, J.; Okin, G.S.; Herrick, J.E.; Belnap, J.; Miller, M.E.; Vest, K.; Draut, A.E. Evaluation of a new model of aeolian transport in the presence of vegetation. J. Geophys. Res. Earth Surf. 2013, 118, 288–306. [Google Scholar] [CrossRef]
  24. Karlstrom, E.T.; Karlstrom, T.N.V. Late Quaternary alluvial stratigraphy and soils of the Black Mesa—Little Colorado River Areas, northern Arizona. In Geology of Central and Northern Arizona, Rocky Mountain Section Guidebook; Nations, J.D., Conway, C.M., Swann, G.A., Eds.; Geological Society of America: Boulder, CO, USA, 1986; pp. 71–92. [Google Scholar]
  25. Breed, C.S.; Grow, T. Morphology and distribution of dunes in sand seas observed by remote sensing. In A Study of Global Sand Seas; McKee, E.D., Ed.; U.S. Geological Survey: Washington, DC, USA, 1979; pp. 253–302. [Google Scholar]
  26. Stokes, W.L. Incised, wind-aligned stream patterns of the Colorado Plateau. Am. J. Sci. 1964, 262, 808–816. [Google Scholar] [CrossRef]
  27. Helm, J.; Breed, C.S.; Tigges, R.; Garcia, P.A. Geometeorological data collected by the USGS Desert Winds Project at Gold Spring, Great Basin Desert, Northeastern Arizona, 1979–1992; U.S. Geological Survey: Reston, VA, USA, 1995.
  28. Helm, P.J.; Breed, C.S. Instrumented field studies of sediment transport by wind. In Desert Winds: Monitoring Wind-Related Surface Processes in Arizona, New Mexico, and California; Breed, C.S., Reheis, M.C., Eds.; U.S. Geological Survey: Reston, VA, USA, 1999; pp. 31–54. [Google Scholar]
  29. Western Regional Climate Center (WRCC). Western U.S. Historical Summaries for Individual Stations. Available online: www.wrcc.dri.edu/CLIMATEDATA.html (accessed on 1 December 2010).
  30. Lancaster, N.; Helm, P. A test of a climatic index of dune mobility using measurements from the southwestern United States. Earth Surf. Process. Landf. 2000, 25, 197–207. [Google Scholar] [CrossRef]
  31. Fryberger, S.G.; Dean, G. Dune Forms and Wind Regimes. In A Study of Global Sand Seas; McKee, E.D., Ed.; U.S. Geological Survey: Reston, VA, USA, 1979; pp. 137–169. [Google Scholar]
  32. Lancaster, N. Development of linear dunes in the southwestern Kalahari, southern Africa. J. Arid Environ. 1988, 14, 233–244. [Google Scholar]
  33. Birkeland, P.W.; Machette, M.N.; Haller, K.M. Soils as a Tool for Applied Quaternary Geology; Utah Geological and Mineral Survey: Salt Lake City, UT, USA, 1991; pp. 1–63. [Google Scholar]
  34. Birkeland, P.W. Soils and Geomorphology, 3rd ed.; Oxford University Press: New York, NY, USA, 1999; 430p, ISBN 0195078861. [Google Scholar]
  35. Day, P.R. Particle fractionation and particle-size analysis. In Methods of Soil Analysis, Physical and Mineralogical Methods, 2nd ed.; Klute, A., Ed.; American Society of Agronomy: Madison, WI, USA, 1986; pp. 545–567. ISBN 0891180885. [Google Scholar]
  36. McCave, I.N.; Syvitski, J.P.M. Principles and methods of geological particle size analysis. In Principles, Methods and Applications of Particle Size Analysis; Syvitski, J.P.M., Ed.; Cambridge University Press: New York, NY, USA, 1991; pp. 3–21. [Google Scholar]
  37. Machette, M.N. Calcic soils of the southwestern United States. In Soils and Quaternary Geology of the Southwestern United States, Geological Society of America Special Paper 203; Weide, D.L., Ed.; Geological Society of America: Boulder, CO, USA, 1985; pp. 1–21. [Google Scholar]
  38. Reheis, M.C.; Reynolds, R.L.; Goldstein, H.; Roberts, H.M.; Yount, J.C.; Axford, Y.; Cummings, L.S.; Shearin, N. Late Quaternary eolian and alluvial response to paleoclimate, Canyonlands, southeastern Utah. GSA Bull. 2005, 117, 1051–1069. [Google Scholar] [CrossRef]
  39. Buylaert, J.P.; Huot, S.; Murray, A.S.; Van den Haute, P. Infrared stimulated luminescence dating of an Eemian (MIS 5e) site in Denmark using K-feldspar. Boreas 2011, 40, 46–56. [Google Scholar] [CrossRef]
  40. Steffan, D.; Preusser, F.; Schlunegger, F. OSL quartz age underestimation due to unstable signal components. Quat. Geochronol. 2009, 4, 353–362. [Google Scholar] [CrossRef]
  41. Thomsen, K.J.; Murray, A.S.; Jain, M.; Bøtter-Jensen, L. Laboratory fading rates of various luminescence signals from feldspar-rich sediment extracts. Radiat. Meas. 2008, 43, 1474–1486. [Google Scholar] [CrossRef]
  42. Mahan, S.A.; Donlan, R.; Kardos, B. Luminescence dating of anthropogenic features of the San Luis Valley, Colorado: From stone huts to stone walls. Quat. Int. 2015, 362, 50–62. [Google Scholar] [CrossRef]
  43. Nelson, M.; Gray, H.; Johnson, J.A.; Rittenour, T.; Feathers, J.; Mahan, S.A. User guide for luminescence sampling in archaeological and geological contexts. Adv. Archaeol. Pract. 2015, 3, 166–177. [Google Scholar] [CrossRef]
  44. Rodnight, H. How many equivalent dose values are needed to obtain a reproducible distribution? Ancient TL 2008, 26, 3–9. [Google Scholar]
  45. Wintle, A.G.; Murray, A.S. A review of quartz optically stimulated luminescence characteristics and their relevance in single-aliquot regeneration dating protocols. Radiat. Meas. 2006, 41, 369–391. [Google Scholar] [CrossRef]
  46. Prescott, J.R.; Hutton, J.T. Cosmic ray contributions to dose rates for luminescence and ESR dating: Large depths and long-term time variations. Radiat. Meas. 1994, 23, 497–500. [Google Scholar] [CrossRef]
  47. Soil Survey Staff. Keys to Soil Taxonomy, 6th ed.; Pocahontas Press, Inc.: Blacksburg, VA, USA, 1994; p. 524. [Google Scholar]
  48. Ravi, S.; Zobeck, T.M.; Over, T.M.; Okin, G.S.; d’Odorico, P. On the effect of moisture bonding forces in air-dry soils on threshold friction velocity of wind erosion. Sedimentology 2006, 53, 597–609. [Google Scholar] [CrossRef]
  49. Weisiger, M. Dreaming of Sheep in Navajo Country; University of Washington Press: Seattle, WA, USA, 2009; p. 391. [Google Scholar]
  50. Stahle, D.W.; Cook, E.R.; Cleaveland, M.K.; Therrell, M.D.; Meko, D.M.; Grissino-Mayer, H.D.; Watson, E.; Luckman, B.H. Tree-ring data document 16th century megadrought over North America. Eos Trans. Am. Geophys. Union 2000, 81, 121–125. [Google Scholar] [CrossRef]
  51. Cook, E.R.; Woodhouse, C.A.; Eakin, C.M.; Meko, D.M.; Stahle, D.W. Long-term aridity changes in the western United States. Science 2004, 306, 1015–1018. [Google Scholar] [CrossRef] [PubMed]
  52. Meko, D.M.; Woodhouse, C.A.; Baisan, C.A.; Knight, T.; Lukas, J.J.; Hughes, M.K.; Salzer, M.W. Medieval drought in the upper Colorado River Basin. Geophys. Res. Lett. 2007, 34. [Google Scholar] [CrossRef]
  53. Scuderi, L.A.; McFadden, L.D.; McAuliffe, J.R. Dendrogeomorphically derived slope response to decadal and centennial scale climate variability: Black Mesa, Arizona, USA. Nat. Hazards Earth Syst. Sci. 2008, 8, 869–880. [Google Scholar] [CrossRef]
  54. Cook, E.R.; Seager, R.; Cane, M.A.; Stahle, D.W. North American drought: Reconstructions, causes, and consequences. Earth Sci. Rev. 2007, 81, 93–134. [Google Scholar] [CrossRef]
  55. Wiggs, G.F.S.; Thomas, D.S.G.; Bullard, J.E. Dune mobility and vegetation cover in the Southwest Kalahari desert. Earth Surf. Process. Landf. 1995, 20, 515–529. [Google Scholar] [CrossRef]
  56. Yan, Y.; Xu, X.; Xin, X.; Yang, G.; Wang, X.; Yan, R.; Chen, B. Effect of vegetation coverage on aeolian dust accumulation in a semiarid steppe of northern China. Catena 2011, 87, 351–356. [Google Scholar] [CrossRef]
  57. Reynolds, R.; Belnap, J.; Reheis, M.; Lamothe, P.; Luiszer, F. Aeolian dust in Colorado Plateau soils: Nutrient inputs and recent change in source. Proc. Natl. Acad. Sci. USA 2001, 98, 7123–7127. [Google Scholar] [CrossRef] [PubMed]
  58. Neff, J.C.; Ballantine, A.P.; Farmer, G.L.; Mahowald, N.M.; Conroy, J.L.; Landry, C.C.; Overpeck, J.T.; Painter, T.H.; Lawrence, C.R.; Reynolds, R.L. Increasing eolian dust deposition in the western United States linked to human activity. Nat. Geosci. 2008, 1, 189–195. [Google Scholar] [CrossRef]
  59. Reynolds, R.L.; Reheis, M.C.; Neff, J.C.; Goldstein, H.; Yount, J. Late Quaternary eolian dust in surficial deposits of a Colorado Plateau grassland: Controls on distribution and ecological effects. Catena 2006, 66, 251–266. [Google Scholar] [CrossRef]
  60. Wells, S.G.; Dohrenwend, J.C. Relict sheetflood bed forms on late Quaternary alluvial-fan surfaces in the southwestern United States. Geology 1985, 13, 512–516. [Google Scholar] [CrossRef]
  61. Wells, S.G.; McFadden, L.D.; Dohrenwend, J.C. Influence of late Quaternary climatic changes on geomorphic and pedogenic processes on a desert piedmont, eastern Mojave Desert, California. Quat. Res. 1987, 27, 130–146. [Google Scholar] [CrossRef]
  62. McFadden, L.D. Strongly dust-influenced soils and what they tell us about landscape dynamics in vegetated aridlands of the southwestern United States. In The Web of Geological Sciences: Advances, Impacts, and Interactions; Bickford, M.E., Ed.; The Geological Society of America: Boulder, CO, USA, 2013; pp. 1–32. [Google Scholar]
  63. Skidmore, E.L. Wind Erosion. In Soil Erosion Research Methods, 2nd ed.; Lal, R., Ed.; CRC Press: New York, NY, USA, 1994; ISBN 9781884015090. [Google Scholar]
  64. Weng, C.; Jackson, S.T. Late glacial and Holocene vegetation history and paleoclimate of the Kaibab Plateau, Arizona. Palaeogeogr. Palaeoclimatol. Palaeoecol. 1999, 153, 179–201. [Google Scholar] [CrossRef]
  65. Anderson, R.S.; Betancourt, J.L.; Mead, J.I.; Hevly, R.H.; Adam, D. Middle- and late-Wisconsin paleobotanic and paleoclimate records from the southern Colorado Plateau, USA. Palaeogeogr. Palaeoclimatol. Palaeoecol. 2000, 155, 31–57. [Google Scholar] [CrossRef]
  66. Anderson, R.S.; Jass, R.B.; Toney, J.L.; Allen, C.D.; Cisneros-Dozal, L.M.; Hess, M.; Heikoop, J.; Fessenden, J. Development of the mixed conifer forest in northern New Mexico and its relationship to Holocene environmental change. Quat. Res. 2008, 69, 263–275. [Google Scholar] [CrossRef]
  67. Betancourt, J.L. Late Quaternary biogeography of the Colorado Plateau. In Packrat Middens: The Last 40,000 Years of Biotic Change; Betancourt, J.L., Van Devender, T.R., Martin, P.S., Eds.; University of Arizona Press: Tucson, AZ, USA, 1990; pp. 259–292. [Google Scholar]
  68. Anders, M.D.; Pederson, J.L.; Rittenour, T.M.; Sharp, W.D.; Gosse, J.C.; Karlstrom, K.E.; Crossey, L.J.; Goble, R.J.; Stockli, L.; Yang, G. Pleistocene geomorphology and geochronology of eastern Grand Canyon: Linkages of landscape components during climate changes. Quatern. Sci. Rev. 2005, 24, 2428–2448. [Google Scholar] [CrossRef]
  69. Karlstrom, E.T. Late Quaternary landscape history and geoarchaeology of two drainages on Black Mesa, northeastern Arizona, USA. Geoarchaeology 2005, 20, 1–28. [Google Scholar] [CrossRef]
  70. Karlstrom, T.N.V. Alluvial chronology and hydrologic change of Black Mesa and nearby regions. In The Anasazi in a Changing Environment; Gumerman, G.J., Ed.; Cambridge University Press: Cambridge, UK, 1988; pp. 45–91. [Google Scholar]
  71. Hereford, R. Valley-fill alluviation during the Little Ice Age (ca. A.D. 1400–1880), Paria River basin and southern Colorado Plateau, United States. Geol. Soc. Am. Bull. 2002, 114, 1550–1563. [Google Scholar] [CrossRef]
  72. Etheredge, D.; Gutzler, D.S.; Pazzaglia, F.J. Geomorphic response to seasonal variations in rainfall in the southwest United States. Geol. Soc. Am. Bull. 2004, 116, 606–618. [Google Scholar] [CrossRef]
  73. Ely, L.E. Response of extreme floods in the southwestern United States to climatic variations in the late Holocene. Geomorphology 1997, 19, 175–201. [Google Scholar] [CrossRef]
Figure 1. Distribution of aeolian landforms and forested areas of the Navajo Nation and Hopi Lands as mapped by J.T. Hack (1941). The study area is outlined in red.
Geosciences 08 00146 g001
Figure 2. Digital elevation model (DEM) with geographic locations mentioned in the text. All slopes >10° are depicted by white pixels. Geologic contacts shown using dashed lines. Tr: undifferentiated Triassic rocks; Jgc: Jurassic Glen Canyon Group; Js: Jurassic San Rafael Group; Ks: Cretaceous Mancos shale; Kmv: Cretaceous Mesa Verde Group. Lowest elevations (~1200 m) in this figure occur along the Little Colorado River, highest elevations. (~2000 m) occur on Howell Mesa. The extent of the Moenkopi Plateau is bounded by the thick white line, the Adeii Eechii Clifffs comprise the southwestern border.
Geosciences 08 00146 g002
Figure 3. Aerial photo of the Adeii Eechii Cliffs escarpment, active and stable linear dune crests, and the location of the USGS Gold Spring station. Photo taken 22 March 2008, courtesy of Dr. Grant Meyer, University of New Mexico.
Geosciences 08 00146 g003
Figure 4. Landsat scene from June, 2000 in 2-4-7 band combination (RGB). Stable linear dunes are depicted as green lines, active linear dune crests with stable plinths in yellow, completely active linear dunes in red. Painted Desert floodplain-adjacent dunes are polygons outlined with thin black lines, bedrock-adjacent dune polygons are outlined in red. Sand sheets of the Moenkopi Plateau are shown as polygons outlined with the thick black lines. Soil profiles are labeled.
Geosciences 08 00146 g004
Figure 5. Active linear dune crests on the Moenkopi Plateau are bright in landsat imagery. Some active crests head at the Adeii Eechii Cliffs, others form downwind from alluvial channels and climb onto Appaloosa Ridge. Base imagery is a Landsat scene from June, 2000 in 2-4-7 band combination (RGB).
Geosciences 08 00146 g005
Figure 6. Schematic diagram showing the position of coring locations. Transects are numbered and core locations are lettered. Linear dune crest (A) and adjacent interdune (C) positions were sampled at all three transects; the side slope position (B) was only sampled along the first transect. Cross sections show the location of cores, position of described units (numbered), and inferred correlations and correlated ages. The graphs to the upper right of each cross section plot the ratio of magnetic susceptibility values relative to the value of unweathered Navajo Sandstone for each core.
Geosciences 08 00146 g006
Figure 7. Qe1 soil profile at WP40. The upper 0.8 m of this soil profile in a sandsheet exhibits moderate soil structure (Table 4) evidenced in this photo by vertical ped faces and distinct tool marks (scrapes from excavating tools). The OSL sample from this site yielded an age of 8.62 ± 1.02 ka (Table 5). The yellow tape has tick marks every decimeter.
Geosciences 08 00146 g007
Figure 8. View towards the east from the central portion of the Moenkopi Plateau. Howell Mesa is the long, flat-topped landform on the horizon. The photo is taken from the low crest of a stabilized dune. The small, low bunch grasses in the foreground are Bouteloua gracilis and Pleuraphis jamesii. Moderately heavy use of the site in the previous year has considerably reduced the potential canopy coverage of these grasses. The tall, light-colored bunch grass is Oryzopsis hymenoides. The wide, dark green patches in the midground and on slopes of the next linear dune are clonal patches of Ephedra. The interdune area where the vehicle is located is dominated by a relatively dense cover of Pleuraphis jamesii. Photo by J. McAuliffe, 13 May 1992.
Geosciences 08 00146 g008
Figure 9. Qe3 (0–73 cm) over Qe2 (below 73 cm) soil profile at WP69. Soil horizonation is weak throughout and soil structure is not evident in the photo. See Table 4 for soil description.
Geosciences 08 00146 g009
Figure 10. Sand and carbonate percentages for the most competent soil horizons in Qe1 (Btk horizons) and Qe2 (Bk or Bwk horizons). All Qe3 horizons listed in Table 4 are plotted in this figure. Aeolian units are indistinguishable based solely on texture and mass of soil carbonate.
Geosciences 08 00146 g010
Figure 11. Simplified topographic profile from the Little Colorado River to the northern extent of the Moenkopi Plateau with schematic representation of Qe1 and linear dunes with active crests. Representative soil profiles are shown along the transect with details of soil horizontation, OSL ages, and correlated ages above. WP144 is a climbing dune remnant, WP147 is a falling dune, all other profiles are described in linear dunes or sand sheets. Transect has 100× vertical exaggeration.
Geosciences 08 00146 g011
Table 1. Gold Springs linear dune coring and magnetic susceptibility experiment results. Within the <2 mm fraction, samples were greater than 95% quartz and all quartz grains were frosted. Magnetic susceptibility analyses were performed using an AGICO MFK1 kappabridge at the Paleomagnetism Laboratory at the University of New Mexico.
SiteSampleDepth (cm)Dry Color aTexture bSand Size cSorting and Rounding dPresence of Red qtz Grains?CaCO3 Stage e,fAverage Magnetic Susceptibility (unitless)Average Standard DeviationCorrelated Age
Transect 1: 35.7676°N, 111.0718°W, elevation 1657 ± 3.4 m
1A1As0–207.5YR6/4SmL-fLws; r-wrno0, ne1.48 × e−53.33 × e−6Qe3
1A120–4007.5YR6/4SfU-fLws; r-wrno0, we1.49 × e−54.65 × e−6Qe3
1B1B10–2147.5YR6/4SfU-fLws; r-wrno0, we3.47 × e−57.75 × e−6Qe3
1B2214–3605YR6/4SfU-vfLms; r-wryesI, me5.11 × e−51.20 × e−6Qe2
1B3360–4005YR6/4LSfU-vfLms; r-wryesII, se3.54 × e−52.24 × e−7Qe1
1C1Cs0–207.5YR6/4SfU-fLws; r-wryes0, we--Qe3
1C120–2005YR6/4SmU-fLms; r-wryesI, me3.76 × e−58.83 × e−7Qe2
1C2200–3605YR6/4SLfU-vfLms; sa-ryesII, se5.06 × e−51.12 × e−6Qe1
Transect 2: 35.7729°N, 111.0625°W, elevation 1650 ± 1.9 m
2A2As0–1357.5YR6/4SfU-vfLms; sa-ryes0, ne4.05 × e−51.09 × e−6Qe3
2A1135–2775YR5/4LSfU-vfLms; r-wryesI, me6.15 × e−57.16 × e−7Qe2
2A2277–4005YR5/4SLmL-vfLms; r-wryesII, se2.23 × e−41.04 × e−6Qe1
2C2Cs0–555YR5/4SmU-vfLps; r-wryes0, me1.31 × e−47.14 × e−7Qe3
2C155–1305YR5/4LSmL-vfLms; wryesII, se1.59 × e−49.55 × e−7Qe1
Weathered Navajo sandstone2C2130–15010YR7/3SmL-vfUws; wrno0, ne−1.31 × e−73.75 × e−7-
Transect 3: 35.7779°N, 111.0539°W, elevation 1659 ± 1.8 m
3A3As0–257.5YR6/4SfU-vfUms; NDyes0, ne7.82 × e−52.46 × e−6Qe3
3A125–2355YR5/4ScL-vfLps; wryesI, me1.71 × e−41.47 × e−6Qe2
3A2235–2775YR5/4LSmU-vfLms; wryesII, se2.54 × e−44.17 × e−7Qe1
3C0–305YR5/4S----Qe3
Fresh Navajo sandstone--5Y8/2 to 7.5YR8/2SmL-vfUws, wrno-−2.50 × e−62.22 × e−7-
a Soil colors determined using Munsell soil color chart. b Field textural analyses performed on <2 mm fraction [34]. c Grain size codes (Modified Wentworth scale): vc—very coarse; c—coarse; m—medium, f—fine; vf—very fine. U—upper; L—lower. d Sorting: ws—well sorted; ms—moderately sorted; ps—poorly sorted. Rounding: wr: well-rounded; r—rounded; sa—subangular. e Carbonate stage: 0—no observed carbonate morphology, 1—few filaments or coatings on sand grains, 2—few to common nodules; matrix between nodules is slightly whitened by carbonate (15–50% by area), and the latter occurs in veinlets and as filaments; some matrix can be noncalcareous; about 10–15% CaCO3. f Carbonate field effervescence codes: we—weak; me—moderate; se—strong [34].
Table 2. Dominant vegetation and vegetative cover for Gold Springs coring locations.
Site NamePositionEstimated % CoverDominant Vegetation
Transect 1
ALinear dune crest<10%Penstemon ambiguus var. laevissimus, Poliomintha incana, Muhlenbergia pungens, Oryzopsis hymenoides
BSide slope30%Ephedra spp., Hilaria jamesii, M. pungens, O. hymenoides
CInterdune50%Ephedra spp., Artemesia filifolia, H. jamesii, M. pungens, O. hymenoides, Plantago spp.
Transect 2
ALinear dune crest30%Yucca spp., P. ambiguus var. laevissimus, P. incana, S. tragus, M. pungens, O. hymenoides
CInterdune50%Ephedra spp., Yucca spp., A. filifolia, G. sarothrae, S. tragus, Bouteloua gracilis, M. pungens, O. hymenoides, Plantago spp.
Transect 3
ALinear dune crest50%Ephedra spp., Yucca spp., G. sarothrae, Hesperostipa comata, M. pungens, H. jamesii, O. hymenoides
CInterdune60%Ephedra spp., Yucca spp., H. comata, B. gracilis, H. jamesii, O. hymenoides, M. pungens, Plantago spp.
Note: all cored sediments were moist below 20–40 cm except interdune cores. Sampling was conducted on 15 June 2008.
Table 3. Site location, associated landform, and dominant vegetation. Latitude, longitude, and elevation acquired at field sites using a Garmin GPSmap 60 handheld unit. Datum: 1984.
Site NameLat. (°N)Long. (°W)Elev. (m)LandformDominant Vegetation
WP3836.04111.141675Linear duneEphedra spp., Salsola tragus, Oryzopsis hymenoides, Bromus tectorum, Bouteloua gracilis
WP4036.06111.121732Linear duneEphedra spp., Yucca spp., B. gracilis, B. tectorum, Muhlenbergia pungens
WP6335.82110.981719Linear duneEphedra spp., Yucca spp., Artemesia filifolia, Gutierrezia sarothrae, M. pungens, O. hymenoides, B. tectorum
WP6535.94110.941812Sand sheetYucca spp., G. sarothrae, M. pungens, O. hymenoides, Hilaria jamesii B., tectorum
WP6636.03111.221599Linear duneYucca spp., G. sarothrae, M. pungens, Hesperostipa comata
WP6936.02111.191693Sand sheetEphedra spp., Yucca spp., G. sarothrae, M. pungens, O. hymenoides, H. comata
WP8135.91110.891942Sand sheetJuniperus monosperma, Ephedra spp., Yucca spp., G. sarothrae, B. gracilis, H. jamesii, H. comata, O. hymenoides
WP8635.97111.151734Linear duneEphedra spp., G. sarothrae, M. pungens, O. hymenoides, H. comata
WP8735.97111.151724Sand sheetEphedra spp., Yucca spp., B. gracilis, H. jamesii, O. hymenoides, Plantago spp.
WP14435.77111.081609Climbing duneG. sarothrae, A. filifolia, S. tragus, M. pungens, O. hymenoides, H. jamesii
WP14535.77111.071648Sand sheetEphedra spp., Yucca spp., G. sarothrae, S. tragus, M. pungens, O. hymenoides, H. jamesii
WP14735.99111.001827Falling duneAtriplex canescens, Ephedra spp., Yucca spp., G. sarothrae, M. pungens, O. hymenoides, H. jamesii, H. comata, B. tectorum
WP14936.09110.971639Sand sheetEphedra spp., Yucca spp., G. sarothrae, O. hymenoides, M. pungens, H. jamesii
WP15435.95111.031807Sand sheetEphedra spp., Yucca spp., G. sarothrae, Opuntia spp., M. pungens, H. jamesii, B. tectorum
Table 4. Soil descriptions and laboratory data.
Horizon aDepth (cm)Dry Color bMoist Color bStructure cDry Cons. dClay Films eCaCO3 Stage fLower Bound. gSand Size hSand (%)Silt (%)Clay (%)CaCO3 (%)Correlated Age
WP38: linear dune near the Hollow Place
C0–237.5YR6/47.5YR5/4m* lo00, wec, scL-vfU90.972.526.523.19Qe3
2Ckb23–897.5YR6/47.5YR5/3mlo00, weg, scL-fU95.421.453.132.67Qe3
3Cb89–1217.5YR6/47.5YR5/4mlo00, weNDmU-vfL90.183.236.592.98Qe3
WP40: linear dune northeast of WP38
Btk10–215YR5/45YR4/3sbk-abk, m-c, 2sh2, f, cobrI+, mec, sND76.348.5515.116.44Qe1
Btk221–505YR5/45YR4/3abk, c-vc, 2h2, f, cobrII, seg, smU-fL77.927.5214.568.03Qe1
Bwk50–745YR6/35YR5/4sbk, m, 1so0II, sed, smL-fU90.802.996.216.63Qe1
Ck74–987.5YR6/47.5YR5/4sbk, c, 1so00, weg, smL-fU89.306.574.133.58Qe1
C98–1537.5YR6/47.5YR5/4sbk, m, 1* lo00, weNDmL-fU94.621.234.151.75Qe1
R153
WP63: linear dune on Tribal Road 5 southwest of Howell Mesa
C0–7510YR6/4NDmlo00, wed, smL-vfU80.9516.872.180.97Qe3
2Cb75–2417.5YR6/4NDmso00, weg, bmU-vfL76.6720.682.662.01Qe3
3Bwkb241–3035YR5/4NDsbk, c, 1so0I−, weNDcL-vfL80.9215.543.542.51Qe2
R30310YR7/3
WP65: sand sheet north of WP63
C0–64ND5YR5/4mlo00, mec, smL-vfL85.9010.643.463.63Qe3
2Bwkb64–947.5YR5/47.5YR4/4sbk, c, 1so0I−, meg, smU-fL89.657.862.493.84Qe2
2Ckb94–1397.5YR6/4NDsbk, c, 1so0I−, weg, smU-fU95.852.681.482.11Qe2
2Cb139–200ND7.5YR6/4m* lo00, weNDmL-fL94.073.872.061.40Qe2
WP66: linear dune downwind from Adeii Eechii Cliffs due south of Tuba City
C0–1125YR5/45YR5/4sbk, c, 1so00, weg, smU-vfLField texture—sandQe3
2Bwk1b112–1675YR5/45YR4/3sbk, m, 1vfr0I, meg, smL-vfLField texture—loamy sandQe2
2Bwk2b167–2255YR6/45YR5/4sbk, m-c, 1vfr0I−, meg, wcL-vfLField texture—loamy sandQe2
2Ckb225–2947.5YR6/47.5YR5/4sbk, m-c, 1vfr00, wea, bNDField texture—sandQe2
R294–30010YR7/3
WP69: sand sheet along Tribal Road 6710 just south of AZ Hwy 264
C0–225YR6/45YR5/4gr, m, 1vfr00, mea, wmU-vfL90.995.973.042.50Qe3
2Bwkb22–355YR5/45YR4/4sbk, m-c, 1sh0I−, mec, wmL-fU88.825.965.222.44Qe3
2Bk1b35–575YR6/55YR5/4sbk, m-c, 1so0I, mec, smU-vfL92.004.393.612.64Qe3
2Bk2b57–765YR6/55YR5/4abk, c-vc, 1so-sh0I, mea, smU-vfL87.066.736.213.30Qe3
3Bwkb76–925YR6/45YR5/4abk, c, 2sh0I+, sec, smL-vfL85.8811.103.022.71Qe2
3Bkb92–1205YR5/45YR4/4sbk, m, 1so0I, meNDmU-vfL82.3414.323.312.92Qe2
R120
WP81: sand sheet on top of Howell Mesa
ABk0–177.5YR5/47.5YR4/3sbk, m-c, 2shND0, mec, wNDField texture—loamQe3
Bwk17–337.5YR5/57.5YR4/4sbk, m-c, 2frNDI+, mec, wNDField texture—loamQe3
2Btkb33–607.5YR5/47.5YR4/3abk-cpr, vc, 3hNDII, seg, sNDField texture—sandy clay loamQe1
3Btkb60–1187.5YR5/47.5YR4/3abk, vc, 3hNDII, seNDNDField texture—sandy clay loamQe1
R118
WP86: Linear dune downwind from Appaloosa Ridge
C0–647.5YR6/47.5YR5/4m* lo00, nea, wmU-vfL92.275.482.241.39Qe3
2Bwkb164–995YR6/45YR5/4sbk, c, 1* vfr0I−, wec, smU-mL89.357.982.662.15Qe2
2Bwkb299–1435YR6/45YR5/3sbk-abk, c, 1so0I−, weg, smU-mL89.248.402.362.53Qe2
2Cb1143–1685YR6/45YR5/4sbk, c-vc, 1so00, wec, scL-vfL96.013.550.432.15Qe2
2Cb2168–2055YR6/45YR5/3sbk, c-vc, 1so00, weNDcL-vfL95.903.410.692.02Qe2
WP87: Interdune west of WP86 on Appaloosa Ridge
C0–245YR5/45YR5/3sbk, f-m, 1* lo00, mea, wmU-vfL85.5511.273.181.36Qe3
2ABkb24–485YR6/45YR5/3sbk, m-c, 1* vfr0I, mec, scL-vfL83.7313.432.832.48Qe1
2Btkb148–765YR5/45YR4/3abk, m-c, 2sh1, f, cobrI, sed, scL-vfL83.9213.073.012.03Qe1
2Btkb276–1355YR5/45YR4/4abk, c-vc, 2sh1, f, cobrI+, seNDcL-vfL83.3413.782.882.44Qe1
R135
WP144: Climbing dune remnant, near Gold Spring, Adeii Eechii Cliffs
C0–107.5YR6/35YR5/3sbk, m, 1–2so00, wea, wfU-fL72.4922.035.482.92Qe3
12Bkb10–265YR6/45YR5/3sbk, c, 2sh0I−, mea, smU-fU78.9216.754.332.00Qe2
3Bkb26–645YR6/45YR5/4abk, vc, 3h0I+, sec, sfU-fL81.9813.015.017.03Qe2
14Bkb64–955YR6/45YR5/3abk, vc, 3h0I+, sea, ifU-fL83.3212.094.592.58Qe2
R95–120
WP145: Sand sheet, Gold Spring, Adeii Eechii escarpment
Btk10–315YR5/45YR4/4pr, c, 3h2, f, cobrII, sec, sfU-fL65.9028.165.956.68Qe1
Btk231–825YR6/45YR4/4sbk-abk, vc, 2h1, f, cobrII, seg, sfU-fL49.0741.319.624.21Qe1
Bk82–2305YR6/45YR5/4sbk, c-vc, 2so0I, mea, ifL-vfL74.2520.824.942.89Qe1
R230
WP147: Falling dune northeast of Coal Mine Canyon Chapter House
C0–1975YR5/45YR4/4mlo0neNDNDField texture—sandQe3
WP149: Sand sheet north of Coal Mine Canyon
C0–387.5YR6/37.5YR5/3mso00, mea, wfU-vfU80.6814.265.063.54Qe3
2Bkb38–667.5YR6/47.5YR5/4sbk-abk, c, 2sh0II, sea, sfU-fL75.4118.995.604.57Qe2
3Btkb166–1147.5YR6/47.5YR4/3pr, c, 3vh2, d, pf, cobrII, sed, sfL-vfL77.4117.624.972.06Qe1
3Btkb2114–1607.5YR6/47.5YR5/4pr, c-vc, 3h1, f, pf, cobrII, sec, sfL-vfL78.8416.414.752.48Qe1
3Bkb160–2007.5YR6/47.5YR5/4sbk-abk, c-vc, 2sh0I+, mea, icL-vfL87.739.133.142.94Qe1
R200
WP154: Sand sheet along Tribal Road 6720
Btk0–327.5YR5/47.5YR4/3abk, vc, 2h2, f, cobrI+, sec, icU-fU80.3715.344.292.03Qe1
2Btk32–645YR5/45YR4/3abk-pr, vc, 3h3, d, cobrII, sed, scL-vfU81.3714.104.532.71Qe1
2Bwk64–1087.5YR5/47.5YR4/3sbk, c, 1so0I−, med, scL-vfL94.543.771.691.34Qe1
2C108–1667.5YR6/47.5YR5/4sbk, m, 1so00a, imu-vfU95.972.411.621.59Qe1
R166
a Field soil descriptions after Birkeland (1999) [34]. b Soil colors determined using Munsell soil color chart. c Structure codes: Type: m—massive; gr—granular; sbk—subangular blocky; abk—angular blocky; pr—prismatic; cpr—columnar. Size: f—fine; m—medium; c—coarse; vc—very coarse. d Dry consistence codes: lo—loose, noncoherent; so—soft; sh—slightly hard; h—hard; vh—very hard; * lo—loose (moist); * vfr—very friable (moist). e Clay film codes: Amount: vf—very few; 1—few; 2—common; 3—many. Distinctness: f—faint; d—distinct. Location: pf—ped faces; po—pores; cobr—colloid coats and bridges. f Carbonate field effervescence codes: we—weak; me—moderate; se—strong; ve—violent; g Lower boundary codes: Distinctness: a—abrupt; c—clear; g—gradual; d—diffuse. Topography: s—smooth; w—wavy; b—broken; i—irregular. h Grain size described in the field, codes use the Modified Wentworth scale: vc—very coarse; c—coarse; m—medium, f—fine; vf—very fine. U—upper; L—lower. Laboratory analyses in bold italics were performed at the Quaternary Soil and Sediment Laboratory at the University of New Mexico, all others were performed at the USGS Soils Laboratory in Denver, Colorado. ND—no field data; laboratory analyses were not performed for sites WP66, WP81 and WP147. 1 Parent material contains up to 10% matrix supported angular to subangular gravel and is interpreted to be colluvium, all other parent materials are eolian.
Table 5. Optical ages for eolian sand sedimentary deposits from sites on the Moenkopi Plateau, northeastern Arizona. Equivalent dose and OSL age determined using single aliquot regeneration (SAR) protocols under blue light excitation [5].
Sample NumberDepth (m)Water Content (%) aK (%) bTh (ppm) bU (ppm) bCosmic Dose Additions (Gy/ka) cTotal Dose Rate (Gy/ka)Equivalent Dose (Gy)N dAge (ka) e and Correlated Age f
WP38: linear dune near the Hollow Place
E-101.12 (28)1.37 ± 0.013.06 ± 0.130.62 ± 0.050.25 ± 0.011.96 ± 0.041.11 ± 0.4822 (30)0.57 ± 0.24 (Qe3)
WP40: linear dune northeast of WP38
E-71.42 (20)0.61 ± 0.011.56 ± 0.060.58 ± 0.060.25 ± 0.021.10 ± 0.039.50 ± 1.0434 (40)8.62 ±1.02 (Qe1)
WP63: linear dune on Tribal Road 5 southwest of Howell Mesa
E-40.72 (24)1.13 ± 0.011.45 ± 0.150.56 ± 0.070.26 ± 0.021.62 ± 0.063.16 ± 0.5623 (37)1.95 ± 0.37 (Qe3)
E-52.23 (28)1.34 ± 0.022.70 ± 0.201.05 ± 0.090.22 ± 0.011.97 ± 0.065.55 ± 0.5920 (30)2.82 ± 0.31 (Qe3)
E-62.73 (28)1.28 ± 0.012.67 ± 0.130.91 ± 0.050.21 ± 0.011.86 ± 0.047.83 ± 0.8620 (30)4.21 ± 0.50 (Qe2)
WP65: sand sheet north of WP63
E-90.56 (30)1.40 ± 0.013.26 ± 0.190.89 ± 0.050.28 ± 0.012.09 ± 0.057.25 ± 0.6719 (24)3.47 ± 0.34 (Qe2)
E-82.02 (23)1.24 ± 0.012.22 ± 0.120.57 ± 0.050.23 ± 0.011.75 ± 0.0412.6 ± 1.1320 (30)7.21 ± 0.67 (-----)
WP144: climbing dune remnant near Gold Spring, Adeii Eechii Cliffs
E-180.62 (37)1.44 ± 0.041.31 ± 0.072.40 ± 0.160.26 ± 0.222.13 ± 0.068.80 ± 0.7618 (20)4.13 ± 0.37 (Qe2)
WP145: sand sheet at Gold Spring, Adeii Eechii Cliffs escarpment
E-191.73 (37)1.61 ± 0.111.43 ± 0.233.21 ± 0.220.23 ± 0.222.35 ± 0.1128.1 ± 1.5421 (30)12.0 ± 0.85 (Qe1)
WP149: sand sheet north of Coal Mine Canyon
E-201.73 (30)1.51 ± 0.081.22 ± 0.093.57 ± 0.180.23 ± 0.222.25 ± 0.0720.6 ± 1.4826 (30)9.16 ± 0.72 (Qe1)
WP154: sand sheet along Tribal Road 6720
E-211.52 (27)1.39 ± 0.060.91 ± 0.092.42 ± 0.220.25 ± 0.221.99 ± 0.0815.4 ± 0.9526 (30)7.72 ± 0.56 (Qe1)
a Field moisture, with figures in parentheses indicating the complete sample saturation (%). Ages calculated using 10% of saturation values. b Analyses obtained using laboratory Gamma Spectrometry (high resolution Ge detector). c Cosmic doses and attenuation with depth were calculated using the methods of Prescott and Hutton (1994) [46]. See text for details. d Number of replicated equivalent dose (De) estimates used to calculate the mean. Figures in parentheses indicate total number of measurements made including failed runs. e Dose rate and age for fine-grained (125–180 µm) quartz sand. Linear + exponential fit used to estimate age, errors to one sigma. f Correlated age determined from soil stratigraphy and geomorphic field relationships.
Table 6. Comparison of Btk horizons from Qe1 soil profiles in the study area.
Horizon aStructure bDry Cons. cClay Films dCaCO3 Stage eUpper Bound. fSand (%)CaCO3 (%)
WP40: linear dune northeast of WP38
Btk1sbk-abk, m-c, 2sh2, f, cobrI+, meat surface76.346.44
Btk2abk, c-vc, 2h2, f, cobrII, se2–5 cm77.928.03
WP81: sand sheet on top of Howell Mesa
2Btkbabk-cpr, vc, 3hNDII, se2–5 cm50–75 g
3Btkbabk, vc, 3hNDII, se5–15 cm50–75 g
WP87: Interdune west of WP86 on Appaloosa Ridge
2Btkb1abk, m-c, 2sh1, f, cobrI, se2–5 cm83.922.03
2Btkb2abk, c-vc, 2sh1, f, cobrI+, se>15 cm83.342.44
WP145: Sand sheet, Gold Spring, Adeii Eechii escarpment
Btk1pr, c, 3h2, f, cobrII, se<2 cm65.906.68
Btk2sbk-abk, vc, 2h1, f, cobrII, se2–5 cm49.074.21
WP149: Sand sheet north of Coal Mine Canyon
3Btkb1pr, c, 3vh2, d, pf, cobrII, se<2 cm77.412.06
3Btkb2pr, c-vc, 3h1, f, pf, cobrII, se>15 cm78.842.48
WP154: Sand sheet along Tribal Road 6720
Btkabk, vc, 2h2, f, cobrI+, se<2 cm80.372.03
2Btkabk-pr, vc, 3h3, d, cobrII, se2–5 cm81.372.71
a Field soil descriptions after Birkeland (1999) [34]. b Structure codes: Type: m—massive; gr—granular; sbk—subangular blocky; abk—angular blocky; pr—prismatic; cpr—columnar. Size: f—fine; m—medium; c—coarse; vc—very coarse. c Dry consistence codes: lo—loose, noncoherent; so—soft; sh—slightly hard; h—hard; vh—very hard; * lo—loose (moist); * vfr—very friable (moist). d Clay film codes: Amount: vf—very few; 1—few; 2—common; 3—many. Distinctness: f—faint; d—distinct. Location: pf—ped faces; po—pores; cobr—colloid coats and bridges. e Carbonate field effervescence codes: we—weak; me—moderate; se—strong; ve—violent; f Upper boundary codes: Distinctness: < 2 cm—abrupt; 2–5 cm—clear; 5–15 cm—gradual; >15 cm—diffuse. g Soil texture described in the field only. ND—no field data
Table 7. Unit boundaries from table of soil profile descriptions. Boundary descriptions after Birkeland (1999) [34].
Between UnitsWithin Unit
BoundariesQe1 to Qe2Qe1 to Qe3Qe2 to Qe3Qe1Qe2Qe3
Abrupt (<2 cm)144011
Clear (2–5 cm)011544
Gradual (5–15 cm)002451
Diffuse (>15 cm)000501

