Article

Temporal and Spatial Variability of Sediment Transport in a Mountain River: A Preliminary Investigation of the Caldone River, Italy

Department of Civil and Environmental Engineering, Politecnico di Milano, 20133 Milan, Italy
*
Author to whom correspondence should be addressed.
Geosciences 2018, 8(5), 163; https://doi.org/10.3390/geosciences8050163
Submission received: 28 December 2017 / Revised: 26 April 2018 / Accepted: 1 May 2018 / Published: 4 May 2018

Abstract

:
Sediment transport is a key evolution process of rivers and water basins. This process can pose flood hazards to nearby areas. The Eulerian and Lagrangian methods are usually employed to describe sediment transport in mountain rivers. The application of different methods was proposed by scientists to analyze specific aspects of solid transport, however a complete understanding still alludes us. After a brief review of the most common methods, the coupling of three different methods is proposed and tested in order to study sediment dynamics, and its spatial and temporal variability, in mountain rivers. Tracers, painted bed patches, and digital elevation model (DEM) comparisons are used to characterize sediment transport at both a micro-scale short-term and a macro-scale long-term level on a test reach on Caldone River, Italy. Information about travel distance, critical diameters, active width, and morphological evolution was sought. We focused on how water discharge is changing the relationships between different measurement techniques. High discharge events force the channel to behave in a unique way, while low discharge events generate more intrinsic variability. Only measurement technique coupling can overcome this issue. Results are encouraging and show the potential of a mixed Eulerian-Lagrangian approach.

1. Introduction

Sediment transport is a key evolution process of rivers and watersheds. In addition to floods, sediments represent a hazard that can cause major damage to infrastructure and settlements near riparian zones [1,2,3,4]. A deeper knowledge of the sediment sources [5,6,7,8,9,10] is needed to, forecast and control the hazard, understand the underlying physics, and reduce the associated risk.
This condition is common to both mountain and low-gradient streams, but they are different both in sediment and water flow features, due to high variability in sediment size and sediment sources [11]. Thus, the application of classic methods, such as sediment traps or turbidity sampling, to estimate sediment transport in slow current, low gradient rivers, provide reliable results. However, these techniques cannot be extended to steep mountainous rivers due to the variation of hydraulic processes in time and space. Seasonal discharge changes are higher than in lowland streams, as is the intensity of sediment transport and debris velocity. The complex condition of the river channel, influenced by boulders, debris, wood, and bedrock [12], causes highly variable bed-load transport rates [13].
Sediment transport in mountain catchments occurs in different modes, including gravity flows, bed-load, suspended load, and dissolved load [14]. In most studies, bed-load is conventionally considered to be 10% of the suspended load [15,16,17]. While the proportion of bed-load to total load ranges from 5% to 20% in lowland rivers [18,19], it may reach up to 80% in mountain streams [20,21,22].
Bed-load transport is the mobilization of the largest diameter classes, which cause the most relevant effects in terms of aggradation and impact on structures.
Few studies in the scientific literature have quantitatively measured bed-load transport in mountain basins [23,24]. To measure bed-load transport, travel distance, critical diameter, pathways, source, and deposition areas are usually quantified. Methods to measure sediment transport are usually divided into the Lagrangian approach and Eulerian approach, and are mostly derived from laboratory testing [25,26,27,28]. The Lagrangian approach refers to following the trajectories of single clasts, and the Eulerian approach refers to characterizing the sediment transport properties at a specific area. Since laboratories have a controlled environment and variables can be held constant (only changing one at a time, while natural rivers exhibit large variability), the exportability of these methods from the laboratory to the field is not straightforward.
Lagrangian methods are mainly focused on tracing pebbles; irrespective of the chosen technology, they can be found and identified in the river by in situ surveys, in order to record their position at any time. The most common identification methods include passive and active radio tags, iron or magnetic pebbles, painted pebbles, and radioactive sources [29,30,31]. Tracking pebbles is important to understanding sediment mobility during average and intense flow events [32,33], since this approach is effective at most flow rates. The literature presents many examples, with some authors focusing on the relationship between peak discharge and/or duration [34], particularly in mountainous regions. Different objectives can be addressed through the use of tracers, such as transport rates, transport distances, and more probable pathways [35,36,37]. Event-based surveys also provide data on mobilization thresholds, sediment sorting, depth and width of the active layer (defined as the thickness of the river bed that is moving), and source and deposition areas [11]. The population of measured displacements, linked to their causative process, can be used in advanced statistical interpretation of the clasts’ transport behavior. Some authors [38] noted that tracers placed in the thalweg move 15 to 30 times more than tracers entrapped in bars. This suggests that the river bed displays different velocities, with bar sediments that start moving only when adequate shear stress is reached.
Nevertheless, the use of radio tags presents some technical limitations. Passive tracers cannot be inserted into grains that have major axis <60–70 mm, while active tags need a bigger host pebble due to battery dimension. In this way, tracers represent only the largest fraction of the granulometric curve. Despite this, the collected results could be used for fine tuning or validating the numerical simulation and modeling, in comparing measured and expected transport in terms of distances and mobilized diameters [39]. To guarantee a pure Lagrangian approach, tracers are normally sought with a mobile antenna. Nevertheless, examples of using fixed antennas exist and make this approach closer to a Eulerian approach [40,41]. Stationary antennas provide continuous monitoring of the study reach and, thus, a larger amount of reliable data with a better understanding of the incipient motion conditions.
The Eulerian approach focuses on measuring all sediments stopping or leaving a controlled volume, while the motion of a single particle is neglected. Different techniques are used for this, including sediment traps, piezoelectric bed-load impact sensors (PBISs), digital elevation model (DEM) comparison, section evolution monitoring, scour chains, painted bed patches, and sedimentation pool bathymetric surveys. Sediment traps and PBISs have the same objective of measuring all sediments crossing a certain point of the bed, independently from their dimensions and, thus, operate at a very small, localized scale. Obviously, there is a huge difference in cost and complexity, but both present some disadvantages: Sediment traps only provide a measure of transport after an event and can be filled during major floods, while PBISs give real-time, high-resolution measurements of passing sediment but work just for >20 mm clasts and requires ad hoc complicated calibration that could worsen the results on short and intense events [42]. Some authors enlarged the scale, to measure the relevant sections in a river several times in order to estimate river-bed macro-variations due to sediment transport processes [43]. In an effort to improve the results, the DEM of the riverbed is also acquired as an alternative method to evaluate morphologic evolution [8].
All of these methods provide surface transport information, but not of the depth of the active layer. To investigate this aspect, the use of scour chains is commonly employed. Scour chains are metal link chains which are vertically buried in the river bed. After an event, the depth of the active layer can be evaluated as the portion of the chain that has moved.
Some authors [44] propose a method to evaluate the incipient movement of clasts in a riverbed based on the application of paint on patches of the bed. A pre-event and post-event comparison of the granulometric curve determines the clasts’ entrainment by the flow; critical diameter determination is then quite straight forward. The critical diameter is commonly defined as the largest grain size moved in an event. This technique overcomes the impossibility to apply the equations developed for low gradient channels, like the Shields formula [45], to steep mountain rivers, due to the higher flow rate variability, and rough bed with coarse sediments.
Different temporal and spatial domains can be evaluated when studying sediment dynamics. One could record data during an event or after each event, and this will be defined as a short-term scale. However, it is possible to enlarge the time span to a medium or long-term scale, one hydrological year, or more. In the same way, the investigated spatial domain could be extremely small. For painted patches or sediment traps, we will speak of the micro-scale, but it can also be enlarged to a portion of the reach, comparing river bed DEM to support studies of morphological evolution trough time. The natural disposition of a river to change its morphology is often neglected, and the observation of evolutionary tendencies is not correctly interpreted or taken into account, particularly in mountain streams [46]. The literature analysis highlighted how each method has the best performance in measuring specific processes over a range of time and space domains. Due to the variability in mountain rivers, the integration of different methods is mandatory to describe all the processes happening and their variation in space and time. Banks and bars behave differently from the thalweg, and long-term processes are slightly more predictable than short-term ones. Few authors proposed attempts to integrate approaches instead of focusing on a single process or method [47].
This paper presents preliminary work to test the possibility of coupling and integrating different methods to record sediment dynamics in a mountain river, summing short and long-term, micro and macro-scale observations. We propose an integration of the Lagrangian and Eulerian methods to create a new dataset to improve our understanding of the problem. The Lagrangian method consisted of tracers and the Eulerian method deployed painted patches, while a morphological analysis was used to verify changes, caused by torrent dynamics, observed during the monitoring period.

2. Materials

The main goal of this research is to collect data about the sediment dynamics of a mountain river, combining different analytical techniques at a micro and macro scale. Micro-scale surveys allow one to describe internal variability and behaviors of different parts of the same stream reach.
We chose the Caldone River basin, a pre-alpine basin in Italy, flowing across the city of Lecco, 50 km north of Milan, Italy. We wanted to fully characterize transport by coupling processes, with the temporal resolution being at the single-event scale. Three approaches were combined to investigate the sediment dynamics: A Lagrangian tracer-based approach, an Eulerian approach based on painted bed patches, and DEM comparison. In Figure 1, a flowchart of the work is presented. The Lagrangian approach employs RFID tracers which were searched for after any event. This is a different method than what was done by many authors [11,32,33,38,48], who used months or years as time intervals between surveys. This technique measures micro-scale short-term dynamics of pebbles in thalweg, while an event-based survey allowed for deeper understanding, since pebbles’ movements are linked directly to the causal event, while the displacement database has a higher resolution than yearly time scales. A longer time span forces researchers to account for the sum of events and also the mean values of the controlling variables. The Eulerian approach combines the use of painted bed patches with the creation and comparison of DEM bed models. The aim of the former is to determine incipient motion conditions, hence it is classified as a short-term micro scale analysis [45]. DEM comparison allows for the determination of whether long-term macro-scale trends of morphological evolution exist in the river [43].

2.1. Case Study

The Caldone River hydrographic basin is 24 km2, with elevation ranging from 197m to 2118 m above sea level (a.s.l.) at the top of Grigna Meridionale (Figure 2). In the upper part of the basin, above 400 m a.s.l., the Caldone River drains Triassic and dolomitic limestones of the Angolo, Prezzo, and Esino formations. In the middle part, the river cuts through red arenites, pelites, and yellow dolomites of the San Giovanni Bianco formation and Pleistocene glacial deposits, lacustrine and alluvial fan deposits, and debris flows [49]. In the lower part of the basin, the river flows through an urbanized floodplain. The average precipitation over the city of Lecco (population 50,000) is about 1400 mm/year, concentrated in late spring and autumn. During summer, storms are common and can be intense, while winter precipitation is less intense, with snow accumulation being present only in the higher part of the basin. In its last kilometer before the outlet into the Lario Lake, the Caldone River flows within a culvert that passes below the town center (Figure 3b). The combination of short runoff time, high slope (from 1.5% to 5.5%), intense sediment transport, and a high water discharge within a densely urban area makes the Caldone River a potential hazard for the city of Lecco. Monitoring devices installed in the basin are provided in Table 1.
Moreover, two sediment retention basins are present in the last 5 km of the river, with volumes of around 3000 m3 each. These pools get filled with sediment in about three years. Unfortunately, precise filling data is not available, but the volume of deposited sediments could be determined from pictures and dredging operation reports. Data is available from 1999 to 2018. Sedimentation pools protect the culvert from excessive solid transport, which can result in channel blockage, due to a reduced cross-section of the culvert entrance (Figure 3b).
However, some crucial data was lacking to characterize the basin and the river: Granulometry and water discharge. Granulometry is useful for understanding which fraction of sediment could move under certain flow conditions. Granulometry was determined at 16 points along the river stretch. A photographical technique developed by ETH Zurich [50] was applied, along with sediment size analysis. The results are reported in Table 2.

2.2. Subcatchments of the Caldone River

The watercourse consists of two main stretches, upstream and downstream of the confluence with the Grigna River (Figure 2). The upstream segment is the steepest (about 18%) and flows through narrow canyons and valleys with low debris coverage. The river is completely natural and well-confined by fluvial and glacial terraces. The lower part has milder slopes (about 4%) but locally crosses plains, where it forms bends and meanders due to the gentler slope, similar to reach 10 (Figure 2). This segment crosses the city, partially underground, and is rich in structures, levees, and check dams. From this preliminary classification, a further division into 14 sections was possible. The criteria used were adopted from [51], based on the geometrical features of the river, such as the degree of river confinement, river length, width, slope, and river bed shape. From this analysis, three stretches of the river were chosen to represent the entire course: Stretches 6, 7, and 11 (Figure 2). A choice was made to select reaches with different features and which were logistically easier to monitor. The main features are reported in Table 2.
Stretch 6 is about 1 km long, with a mean slope of 5.5%, low confinement, and low presence of artificial structures. This segment represents the most natural part of the river. The segment ends in a big sedimentation pool of about 4500 m3 (Figure 3a).
Stretch 7 is well-confined and 375 m long, with a mean slope of 3.7%, and is just downstream of the sedimentation pool. This segment contains check dams and concrete levees. It was chosen to represent an intermediate situation between natural and artificial river bed.
Stretch 11 is 800 m long and constrained artificially. The bed is not erodible in most of the reach and its last 600 m are completely underground. The slope is limited to 1.5% and artificial walls confine the river. The analyzed segment has a natural bed which is plain and without bars or sediment accumulations. This stretch was chosen to investigate sediment dynamics within highly urbanized areas. The measured granulometric distribution showed higher coarse fraction, even though the slope is lower. This is due to the upstream presence of a sedimentation pond, which retains most of the debris coming from upstream. The finer fraction has probably been transported to the outlet in previous floods, since there is no fine material coming from upstream. In reach 11, the painted bed patches technique could not be applied, since the bed is completely covered by a water stream, even during low flow periods.

2.3. Water Discharge Measurement

Particle image velocimetry (PIV) measures the surface velocity of water using a short video, and calculates the mean velocity of each cell [52]. Videos were acquired with GoPro Here 4 cameras at 30 frames per second. The images were processed using self-developed software [53]. Twenty-seven measurement cells are drawn in the sections, each cell being 20 cm wide. The surface velocity is correlated to the stream velocity, thanks to two contemporary propeller measures in the river at different water stages. Estimated error in velocity measurements is about 15%, which is an acceptable value compared to those documented in earlier uses of PIV [52,53]. This approach enables the construction of a stage-discharge relationship to measure discharge at any moment, based on the recorded water height. It was performed at two different points of the Caldone River, where stage measurements are available [54]. All discharge events presented in this paper were calculated using the PIV technique. It was extremely important to link any displacement to its own causing event flow, since we based our observation on a short-term event scale approach. The two selected spots have regular and non-turbulent flow features, to maximize the expected PIV results.

2.4. Surveyed Events

We surveyed 18 rain events from July 2016 to November 2017, and data about tracers of event 7 and 11 were lost due to technical issues. The main characteristics of these events are reported in Table 2. The rainfall regimes varied considerably between 2016 and 2017. The rainfall in 2016 was close to average, with a rainfall deficit experienced in winter, while 2017 was a dry year with some large storms in summer, but overall there was a water deficit of about 200 mm with respect to the average of 1400 mm/year.

3. Methods and Results

3.1. Lagrangian Method

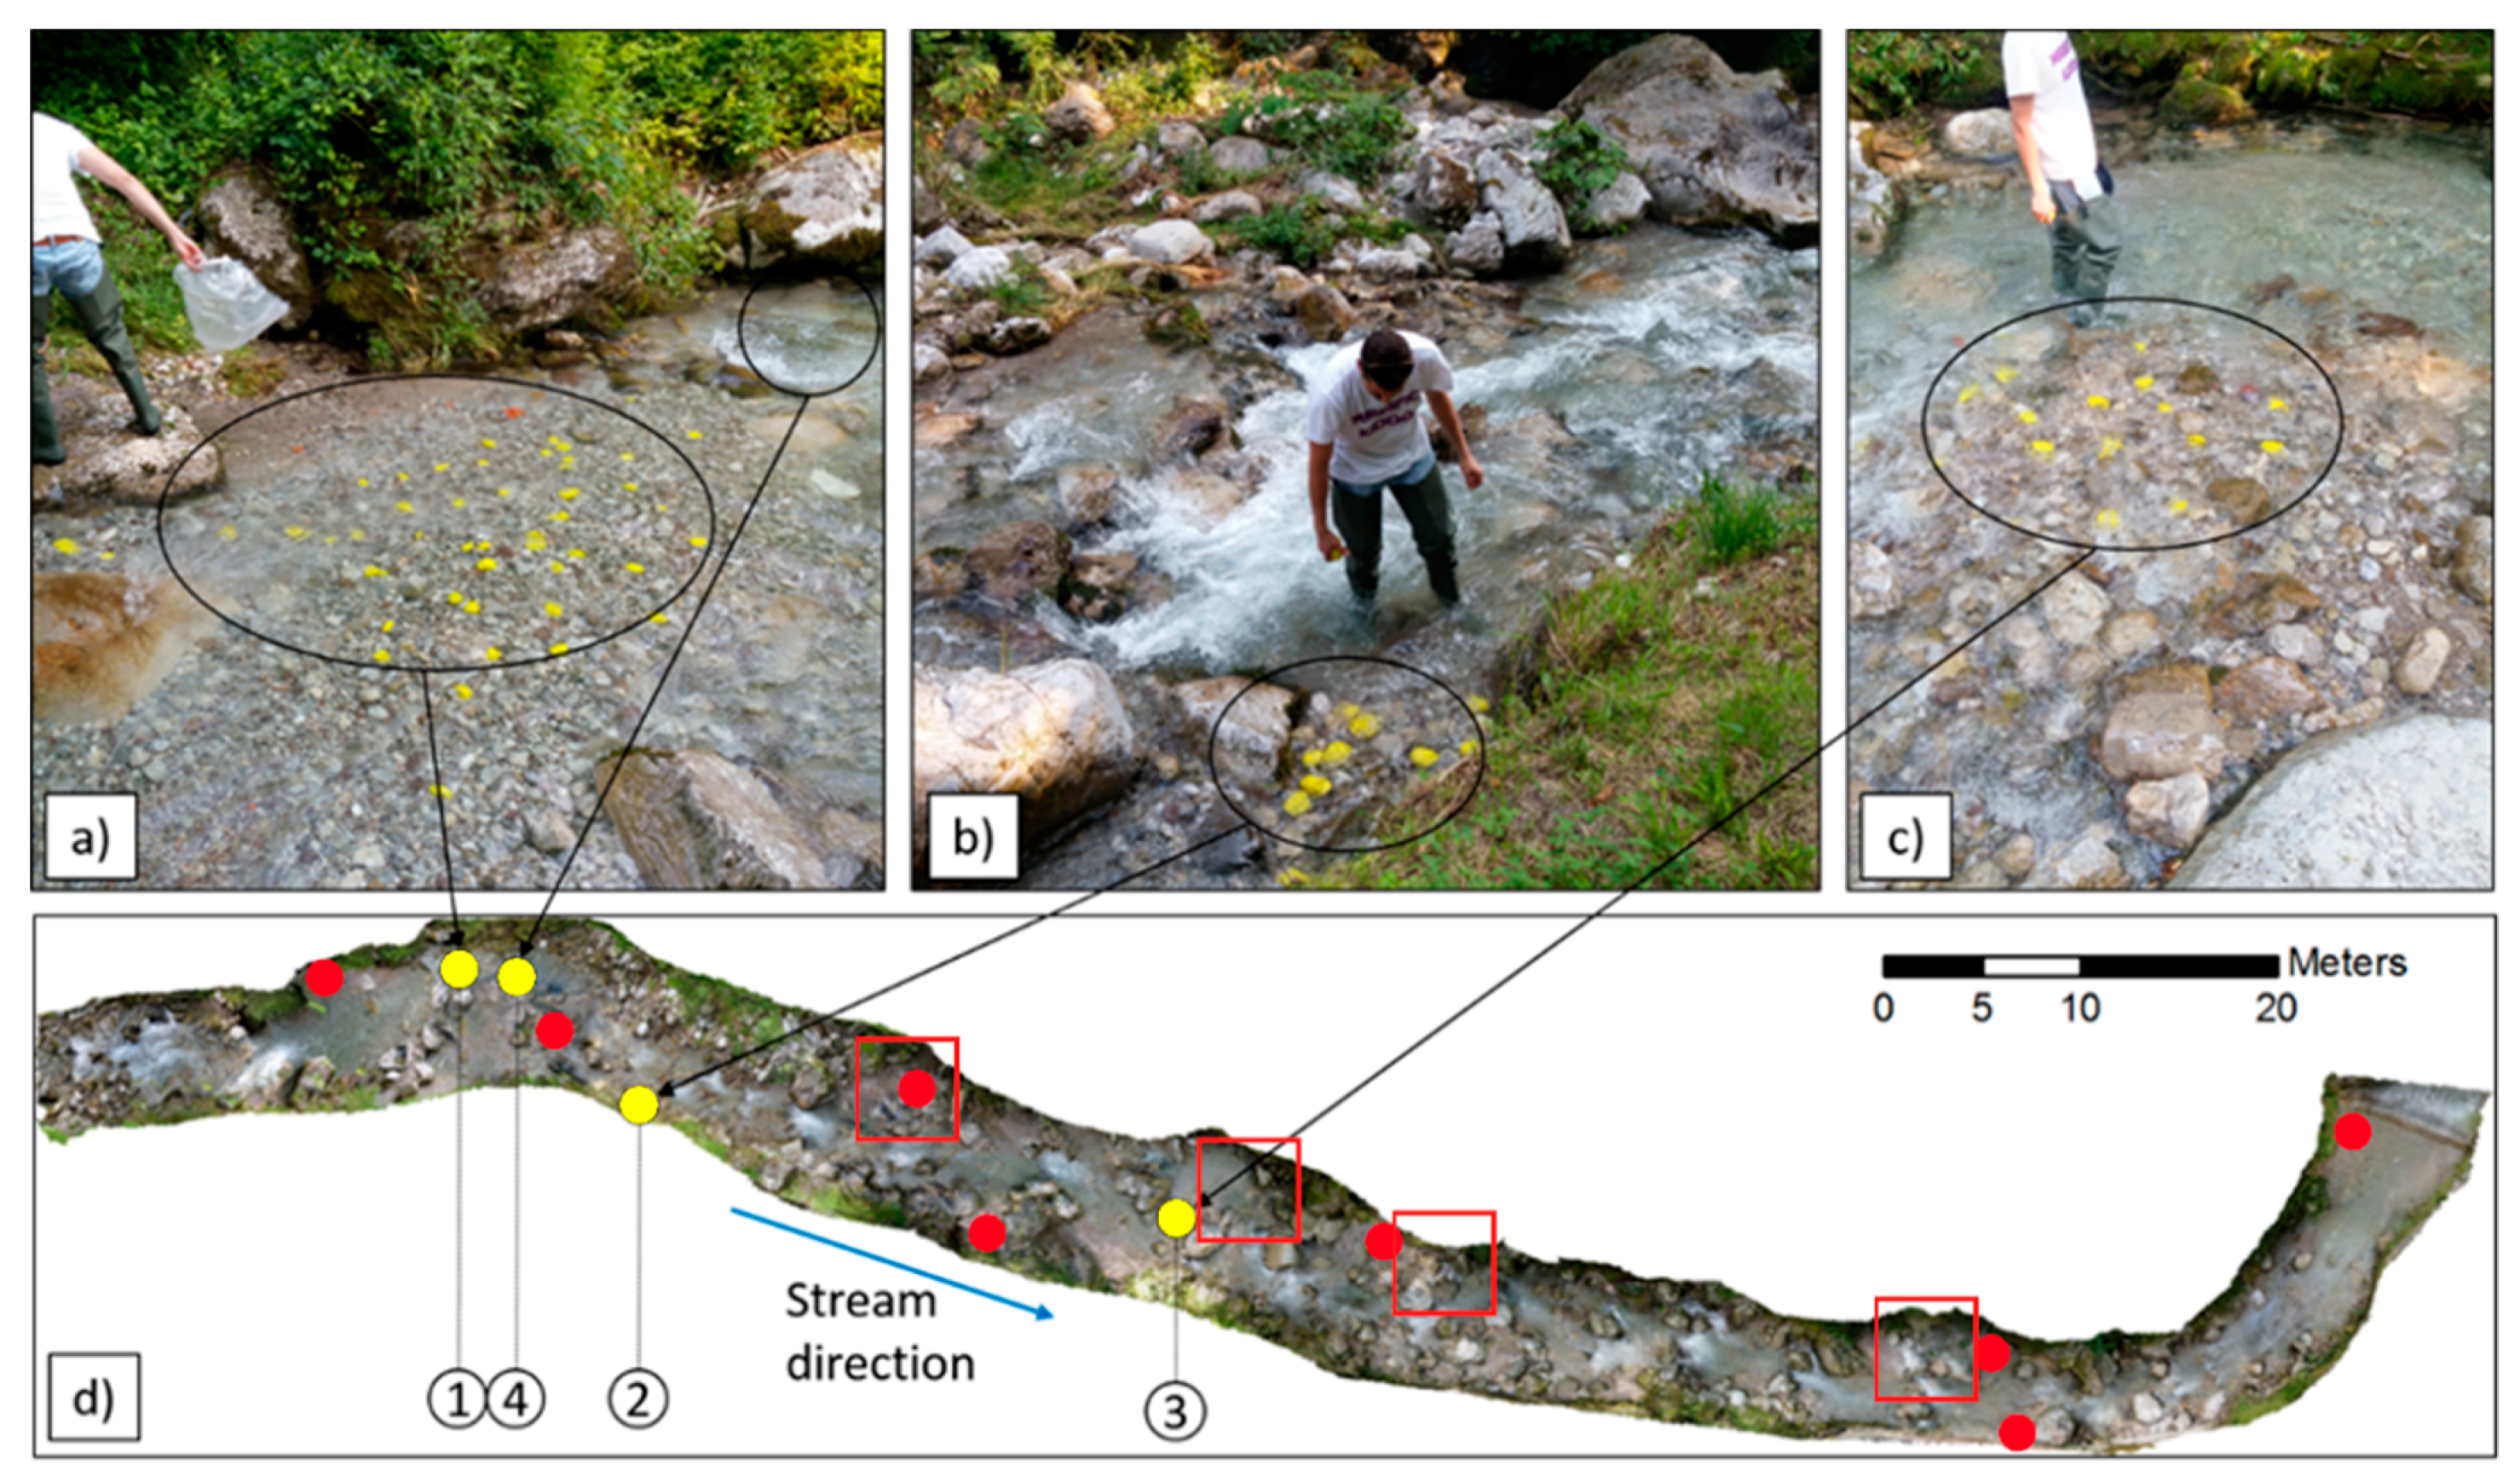
The applied Lagrangian approach consists of following each pebble along the river, recording each of its movements after any significant rain event. In order to retrieve and identify each pebble in the river, radio-frequency identification (RFID) technology was adopted. Each pebble is equipped with a transponder that, if stimulated by an electromagnetic field generated by an antenna, transmits back its identification number to the antenna. A special script stores the ID, along with a GPS position and retrieval time in a database. It is, thus, possible to keep track of the particle displacements over time [11,31]. The pebbles are painted yellow for ease of location and reading their RFID (Figure 4). The technical details of the equipment and pebble preparation are discussed elsewhere [2,54].
The recovery ratio of pebbles and tracers decreases over time. Tracers get lost over time. Sediment burial or transportation beyond the study reach are possible causes. In this research, a total of 504 RFID-equipped pebbles were dispersed in the river at the beginning of the three selected reaches presented in Table 2. Table 3 presents the main features of each surveyed event and the tracers’ recovery ratio. Namely, 327 pebbles were placed in reach 6, 118 in reach 7, and 69 in reach 11. This uneven distribution is linked to an expected recovery ratio of each stretch, hence more pebbles have been inserted in more active reaches to compensate for a lower expected recovery ratio. Deployment spots in reach 6 are shown in Figure 4. The RFID-equipped pebbles were selected to represent the D90 of each stretch of the river, and were collected directly in the river to characterize the bed transport that affects the largest fraction of the granulometric curve.
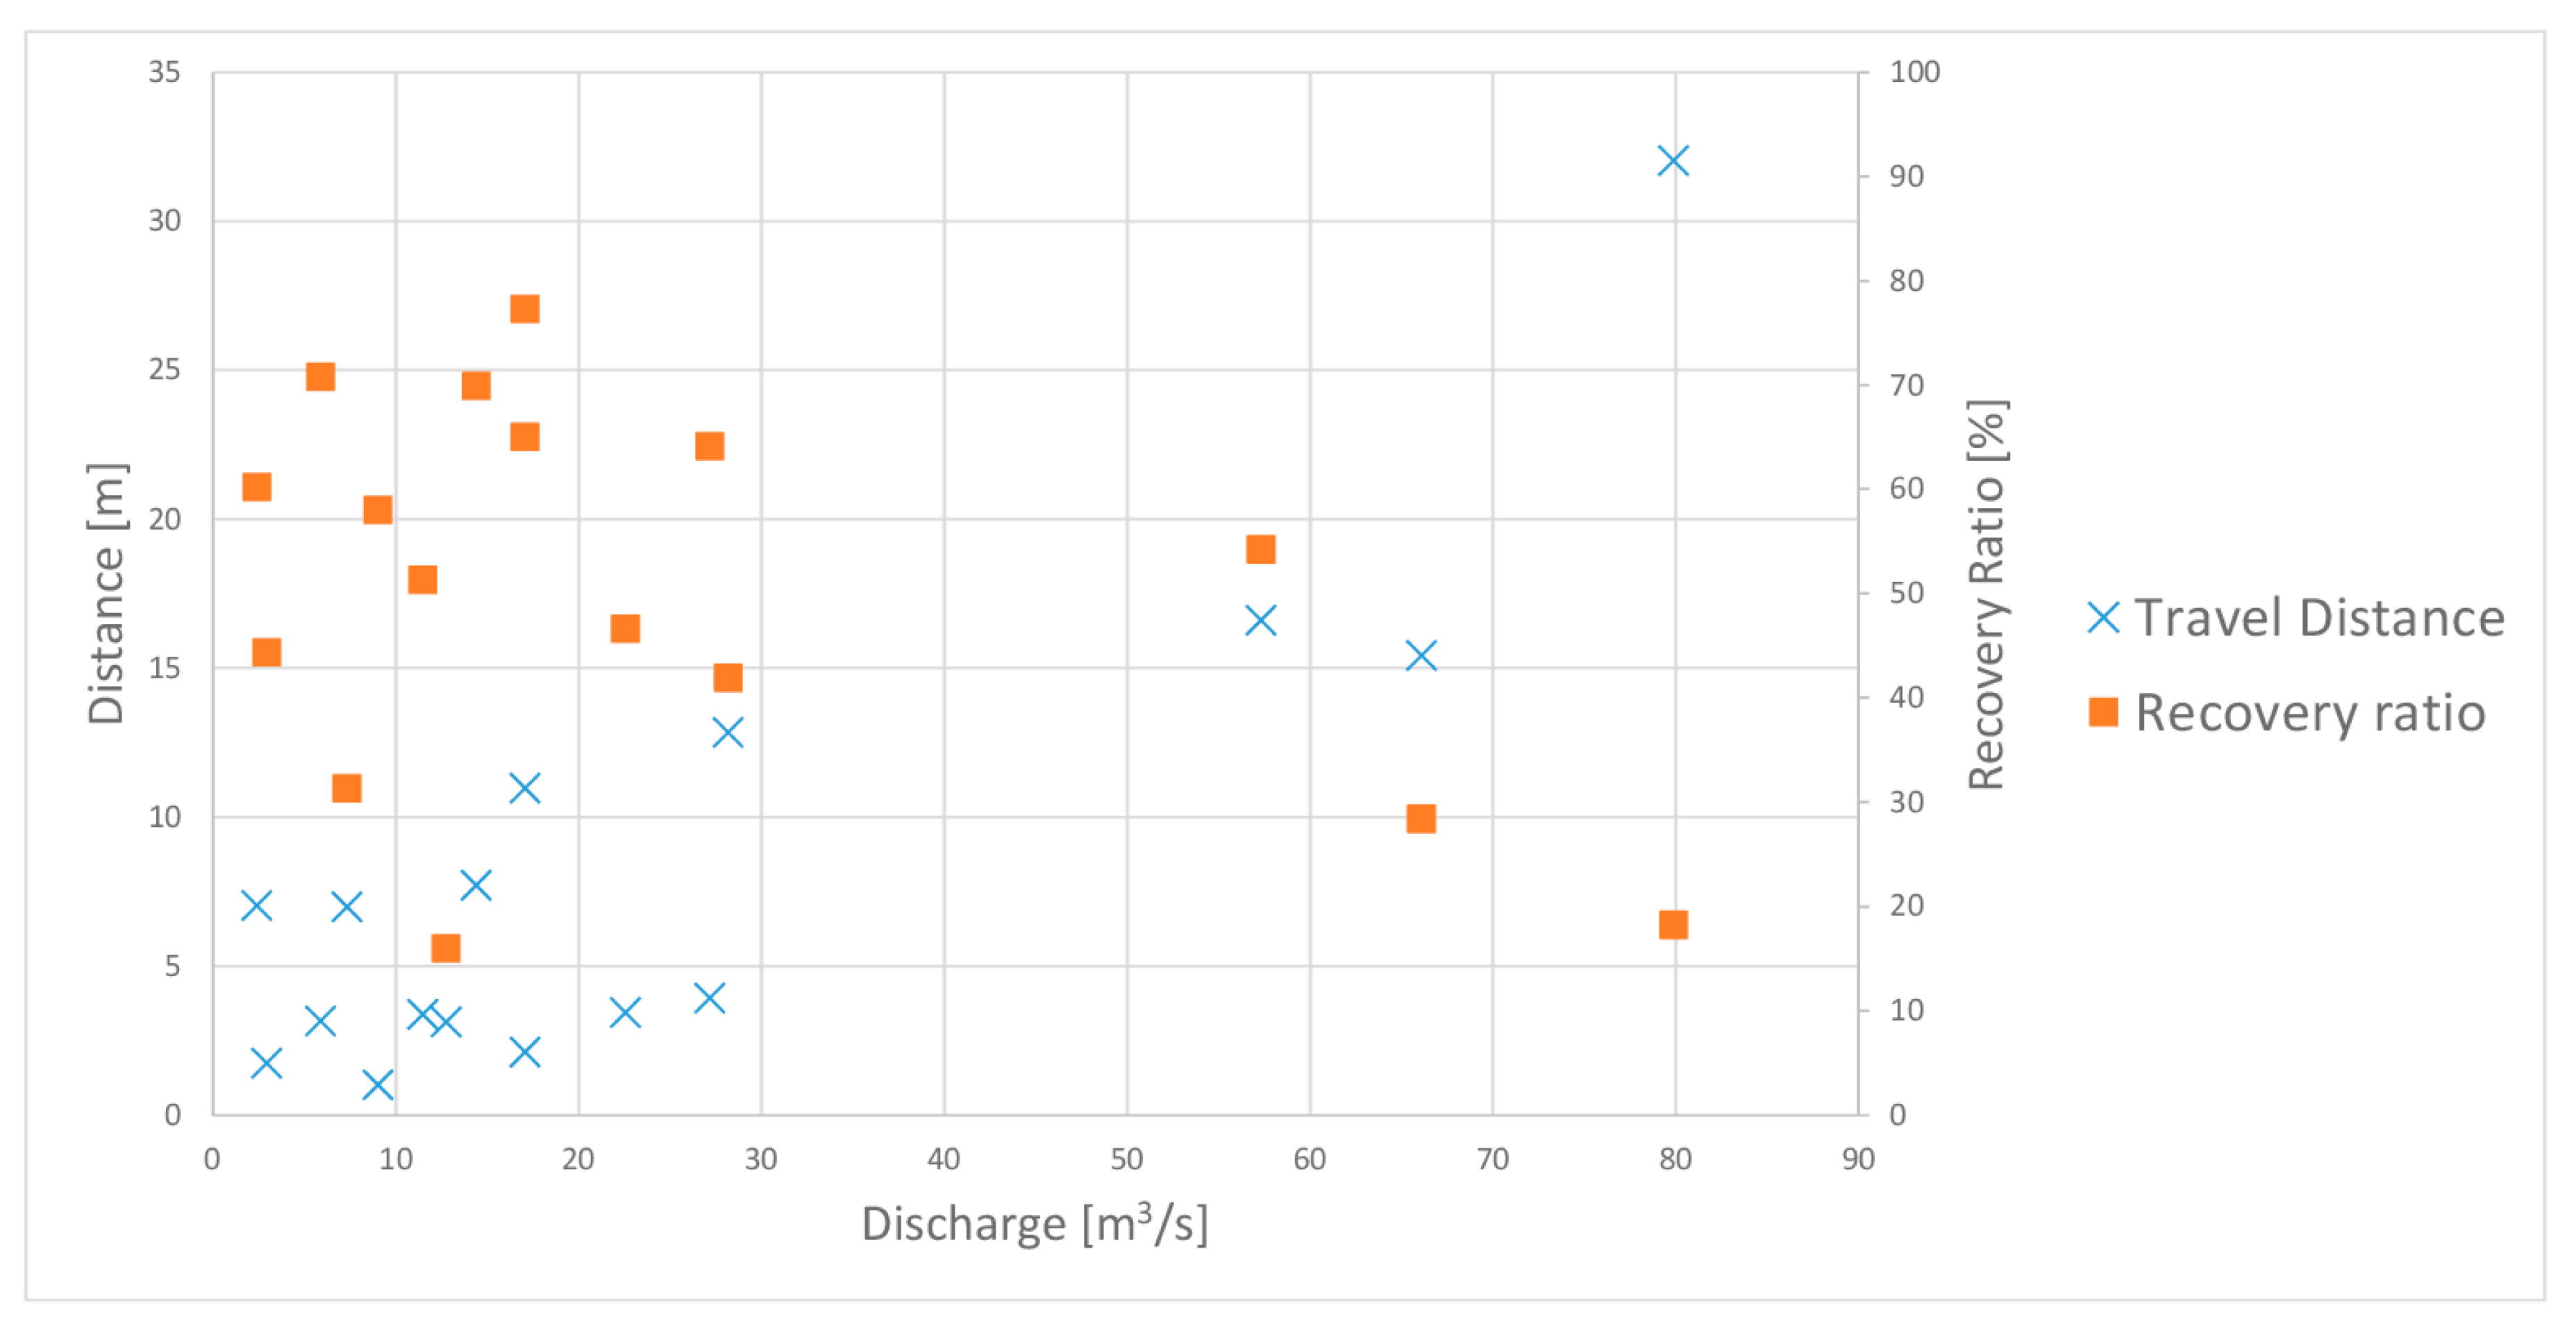
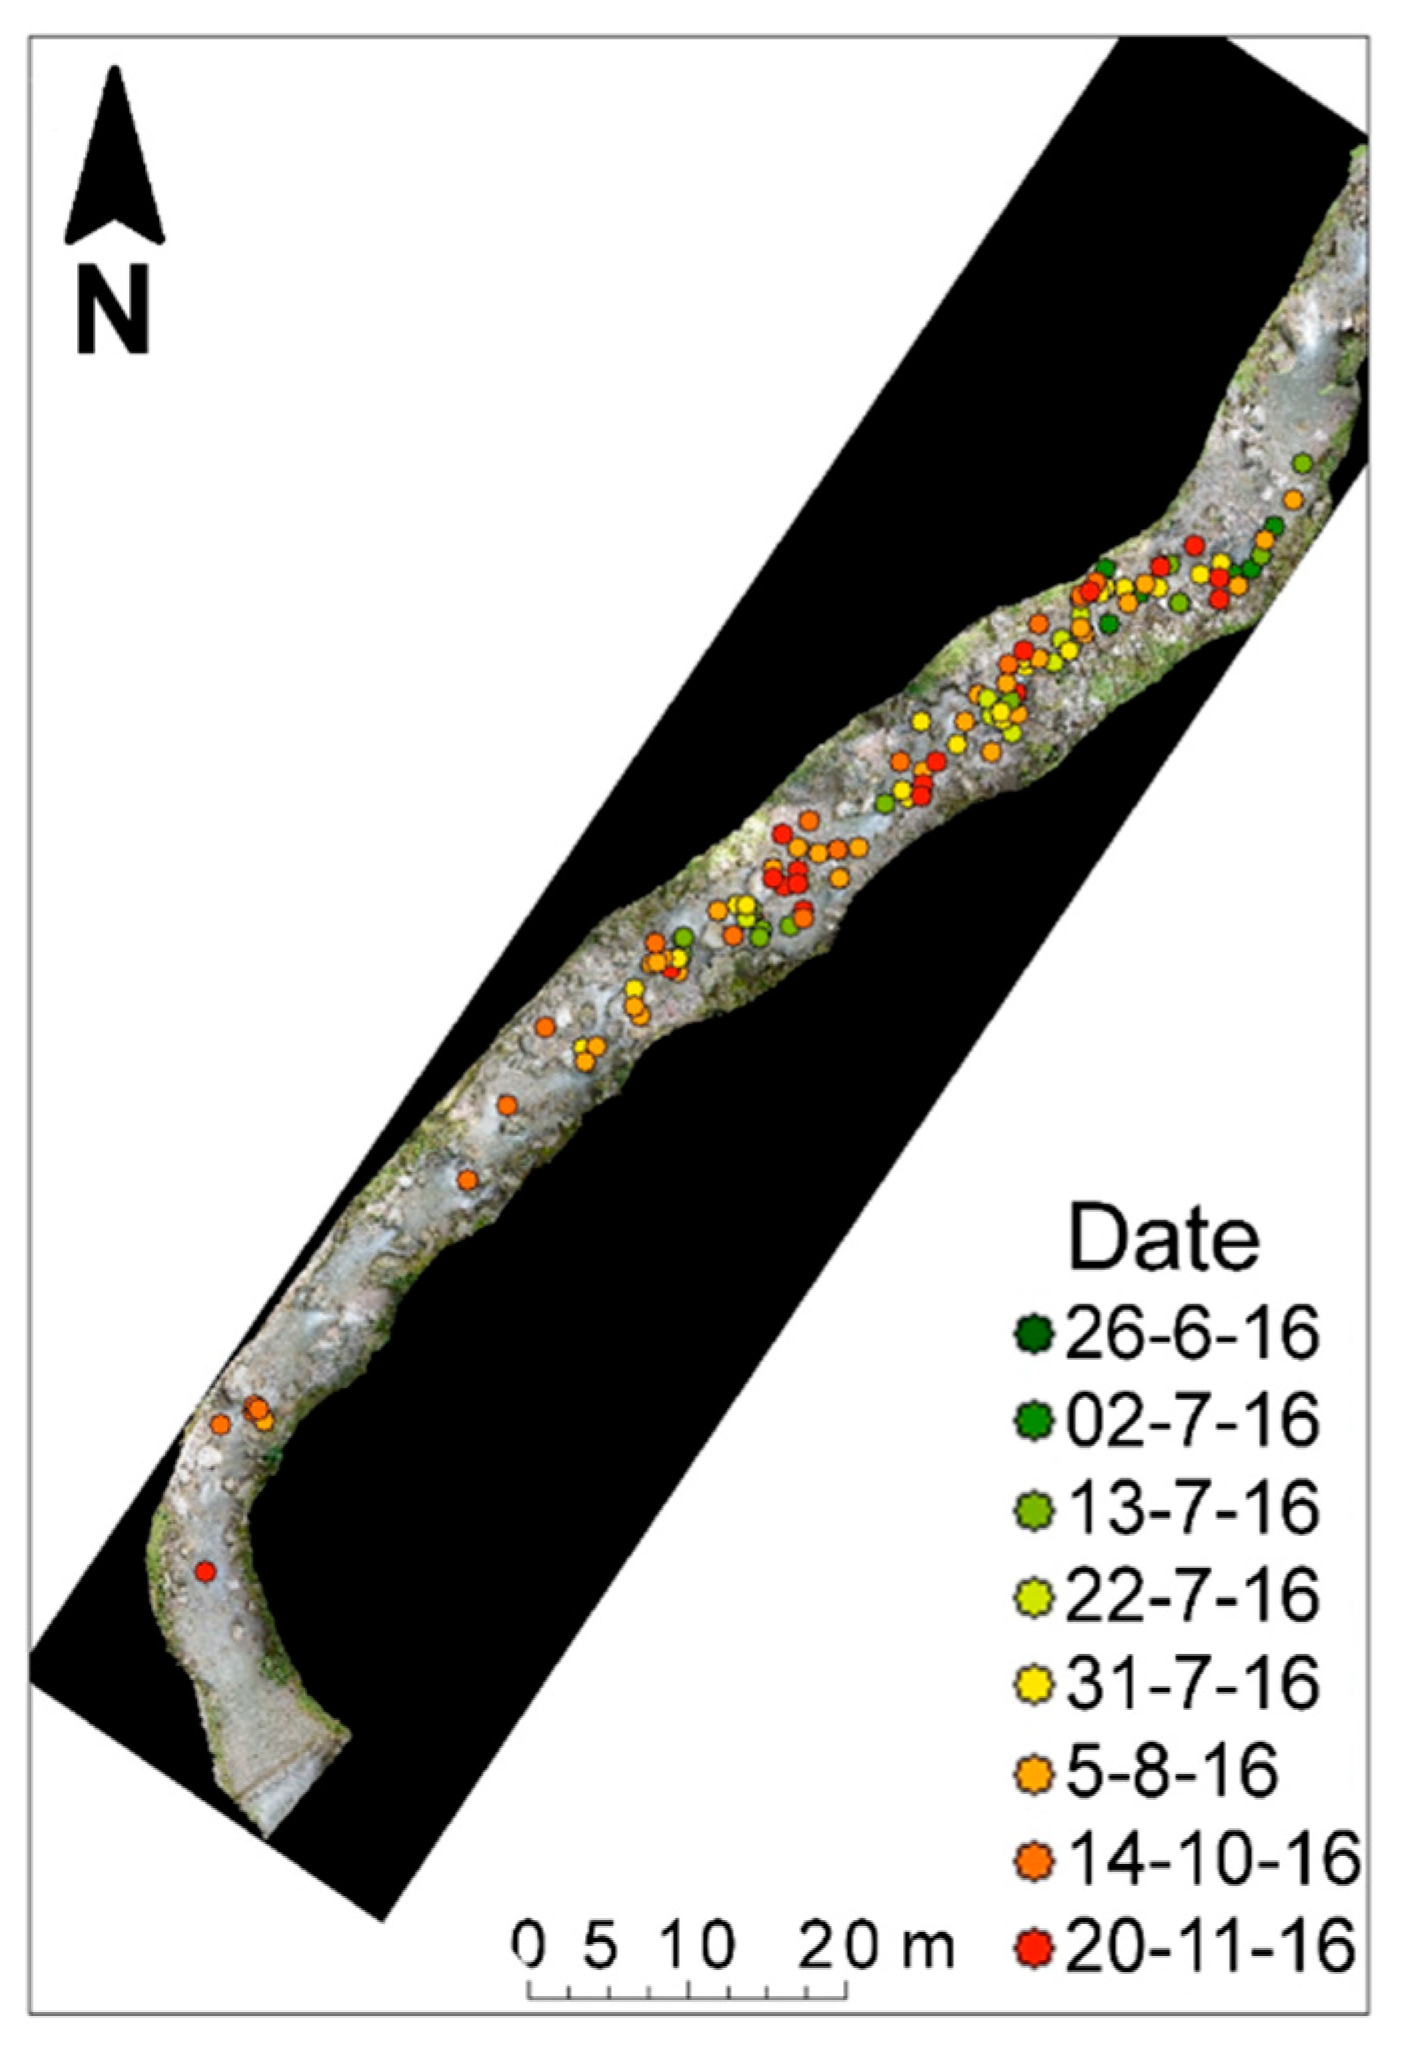
A survey conducted after each event allowed for building a database in which the displacement of each pebble is recorded with the features of the event which caused the displacement (i.e., cumulative rainfall depth, rainfall duration, and peak discharge). Since single-event displacements were often the same order of magnitude as GPS accuracy, each pebble position was also recorded on a photogrammetric map to decrease uncertainty. A total of 1948 single displacements were recorded during the research period. Table 3 reports mean travel distances for each event and the recovery ratio (present tracers/found tracers). Significant increases in recovery ratio are linked to new tracer deployment campaigns. A weak proportional relationship can be found between peak discharge, travel distance, and recovery ratio, as one would expect (Figure 5). All the displacements recorded in 2016 in reach 6 were inserted in a geographical information system (GIS) layered over a georeferenced 3D model of the reaches. Pathways are clearly indicated event-by-event and correspond, in most cases, to the thalweg (Figure 6).

3.2. Eulerian Method

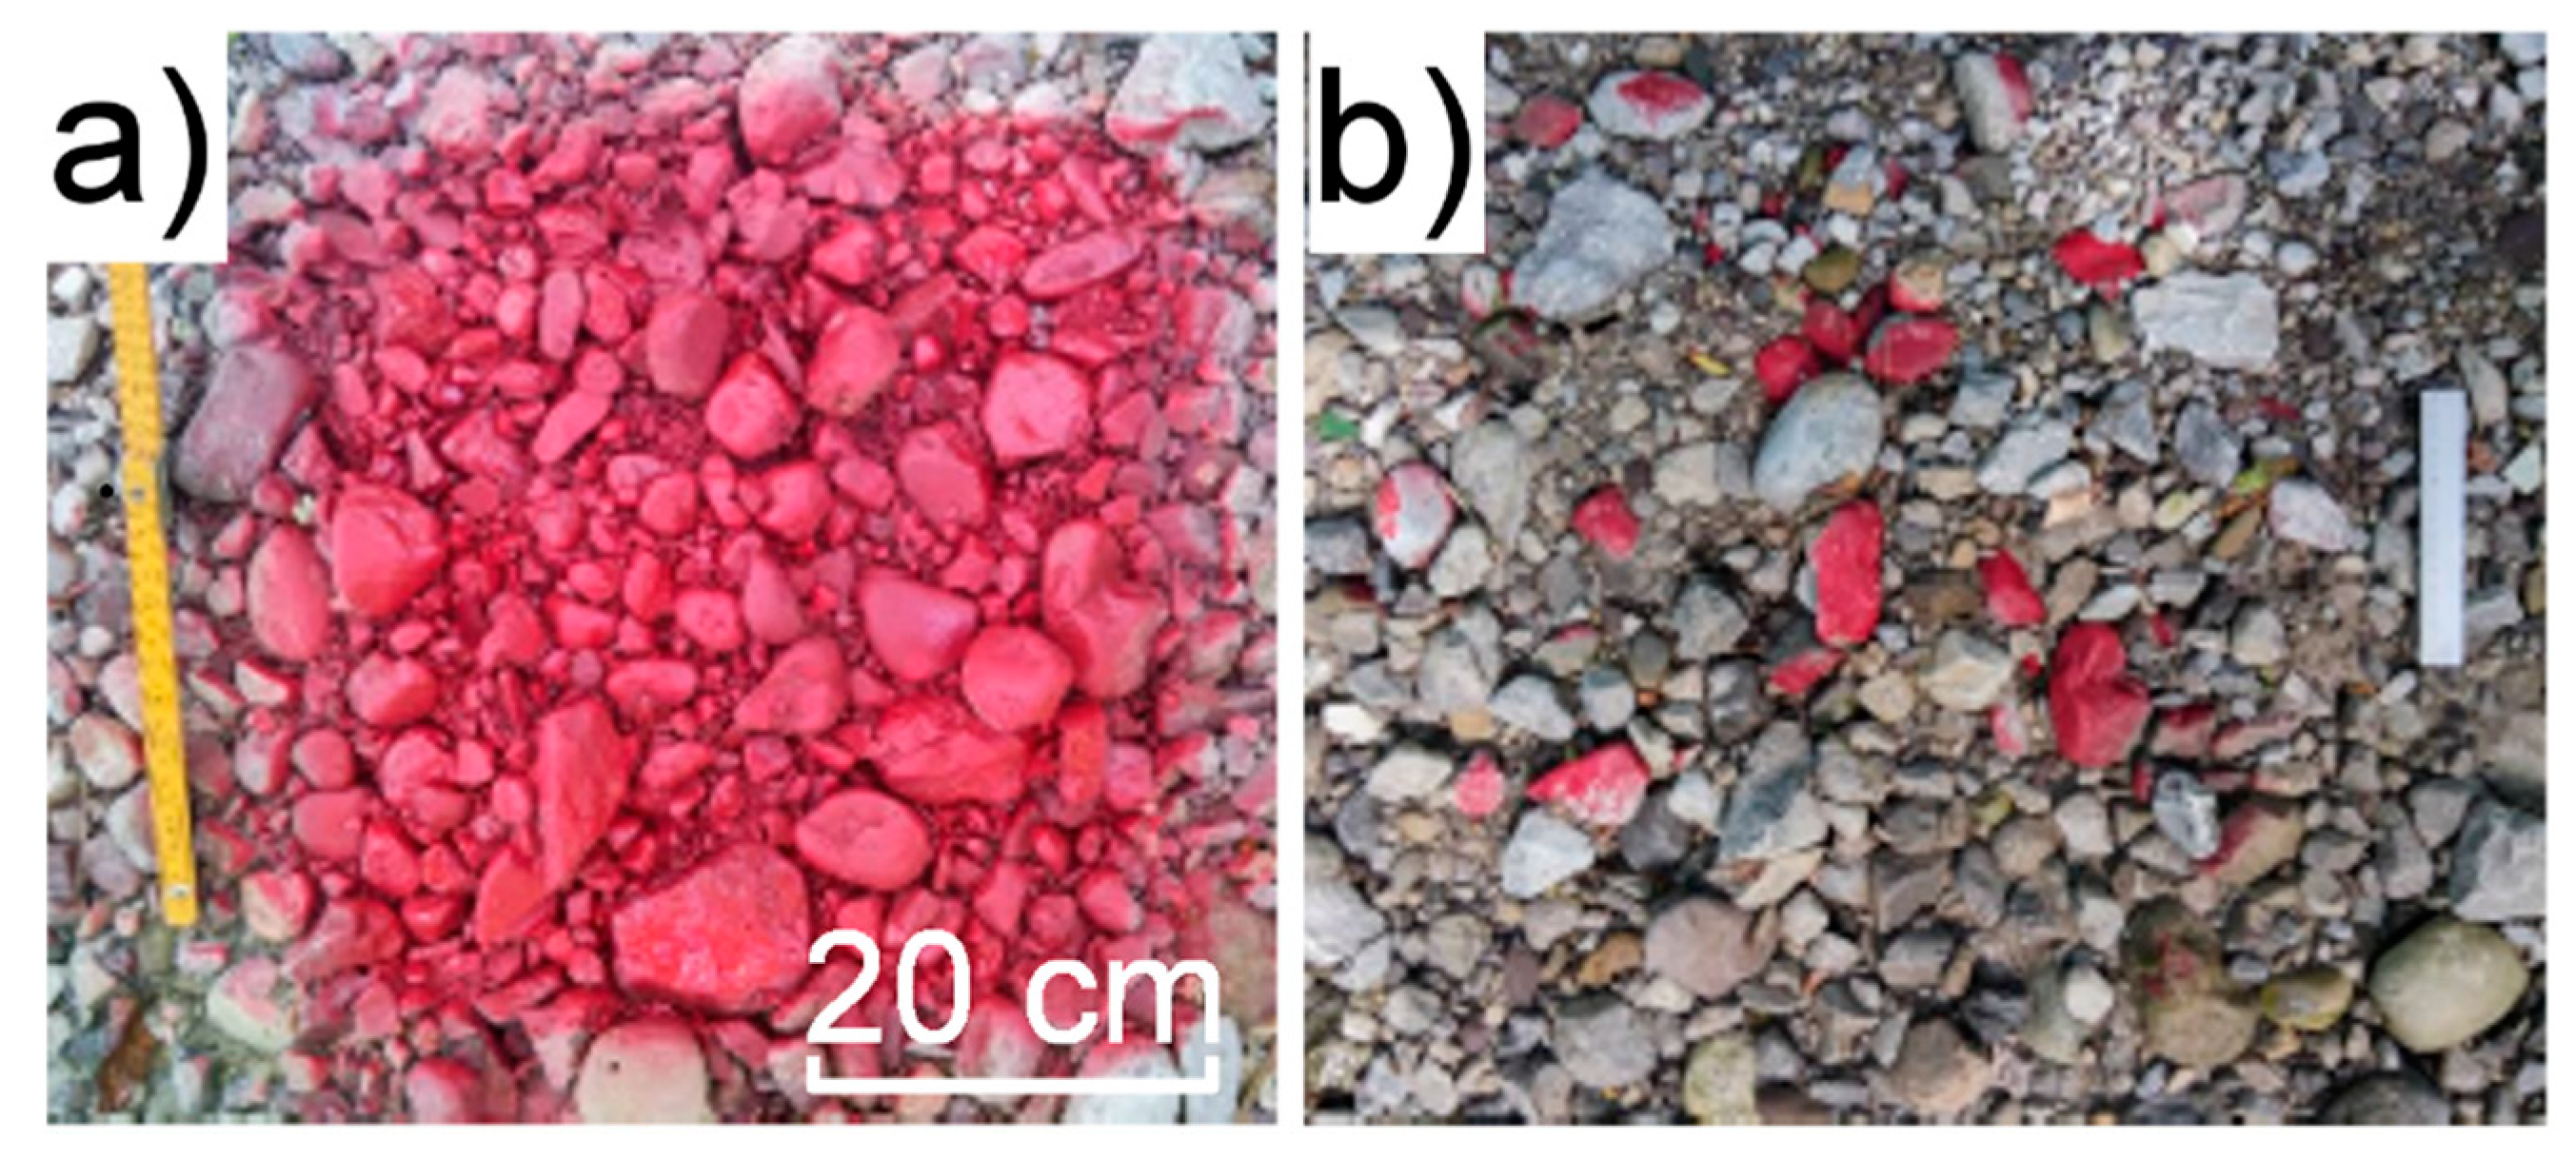
This method relies on a semi-Eulerian approach, based on the work of Scheinegross et al. [44]. In determining the area of investigation at each reach, square grids (50 cm × 50 cm) were selected in the dry streambed; specifically, focusing on banks and bars that are not normally flooded to control their activity in case of intense events. Paint was then sprayed on these areas, and pictures were taken before and after the occurrence of each major rainfall event. The comparison and the analysis of the images allows one to highlight the colored sediments mobilized due to the flood, and those that remained immobilized, as shown in Figure 7.
Image analysis was performed using the Basegrain [50] software, which assessed the number and the dimensions (a and b-axis) of the colored pebbles in the selected area and, thus, the granulometry of the area, according to Equation (1) [50], and the number of clasts for each granulometric class.
D n   =   a b
where Dn is the nominal diameter, and a and b are, respectively, the maximum and minimum axis of the pebble.
In this way, initial granulometry of the area is determined. The same spot is photographed after the flood for comparison purposes. When examining post-flood pictures, some of the painted sediment within the selected area could possibly be removed. The same approach is used to determine the granulometry of remaining sediments. Comparing the latter with the pre-flood granulometry, it can be easily understood which class has lost all or most of the tracers and, therefore, evaluate the critical diameter. Eighteen test areas were set up for the study in different times (Table 4). Sixteen were set up in reach 6, because it was the most suitable due to its almost completely natural bed, while two were set up in reach 7.
This method can account for the remaining painted stones, but does not provide information on entrained pebbles. Disappeared painted pebbles could, in principle, be either entrained or covered by aggradation. In this case, the incipient motion condition could present a bias from the right value.
The incipient motion condition, as defined by Shields [45], is used to describe sediment motion. Incipient motion is defined as the point at which stabilizing forces of grains are equaled by flow thrust. Shield’s equation governing the process focuses on the critical shear stress calculation, which depends on sediment and flow features.
We compared measured values with numerical modeling to test the reliability of the method and the accuracy of the numerical estimation of the incipient motion condition. HEC-RAS [56] software was used to model the hydraulics of the river and to estimate the critical diameter of the pebbles. A 1D steady flow model has been built for this purpose, covering reaches 6 and 7. The model is 1 km long and contains just 11 sections, which were measured and quite uniformly distributed. To improve model stability, additional sections were interpolated at a fixed 50 m step. The model was constrained from the valley side, where a high check dam offers a border condition (Figure 3c). Measured discharge values for each event were input into the model. We determined a critical diameter recording flow rate of each event and used it as input for these models. Steady flow analysis with different Manning’s n friction coefficient values were performed to understand the sensitivity of the model to this parameter. In normal simulations, the Manning’s n resistance coefficient in such irregular rivers can only be assigned by an educated guess, and any validation requires measurements of the physical parameters of the stream. Values obtained in this study were evaluated against established standards [57,58]. Table 4 provides a comparison of measured and estimated critical diameter class for different flow events and locations.
The methods applied have focused on short-term, micro-scale descriptions of sediment dynamics. Our objective is to characterize the river in different time and spatial domains, however, therefore in order to enlarge the focus to macro-scale, long-term processes, an alternative technique is sought. The technique is tested on reach 6, which is characterized by boulder-cascade morphology. It shows aggregated structures, with water flowing over and around boulders and step-pools which usually have lengths similar to the width of the channel.
The procedure adopted in this study consists of the comparison between two different photogrammetric models taken in two different periods: Spring, 2016 and autumn, 2017. These periods are more than 18 months apart, with several intense-discharge events experienced between them.
AGIsoft Photoscan 1.4.2 (Agisoft LLC, St. Petersburg, Russia) was used to create dense point cloud models of the river stretch. Dense point clouds are groups of points within a 3D reference system which describe the surface of an object. Each epoch has a different point cloud composed of about 1,500,000 points. The computed accuracy of point clouds is <5 cm, based on measured ground control points (GCP). Once the point clouds have been created, they are processed using CloudCompare 2.6 open source software. This permits the overlapping of dense point clouds in order to calculate relative differences between them and highlight deposition or erosion spots.
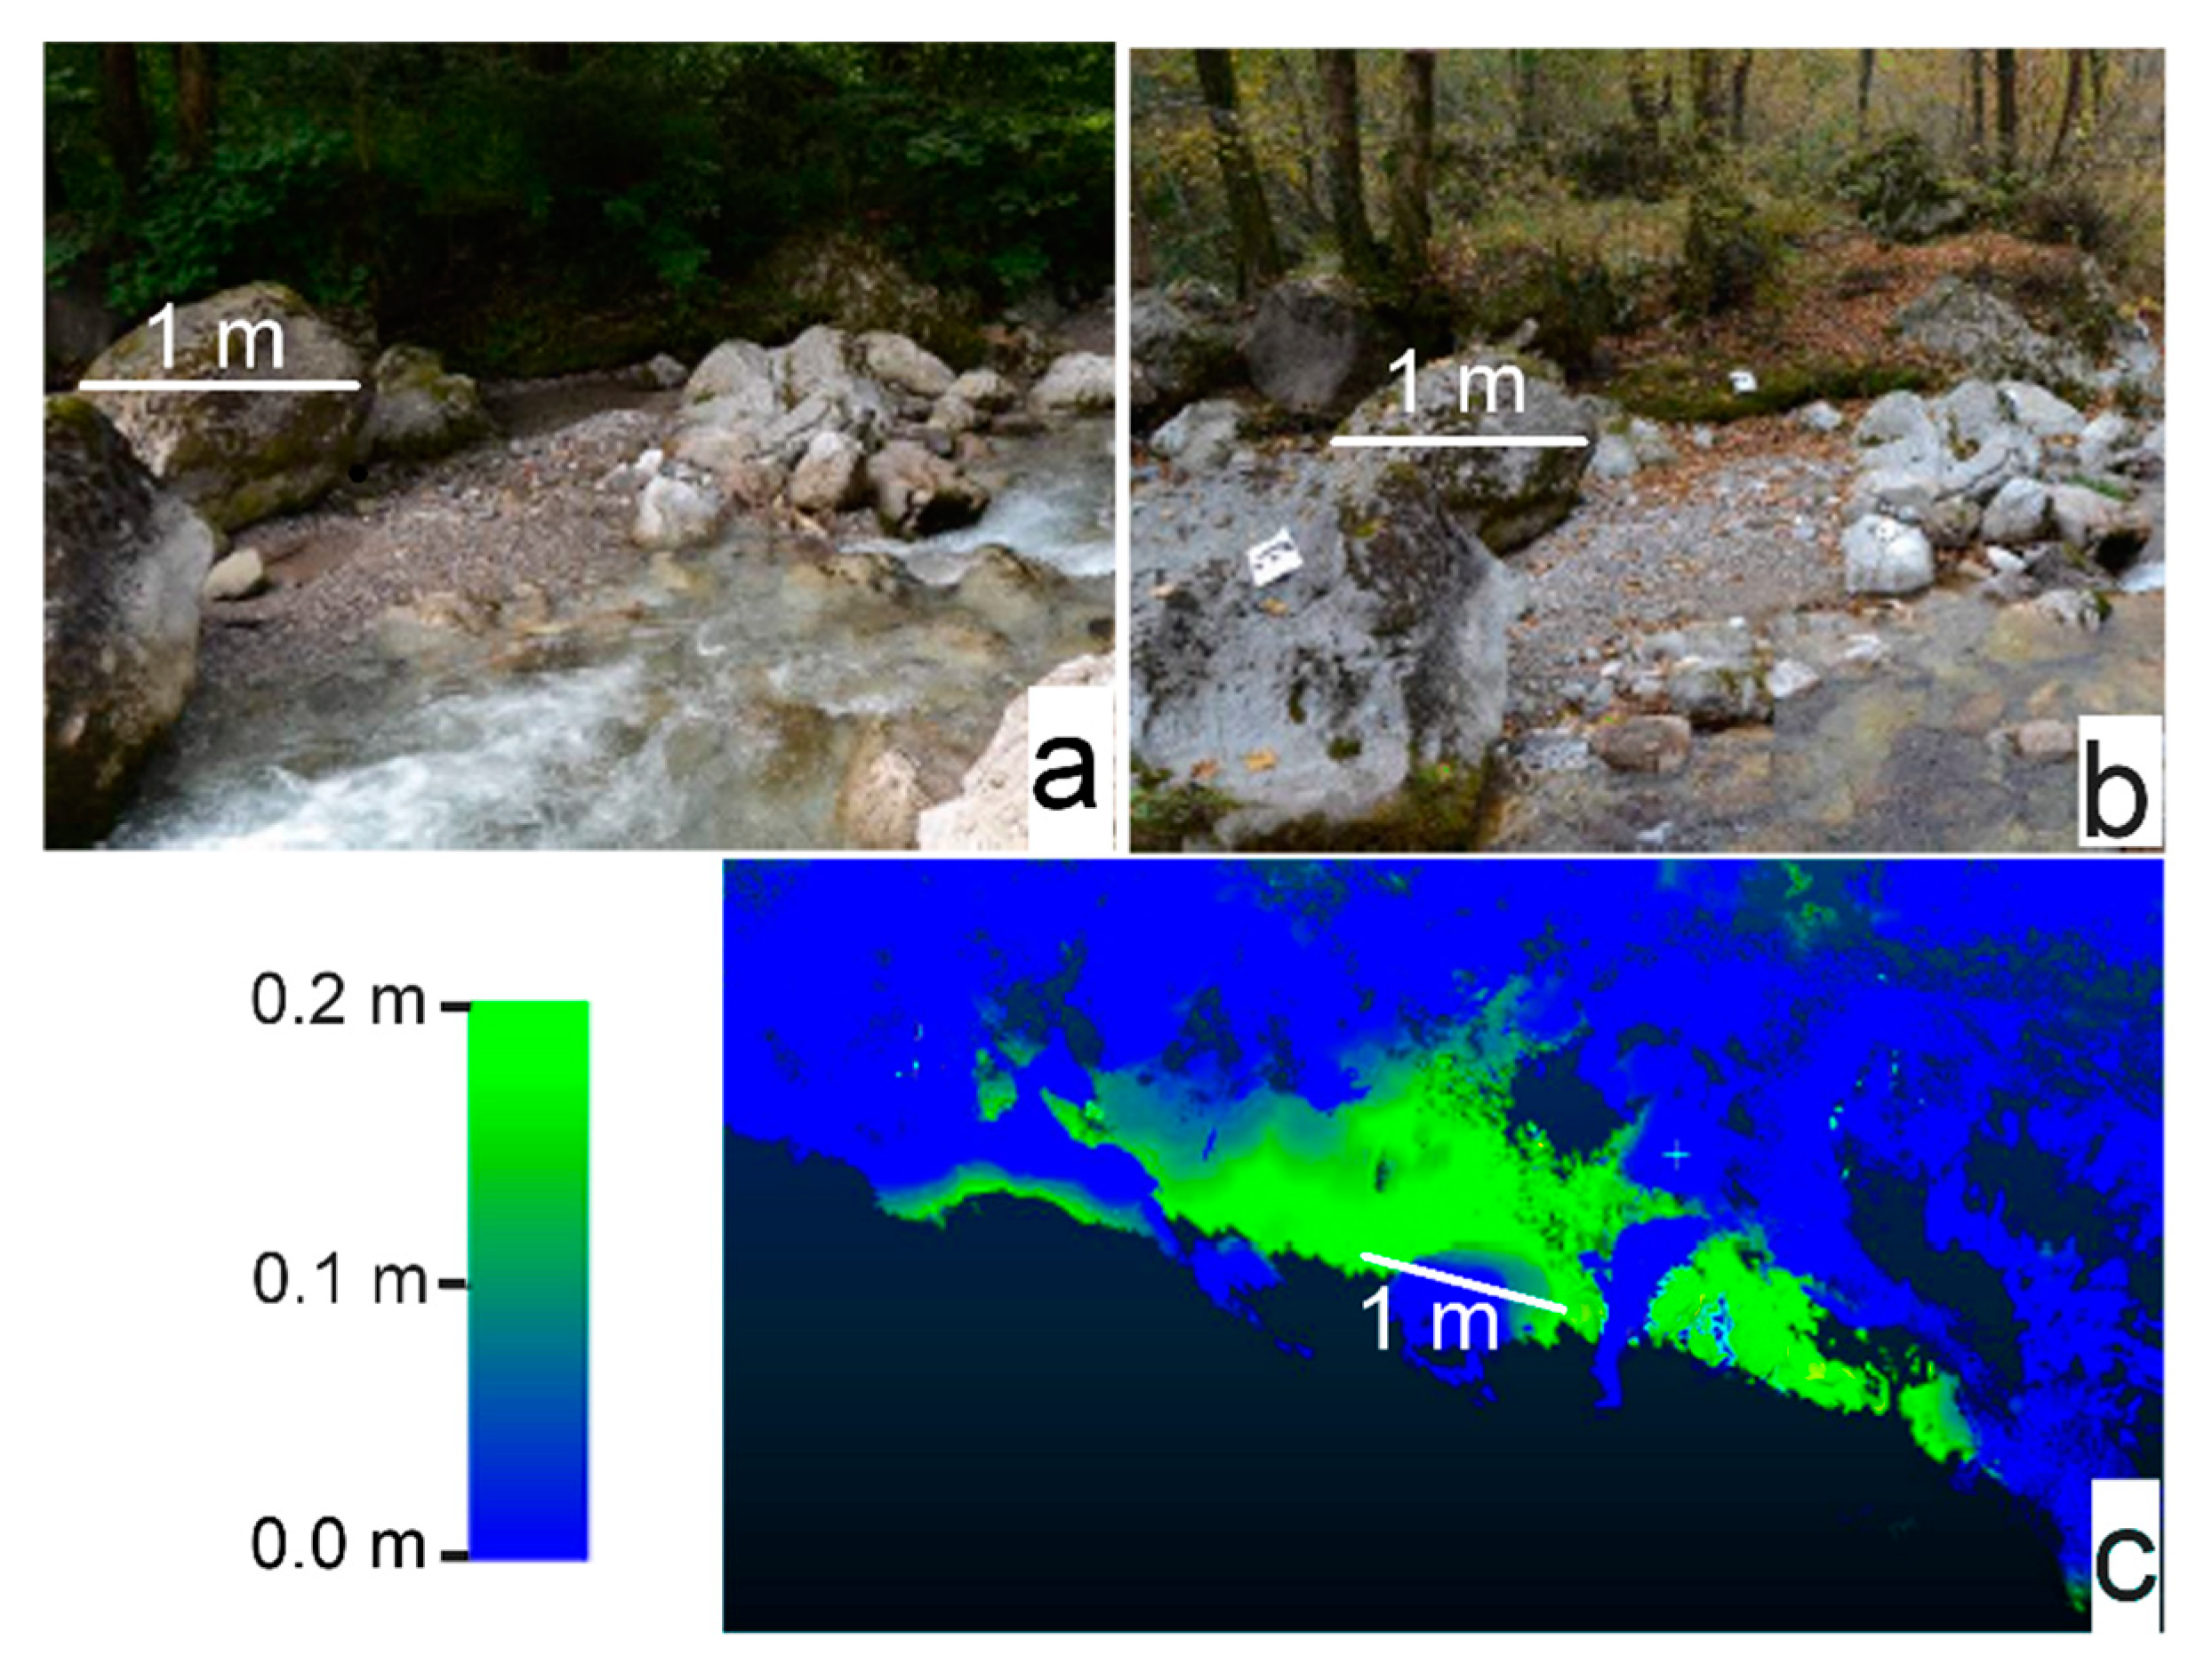
The comparison highlighted the presence of four active deposition zones where material accumulated during the year. Figure 8 reports a visual comparison (a and b) of the same spot in reaches 1 and 2. Figure 8c displays a point-to-point cloud comparison of another spot, showing clear accumulation. The image depicts a portion of the dense point cloud of autumn, 2017. The points have been colored based on their distance from the spring, 2016 point cloud. Blue means no difference and the points are close, while green to orange means a growing distance from 0 m to 0.2 m. The blue shadow is background. The accumulation is clearly shown by the green area in the picture.
The accumulation areas are three banks and one bar, and accumulated material was mostly fine. The remaining part of the clouds show no significant variation between the two surveys. A visual inspection of clouds which were demonstrated as the main structures showed that they remained unchanged, as expected, since there were no major events. However, some cyclic erosional or depositional events are common and involve the same areas, but the reach is global in an equilibrium condition.

4. Discussion

A variety of methods were successful in recording different aspects of sediment dynamics in the Caldone River. However, no single method adequately explains the complexity of sediment transport in mountain streams. A multi-time and space domain approach is necessary for a full description of such complex processes.
In this work, meso-scale, short-term Lagrangian methods are applied to a study case, along with short-term and long-term, micro and macro-Eulerian approaches. Mixing different methods allows for a complete record of active processes. These can be different at different temporal scales. Sediment movement processes can be different within the same river reach when short-term analyses are performed. The database compiled in this research is based on one survey for each rain event. However, a much larger information bank is needed from event scale surveys to allow for characterization of the activity status of the river directly, and not through hypotheses or long time span mean values related to movements and morphological changes due to diverse events.
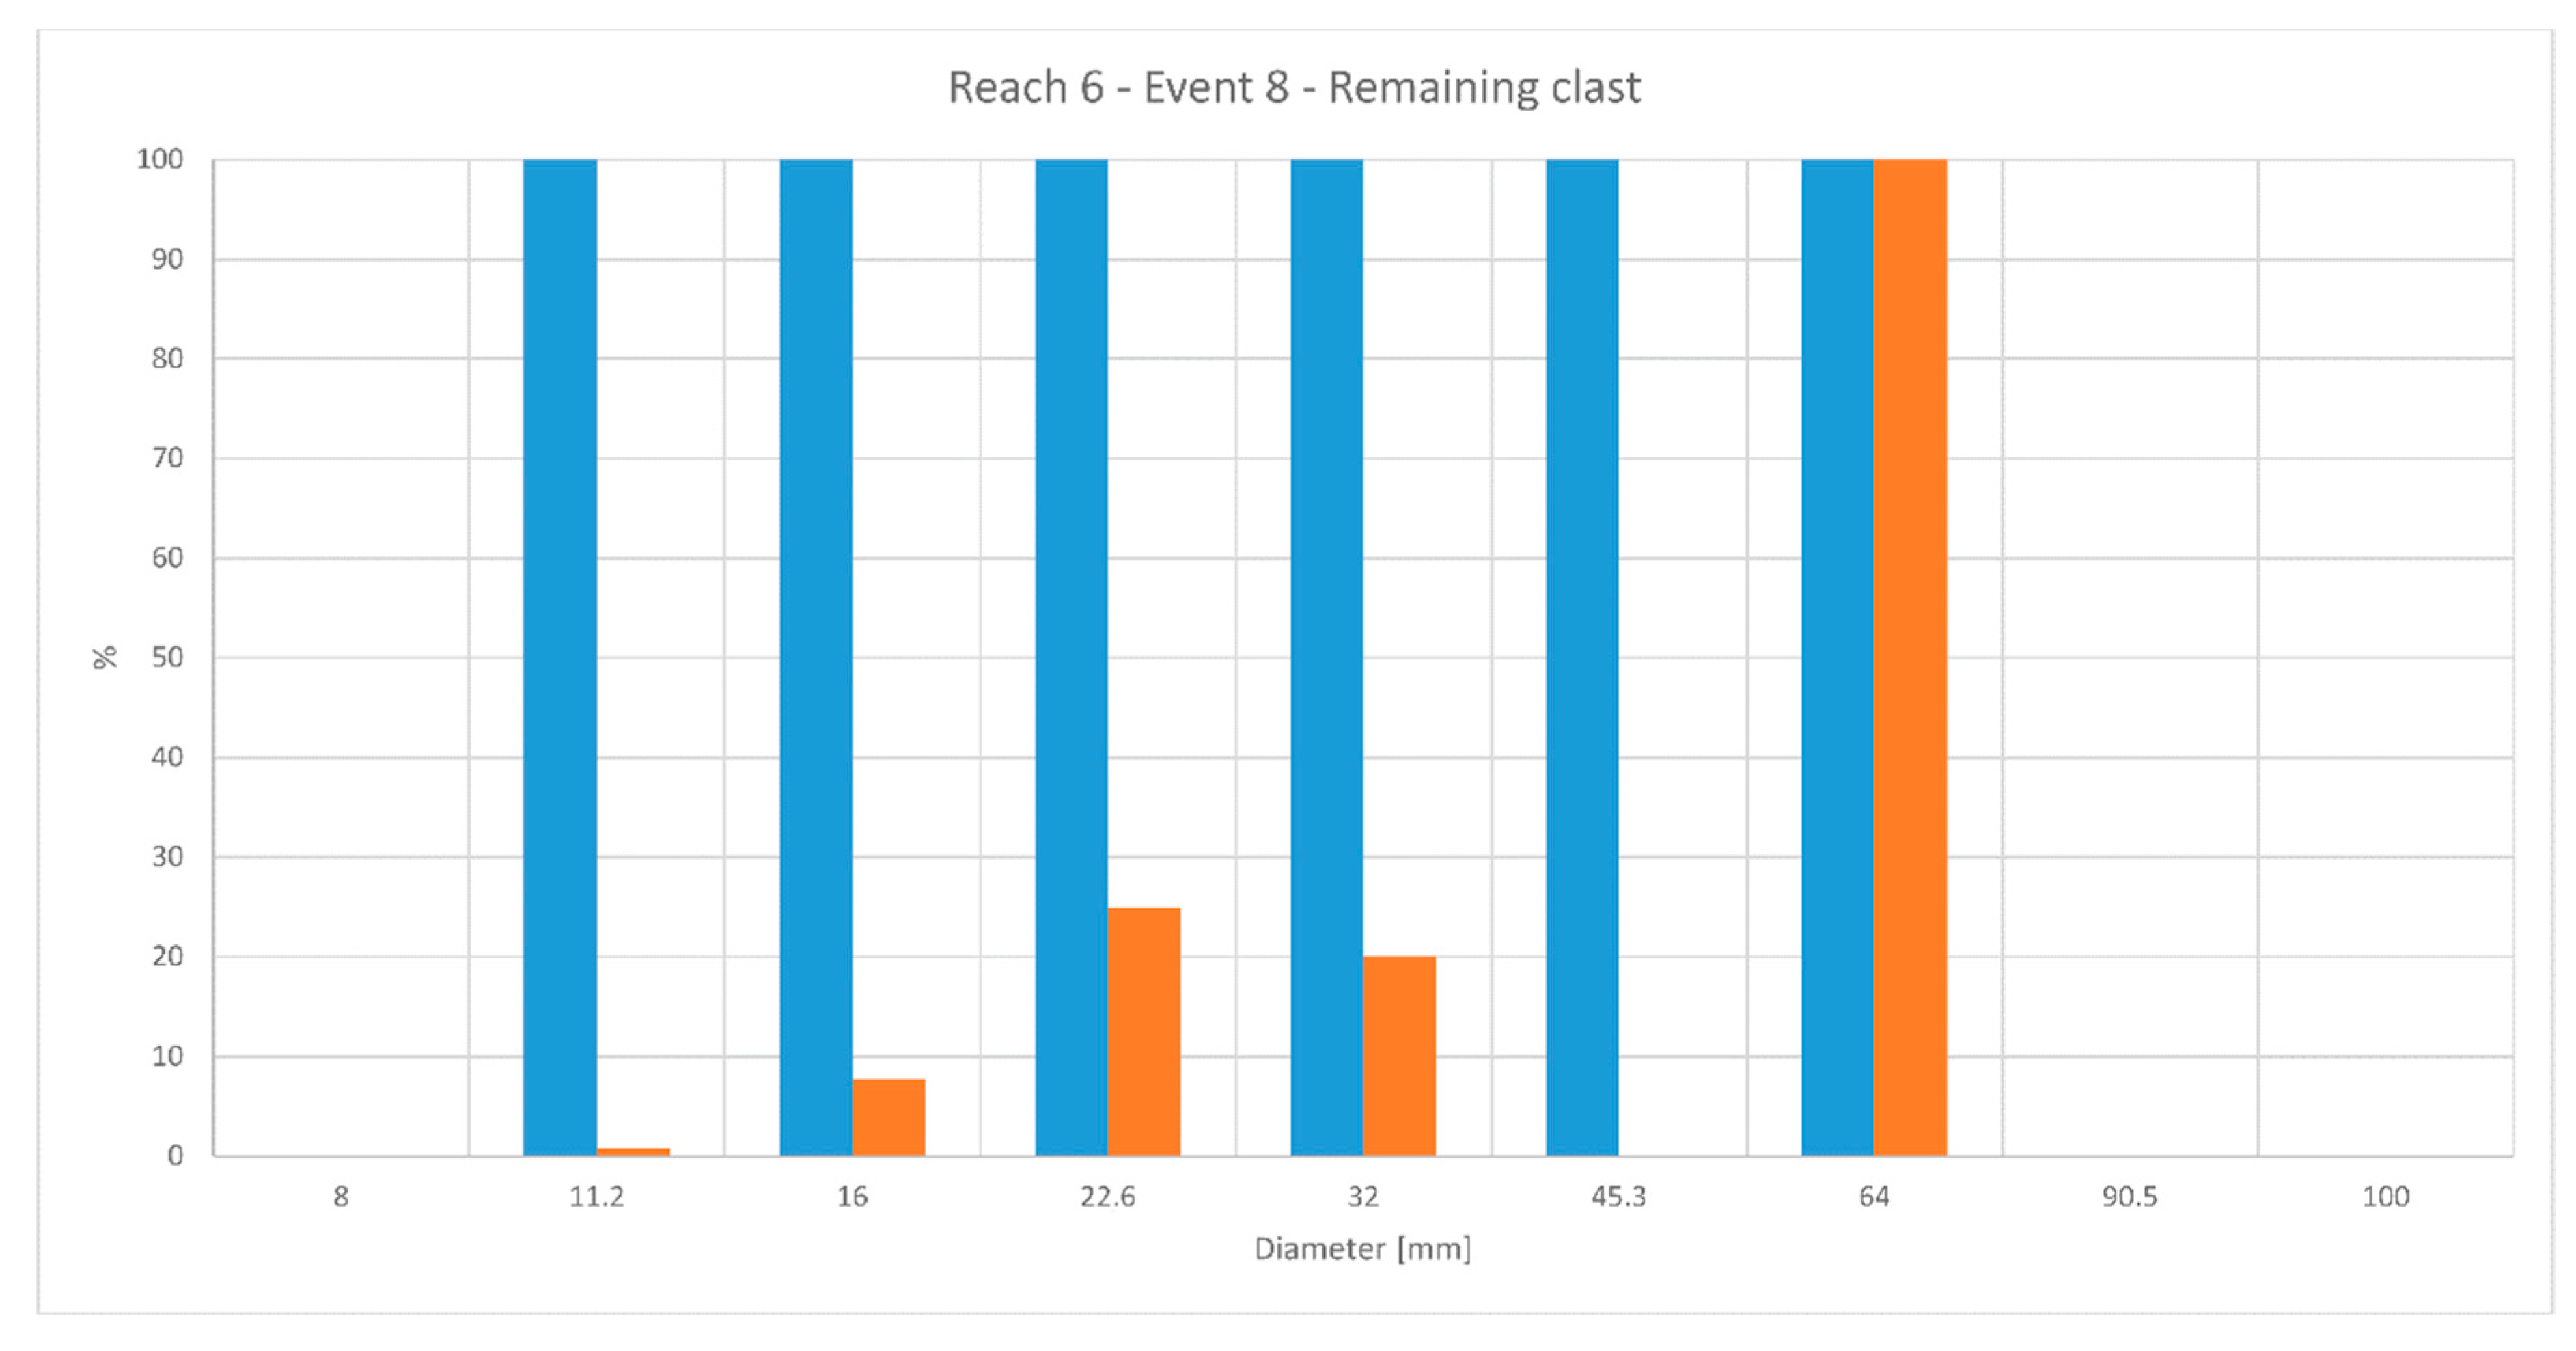
When comparing data from Eulerian and Lagrangian short-term approaches (for critical diameter measurements, for example), we found significant disagreement between the two methods. In event eight, during a long duration, low magnitude rainfall event, the critical grain size diameter in reach six was measured by the Eulerian approach as 45–64 mm. Figure 9 displays the number of clasts before and after event eight as a percentage of the initial number of clasts. Pre-event measurements, depicted in blue, are obviously 100%; post event measurements, in orange, are variable relative to classes. In event six, for a short, intense summer storm, the critical diameter was estimated as Dc > 90.5 mm. This is evidently due to different discharge rates and water stages (i.e., 0.67 m3/s in event eight, and 5.88 m3/s in event six), proving that the painted patches are able to measure the critical diameter for a certain location during an event. The same kind of behavior is also exhibited in other events where the critical diameter is measured as a function of discharge. Minor variations are present, which are caused by differences in the positioning of painted patches. These variations are in accordance with numerical modeling. A correlation between discharge and mean travelled distance of tracers can be found. In general, higher flow rates cause larger displacement. This direct proportionality is non-existent when dealing with Dc that depends on the flow condition in the specific measured spot.
In comparing these findings with the Lagrangian approach, some differences emerge. In event eight, almost half of the tracers with D > 64 mm moved, even if they were bigger in terms of critical diameter. Mean displacement was 3.4 m. Conversely, during event six, most of the tracers showed a significant displacement, with 16.6 m as the mean displacement. A check of the diameters of moved and still tracers highlighted a critical diameter between 90 and 100 mm. In this case, the Eulerian and Lagrangian approaches agree. This behavior is not completely confirmed by other events. Little tracers tend to move more than bigger ones, as expected, but a sharp difference is not visible. Reduction in tracer population results in the sample to losing significance over time.
The difference in behavior between low and high discharge events can be explained through an analysis of the activity state of the channel. As suggested by Liébault et al. [38], bars and banks act as storage areas for sediments, turning their behavior from accumulation to source, depending on flow rate. Thus, during moderate discharge events, water wanders around bars and remains in the thalweg. In this situation, the only active part is the thalweg, and tracers are better than painted patches at describing sediment dynamics. When water stage increases, the whole channel is active and the two methods described in this paper can offer a superior interpretation of sediment dynamics.
The definition of activity status can also be challenging in the time domain. Erosion and deposition patterns in space and time are interesting, and their study can lead to a better definition of the virtual velocity concept. Nowadays, virtual velocity is defined as the ratio between grain displacement and the total time elapsed between two successive surveys [59]. We focused on reach six, the most active and interesting reach, and found a slow seasonal variation of the river through a DEM comparison technique. However, in the Caldone River case, no general trend was found. This means that the river is in equilibrium during the researched period, with some areas clearly subjected to alternate episodes of erosion and deposition.

5. Conclusions

The final aim of much research on sediment dynamics in a mountain river is to find a value for solid discharge at the basin outlet. As stated by Haschenburger and Church [59], solid discharge is evaluated as the product of virtual velocity, active width, and active layer depth. This simplification implicitly assumes a uniform state of activity for the whole channel, in time and space. However, this assumption is far from reality in complex mountain rivers. Thus, techniques able to distinguish differences inside the same reach are needed. Painted patches are useful to evaluate the activity status of bars and banks and, thus, the active width of the stream. The patches are positioned on the less active areas (Figure 4d), but are sensitive even to shallow water stages flowing over them. They cannot give information about the travelled distances, but data about this comes from tracers. The measurement of active layer thickness needs ad hoc tools and surveys. The use of scour chains, wisely distributed in the channel, could be used to investigate active layer depth. The use of a more detailed survey technique leads to evidence of how different activity states can coexist in the same stretch and how they can mix depending on the flow rate. The description of this variability and differences in the activity status can lead to a deeper understanding of sediment dynamics, and a better overall description than virtual velocity estimated from long-term, macro-scale data.

Author Contributions

Davide Brambilla was in charge of fieldwork and writing the article. Monica Papini gave valuable geo-morphological advice and reviewed the paper. Laura Longoni conceived the research and reviewed the paper.

Acknowledgments

Authors would like to thank Comune di Lecco for partially funding this research. Authors would like to thank Simone Bernasconi, Francesco Castelnunovo, Alice Francescone, Giacomo Messa, and Andrea Veronelli for the valuable help in fieldwork during their master theses.

Conflicts of Interest

The authors declare no conflict of interest.

References

  1. Radice, A.; Giorgetti, E.; Brambilla, D.; Longoni, L.; Papini, M. On integrated sediment transport modelling for flash events in mountain environments. Acta Geophys. 2012, 60, 191–213. [Google Scholar] [CrossRef]
  2. Papini, M.; Ivanov, V.I.; Brambilla, D.; Arosio, D.; Longoni, L. Monitoring bedload sediment transport in a pre-alpine river: An experimental method. Rendiconti Online Societa Geologica Italiana 2017, 43, 57–63. [Google Scholar] [CrossRef]
  3. Directive 2007/60/EC of the European Parliament and of the Council of 23 October 2007 on the assessment and management of flood risks. Off. J. Eur. Union 2007, 288, 27–34.
  4. Totschnig, R.; Sedlacek, W.; Fuchs, S. A quantitative vulnerability function for fluvial sediment transport. Natl. Hazards 2011, 58, 681–703. [Google Scholar] [CrossRef]
  5. Ballio, F.; Brambilla, D.; Giorgetti, E.; Longoni, L.; Papini, M.; Radice, A. Evaluation of sediment yield from valley slopes: A case study. WIT Trans. Eng. Sci. 2010, 67, 149–160. [Google Scholar]
  6. Longoni, L.; Ivanov, V.I.; Brambilla, D.; Radice, A.; Papini, M. Analysis of the temporal and spatial scales of soil erosion and transport in a mountain basin. Ital. J. Eng. Geol. Environ. 2016, 16, 17–30. [Google Scholar]
  7. Brambilla, D.; Longoni, L.; Papini, M.; Giorgetti, E.; Radice, A. On analysis of sediment sources toward proper characterization of hydro-geological hazard for mountain environments. Int. J. Saf. Secur. Eng. 2011, 1, 423–437. [Google Scholar] [CrossRef]
  8. Rainato, R.; Mao, L.; García-Rama, A.; Picco, L.; Cesca, M.; Vianello, A.; Preciso, E.; Scussel, G.; Lenzi, M. Three decades of monitoring in the rio cordon instrumented basin: Sediment budget and temporal trend of sediment yield. Geomorphology 2017, 291, 45–56. [Google Scholar] [CrossRef]
  9. Cavalli, M.; Goldin, B.; Comiti, F.; Brardinoni, F.; Marchi, L. Assessment of erosion and deposition in steep mountain basins by differencing sequential digital terrain models. Geomorphology 2017, 291, 4–16. [Google Scholar] [CrossRef]
  10. Lazzari, M.; Gioia, D.; Piccarreta, M.; Danese, M.; Lanorte, A. Sediment yield and erosion rate estimation in the mountain catchments of the camastra artificial reservoir (southern Italy): A comparison between different empirical methods. Catena 2015, 127, 323–339. [Google Scholar] [CrossRef]
  11. Schneider, J.; Hegglin, R.; Meier, S.; Turowski, J.; Nitsche, M.; Rickenmann, D. Studying sediment transport in mountain rivers by mobile and stationary rfid antennas. River Flow 2010, 2014, 1723–1730. [Google Scholar]
  12. Montgomery, D.R.; Buffington, J.M. Channel-reach morphology in mountain drainage basins. Geol. Soc. Am. Bull. 1997, 109, 596–611. [Google Scholar] [CrossRef]
  13. Hassan, M.A.; Church, M.; Lisle, T.E.; Brardinoni, F.; Benda, L.; Grant, G.E. Sediment transport and channel morphology of small, forested streams. Jawra J. Am. Water Resour. Assoc. 2005, 41, 853–876. [Google Scholar] [CrossRef]
  14. Hay, W.W. Detrital sediment fluxes from continents to oceans. Chem. Geol. 1998, 145, 287–323. [Google Scholar] [CrossRef]
  15. Holland, H.D. The Chemistry of the Atmosphere and Oceans (v. 1); John Wiley & Sons Inc: Hoboken, NJ, USA, 1978. [Google Scholar]
  16. Milliman, J.D.; Syvitski, J.P. Geomorphic/tectonic control of sediment discharge to the ocean: The importance of small mountainous rivers. J. Geol. 1992, 100, 525–544. [Google Scholar] [CrossRef]
  17. Summerfield, M.; Hulton, N. Natural controls of fluvial denudation rates in major world drainage basins. J. Geophys. Res. Solid Earth 1994, 99, 13871–13883. [Google Scholar] [CrossRef]
  18. Lane, E.; Borland, W. Estimating bed load. Eos Trans. Am. Geophys. Union 1951, 32, 121–123. [Google Scholar] [CrossRef]
  19. Walling, D.E.; Webb, B.W. The Reliability of Suspended Sediment Load Data [River Creedy, England]; Food and Agriculture Organization of the United Nations: Rome, Italy, 1981. [Google Scholar]
  20. Whittaker, J. Sediment transport in step-pool streams. In Sediment Transport in Gravel-Bed Rivers; John Wiley and Sons: New York, NY, USA, 1987; pp. 545–579. [Google Scholar]
  21. Diez, J.-C.; Alvera, B.; Puigdefabregas, J.; Gallart, F. Assessing Sediment Sources in a Small Drainage Basin above the Timberline in the Pyrenees. 1988; Available online: http://hydrologie.org/redbooks/a174/iahs_174_0197.pdf (accessed on 28 December 2017).
  22. Billi, P.; D’Agostino, V.; Lenzi, M.A.; Marchi, L. Bed-load, slope and channel processes in a high-altitude alpine torrent. In Gravel-Bed Rivers in the Environment; Klingeman, P.C., Bechsta, R.L., Komar, P.D., Bradley, J.R., Eds.; Water Resource Publications, LLC: Highlands Ranch, CO, USA, 1998; pp. 15–38. [Google Scholar]
  23. Marquis, G.; Roy, A. Using multiple bed load measurements: Toward the identification of bed dilation and contraction in gravel—Bed rivers. J. Geophys. Res. Earth Surf. 2012, 117, F1. [Google Scholar] [CrossRef]
  24. Gray, J.R.; Gartner, J.W.; Barton, J.S.; Gaskin, J.; Pittman, S.A.; Rennie, C.D. Surrogate technologies for monitoring bed-load transport in rivers. Sedimentol. Aqueous Syst. 2010, 2, 45–79. [Google Scholar]
  25. Radice, A.; Sarkar, S.; Ballio, F. Image-based lagrangian particle tracking in bed-load experiments. J. Vis. Exp. JoVE 2017, 125, 55874. [Google Scholar] [CrossRef] [PubMed]
  26. Radice, A.; Ballio, F.; Nikora, V. Statistics and characteristic scales for bed load in a channel flow with sidewall effects. Acta Geophys. 2010, 58, 1072–1093. [Google Scholar] [CrossRef]
  27. Ramesh, B.; Kothyari, U.C.; Murugesan, K. Near-bed particle motion over transitionally-rough bed. J. Hydr. Res. 2011, 49, 757–765. [Google Scholar] [CrossRef]
  28. Niño, Y.; García, M. Using lagrangian particle saltation observations for bedload sediment transport modelling. Hydrol. Process. 1998, 12, 1197–1218. [Google Scholar] [CrossRef]
  29. Takayama, S. Bedload movement in torrential mountain streams. Tokyo Geogr. Pap. 1965, 9, 169–188. (In Japanese) [Google Scholar]
  30. Leopold, L.B. Channel and Hillslope Processes in a Semiarid Area, New Mexico; US Government Printing Office: Washington, DC, USA, 1966; Volume 352. [Google Scholar]
  31. Benelli, G.; Bertoni, D.; Sarti, G. An analysis on the use of lf rfid for the tracking of different typologies of pebbles on beaches. In Proceedings of the 2011 IEEE International Conference on RFID-Technologies and Applications (RFID-TA), Sitges, Spain, 15–16 September 2011; pp. 426–431. [Google Scholar]
  32. Camenen, B.; Le Coz, J.; Paquier, A.; Lagouy, M. In An estimation of gravel mobility over an alpine river gravel bar (arc en Maurienne, France) using pit-tag tracers. In Proceedings of the 5th International Conference on Fluvial Hydraulics (River Flow 2010), Braunschweig, Germany, 8–10 September 2010; p. 8. [Google Scholar]
  33. Chapuis, M.; Dufour, S.; Provansal, M.; Couvert, B.; De Linares, M. Coupling channel evolution monitoring and rfid tracking in a large, wandering, gravel-bed river: Insights into sediment routing on geomorphic continuity through a riffle–pool sequence. Geomorphology 2015, 231, 258–269. [Google Scholar] [CrossRef]
  34. Vázquez-Tarrío, D.; Menéndez-Duarte, R. Bedload transport rates for coarse-bed streams in an atlantic region (Narcea river, nw Iberian Peninsula). Geomorphology 2014, 217, 1–14. [Google Scholar] [CrossRef]
  35. Hassan, M.A.; Ergenzinger, P. Use of tracers in fluvial geomorphology. Tools Fluv. Geomorphol. 2003, 397–423. [Google Scholar] [CrossRef]
  36. Lamarre, H.; Roy, A.G. Reach scale variability of turbulent flow characteristics in a gravel-bed river. Geomorphology 2005, 68, 95–113. [Google Scholar] [CrossRef]
  37. Sear, D.; Wilcock, D.; Robinson, M.; Fisher, K. River channel modification in the UK. In The Hydrology of the United Kingdom: A Study of Change; Routledge: London, UK, 2000; pp. 55–81. [Google Scholar]
  38. Liébault, F.; Bellot, H.; Chapuis, M.; Klotz, S.; Deschâtres, M. Bedload tracing in a high-sediment-load mountain stream. Earth Surf. Process. Landf. 2012, 37, 385–399. [Google Scholar] [CrossRef]
  39. Liedermann, M.; Tritthart, M.; Habersack, H. Particle path characteristics at the large gravel-bed river danube: Results from a tracer study and numerical modelling. Earth Surf. Process. Landf. 2013, 38, 512–522. [Google Scholar] [CrossRef]
  40. Mao, L.; Carrillo, R.; Escauriaza, C.; Iroume, A. Flume and field-based calibration of surrogate sensors for monitoring bedload transport. Geomorphology 2016, 253, 10–21. [Google Scholar] [CrossRef]
  41. Habersack, H. Radio-tracking gravel particles in a large braided river in New Zealand: A field test of the stochastic theory of bed load transport proposed by Einstein. Hydrol. Process. 2001, 15, 377–391. [Google Scholar] [CrossRef]
  42. Rickenmann, D.; McArdell, B.W. Continuous measurement of sediment transport in the erlenbach stream using piezoelectric bedload impact sensors. Earth Surf. Process. Landf. 2007, 32, 1362–1378. [Google Scholar] [CrossRef]
  43. Dell’Agnese, A.; Brardinoni, F.; Toro, M.; Mao, L.; Engel, M.; Comiti, F. Bedload transport in a formerly glaciated mountain catchment constrained by particle tracking. Earth Surf. Dynam. 2015, 3, 527. [Google Scholar] [CrossRef]
  44. Scheingross, J.S.; Winchell, E.W.; Lamb, M.P.; Dietrich, W.E. Influence of bed patchiness, slope, grain hiding, and form drag on gravel mobilization in very steep streams. J. Geophys. Res. Earth Surf. 2013, 118, 982–1001. [Google Scholar] [CrossRef]
  45. Shields, A. Anwendung der Aehnlichkeitsmechanik und der Turbulenzforschung auf die Geschiebebewegung. Ph.D. Thesis, Technical University Berlin, Berlin, Germany, 1936. (In German). [Google Scholar]
  46. Lenzi, M.; D’Agostino, V. Step-Pool Evolution in an Alpine Torrent. New Trends in Water and Environmental Engineering for Safety and Life; AA. Balkema: Rotterdam, The Netherlands, 2000; Volume 31. [Google Scholar]
  47. Langhammer, J.; Hartvich, F.; Kliment, Z.; Jeníček, M.; Bernsteinová, J.; Vlček, L.; Su, Y.; Štych, P.; Miřijovský, J. The impact of disturbance on the dynamics of fluvial processes in mountain landscapes. Silva Gabreta 2015, 21, 105–116. [Google Scholar]
  48. Hassan, M.A.; Bradley, D.N. Geomorphic controls on tracer particle dispersion in gravel-bed rivers. In Gravel-Bed Rivers Process Disasters; Wiley/John Wiley & Sons Inc: Hoboken, NJ, USA, 2017. [Google Scholar]
  49. Garzanti, E.; Gamba, A.; Malara, F.; Vidimari, C. Evoluzione della mineralogia del detrito in sistemi fluviali segmentati da sbarramenti naturali o artificiali e attraverso la pianura: Il bacino idrografico dell’adda (Lombardia). Geol. Insubr. 1999, 3, 43–60. [Google Scholar]
  50. Detert, M.; Weitbrecht, V. Automatic object detection to analyze the geometry of gravel grains—A free stand-alone tool. In River Flow; Taylor & Francis Group: London, UK, 2012; pp. 595–600. [Google Scholar]
  51. Rinaldi, M.; Surian, N.; Comiti, F.; Bussettini, M. Manuale Tecnico-Operativo per la Valutazione ed il Monitoraggio dello Stato Morfologico dei Corsi D’acqua; ISPRA: Roma, Italy, 2010. (In Italian) [Google Scholar]
  52. Fujita, I.; Muste, M.; Kruger, A. Large-scale particle image velocimetry for flow analysis in hydraulic engineering applications. J. Hydr. Res. 1998, 36, 397–414. [Google Scholar] [CrossRef]
  53. Radice, A.; Malavasi, S.; Ballio, F. Solid transport measurements through image processing. Exp. Fluids 2006, 41, 721–734. [Google Scholar] [CrossRef]
  54. Longoni, L.; Ivanov, V.; Brambilla, D.; Papini, M.; Brebbia, C.; Teanini, E.; Radice, A. Application of multiple surveying techniques at a to-be-gauged river section. In Proceedings of the HydroSenSoft, Madrid, Spain, 1–3 March 2017; pp. 246–253. [Google Scholar]
  55. Ivanov, V.I.; Brambilla, D.; Longoni, L.; Arosio, D.; Papini, M. Rfid-aided sediment transport monitoring—Laboratory and preliminary field test results. In Workshop on World Landslide Forum; Springer: Berlin, Germany, 2017; pp. 623–630. [Google Scholar]
  56. Brunner, G.W. HEC-RAS (river analysis system). In North American Water and Environment Congress & Destructive Water; ASCE: New York, NY, USA, 2002; pp. 3782–3787. [Google Scholar]
  57. Limerinos, J.T.; California Department of Water Resources. Determination of the Manning Coefficient from Measured Bed Roughness in Natural Channels; U.S. Department of the Interior, Geological Survey, Water Resources Division, Ground Water Branch: Washington, DC, USA, 1970. [Google Scholar]
  58. Ferguson, R. Flow resistance equations for gravel- and boulder-bed streams. Water Resour. Res. 2007, 43. [Google Scholar] [CrossRef] [Green Version]
  59. Haschenburger, J.K.; Church, M. Bed material transport estimated from the virtual velocity of sediment. Earth Surf. Process. Landf. 1998, 23, 791–808. [Google Scholar] [CrossRef]
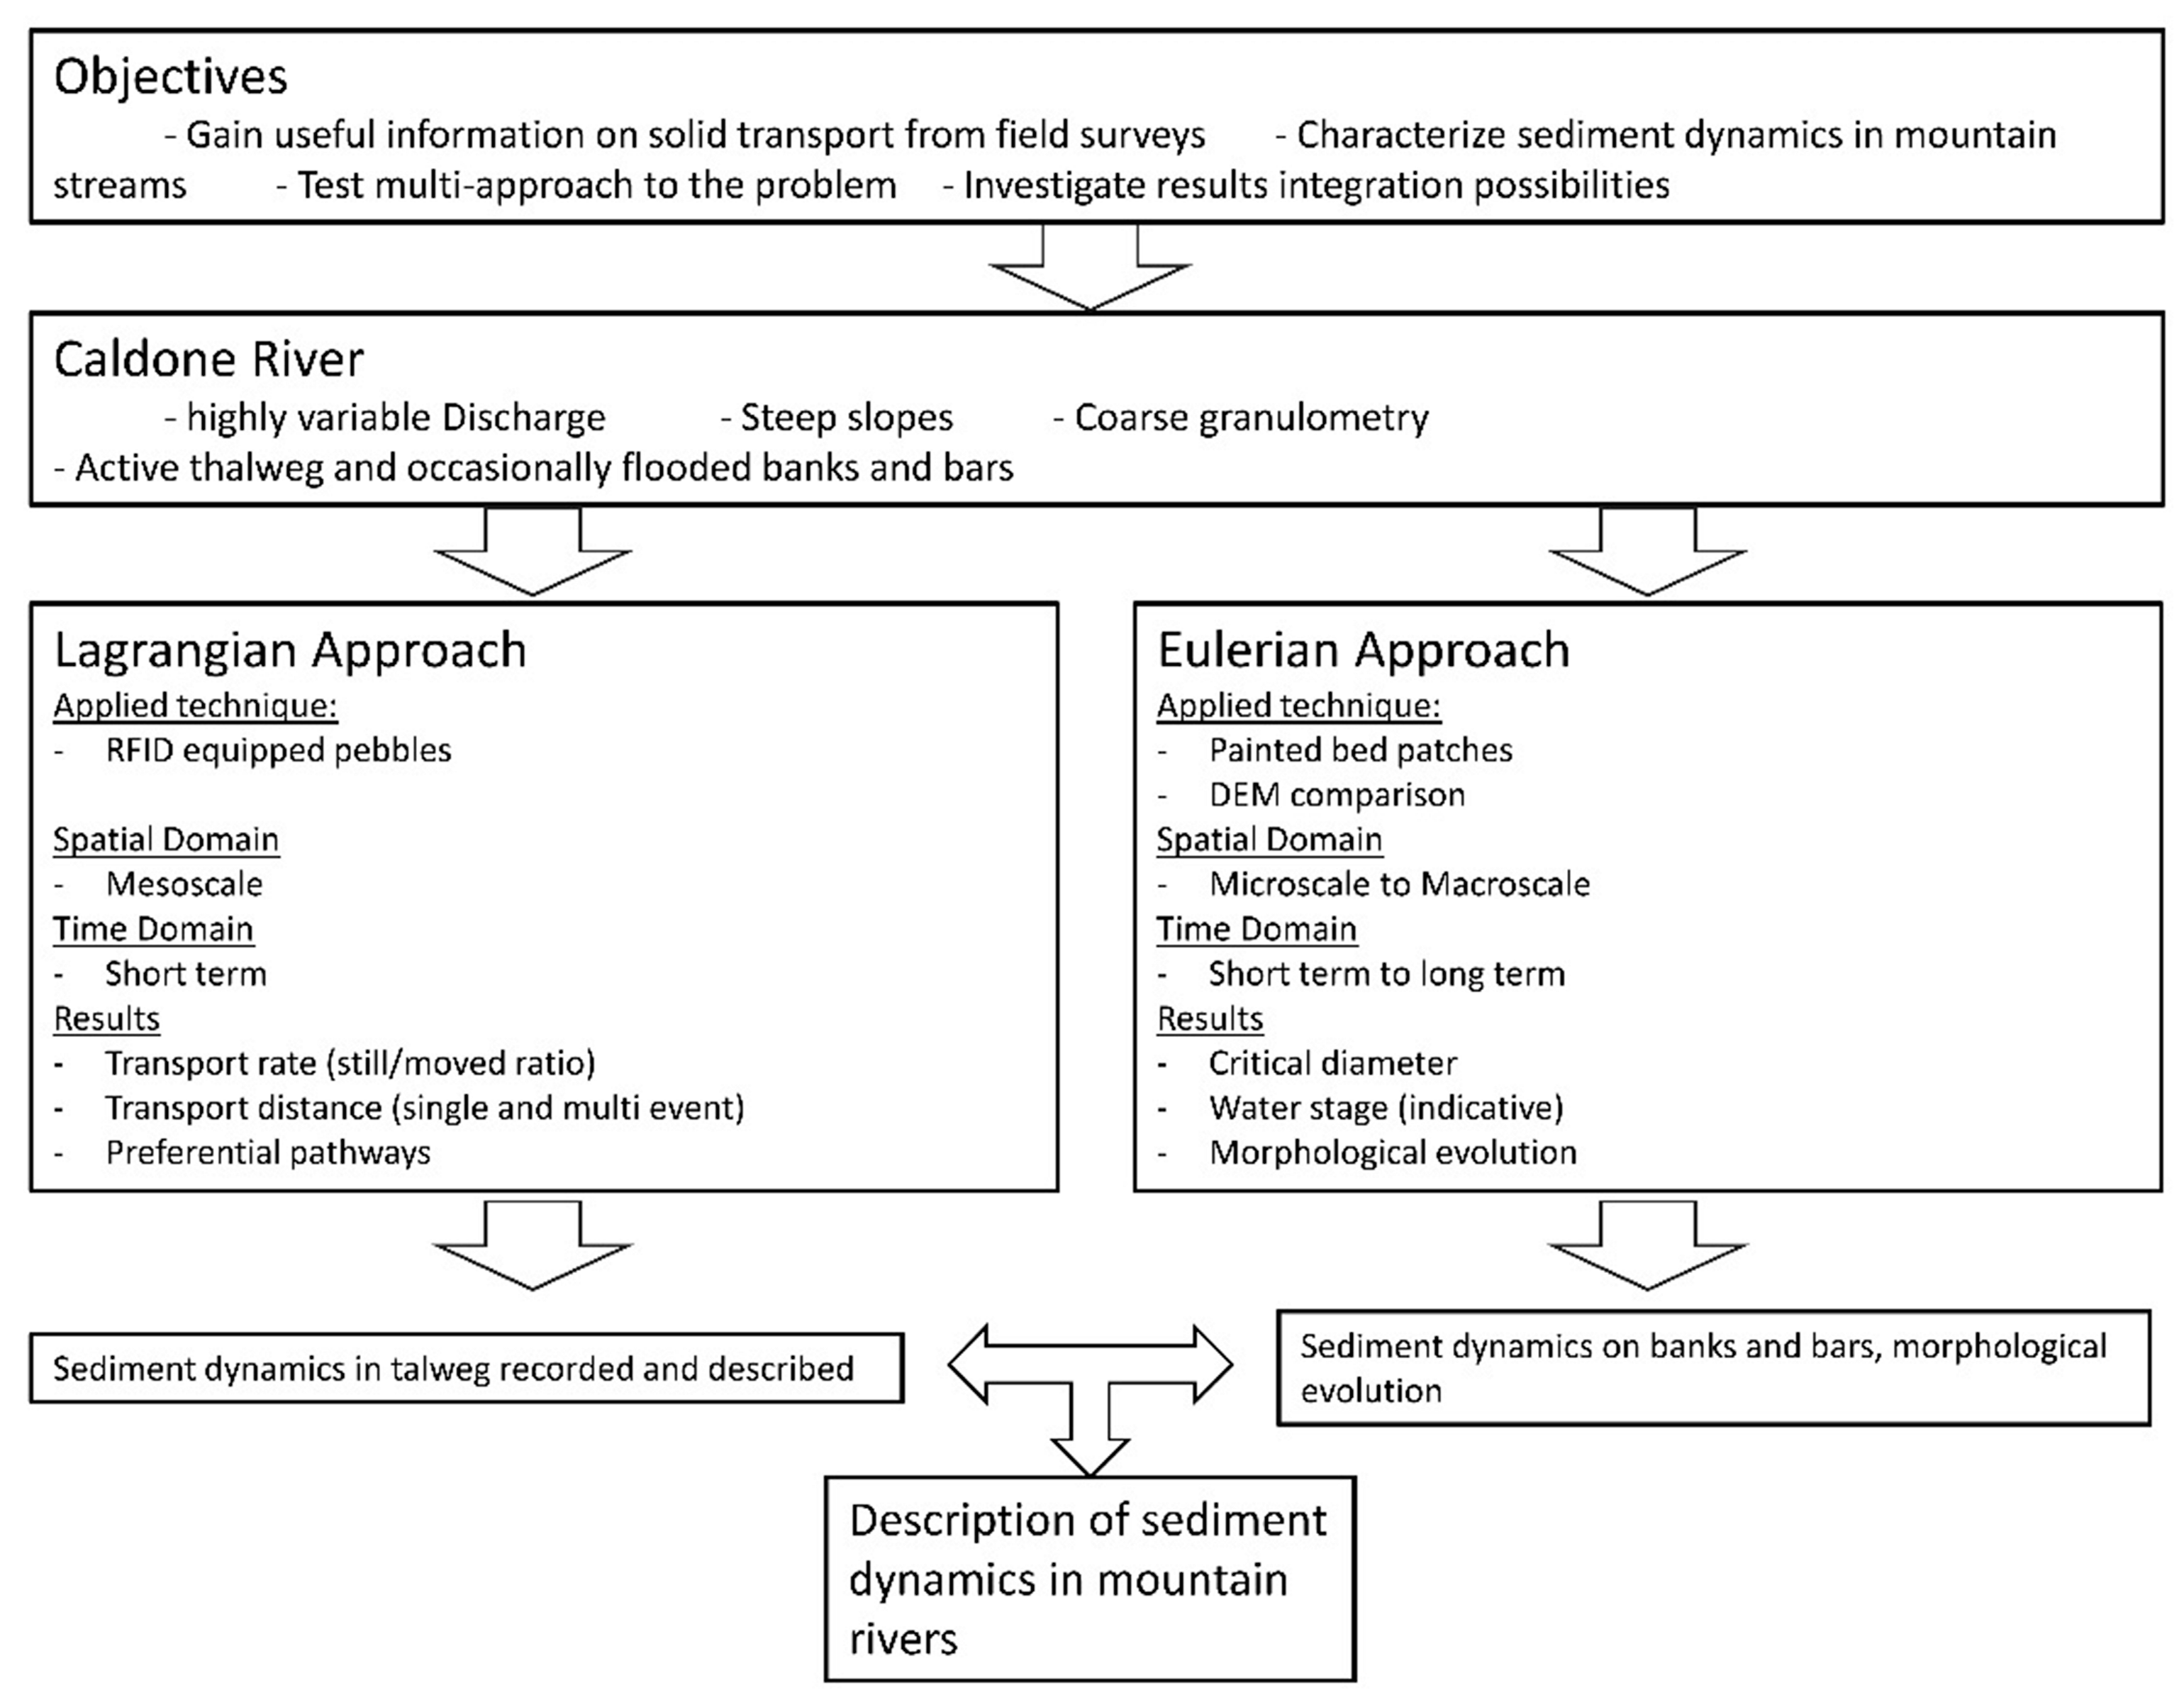
Figure 1. Flow chart of the present work. Main features of applied methods are highlighted along with the results obtained.
Geosciences 08 00163 g001
Figure 2. Caldone River watershed and main interest points. Tracers were added in segments 6, 7, and 11. A rain gauge is present in segment 11. Level gauges are present in segments 7 and 11. Part of segment 11 flows in a culvert. Red crosses stand for the two sedimentation pools, while red ticks represent granulometric analysis spots.
Geosciences 08 00163 g002
Figure 3. Key spots in the Caldone River: (a) Sedimentation pond in reach 6; (b) culvert entrance in reach 11; (c) level gauge in reach 7, notice the check dam used as hydraulic model constrain.
Geosciences 08 00163 g003
Figure 4. Deployment of the tracers and their position in the stream, reach 6 (modified after [55]). (ac) Show three deployment spots in reality and on the ortophoto; (d) Is the ortophoto of reach 6 where yellow dots are tracer starting points, numbered from 1 to 4, red dots are painted bed patches, and red squares are the most active zones found with digital elevation model (DEM) comparison.
Geosciences 08 00163 g004
Figure 5. Covered distance (blue crosses) and recovery ratio (orange squares) plotted versus measured peak discharge for each event. It is possible to notice a weak direct relationship between distance and discharge and inverse between recovery ratio and discharge. Recovery ratio is also affected by new tracer insertion.
Geosciences 08 00163 g005
Figure 6. Positions of tracers in 2016 events for reach 6, where each color represent a date. Notice how the pebbles move downstream in time and remain in the thalweg of the river.
Geosciences 08 00163 g006
Figure 7. (a) A semi-Eulerian test area before (17 March) and (b) after (27 March) an event occurrence.
Geosciences 08 00163 g007
Figure 8. Upstream deposition area. (a) Picture taken in spring, 2016 and in (b) in fall, 2017; (c) Cloud-to-cloud comparison results; color range highlights the accumulation of debris (in green).
Geosciences 08 00163 g008
Figure 9. Remaining clasts, as a percentage of the original sample, divided per granulometric class after event eight. The blue bar is the proportion of clasts before event eight (100%), the orange bar is for the amount after (variable percentage).
Geosciences 08 00163 g009
Table 1. Main instruments available in the Caldone River. Elevation expressed as Above sea level (a.s.l.).
InstrumentElevation (m a.s.l.)Measurement FrequencyRemote ControlledReach Number
Water level gauge210HourlyYes11
Rain gauge210HourlyYes11
Water level gauge350EventNo7
Table 2. Main features of the three studied reaches.
Reach NumberMorphology TypeReach Length (m)Mean Width (m)Mean Slope (%)D90 (mm)D50 (mm)D10 (mm)
6Boulder and cascade100085.55112.31
7Step and pool375<103.76817.53.7
11Plane bed80061.5110190.95
Table 3. Main features of surveyed events. Peak discharge is measured at an outlet.
Event NumberDateCumulative Rain Depth (mm)Rain Duration (h)Peak Discharge (m3/s)Mean Distance (m)RFID Recovery Ratio (%)
126 June 201626417.0610.977.3
22 July 20161172.417.060.2
313 July 2016271322.563.446.6
422 July 2016443514.397.769.9
531 July 201629185.883.170.8
65 August 201667957.3116.554.2
814 October 2016434211.483.351.3
920 November 20169413228.1812.841.9
104 March 201714312.951.744.3
123 May 201721169.011.058.0
1313 May 201735817.062.165.0
146 June 20171326227.183.964.1
1528 June 20171101866.0915.428.4
168 September 20172757.336.931.3
1710 September 2017945679.8932.018.2
185 November 2017532612.763.116.0
Note: Details about Events 7 and 11 are missing due to technical problems. Radio-frequency identification (RFID).
Table 4. Critical diameter (Dc) comparison table. Flowrate was measured in the surveyed reach.
Reach NumberEvent NumberMorphology TypeFlow Rate (m3/s)Dc Measured (mm)Dc Calculated (mm)Manning Resistance n (s/m1/3)
66Bank5.88>90.593.50.04
67Bank1.1245.3–64500.04
67Bar1.1264–90.5800.03
68Bank0.6745.3–64420.04
68Bar0.6745.3–64650.03
78Bar0.6732–45.3320.04
78Bar0.6764–90.5680.03
610Bar1.445.3–64600.04
610Bank1.445.3–64400.03
614Bar5.88>90.5920.05
614Bar5.8845.3–641350.07
617Bar1.55>90.5870.04
617Bank1.55>64910.05
617Bank1.55>100990.04
617Bank1.55>1001060.04
618Bar3.1922.6–32680.04
618Bank3.19<10670.04