2.1. Hydrodynamic Software and Storm Winds
The same methodology presented in research from Gomes et al. [
14] was applied. In the first phase, data on the historical coastal storms that occurred near the Portuguese coast were collected using the National Oceanic and Atmospheric Administration [
15] and Unisys Weather [
16] databases as well as the University of Hawaii Sea Level Center’s database. DelftDashboard Version 2.01 (Deltares: Delft, The Netherlands) and Delft3D-FLOW Version 4.03 (Deltares: Delft, The Netherlands) [
17,
18] were applied for the assessment of the effect of storms on the surface elevation of the water along the Portuguese northern coast. With the aid of the DelftDashboard software a grid was generated, and the corresponding open boundary conditions were defined. The wind field associated with the storm trajectory was also generated with the aid of the DelftDashboard tools.
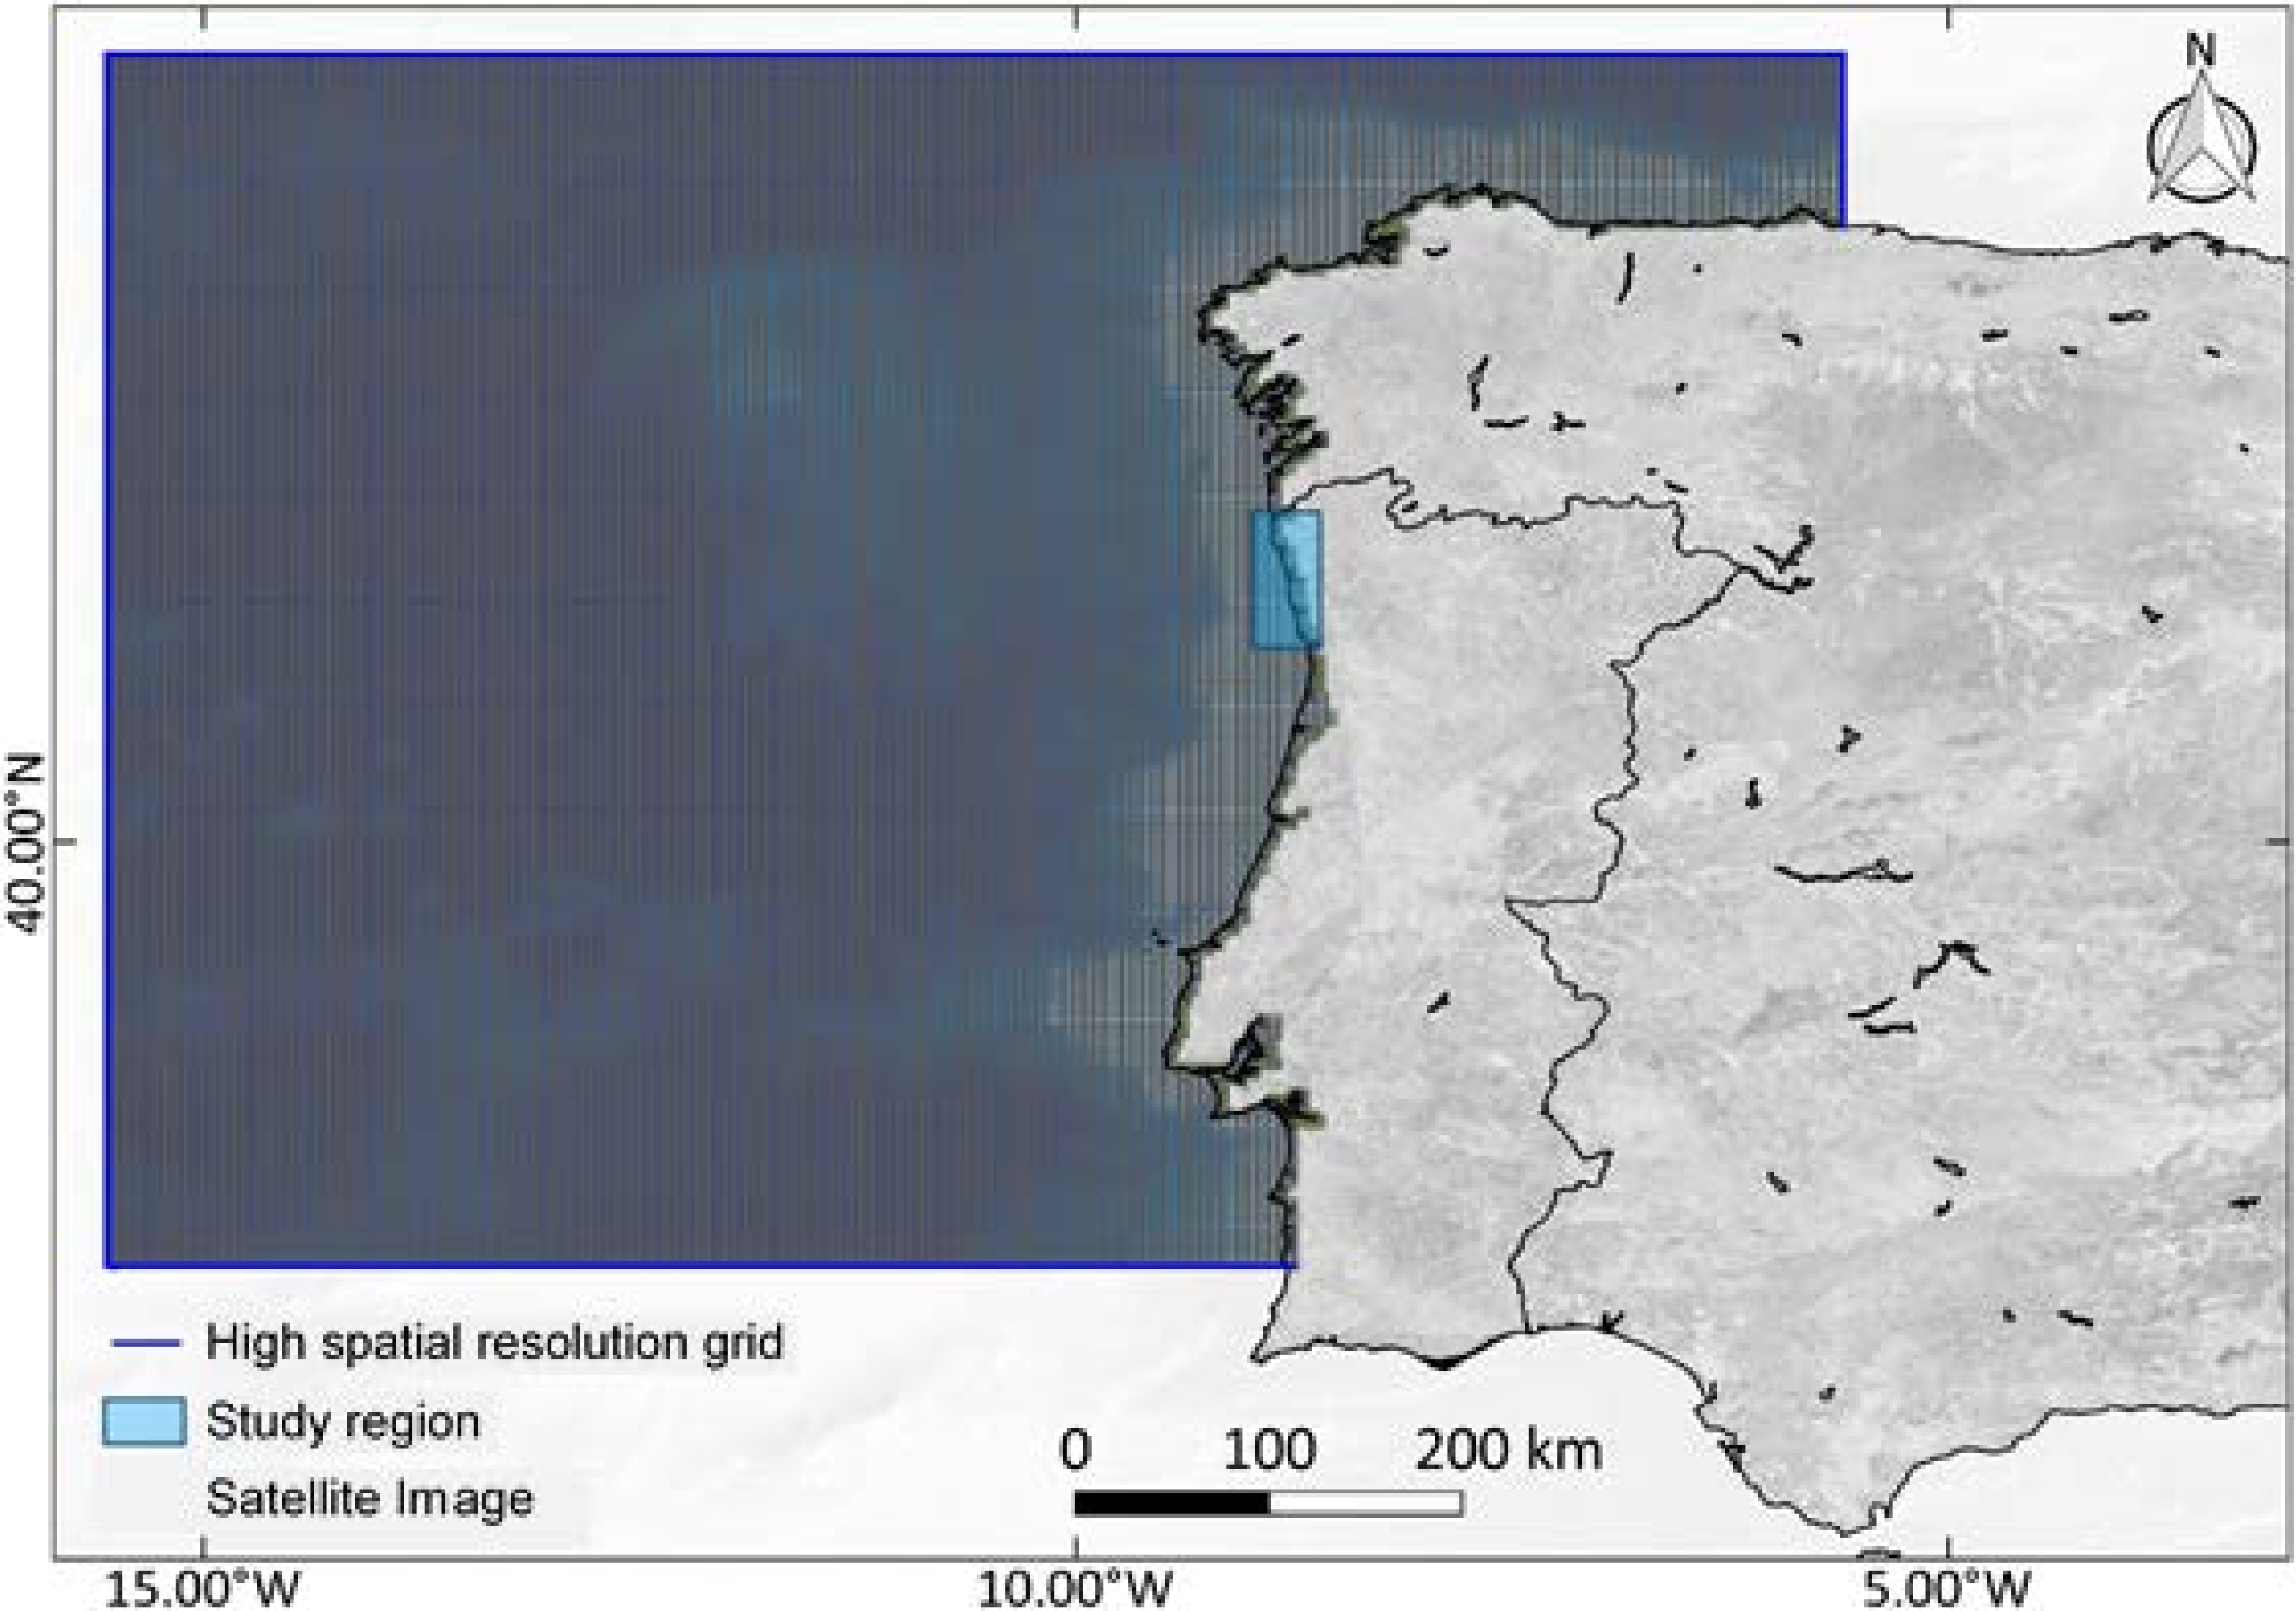
The second phase was focused on the simulation of scenarios using a numerical model for the different trajectories and intensities of the collected historical storms. A very fine grid was adopted, covering an area extensive enough so that the region of the northwestern Portuguese coast would be clearly distinguished and the area under analysis would be far away enough from the open boundaries to minimize the impact of inconsistencies resulting from the conditions adopted at those locations. Because there are no available data for northern Portuguese observation stations, the application of DelftDashboard’s Tropical Cyclone Toolbox to this region did not allow for a detailed comparison of the predicted results to the actual observed results. However, the obtained simulated results are of the same order of magnitude as the results found in the literature.
The hydrodynamic numerical software, Delft3D-FLOW [
17] considers different physical phenomena such as the Coriolis force, water density gradients, tidal flow analysis, currents induced by wind, and pressure gradients. Pre-processing tasks were supported by the above-mentioned tool, DelftDashboard. This tool allows for the definition of the model grid, its bathymetry, the open boundary conditions, and the generation of the wind field [
17,
18] associated with each simulated storm.
Delft3D solves the nonlinear shallow water equations in two and three dimensions. These equations are derived by averaging the full Navier–Stokes equations in the vertical direction, assuming that the horizontal scale is much larger than the vertical. The vertical accelerations are assumed to be much smaller than the horizontal ones, which reduces the vertical momentum equation to a hydrostatic pressure equation. For a three-dimensional shallow water model, the flow domain is made up of a horizontal plane of a limited area composed of open and closed boundaries, and in the vertical direction a number of layers are defined. The model’s hydrodynamic formulation details are presented in the paper by Gomes et al. [
14]. It uses the alternating direction implicit (ADI) method to integrate shallow water equations in time. The ADI method splits a single time step into two phases, in which each phase makes up half of a time step. In both phases, all terms of the model equations are solved in a consistent way with at least second order accuracy in space [
17]. It also uses three different spatial discretizations (in terms of advection): the WAQUA-Scheme, the Cyclic Method, and the Flooding Scheme.
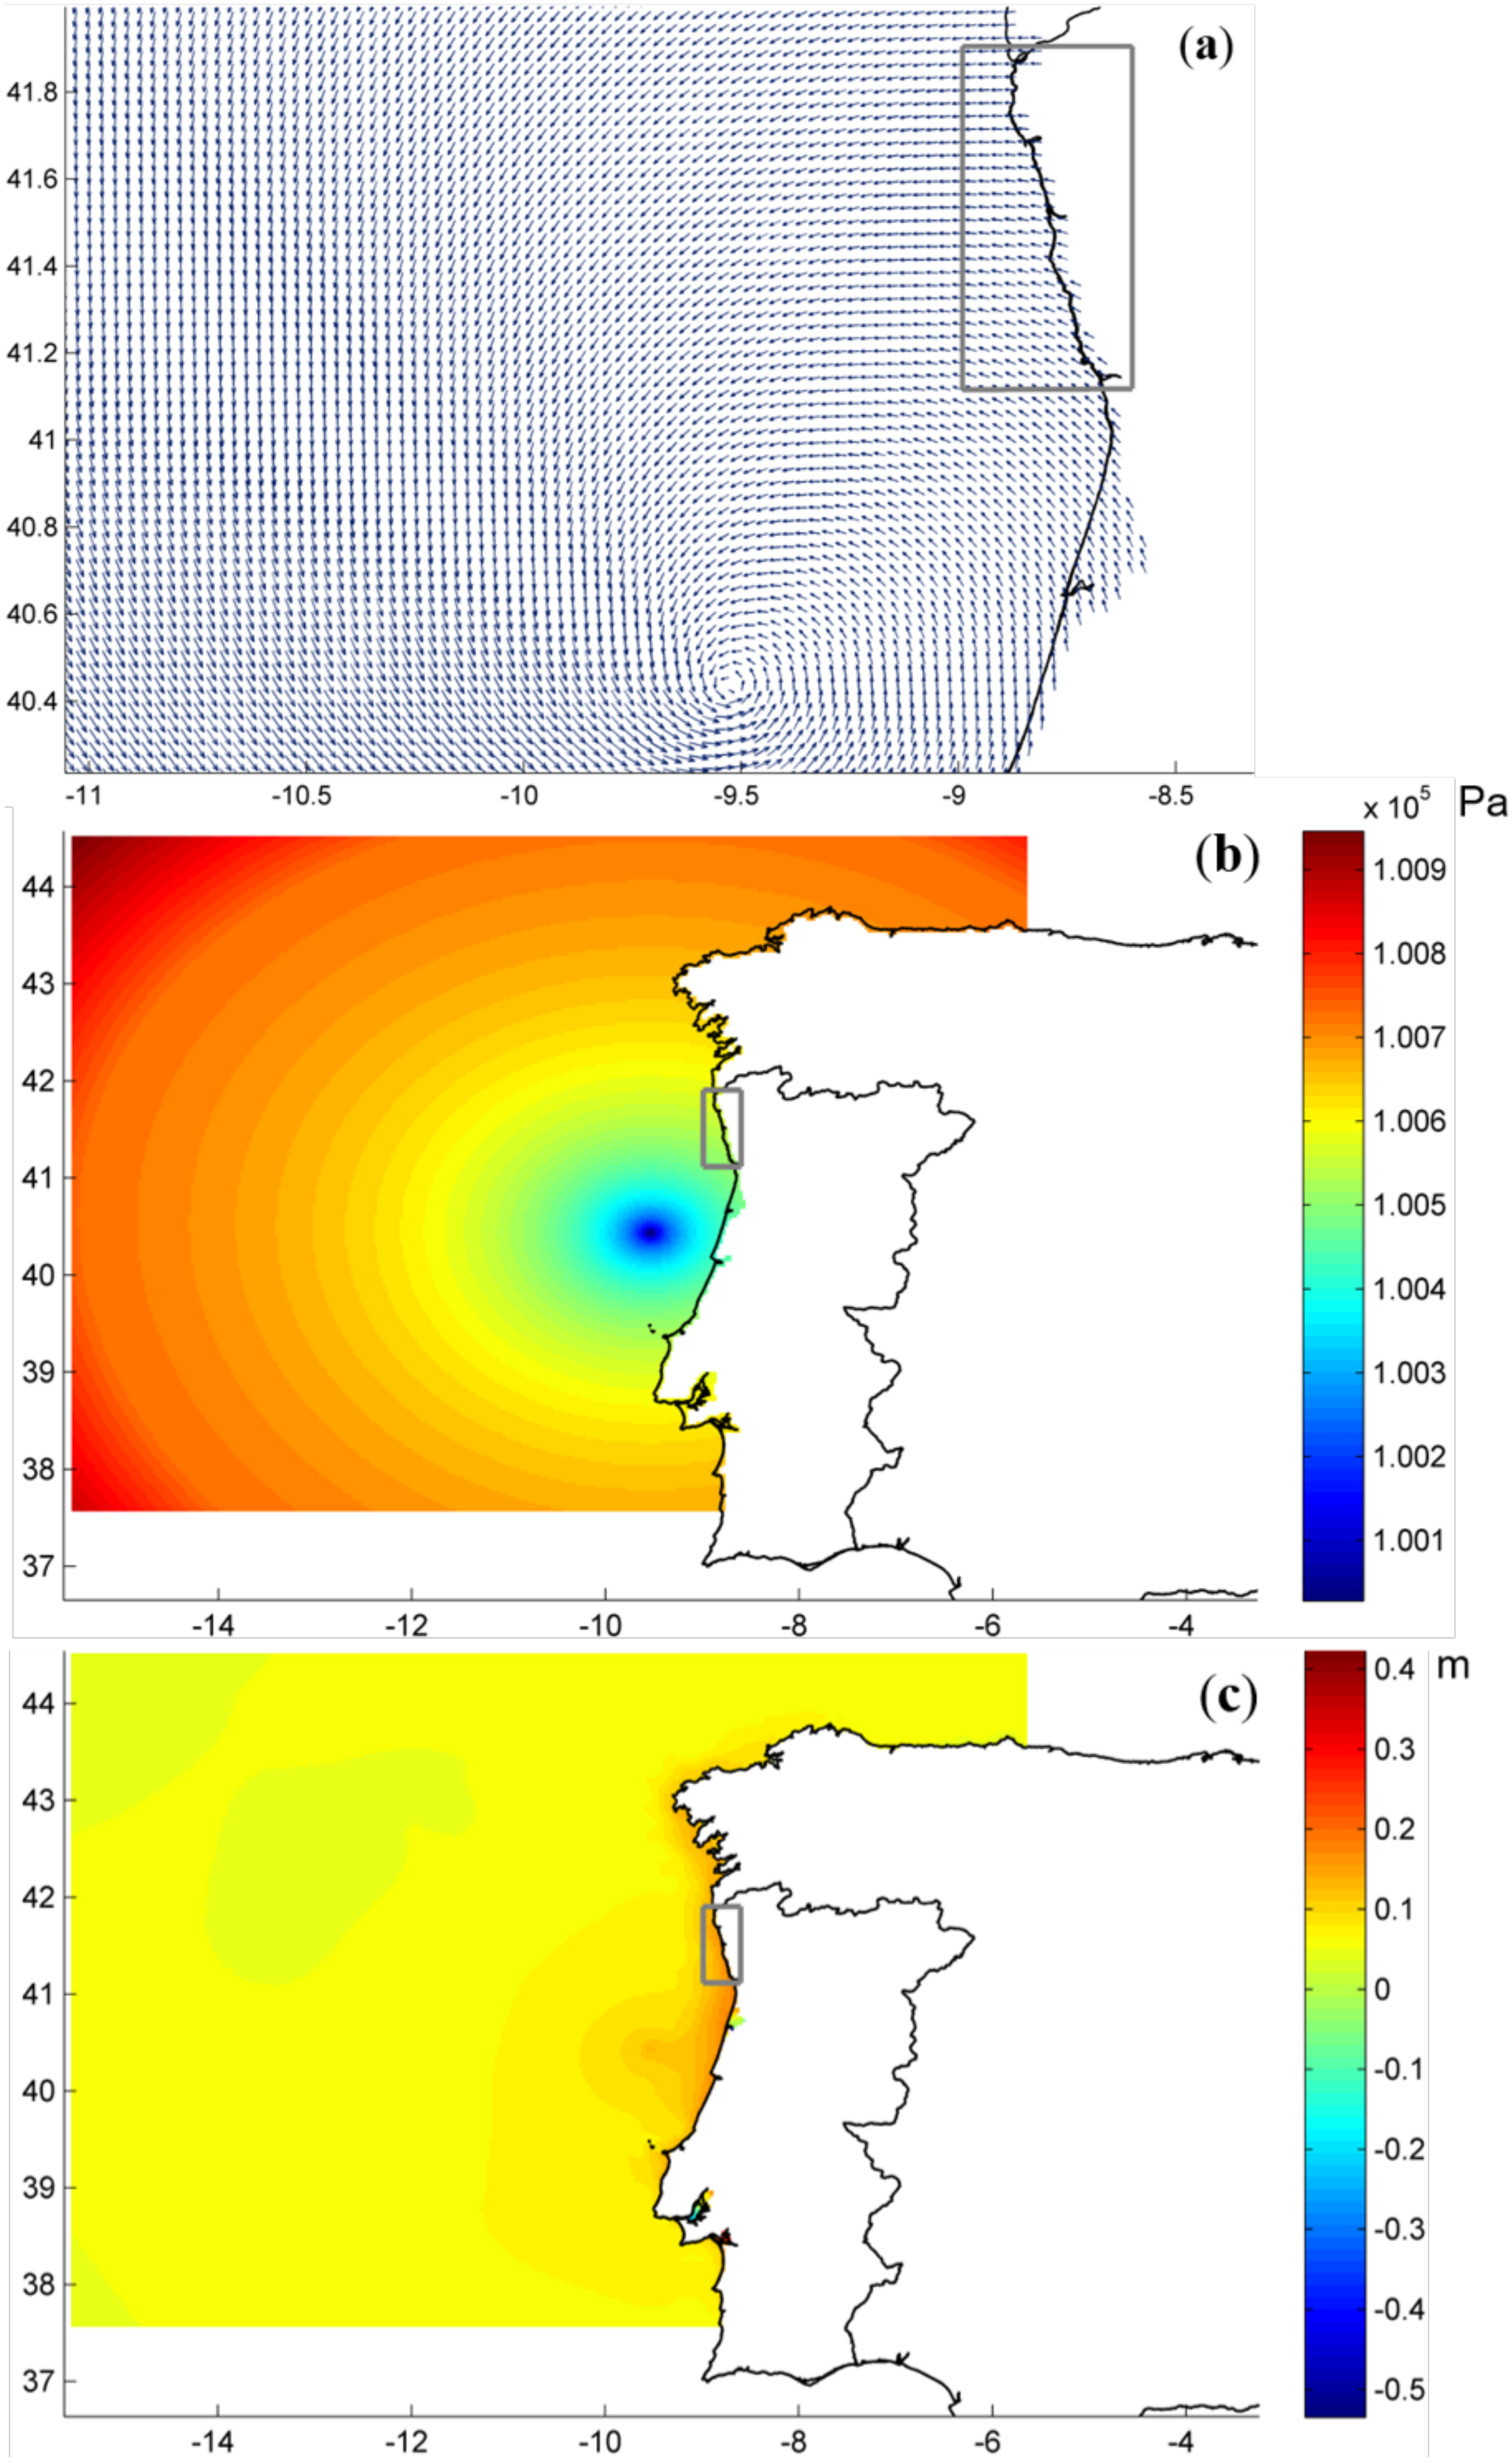
DelftDashboard’s Tropical Cyclone Toolbox, which computes the wind field and pressure drop generated by a cyclone, was used to simulate the ocean water levels [
17]. This tool is based on the wind enhanced scheme [
19]. The wind field is generated based on the analytical cyclone model of Holland [
20] that was further improved by introducing asymmetry.
For a particular cyclone it is necessary to define its trajectory and associated time steps, maximum wind speed (V
max), maximum radius wind speed (R
max), and pressure drop (P
drop). The intensity or maximum wind speed is defined as the system’s maximum sustained winds. The radius of maximum winds is characterized as the distance from the center of the tropical cyclone to the location of the cyclone’s maximum winds. In well-developed hurricanes the radius is found in the inner eyewall, while in subtropical systems the radius very frequently occurs far away from the center. Lastly, the pressure drop represents the difference between the ambient and central pressures of a tropical system. The space-varying wind and pressure on a polar cyclone-following grid is added to the background wind input, which is then interpolated and combined in and around the cyclone [
17].
2.2. Generation of Storms
A hazard assessment of the effect of an exacerbation of the typically observed storms in the region was performed. Considering results from changes in the trajectories of the various historical storms, the analysis of the coast’s response to storminess was assessed using the execution of different hypothetical scenarios. Several simulations under conditions of uncertainty were generated, recurring to form an ensemble of simulations. When dealing with natural systems, like weather and climatic conditions, they should be treated as a statistical system rather than a deterministic one. Since the true state of the atmosphere can only be approximately observed, a statistical mean of a set of model forecasts, starting from slightly different initial states, reduces the impact of initial data uncertainties on the final forecast [
21].
The studied factors that were influential in the accuracy of the prediction of the effects of a tropical cyclone were the cyclone’s position, its intensity, the radius of maximum winds, and its atmospheric pressure drop. Geographical shifts were applied to the “normal” trajectories of the cyclones while simultaneously varying the meteorological conditions. The Asoftech Automation Macro Recorder [
22] was utilized for the process of creating a randomized tropical cyclone and repeating it for any desired number of times. With its ‘Schedule’ feature, the macro was set to run at a pre-defined time and to repeat indefinitely. Certain reasonable limits were adopted for the values of the variables (latitude, longitude, V
max, R
max, and P
drop) based on observed values in the case study region. The variables were then randomized according to the limits so that the ensemble members displayed correlations between each other, but at the same time the simulations resulted in different possible outcomes.
The first established variable was the tropical cyclones’ track positions; that is, how their longitude and latitude progress throughout the given time period. Normally, as tropical cyclones travel westward, they tend to curve poleward with a continued period of transitioning from tropical systems to extratropical. At the beginning of the season the delayed warming of the oceans tends to force the location of the transition northward, since the critical threshold for tropical development is pushed northward. As the season progresses, after the month of August, the climatologically favored region for baroclinic development expands southward [
12]. It is at this point that the trailing ends of tropical cyclones become the most threatening in Portugal’s case. In order to imitate trajectories that reach Western Europe, specifically the northern Portuguese coast, the first imposed limitation was that the latitude not surpass a certain limit, selected as 45° N. Contrary to the case study seen in the paper by Gomes et al. [
14], the peak was in the latitudinal direction because during the high “hurricane season”, occurring between August and October, the transition occurs between 40° N and 50° N [
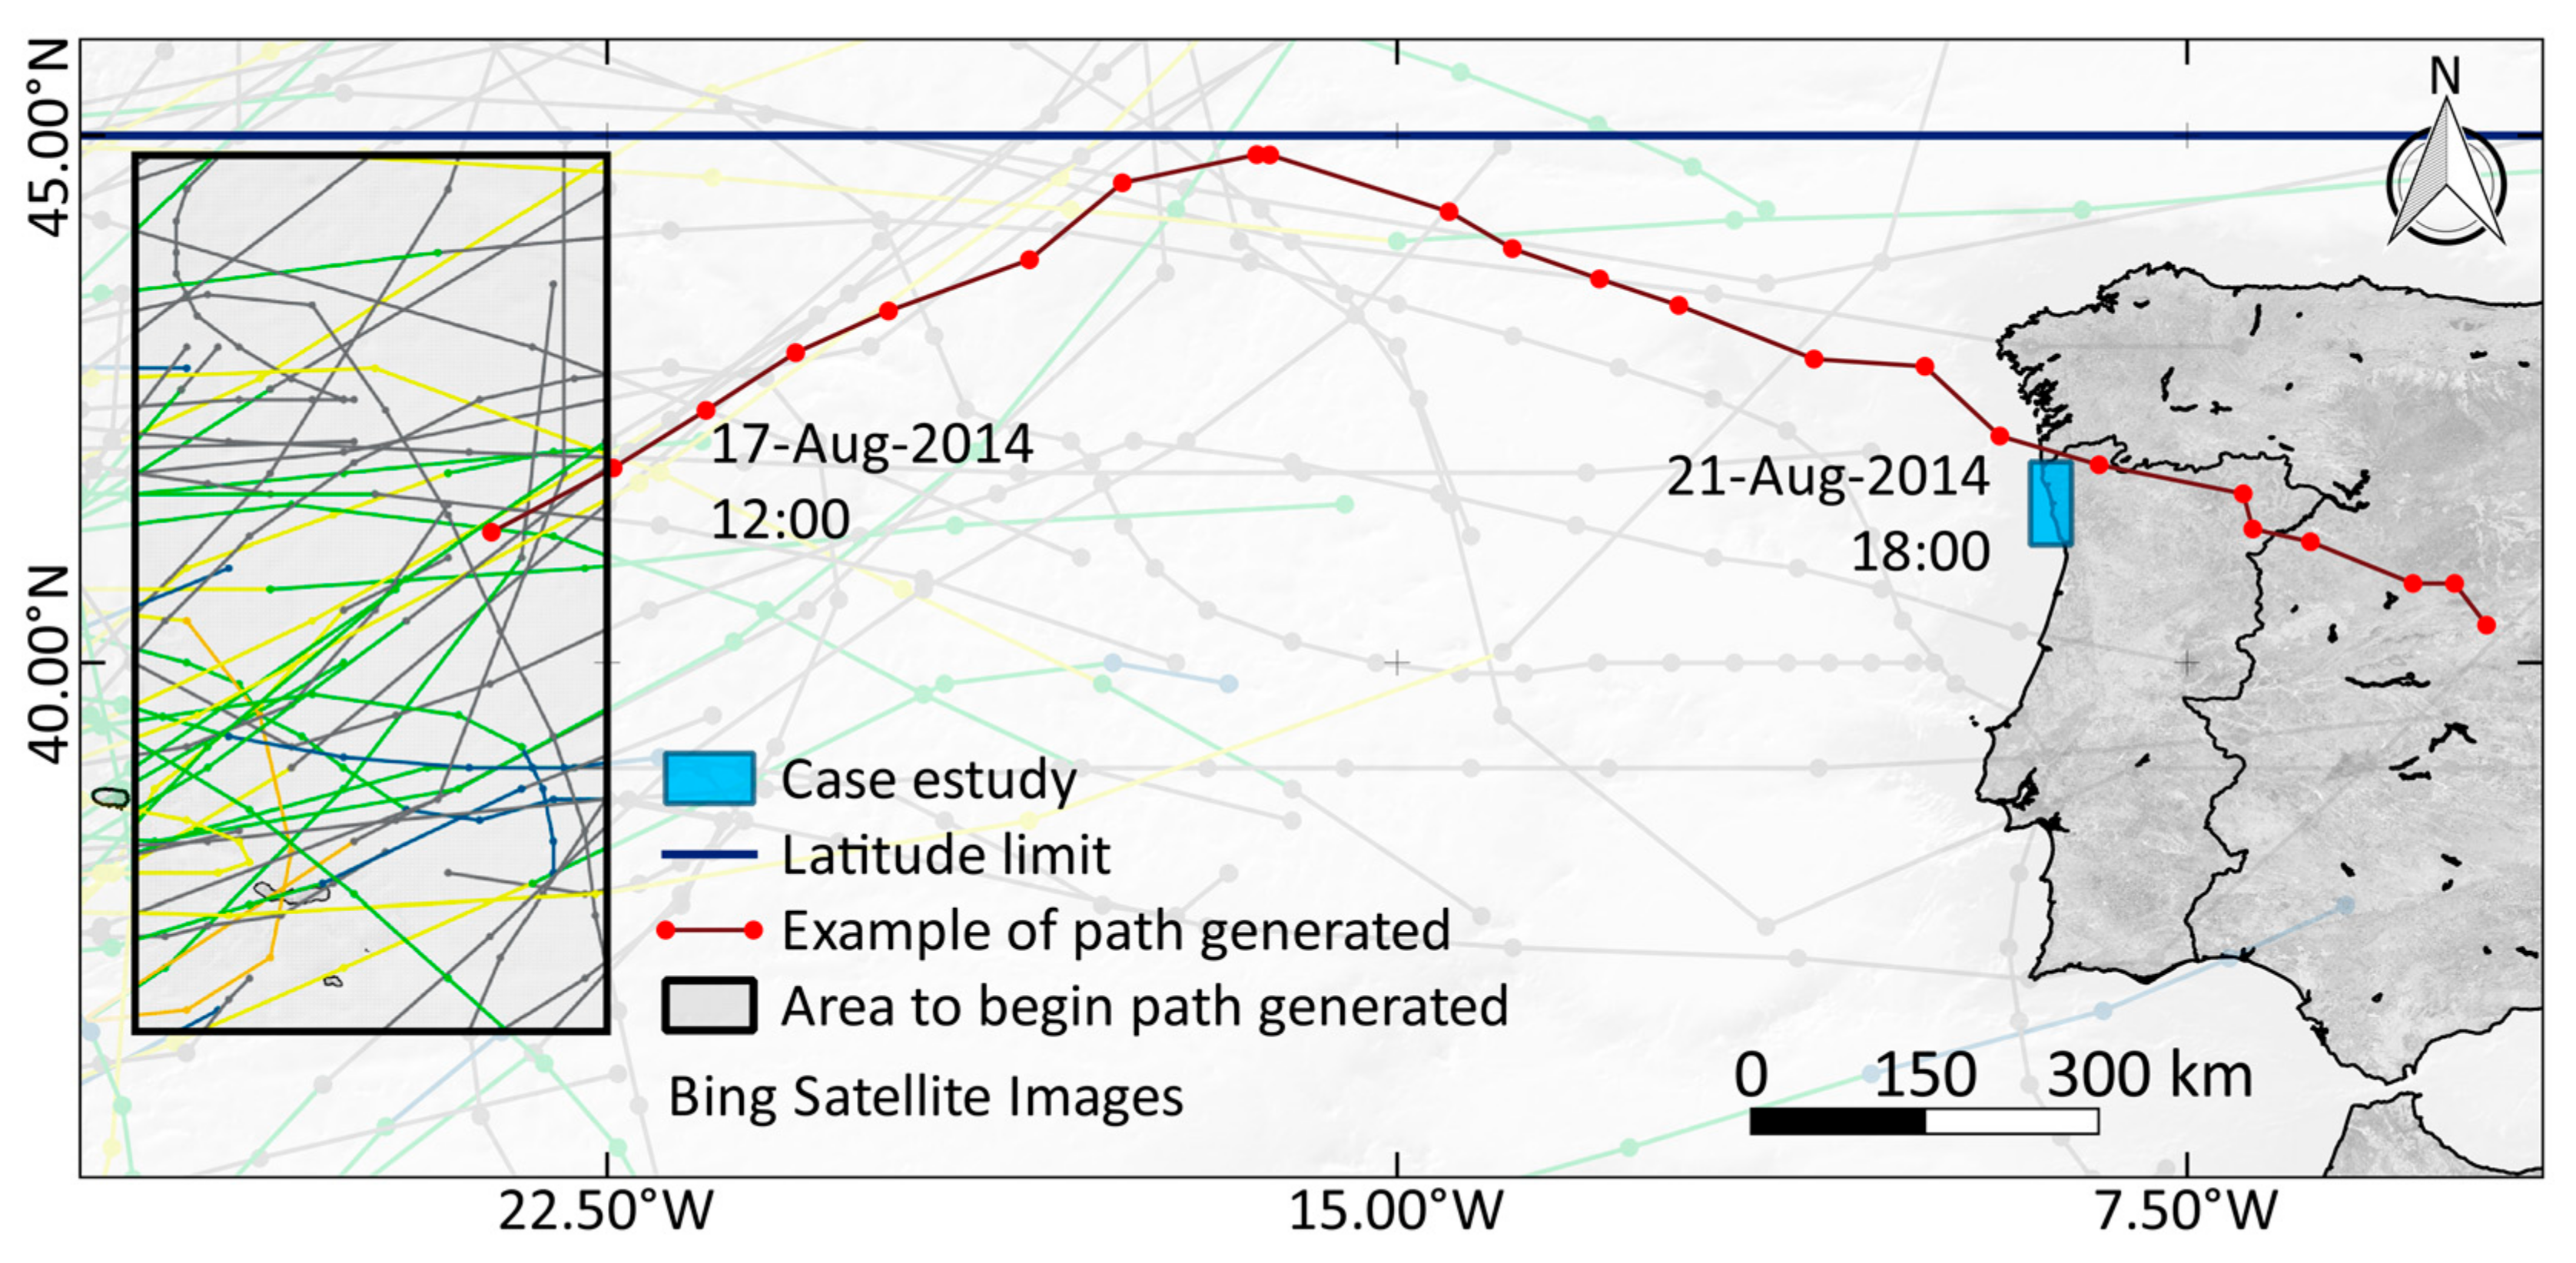
12]. The cyclones’ paths were selected to begin at a random value between 36.5° N and 44.8° N latitude (
Figure 2). The values were set to increase in random intervals between 0.1° and 0.3° if the point’s latitude occurred before reaching the turning point. At this point, the trajectory was forced southward so as to hit the Iberian Peninsula. If the point reached the established latitudinal peak at 45° N, the values were set to subsequently decrease in random intervals between 0.1° and 0.5°. The very small variance in the paths’ latitudes was to ensure a somewhat direct, or “straight”, cyclonic trajectory towards the coast, similar to what is usually witnessed in this region.
For the paths’ longitudinal values, the tropical cyclone trajectories were set to begin at a random value between 27.0° W and 22.5° W longitude. The following points were then set to increase in random increments between 0.5° and 1.0°. Again, the relatively small variance was adopted in order to keep the paths of the tropical cyclones as straight as possible.
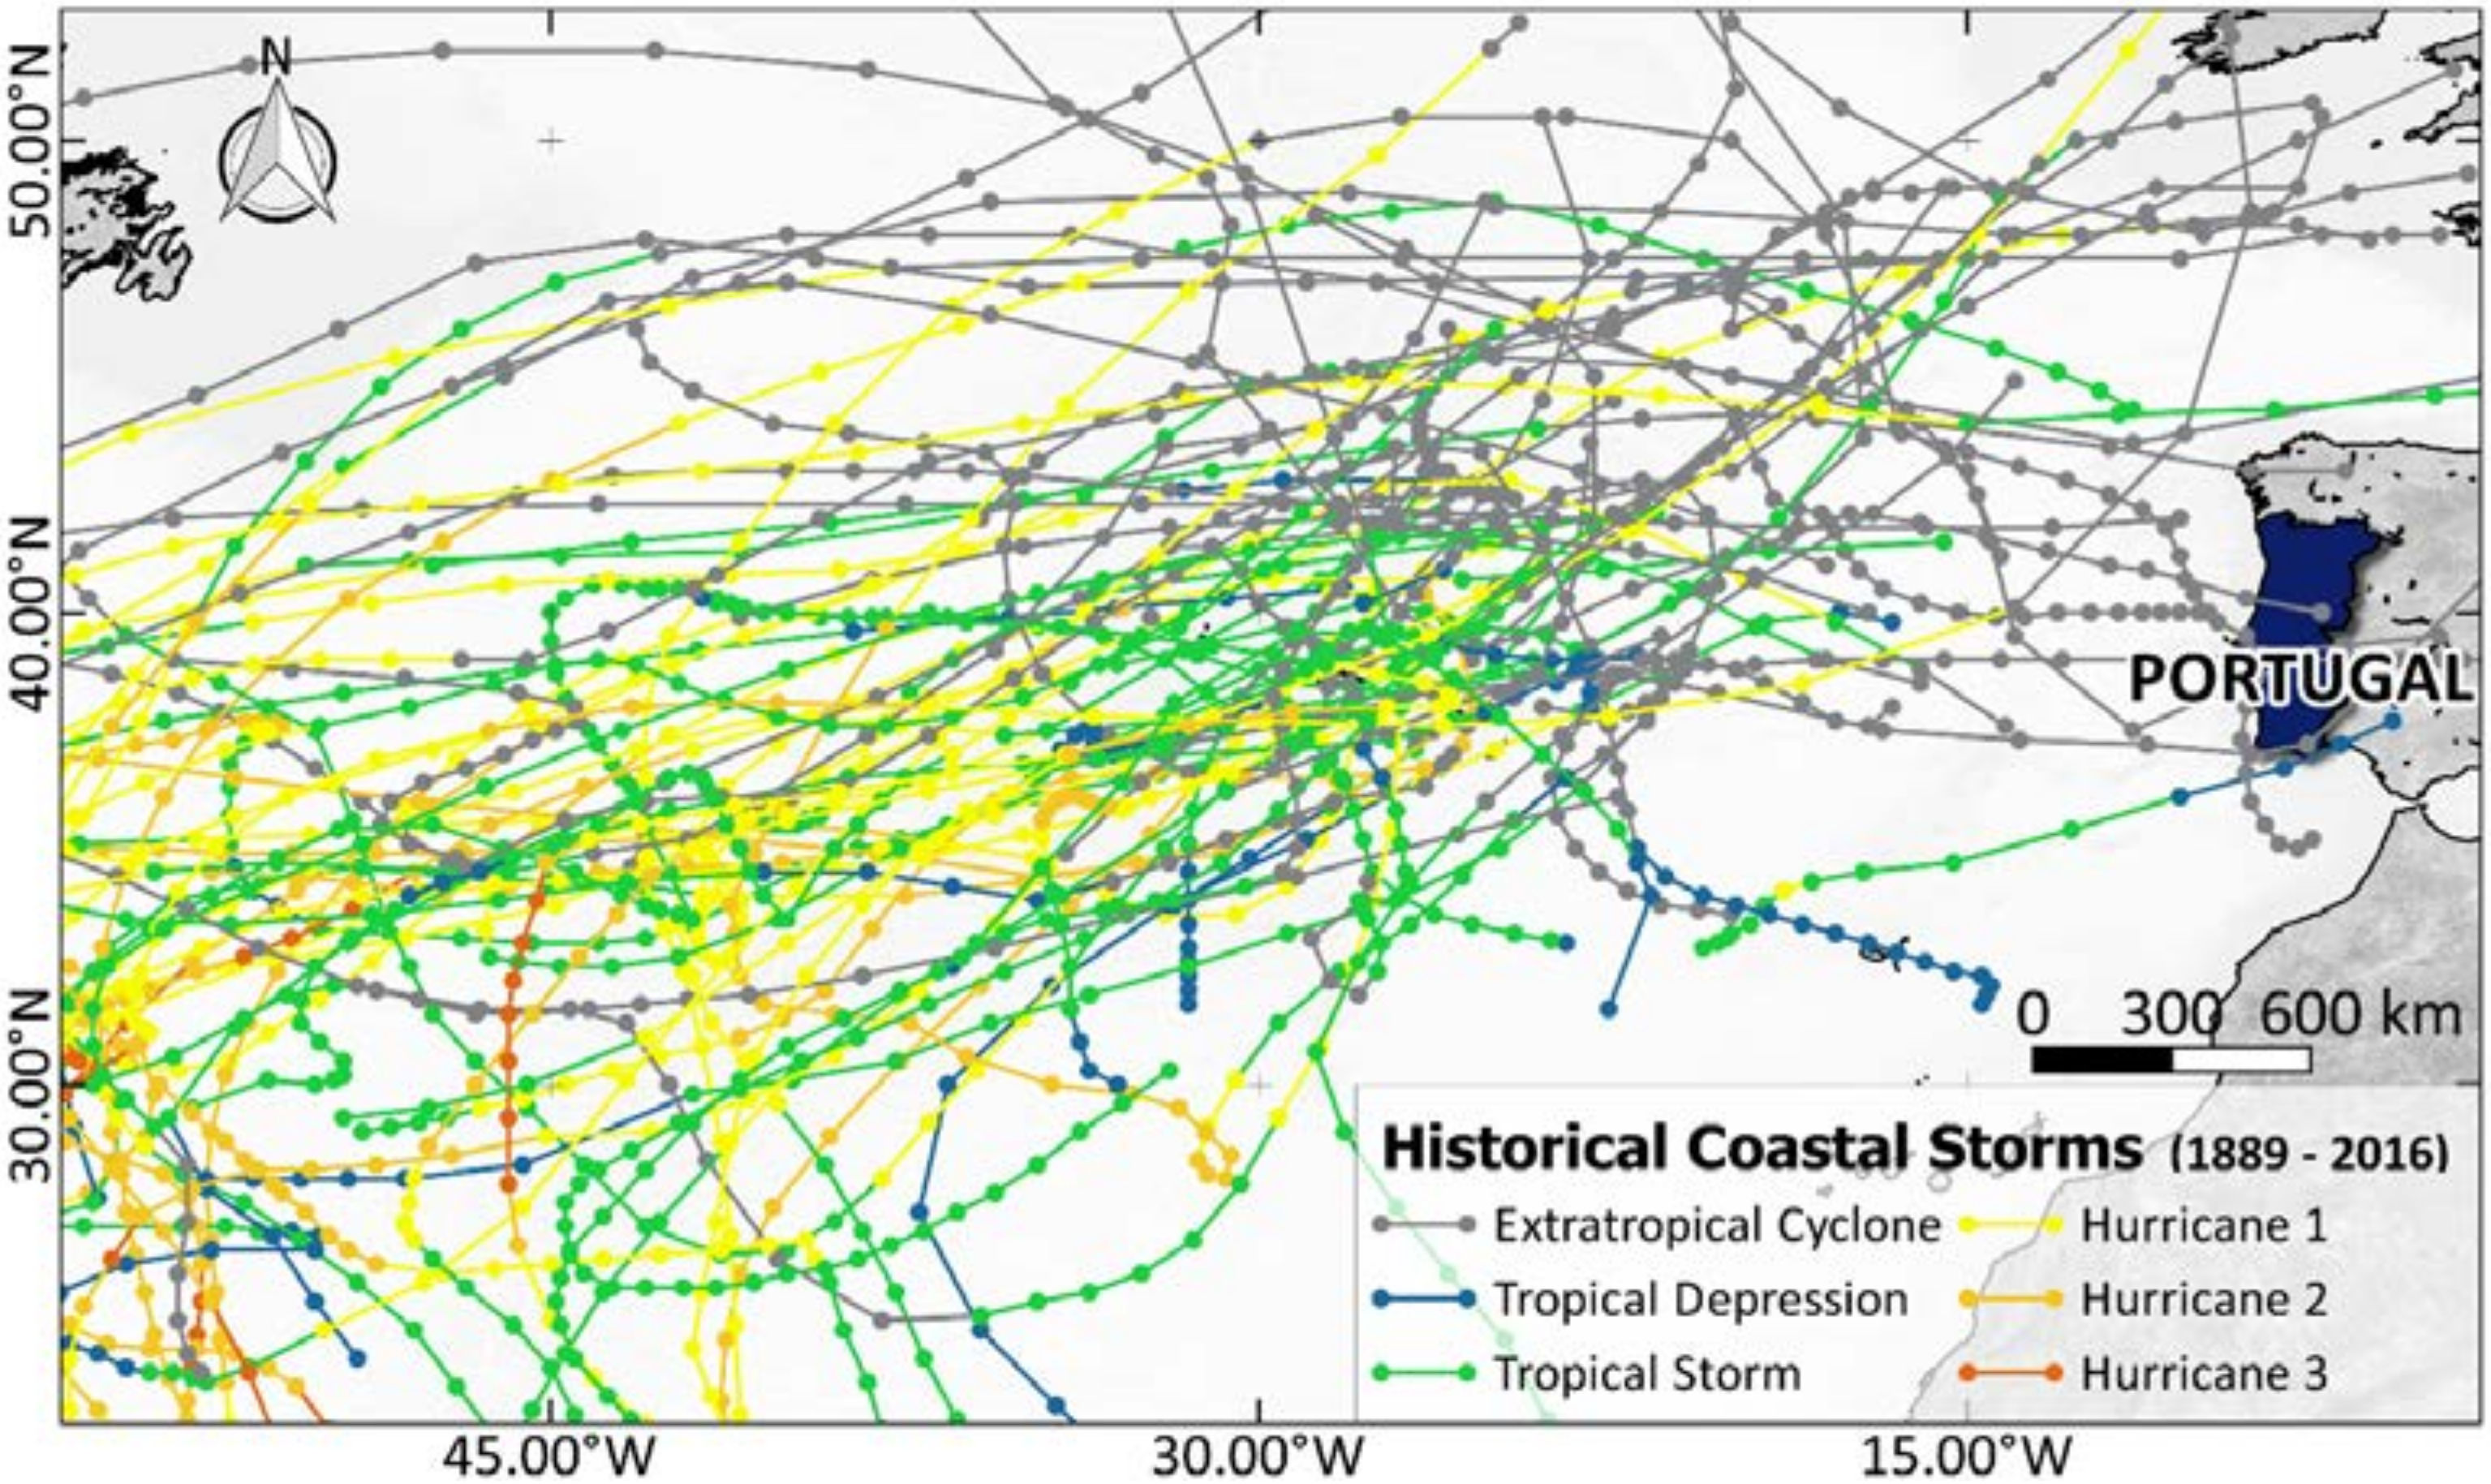
With the combination of the longitude and latitude origins, the beginning of the simulated trajectories was established in the region of the Portuguese Azores Islands. This is because it is usually at this point that a lot of the tropical cyclones occurring in the area travel towards Western Europe. There are a variety of different tropical cyclone paths that pass through this point, including tropical cyclones that reach the United States’ coast and continue to gain strength and travel across the Atlantic Ocean. In contrast, there are tropical cyclones that begin in the lower tropics and curve poleward in the mid-Atlantic very early in their development. The different types of paths are portrayed in
Figure 3 [
15]. It was decided to simulate the small part of the tropical cyclone that would reach the Portuguese coast—their tail-ends. It seemed as though this was the component that these tropical cyclones, as a group, had in common.
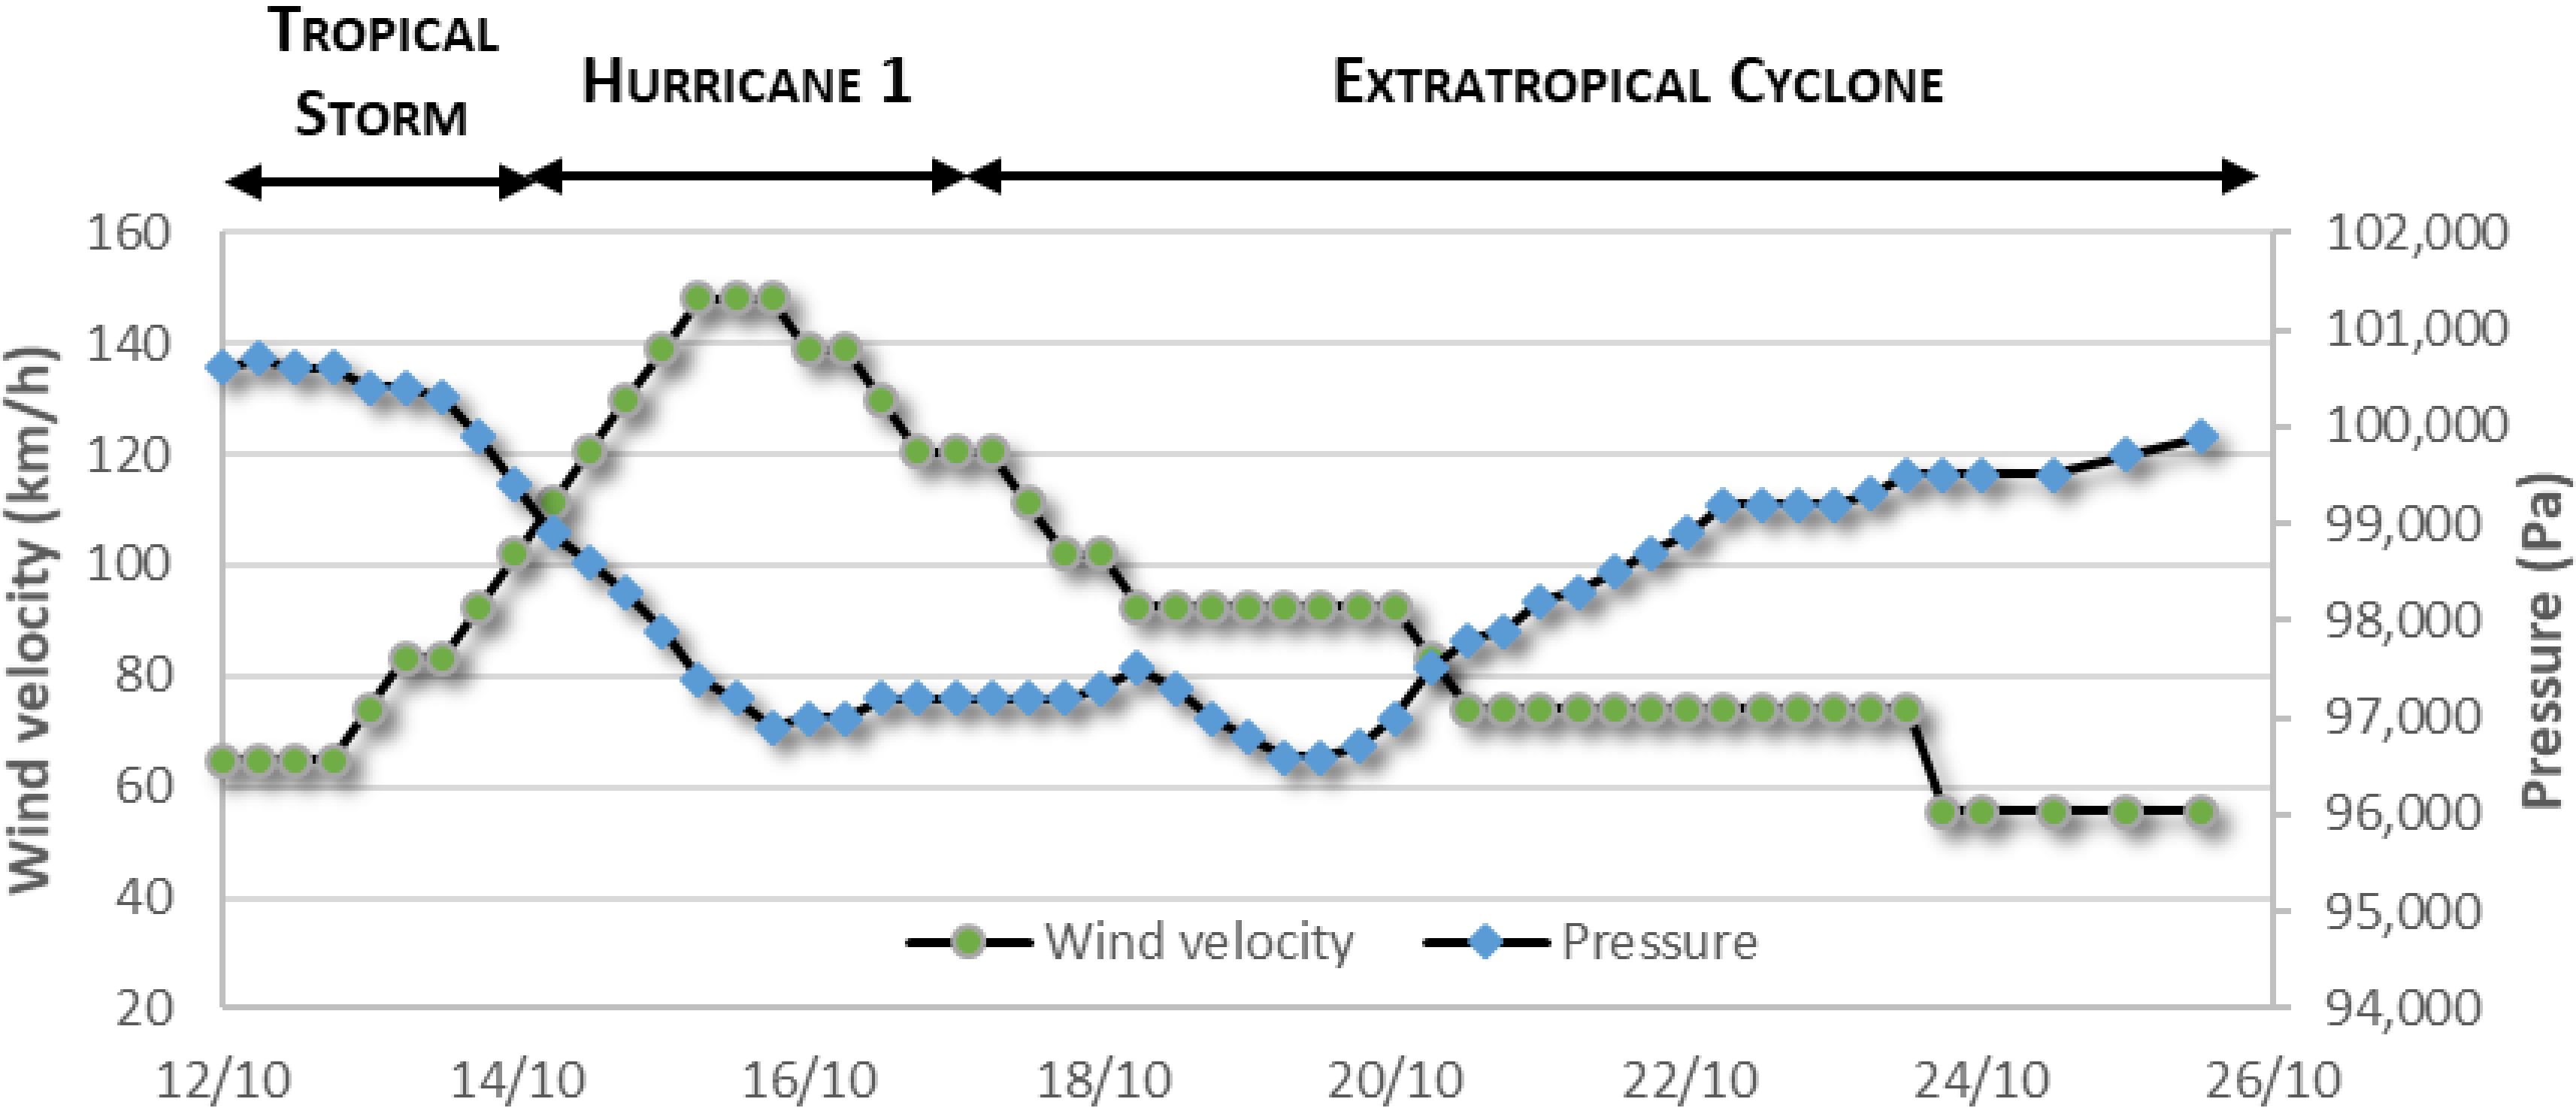
Another adopted randomized variable was the maximum sustained wind velocity, Vmax. In the region of the Azores Islands, this variable was selected to begin with a random value between 55.0 and 98.0 knots (101.86 and 181.50 km/h), in an attempt to span the various values historically recorded in that area. Because the tropical cyclones that approach the Portuguese coast are typically already transitioning extratropical cyclones with very low intensities, the main particularity to apply to the intensity’s definition was that the cyclones’ Vmax values do not fall below 30 knots (55.56 km/h). The decrease in Vmax values was carefully controlled to avoid wind speeds reaching values below 25 knots (46.30 km/h), which would lead to the non-generation of the wind field—a limitation that is assumed in the software. This would be equivalent to having a simulation with just the tidal influences acting upon the study area, rendering the simulation useless for our purposes. The analysis undertaken in these ensemble simulations was the coast’s vulnerability to coastal storms; specifically, coastal storms that could truly impact the shoreline. Because of this, each point’s intensity in the storm trajectory was set to decrease in random intervals between 1.0 and 1.5 knots (1.85 and 2.78 km/h) if the previous point was greater than or equal to 30 knots (55.56 km/h). If the value decreased so much that it reached 30 knots (55.56 km/h), the following point was set to decrease in smaller random intervals between 0.5 and 1.0 knots (0.93 and 1.85 km/h).
The radius of maximum winds was a factor of utmost difficulty to define, especially in this specific region. In the middle of the Atlantic Ocean there are instances in which the tropical systems can sustain wind speeds of up to 95 knots (175.94 km/h), corresponding to a Category 2 hurricane. However, there can also be tropical systems with very weak wind speeds, not even reaching 30 knots (55.56 km/h). Because the intensity of storms is so varied in this area, specifically around the Azores Islands, the initial attributed Rmax of the tropical cyclone path also needs to greatly vary. A tropical system with a small Rmax produces much more disastrous effects versus the same tropical system with a much larger Rmax. The Rmax for the ensemble members was set to begin at any random value between 50 and 125 nautical miles (92.6 and 231.5 km). It was then set to increase in random intervals between 0.5 and 1.0 nautical miles (0.93 and 1.85 km). Because of this variation, different classes of tropical systems were expected to be observed.
Last of all, the pressure drop, P
drop, was selected to begin with a random value between 2500 and 6000 Pascal. The subsequent points were then set to decrease in random intervals between 100 and 500 Pascal, while avoiding the pressure drop reaching values below 1000 Pascal. If the P
drop decreased too much, the simulation was set to consider 2200 Pascal as the value instead, and the process would resume from that value. This way, the value attributed at the beginning of the trajectory would be greatly varied, capable of reaching up to 6000 Pascal, but when getting closer to the Portuguese coast the value would never exceed the 2000 Pascal mark. With all these randomized variables, the different tropical cyclone outputs then produced very different water level results, ideal for the purposes of the ensemble of simulations. The randomized parameters, which were qualitatively consistent with the few available historical records, were used to generate storm wind fields according the algorithm implemented in DelftDashboard [
20]. This simplified approach was adopted instead of a sounder storm generation methodology (e.g., [
23,
24]).
Because these natural systems are of such a chaotic nature, nonlinear errors are common and therefore the application of the ensemble of simulations can be of great value. The change in the initial properties of the cyclones can significantly influence the results, so a statistical mean of a set of model forecast can reduce the impact of the initial data uncertainties on the final result. The different outputs should produce significant differences in solutions, whose distribution should match the actual frequency of occurrence.
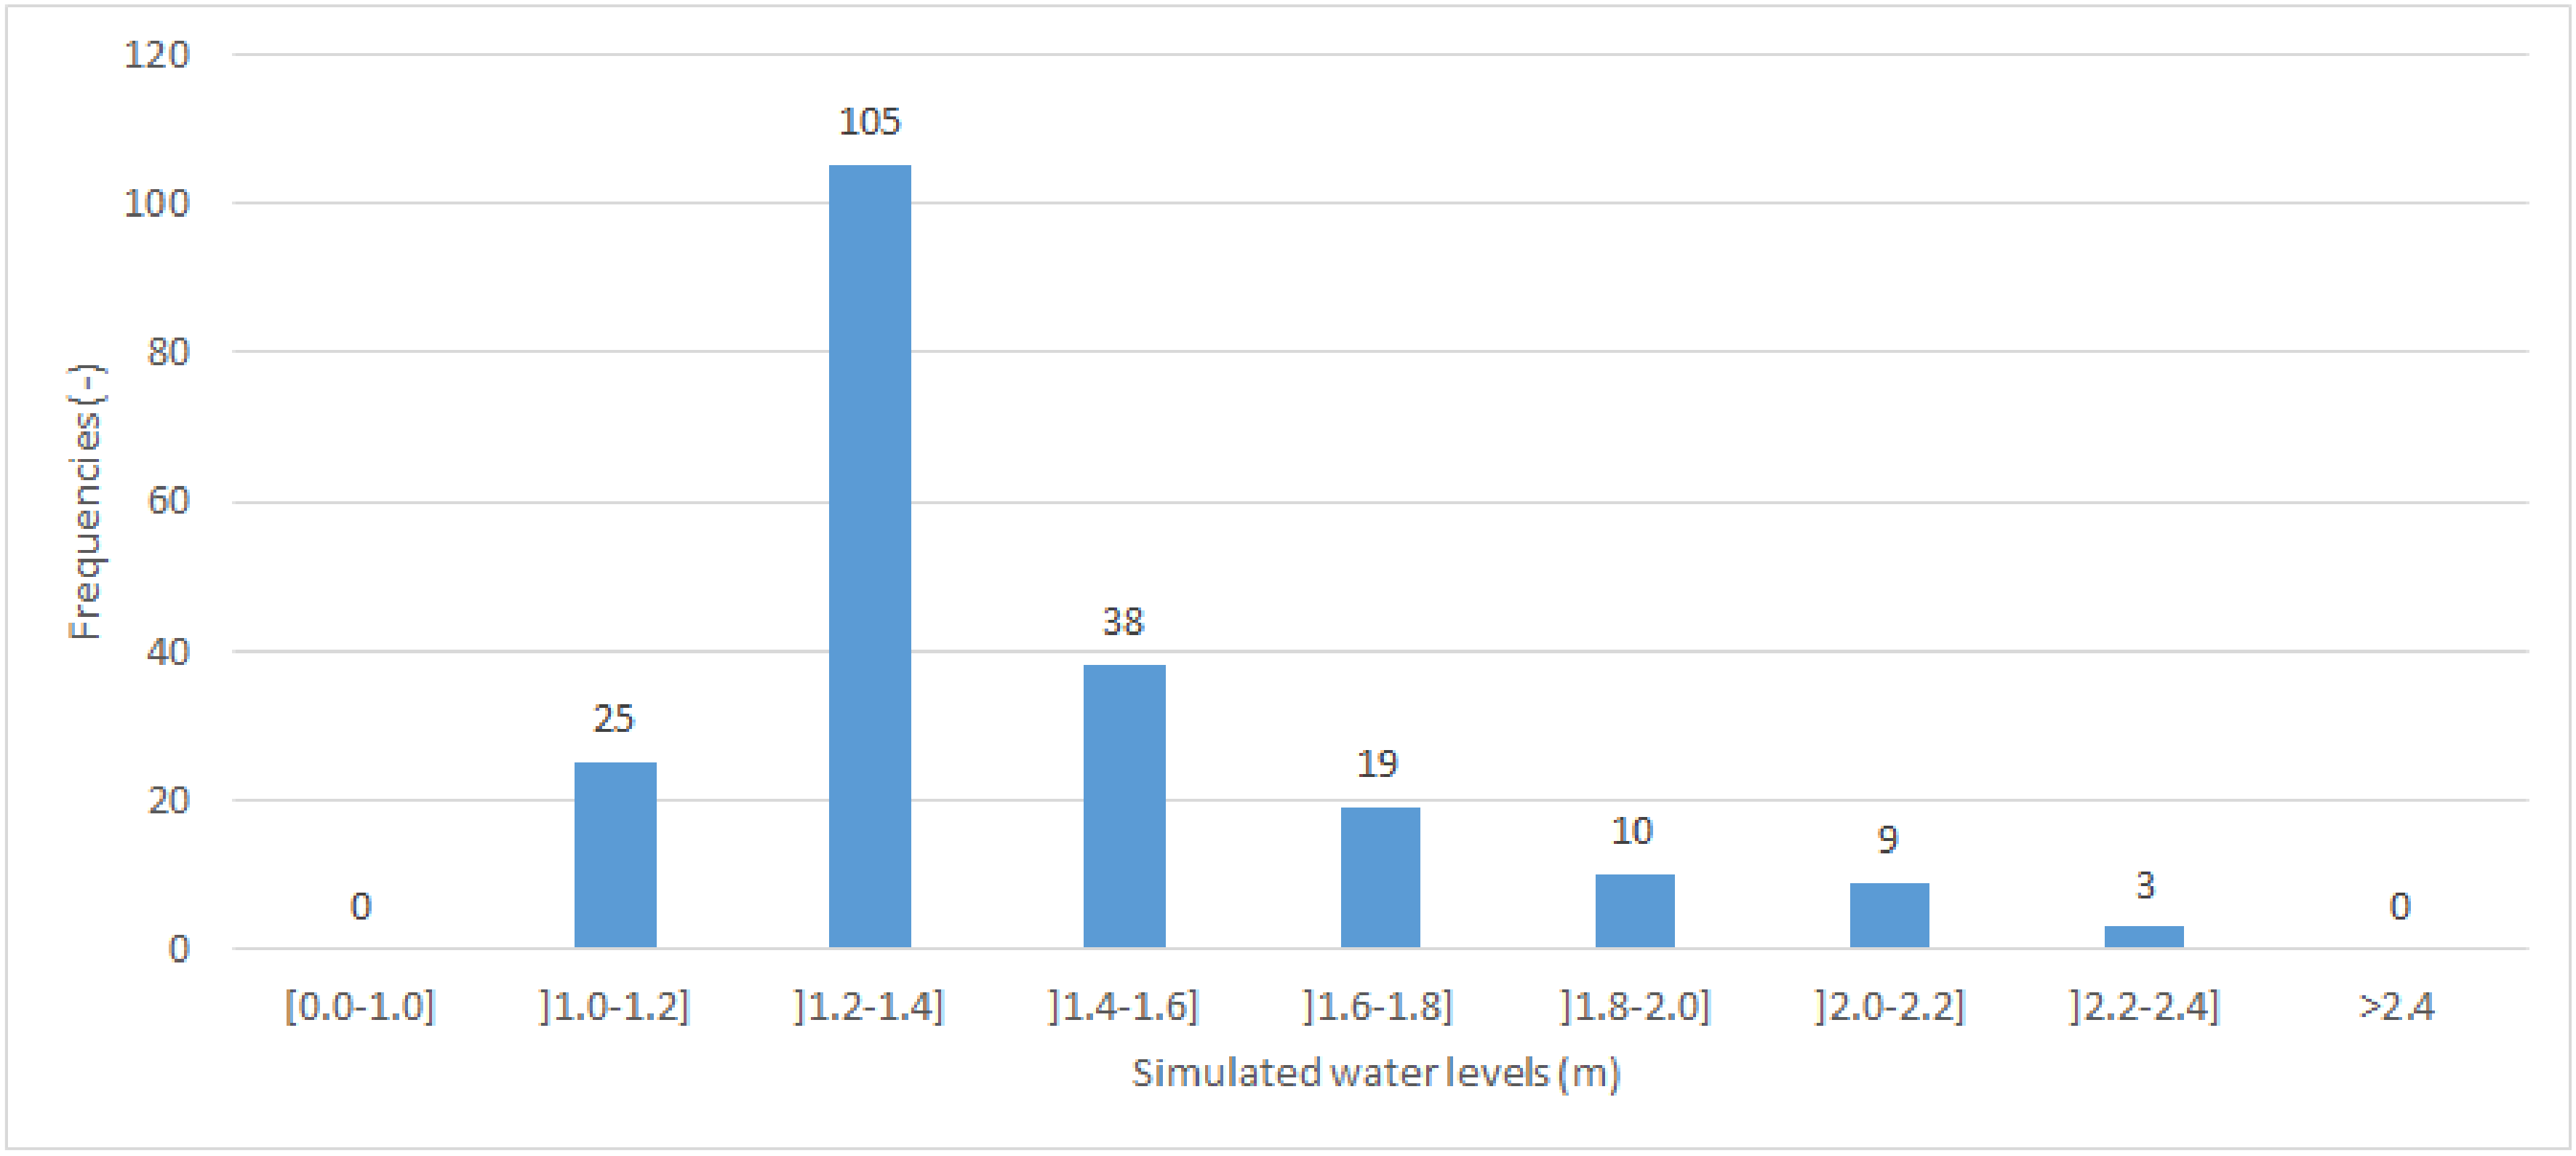
In the following stage, the numerical results are processed and analyzed, and the results of the water surface elevation are assessed in order to examine the envelope of the water level; that is, the maximum storm surge height at predefined locations of the coastal zone for a given storm. This parameter can be easily linked to potential areas that could be affected by wave-overtopping, flooding, and coastal erosion. More precisely, for predefined locations, the Maximum Envelope of Water (MEOW) was obtained for a particular storm of a given category. Afterwards, the Maximum of the MEOWs (MOM) was selected for each storm category, among all the maximum storm surge heights of all simulated storms of the same category [
25]. There is one MOM per storm category for each location; thus, once the maximum envelope of water levels for a given storm category (MOM) is found, it is possible to assess the storm impact for the study area based on this variable. The obtained results are very important in order to predict the potential consequences of future storm events and to produce useful information that could be utilized in the design of emergency plans. In this case study, there was very little hourly tide gauge information available, and any information that was available had no coincident records with historical events storms. Consulting the UHSLC database [
26] there is only one observation station with available quality research data. This station is located in the city of Cascais, Portugal, which is much too far from the area of interest. Because previous applications of DelftDashboard and Delft3D have shown successful results elsewhere (e.g., Gomes et al. work [
14]), following careful consideration these results were also deemed sufficiently accurate. The vulnerability of the region to storminess is assessed based on the simulations of the recreated storms.
2.3. Historical Storms
No historical record of hurricanes was found in this area of interest. In this region, only tropical storms and tropical depressions have tended to hit the coast. Since the chosen area is usually reached by the trailing end of these tropical systems, tropical storms and depressions are more frequent occurrences. Due to the limitations of the DelftDashboard’s wind field generator tool, most of the time, tropical depressions cannot be recreated in this setting. Unlike in the US case study [
14], a couple of the identified tropical depressions were effectively simulated given that a tropical depression can sustain winds of up to 33 knots (61.12 km/h), which is still within the possible parameters for the creation of a storm wind field.
In this location, the tropical systems do not follow a normal pattern, contrary to the case study area on the other side of the Atlantic Ocean. There are tropical systems that proceed more northward affecting England and Ireland, while others curve poleward much earlier in their development and the lean eastward, affecting the Azores Island and consequently traveling towards the Iberian Peninsula.
As shown in
Table 1, in the vicinity of the Portuguese coast, of the 22 identified storms there were 9 identified occurrences of tropical depressions, 11 identified occurrences of tropical storms and only 2 identified occurrences of cyclones (categorized as Category 1). More intense events, particularly tropical cyclones of higher categories, were not registered. Thus, between 1842 and 2016, for the Portuguese territory, a tropical depression had a probability of occurrence of 50.0%, a tropical storm had a probability of 40.9%, and a tropical cyclone had a probability of 9.1%.
