Technical Note

Recent Active Wildland Fires Related to Rossby Wave Breaking (RWB) in Alaska

Arctic Research Center, Hokkaido University, Sapporo 0010021, Japan
Remote Sens. 2025, 17(15), 2719; https://doi.org/10.3390/rs17152719
Submission received: 30 May 2025 / Revised: 31 July 2025 / Accepted: 1 August 2025 / Published: 6 August 2025

Abstract

Wildland fires are a common and destructive natural disaster in Alaska. Recent active fires in Alaska were assessed and analysed for their associated synoptic-scale climatic conditions in this study. Hotspot (HS) data from satellite observations over the past 20 years since 2004 (total number of HS = 300,988) were used to identify active fire-periods, and the occurrence of Rossby wave breaking (RWB) was examined using various weather maps. Analysis results show that there are 13 active fire-periods of which 7 active fire-periods are related to RWB. The total number of HSs during the seven RWB-related fire-periods was 164,422, indicating that about half (54.6%) of the recent fires in Alaska occurred under fire weather conditions related to RWB. During the RWB-related fire-periods, two hotspot peaks with different wind directions occurred. At the first hotspot peak, southwesterly wind blew from high-pressure systems in the Gulf of Alaska. In the second hotspot peak, the Beaufort Sea High (BSH) supplied strong easterly wind into Interior Alaska. It was suggested that changes in wind direction during active fire-period and continuously blowing winds from BSH may affect fire propagation. It is hoped that this study will stimulate further research into active fires related to RWBs in Alaska.

1. Introduction

As temperatures rise due to climate change, extreme events such as heat waves, heavy rains, and droughts are becoming more frequent, leading to increased wildland fires [1]. In particular, in boreal forests where temperatures are rising rapidly, not only will there be an increase in wildland fires, but there are also concerns about mass tree deaths, drying of peatlands, and the ongoing melting of permafrost [1,2]. Extreme wildland fires are becoming more common and increasingly affecting Earth’s climate [3]. Currently, the occurrence of forest wildfires around the world is over 200 thousand per year, with burned areas of 3.5–4.5 million km2 [4]. Global maps of wildfires show large-scale widespread fire zones throughout the world [5].
Active wildland fires in Alaska and northwestern North America have been analysed by many researchers from a variety of perspectives [6]. In Alaska, the boreal forest occupies 32 percent of the total land area (~470,000 km2) and wildland fire is the primary disturbance. High-intensity crown fires are common, and during active fire years, the area burned may be on the order of millions of ha [6]. A continuous trend of increasing burnt area has been observed since around the 1980s [7] with the burned area in 2004 being the largest ever recorded at about 26,700 km2 (~5.7% of the total area of the Alaskan boreal forest), largely surpassing the previous maximum of 20,700 km2 reached in 2015. The average annual burned area since 1939 is about 4300 km2 and the total area burned since 1939 reached about 362,000 km2 [8].
From around 1990, the wildland fire season lengthened by about a month, and active fires became more frequent [8,9]. Extreme wildland fire events in Alaska, i.e., seasons in which more than 4000 km2 have burned, have increased since the 1990s, with the largest area burned and the highest number of extreme events all occurring since 2000 [10,11].
Various aspects of future fire trends have been predicted. Rising temperatures due to climate change threaten to increase the number and scale of fires due to drier fuels [12,13,14] and increased ignition by lightning [15,16,17]. Actually, Canada’s record-shattering 2023 wildland fire occurred from late April to early November [18]. Studies have been carried out on the relationship between various indicators such as El Nino Southern Oscillation (ENSO) and Pacific Decadal Oscillation (PDO) and fire [17,18,19,20,21,22], and predictions have been made from analysis results [23,24,25,26].
Papers on wildland fire and blocking phenomena include the following: The extensive 2004 fires might have been related to a persistent blocking ridge over Alaska [27,28]. Moreover, 500 hPa height anomalies were well correlated with seasonal burnt area over large regions of Canada and Alaska [29,30]. In North America, the area burned in the boreal forests depended on the frequency of blocking high-pressure systems in the mid-troposphere causing rapid fuel drying [31]. The persistence of blocking ridges in the upper atmosphere is also projected to increase under a doubled carbon dioxide future scenario [31].
Rossby waves naturally occur in rotating fluids largely due to the Earth’s rotation. [32]. Large-scale waves with wavelengths of several thousand kilometres, propagating westwards through the atmosphere and oceans. Within the Earth’s ocean and atmosphere, these planetary waves play a significant role in shaping weather associated with meridional flow of the Jet Stream [33]. During the Canadian wildland fire episode in 2023, the dispersion of Rossby waves led to the long-lasting dominance of high-pressure systems and the consequent warming through anomalous subsidence [34]. Recent active fires in southern Australia were associated with extreme cold fronts, which were associated with propagating Rossby waves [35]. In south-eastern Australian, during the 2004 and 2009 heatwaves in south-eastern Australia (SEA), transient and fast-moving Rossby waves organized in wave packets recurring in the same phase to form a ridge over SEA, thereby contributing to the persistence of the heatwave conditions [36]. The 2009 heatwave resulted in devastating fires (Black Saturday, 7 February) [37].
Rossby wave breaking (RWB) events will strongly influence large-scale circulation and are also related to weather extremes such as heat waves, blocking, and extreme precipitation events. Nonetheless, a complete understanding of the synoptic-scale dynamics involved with the breaking events is still absent [38]. The RWB phenomenon and the Western Pacific Teleconnection (WP) in winter were closely associated with variations in the nature of the RWB [39]. The forest fire and rainfall in Siberia in 2019 were strongly associated with wave breaking and the life cycle of blocking highs in the northern part of Siberia [40]. The highly unusual weather event, possibly RWB-related, affected Western North America in September 2020 [41].
Wind is a major factor influencing wildland fire behavior and spread; strong winds can dramatically increase the speed and intensity of fires, spreading them over large areas and making them more difficult to contain. Changes in wind direction can trigger large fires, depending on fuel distribution [42]. In south-eastern Australian, the most catastrophic fires in recent history have been associated with extreme cold fronts [35]. In Alaska, the wind direction changed from westerly to easterly during the very active wildland fire-periods of 2004 and 2005 associated with the Rossby wave breaking (RWB) event [43,44]. In addition, strong winds from the Beaufort Sea High (BSH) [45,46] blew during three active fire-periods in 2004 and 2005. The winds blowing into Alaska from the Arctic were continuous or had no diurnal variation [43,44]. Analysis of RWB- and BSH-related fires in Alaska and BSH has been almost non-existent in the literature since 2016.
In this study, we focus on uncertain atmospheric drivers under recent climate change that will generate Rossby wave breaking (RWB) as a result of large jet stream meandering (JSM). Hotspot (HS) data from satellite observations were used to identify active fire-periods and their synoptic-scale weather conditions were analyzed using middle- and near-surface-level atmospheric reanalysis data. Analysis was conducted mainly on the contribution of RWB-related fires to all fires in Alaska, the frequency of RWB-related fires, atmospheric pressure at mid-levels, and wind at low-levels.

2. Materials and Methods

2.1. Study Area

The study area is shown in Figure 1 and called “central Alaska” in this paper. Central Alaska is located in the most northwestern part of the North American continent. Satellite imagery is a useful tool to verify the occurrence of concurrent widespread wildland fires in Alaska and was used to observe concurrent widespread forest fires and determine the wind directions of several fire plumes (smoke) from specific Alaska wildland fires as shown in Figure 1.

2.2. Analysis Methods and Procedures

In this paper, 1. Active fire-periods are determined using 20 years of satellite daily hotspot (HS) data. 2. Synoptic-scale fire weather conditions during the active fire-period are analysed using atmospheric reanalysis data at middle-level (500 hPa), lower-level (925 hPa), and ground level. 3. NASA Worldview images are used to grasp fire distribution and to confirm wind direction by the flow of smoke (haze) from fires.

2.2.1. Active Fire-Period

Wildland fire activities in central Alaska are analysed using 20 years of hotspot (HS) data from 2004 to 2023 detected by the moderate resolution imaging spectroradiometer (MODIS) on the Terra and Aqua satellites. MODIS HS data are obtained from the NASA Fire Information for Resource Management System [47]. We analysed HSs in the main area of Alaska (59–72° N, 140–167° W). Using 20 years of daily satellite HS data, active fire-periods are determined.

2.2.2. Synoptic-Scale Fire Weather Conditions

We analyse various synoptic-scale weather maps to find fire weather conditions during active fire-period. Various synoptic-scale weather maps, such as pressure, wind, and temperature at various air levels (200, 500, 925 hPa, and 10 m), are obtained from two weather web sites:
(1)
Eight-times daily data [48].
(2)
Four-times daily data [49].
We use satellite imagery to determine the distribution and wind direction of the main wildland fires. True colour images of MODIS on Terra and Aqua from WORLDVIEW [50] by NASA are used to identify active fire areas and determine wind direction by fire plumes (smoke) from wildland fires as shown in Figure 1.

3. Results

3.1. Rossby Wave Breaking (RWB)

Synoptic-scale weather conditions of middle-level (500 hPa) and lower-level (1000 hPa, near ground level) are analysed to explain fire activities in Alaska and to identify weather phenomena related to RWB [43,51]. Three major weather phenomena related to RWB observed both at upper and lower levels are:
(1)
Large jet stream meanderings (JSM) resulting in local easterly wind flow at middle-level.
(2)
Blocking high-pressure systems such as the rex block, ridge, and Ω at middle-level.
(3)
Movement of high-pressure systems at near-surface level.
The occurrence of RWB was confirmed by checking these three phenomena ((1)–(3)) on various weather charts.
Related to (3), the wind direction changes mostly from west to east with the movement of high-pressure systems, which confirms the wind direction change previously reported during three active fire-periods in Alaska (the June and August fires in 2004 and the August fires in 2005) [43,44].

3.2. Fire Trend

3.2.1. Daily Fire Trends

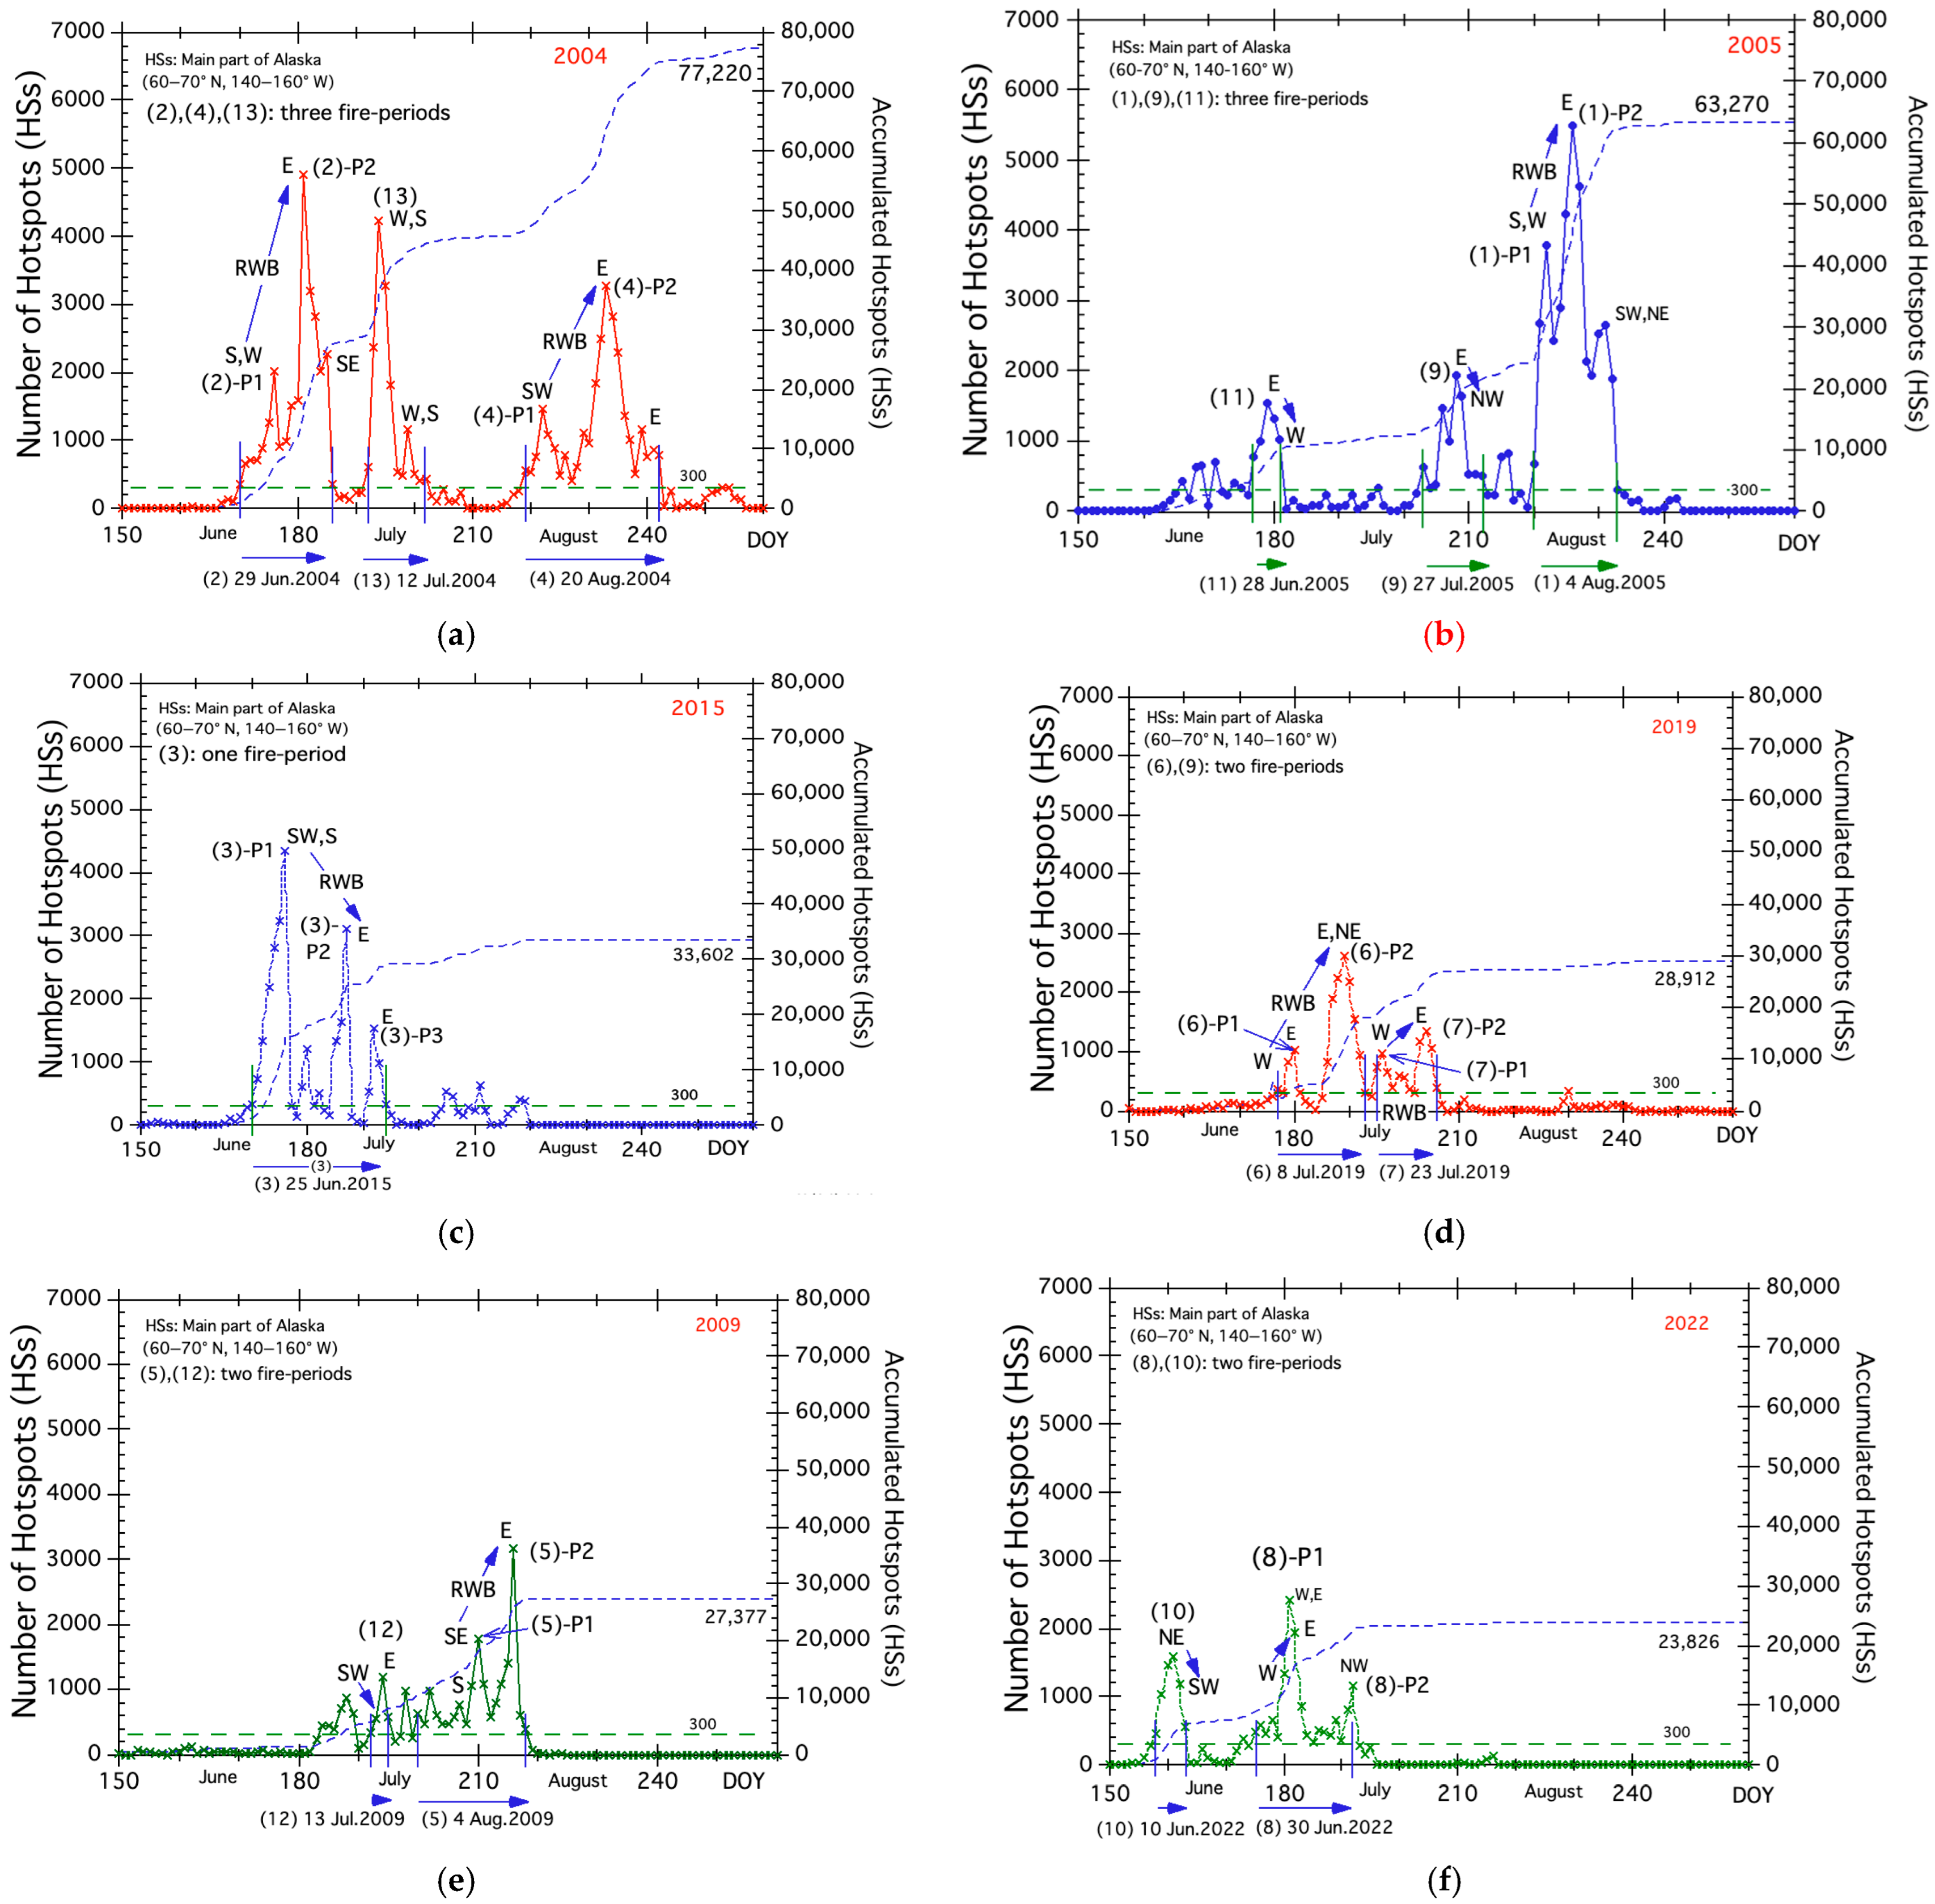
The number of daily hotspots (HSs) is used to identify active fire-periods. The definition of periods of high fire activity is defined here as the consecutive fire days when the number of daily hotspots is greater than 300 [43]. From daily fire occurrence trends in six active fire years in Figure 2, 13 active fire-periods are defined.
The 13 active fire-periods are ranked by the number of hotspots at the peak of each fire and are named by their ranking, including the date, month, and year they occurred (e.g., “(1) 4 Aug.2005”, “(2) 29 Jun.2004” and so on). Major fire peaks are marked P1, P2, P3… and appended. The major peaks during the 13 active fire-periods were denoted by a combination of rank and peak name, e.g., (1)-P1 or (2)-P2. Major fire peaks are labelled with the wind direction at the 10 m level, such as W, E, and so on.
In 2004 and 2005, three active fire-periods occurred, respectively, as shown in Figure 2a,b. The total number of HSs in 2004 reached 77,220, the largest in the study period. There were three active fire-periods ((2), (4), and (13)). The number of HSs of each of the 3 fire peaks exceeded 3000, of which the June and August peaks during (2) and (4) were related to RWB. The wind directions at the 10 m level during both fire-periods ((2) and (4)) changed from southwesterly to easterly (see wind directions of (2)-P1, (2)-P2, (4)-P1, and (4)-P2 in Figure 2a).
In 2005, the total number of HSs was 63,270, the second largest in the study period. There were three active fire-periods ((1), (9), and (11)) as shown in Figure 2b. The peak number of HSs in August was 5490 (the highest in the study period) and occurred related to RWB. The wind directions changed from south and westerly ((1)-P1)) to easterly ((1)-P2)).
In 2015, the total number of HSs was 33,602, and there was one active fire-period ((3)) with three fire peaks occurring from the middle of June related to RWB, as shown in Figure 2c. The wind directions changed from southwesterly and southerly ((3)-P1)) to easterly ((3)-P2)) and remained as easterly at (3)-P3.
In 2019, the total number of HSs was 28,912, and two active fire-periods ((6) and (7)) occurred as shown in Figure 2d. An active fire-period ((6)) in July occurred related to RWB, and the wind directions changed from westerly ((6)-P1)) to easterly ((6)-P2)). In late July, an active fire-period ((7)) related to RWB occurred, and the wind direction changed from westerly ((7)-P1) to easterly ((7)-P2).
In 2009, the total number of HSs was 27,377, and two active fire-periods ((5) and (12)) occurred as shown in Figure 2e. An active fire-period ((5)) in the top of August occurred related to RWB, and the wind directions changed from southeasterly ((5)-P1)) to easterly ((5)-P2)).
In 2022, the total number of HSs was 23,826, and two active fire-periods ((8) and (10)) occurred as shown in Figure 2f. During the active fire-period ((8)), the wind direction changed from westerly and easterly ((8)-P1)) to northwesterly ((8)-P2)). Since there were no easterly winds, this fire-period (8) was not related to the RWB.

3.2.2. Classification of Active Fire-Periods

The 13 active fire-periods in Figure 2 were classified into three categories based on whether or not there was a change in wind direction from primarily southwest to east. This classification is based on the results of our paper on the fires in Alaska [43]. Seven fire-periods with wind direction changes related to RWB are summarised in Table 1.
From Table 1, we can see that the seven active fire-periods related to RWB lasted for about 2–3 weeks (12–25 days), each with two fire (HS) peaks. With the exception of one fire-period ((3) 25 Jun. 2015), the number of HSs of the second fire peak (P2) is greater than that in the first fire peak (P1). The difference in HS numbers between P1 and P2 is thought to be mainly due to changes in wind direction and strong winds from the Beaufort Sea High (BSH), so Table 1 shows the wind direction and the presence or absence of BSH. Continuous strong wind from the Beaufort High actually activated the fires ((1) P2, (2) P2, and (4) P2) in 2004 and 2005 [43,44].
The height (atmospheric pressure) over Central Alaska is 5880 m at its highest and 5610 m at its lowest, a significant difference of 270 m. This large difference suggests that there are two types of fires related to RWB: high-pressure type and low-pressure type. High-pressure-type active fires have occurred at altitudes above 5800 m, such as (1) P1 in 2005 and (4) P1 in 2004. Low-pressure-type active fires have occurred at altitudes below 5700 m, such as (3) P1 in 2015 and (7) P1 in 2019. Note that the average values of P1 and P2 were 5757 m and 5786 m, respectively, which means that most RWB-related fires are high-pressure type fires. In particular, the average value of P2 is about 30 m higher than that of P1, which may be one of the reasons why P2 has a larger HS number.
The total number of HSs of seven active fire-periods related to RWB in Table 1 is 164,422. The total number of HS over the past 20 years is 300,988, which means that about half (54.6%) of the fires in Alaska were related to RWBs.
The remaining six fire-periods are summarised in Table 2. Wind direction changed during five fire-periods from “(8) 30 Jun.2022” to “(12) 13 Jul.2009” in Table 2. However, the wind direction did not change from southwest to east during those fire-periods, so they are classified as fire-periods unrelated to the RWB. Wind direction during one active fire-period “(13) 12 Jun.2004” in the bottom of Table 2 is mostly constant.
As the total number of HSs during the 13 active fire-periods is 218,169 (sum of 164,422 and 53,747), and the selected 13 active fire-periods cover about three-quarters (72.5%) of the total HSs of the study period (300,988).
A simple comparison of height and temperature values in Table 1 and Table 2 shows the fire weather conditions related to RWB. Heights at 500 hPa in Table 2 vary from 5640 to 5780 m, and the average value is 5693 m. The three fires with heights below 5700 m, (9), (11), and (13), can be considered low-pressure-type fires.
Temperatures at 925 hPa in Table 1 vary from 288° to 294° K, and the average value is 292.4° K. Temperatures at 925 hPa in Table 2 vary from 287° to 291° K, and the average value is 289.0° K. The average temperature difference of 3.4° K suggests RWB occurred under relatively warm air conditions.

3.2.3. Annual Fire Trends and Standard Deviation

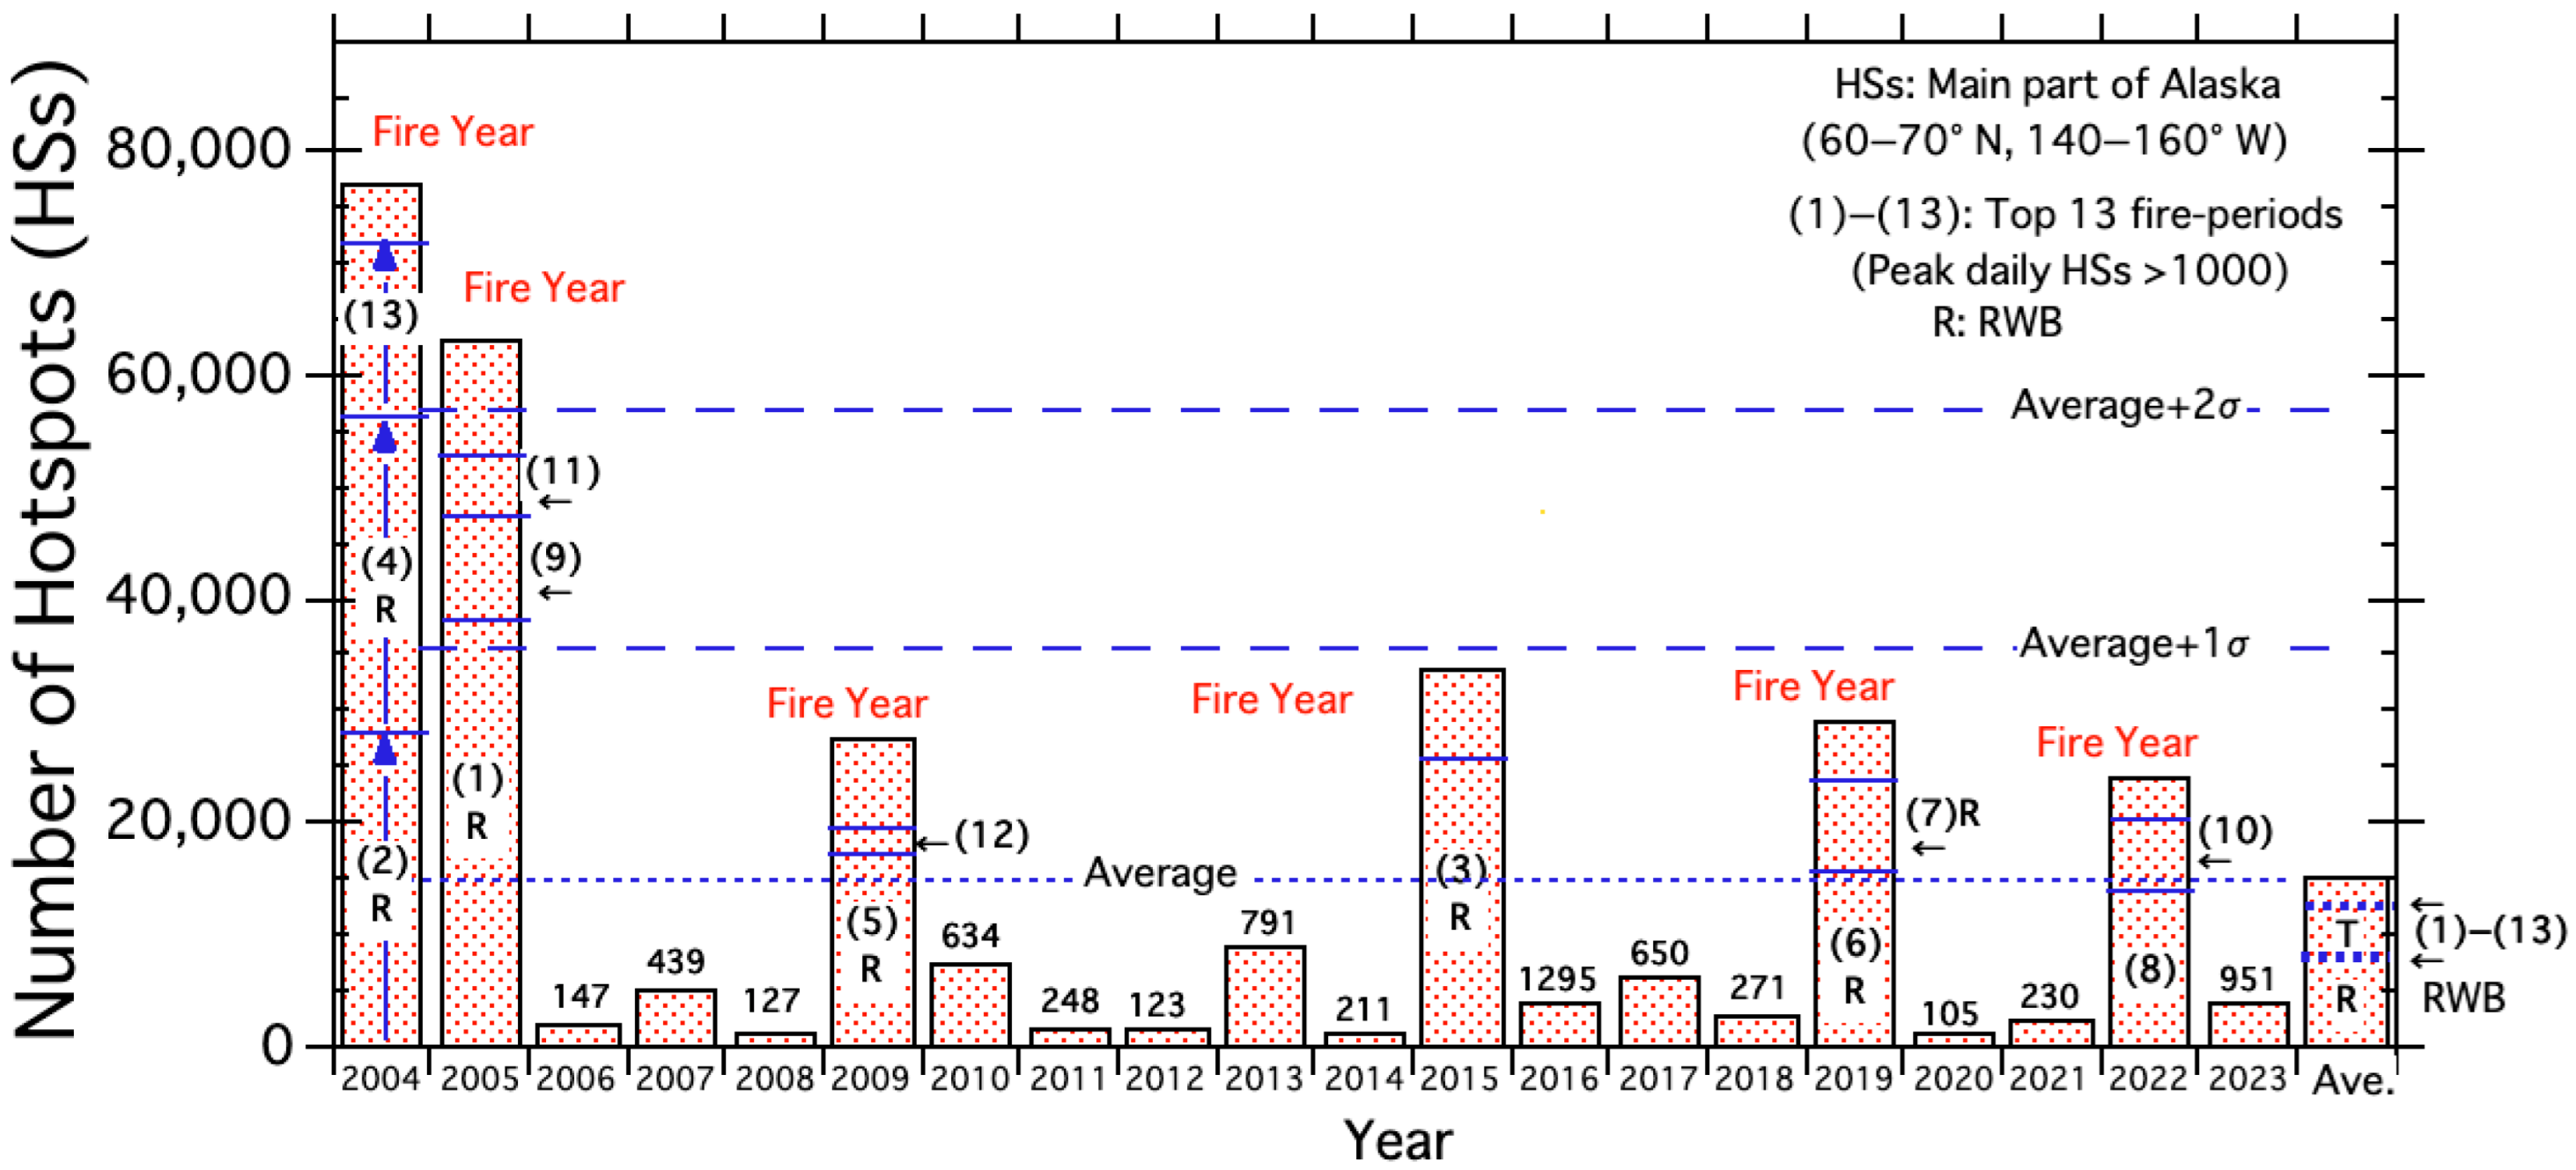
Figure 3 is prepared to illustrate the contribution of the 13 active fire-periods and fires related to RWB in Alaska. Figure 3 shows the annual fire history during the 20 years from 2004 to 2023 using MODIS daily hotspots data. The total number of daily HSs of the past 20 year was 300,988. The average number of HSs per year is 15,049, as shown in the rightmost bar graph in Figure 3. There are six active fire years (2004, 2005, 2009, 2015, 2019, and 2022) where HS numbers exceed the average value. We call those years “fire year” when HS numbers exceeded the average value in this paper. The number of hotspots (HSs) outside of six fire years was smaller, with the largest being 791 in 2013.
Figure 3 shows all 13 active fire-periods occur only in six fire years. The contribution of each active fire-period in each fire year is shown using (1) through (13), which are short names of 13 active fire-periods. It can be seen that most of the fires occurred during active fire-periods. For example, the total number of HSs in 2004 was 77,220, and the total number of HSs during the three fire-periods was 71,922, with 93.2% of fires occurring during three fire-periods of (2), (4), and (13).
Active fire-periods related to RWB are shown by “R”, which is put after the short name of active fire-periods such as “(1)R”. The total number of HSs of seven active fire-periods related to RWB is 164,422. As the total number of HSs is 300,988, approximately half of fires (54.6%) occurred related to RWB in Alaska. This suggests fire weather conditions during active fire-periods related to RWB need to be better defined. The total number of HS during the 13 active fire-periods is 218,16, so the active fire-periods selected cover about three quarters (72.5%) of the total number of HS (300,988) over the study period.
Figure 3 shows the results of the statistical analysis. Standard deviations for seven fire years are +3.65σ (2004), +2.99σ (2005), +1.29σ (2009), +1.59σ (2015), +1.37σ (2019), and +1.13σ (2022). Of note is the standard deviation of fires related to RWBs in 2004 and 2005. Standard deviations for RWBs ((2R) + (4R)) in 2004 and (1R) in 2005 are about 2σ and 1σ, respectively. From these high standard deviations, we may say the 2004 and 2005 fires related to RWBs were extreme events.

3.3. Weather Conditions Related to RWB

3.3.1. Conditions in the First HS Peak (P1)

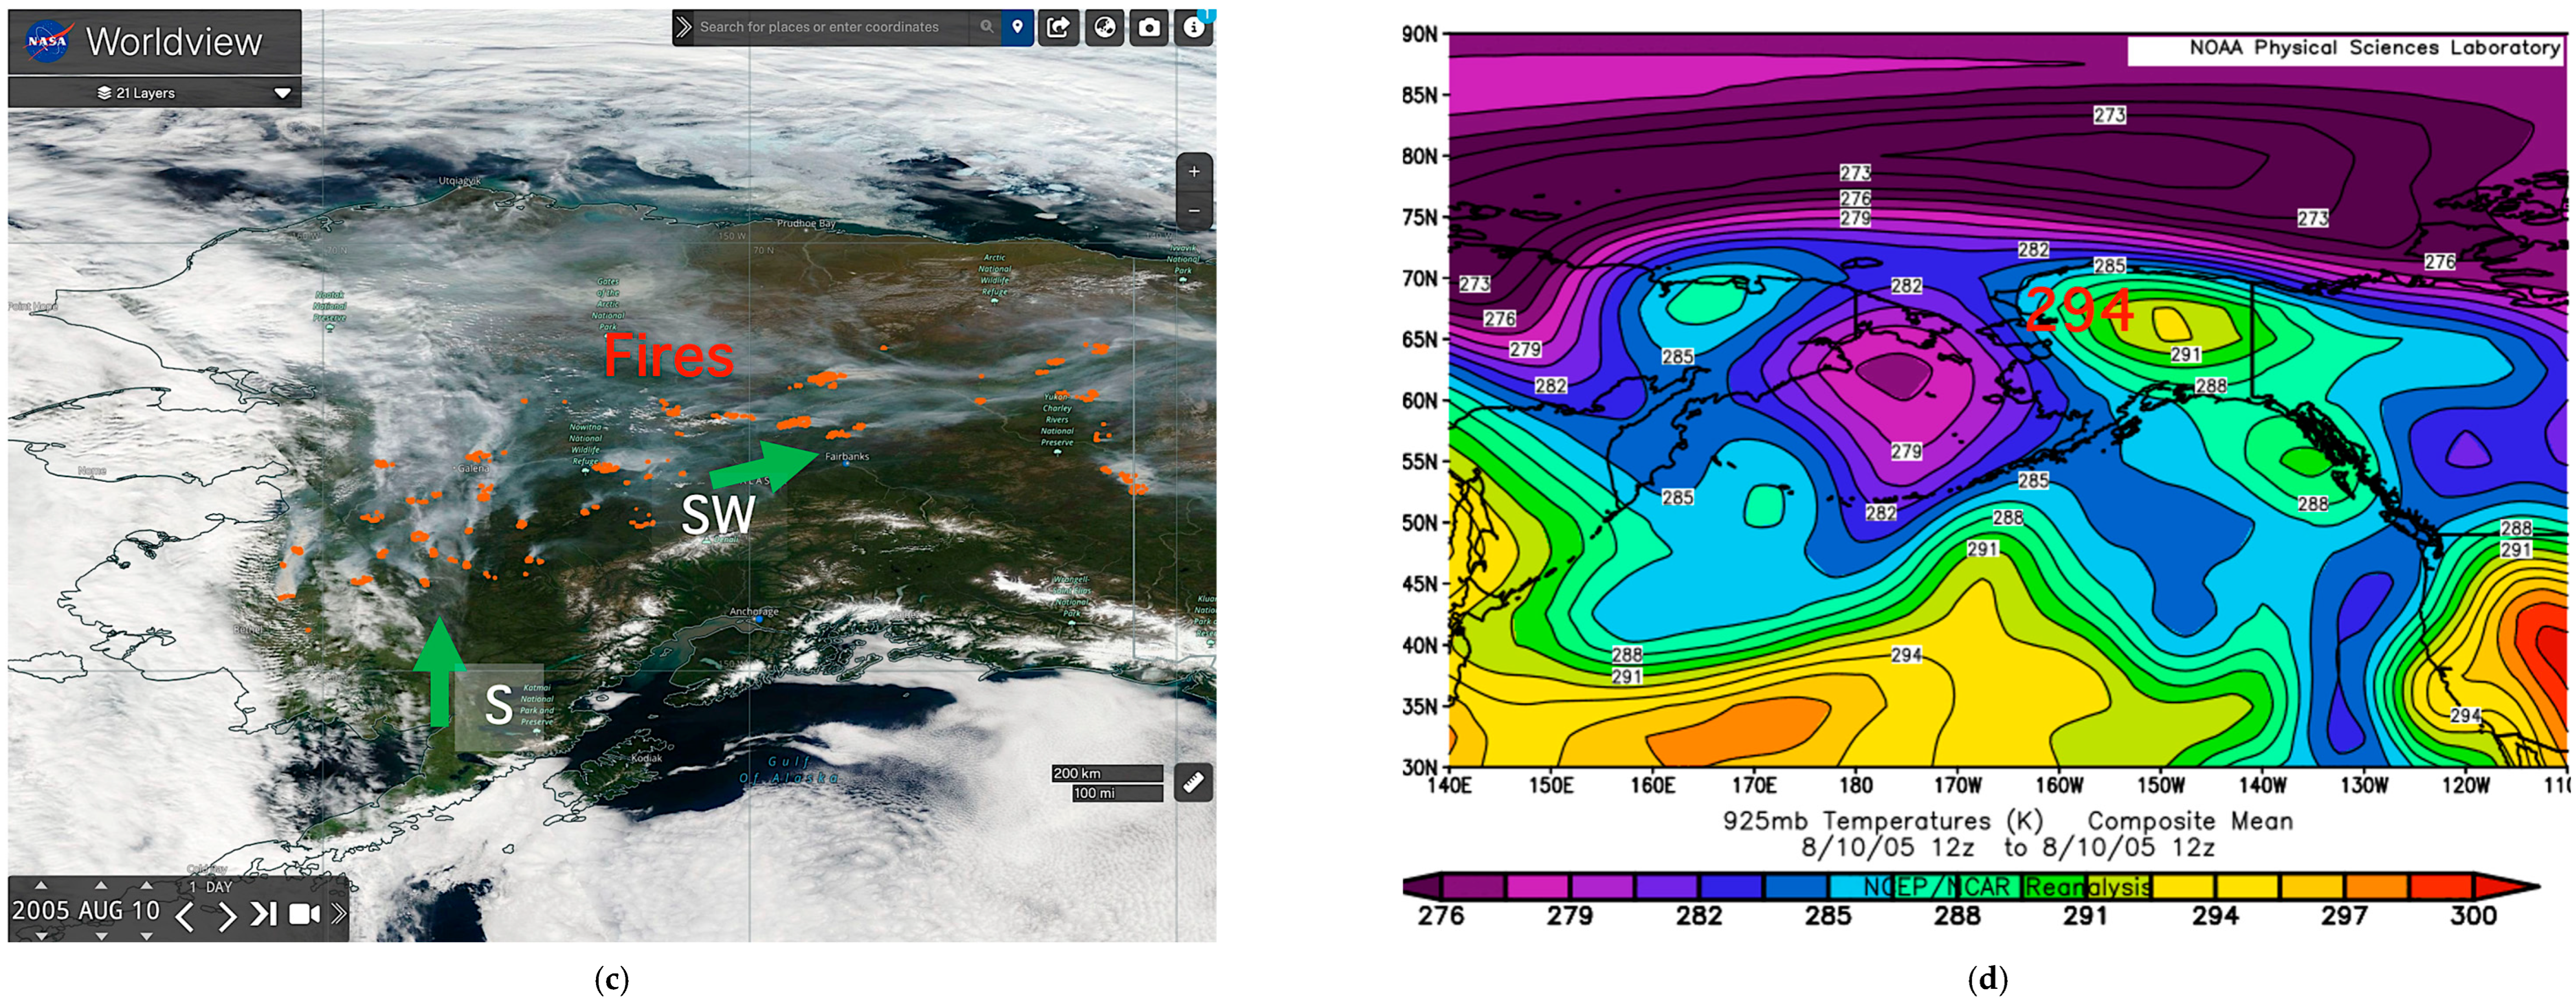
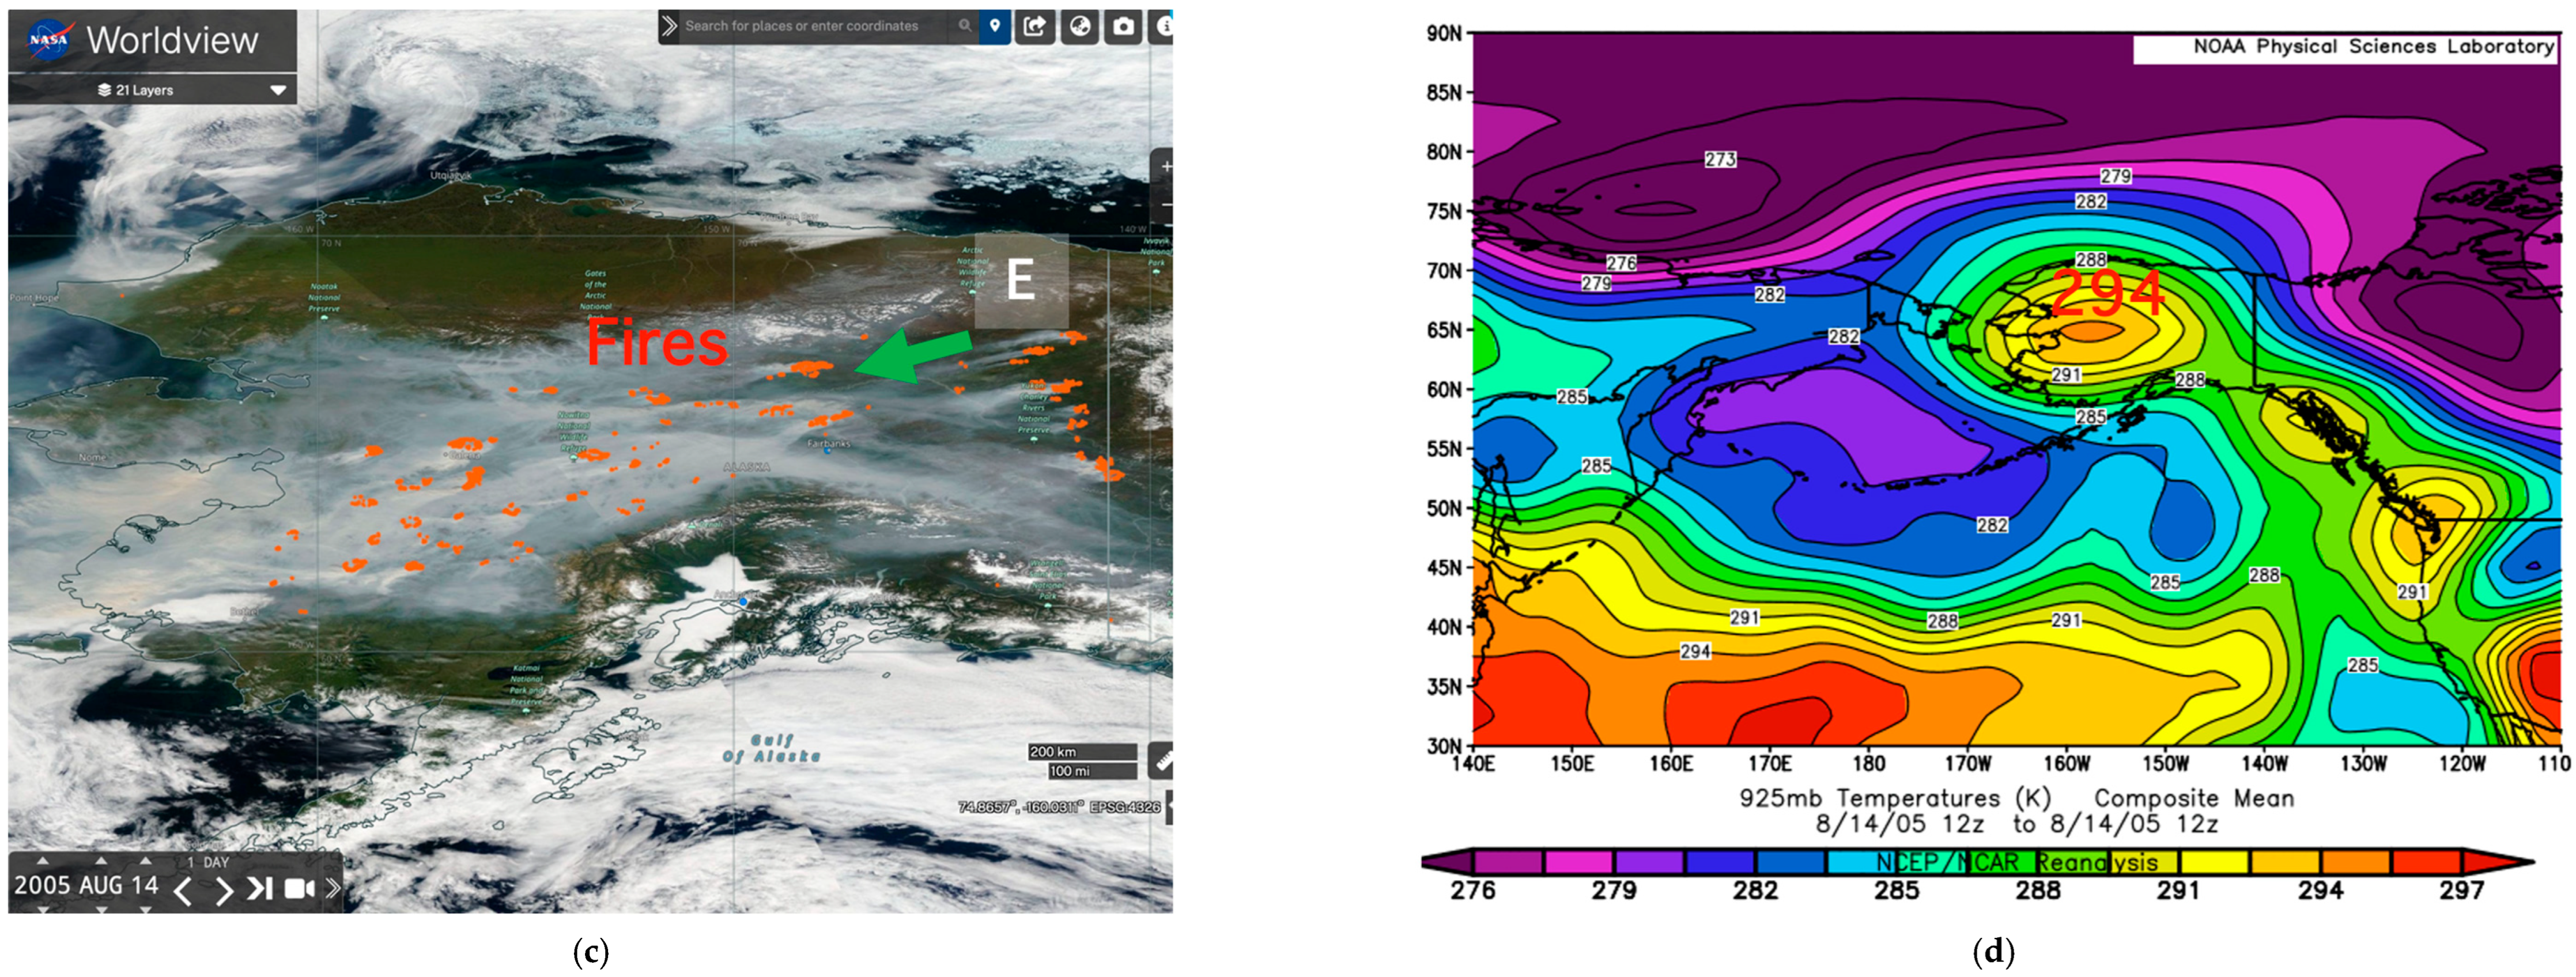
Figure 4 shows the various fire weather conditions and fire distribution on 10 August 2005, the first fire peak ((1) P1) of the fire-period “(1) 14 Aug.2005”. Figure 4a shows a weather map at 500 hPa. We could find Rex blocking (H5900 and L5560), large jet stream meandering shown by the red isoline of 5640 m, local easterly wind flow at the 10 m level, and an estimated height of 5880 m over central Alaska. Figure 4b is a 10 m wind map and shows major wind flow and high- and low-pressure systems. High-pressure systems (H1031) over the Gulf of Alaska supply southerly wind into southwestern Alaska, and local low-pressure systems (L1023 and L2020) moved from south to northeast. Wind direction over central Alaska is southerly in western Alaska and westerly in central Alaska. Under these wind conditions, fires became active, like the satellite image shown in Figure 4c. Figure 4d is a temperature map at the 925 hPa level and shows warm air masses covering central Alaska. We call warm air masses continental temperate (cTe) [53] in this paper. The highest temperature is 294 K. The main conditions mentioned above are summarised in Table 1.
Weather maps and satellite images for the remaining active fire-periods from (2) to (7) are shown in Supplementary Material (Figures S1-1, S2-1, S3-1, S4-1, S5-1 and S6-1). Their main conditions are summarised in Table 1.

3.3.2. Conditions in the Second HS Peak (P2)

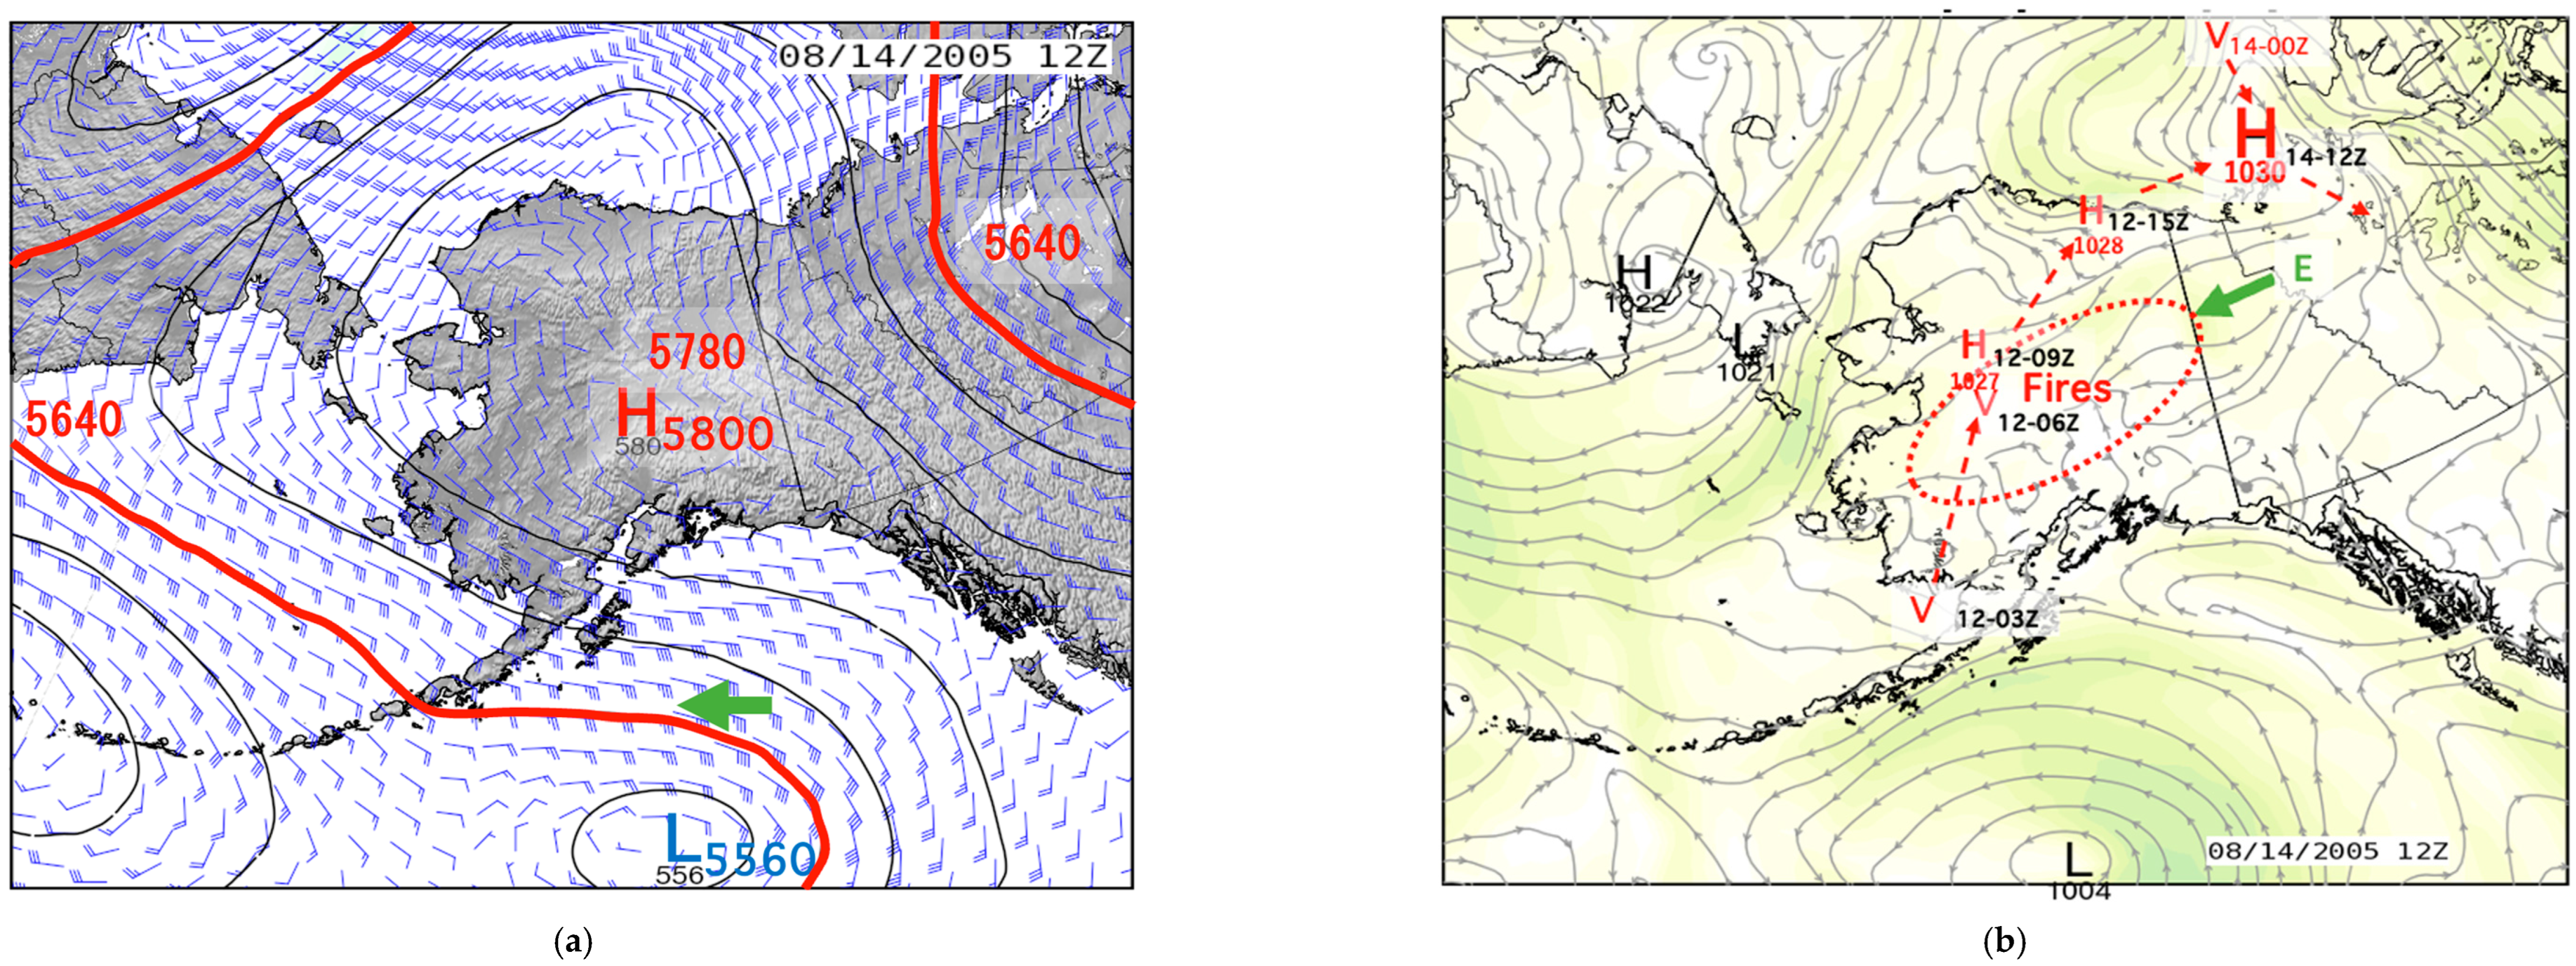
Figure 5 shows the various conditions on 14 August 2005, the second fire (HS) peak ((1) P2) of the fire-period “(1) 14 Aug.2005”. Figure 5a shows weather conditions at 500 hPa. We could find Rex blocking (H5800 and L5560), large jet stream meandering shown by the red isoline of 5640 m, local easterly wind flow, and an estimated height of 5780 m over central Alaska. Figure 5b is a 10 m wind map and shows major wind flow and high-pressure systems (H1030) in the Beaufort Sea, which moved from the south. Movement of high-type vortex and high-pressure systems from southwest Alaska to the Beaufort Sea is shown by a red dotted line with arrows. Hourly weather data (wind speed and direction, temperature, and relative humidity) measured at Caribou Peak, located 40 km north-east of Fairbanks, showed that a continuous strong easterly wind (average wind speed: about 7 ms−1 without a large diurnal range) from the Beaufort Sea High (BSH) blew for about 36 h from the evening before the HS peak day [45]. Fires become active, like shown in the satellite image in Figure 5c, and make the second fire (HS) peak ((1) P2). The temperature map in Figure 5d shows warm air masses covering central Alaska. The highest temperature is 294 K. The main conditions mentioned above are summarised in Table 1.
Weather maps and satellite images for the remaining active fire-periods from (2) to (7) are shown in Supplementary Material (Figures S1-2, S2-2, S3-2, S4-2, S5-2 and S6-2). Their main conditions are summarised in Table 1.

4. Discussion

This paper reported that many of Alaska’s wildland fires occur under fire weather conditions related to Rossby Wave Breaking (RWB). We already reported active fires in 2004 and 2005 occurred related to RWB. However, there are few research reports on weather conditions during RWB-related fires and the frequency of RWBs. Therefore, in this study, we used hotspot (HS) data (total number of HSs = 300,988) from satellite observations over the past 20 years since 2004 to extract active fire-periods and examined the fire weather during those periods using various weather maps.
Major analysis results are summarized in the below.
Contribution of RWBs to all fires in Alaska:
Analysis results show that there are 13 active fire-periods of which seven active fire-periods are related to RWB. The total number of HSs during the seven RWB-related fire-periods was 164,422, indicating that about half (54.6%) of the recent fires in Alaska occurred under fire weather conditions related to RWB.
The frequency of RWB-related fires:
The frequency of fires associated with RWBs was about once every three years (2.86 = 20 years/7 fire-periods) on a simple average calculation. From Figure 3, it can be seen that the intervals between fire years related to RWBs are 3 years, 5 years, and 3 years from 2005 to 2019, respectively, which indicates that the occurrence frequency is not so low. However, to determine the frequency of occurrence, a long-term analysis looking back at past fires is needed.
Height (atmospheric pressure) over Central Alaska:
Table 1 shows the height at 500 hpa varied from 5880 m at its highest to 5610 m at its lowest; there was a significant difference of 270 m. This large difference suggests that there are two types of fires related to RWB: high-pressure type and low-pressure type. High-pressure-type active fires have occurred at altitudes above 5800 m, such as (1) P1 in 2005 and (4) P1 in 2004. Low-pressure-type active fires have occurred at altitudes below 5700 m, such as (3) P1 in 2015 and (7) P1 in 2019. These two types of RWB have also been observed in the northern regions of Eastern Siberia [40].
Type of blocking and its position:
Three types of blocking (Rex and Ω-blocking, ridge [52]) were formed over Alaska (see Table 1 and Figure 4a and Figure 5a, Supplementary Figures S1-1a, S1-2a, S2-1a, S2-2a, S3-1a, S3-2a, S4-1a, S4-2a, S5-1a, S5-2a, S6-1a and S6-2a). Under this blocking, strong wind conditions were made and movement of the high-pressure system occurred. Western North America was impacted by a highly anomalous meteorological event related to RWB [41]. Their Rex blocking occurred over the eastern Pacific Ocean, far from the North American land area. In comparison, the downward warm and dry flows from high-pressure systems over Alaska may intensify the combustion process and favor the fire propagation.
The role of wind (direction change):
Fires tend to become more active with changes in wind direction and faster wind speeds. Fire activation due to changes in wind direction is a well-known tendency at fire sites [42] and is well documented in fire cases associated with the passage of a cold front [35]. This paper showed that different wind directions were blowing on the two HS peak days. Wind direction of the 7 fire-periods changed from westerly to easterly (see Table 1 and Figure 4b,c and Figure 5b,c, Supplementary Figures S1-1b,c, S1-2b,c, S2-1b,c, S2-2b,c, S3-1b,c, S3-2b,c, S4-1b,c, S4-2b,c, S5-1b,c, S5-2b,c, S6-1b,c and S6-2b,c).
The role of wind (wind speed):
Strong winds at P1 and P2 of the seven fire-periods, the easterly winds at P2 were from the Beaufort Sea High (BSH). The distinctive feature of this wind is that it blows continuously day and night. With strong winds from BSH, the number of HSs in P2 was larger than in P1, with one exception ((3) 25 June.2015, see Table 1 and Figure 5b). The duration times of wind speeds of 5 ms−1 or more of three fire-periods ((1)14 Aug,2005, (2)29 Jun.2004, and (4)20 Aug.2004)) were about 36 h, about 60 h, and about 60 h, respectively. Their average wind speeds were from 6 to 7 ms−1.

5. Conclusions

This study focused on synoptic-scale fire weather conditions during 13 active fire-periods in Alaska over the two decades since 2004. In particular, the analysis focused on 7 active fire-periods related to Rossby waves breaking (RWB). The analysis results showed the contribution of RWB-related fires to all fires in Alaska, the frequency of RWB-related fires, the relationship between mid-level air pressure and fire, and the effect of low-level winds on fire.
The major results are summarized as follows:
(1)
The contribution of RWBs to all fires in Alaska is significant, with about half (54.6%) of recent fires in Alaska occurring under RWB-related fire weather conditions.
(2)
The frequency of fires related to RWBs was about once every three years (2.86 = 20 years/7 fire-periods) on a simple average calculation.
(3)
The average height (atmospheric pressure) values over Alaska of active fire peaks of P1 and P2 at middle-level (500 hPa) were 5757 and 5786 m, respectively. The downward dry and warm flows from high-pressure systems could activate the fires.
(4)
The change in wind direction during the RWB-related fires is thought to be one of the factors that contributed to the spread of the fire.
(5)
Strong winds blowing day and night from the Beaufort Sea High (BSH) will be the most important factor, as they may intensify the combustion process and favor the fire propagation.
Finally, this paper reported that active fires related to RWBs occur every few years. Based on the results of this study, it is expected that further research will be conducted to clarify the relationship between lightning, rainfall, fuel, etc., and RWB-related fires.

Supplementary Materials

The following supporting information can be downloaded at: https://hhaya05.wixsite.com/photographers-portfo/blank-cee5. Supplement pdf contains Figures for 3.3. Weather Conditions Related to RWB.

Funding

This research received no external funding.

Acknowledgments

We would like to thank the following Earth Data websites: (1) Fire Information for Resource Management System (FIRMS), NASA, for fire (Hotspot) data (MODIS Collection 6.1.). (2) MERRA (Modern-Era Retrospective Analysis for Research and Applications, NASA) for various synoptic weather maps of Alaska region. (3) NCEP/NCAR Reanalysis dataset, NOAA, for various synoptic weather maps. We acknowledge the use of imagery from the Worldview Snapshots application (https://wvs.earthdata.nasa.gov), part of the Earth Science Data and Information System (ESDIS).

Conflicts of Interest

The authors declare no conflicts of interest.

References

  1. IPCC. Summary for Policymakers. In Climate Change 2023: Synthesis Report. Contribution of Working Groups I, II and III to the Sixth Assessment Report of the Intergovernmental Panel on Climate Change; Lee, H., Romero, J., Eds.; IPCC: Geneva, Switzerland, 2023; pp. 1–34. [Google Scholar] [CrossRef]
  2. Groisman, P.; Shugart, H.; Kicklighter, D.; Henebry, G.; Tchebakova, N.; Maksyutov, S.; Monier, E.; Gutman, G.; Gulev, S.; Qi, J. Northern Eurasia Future Initiative (NEFI): Facing the challenges and pathways of global change in the twenty-first century. Prog. Earth Planet. Sci. 2017, 4, 41. [Google Scholar] [CrossRef]
  3. Zheng, B.; Ciais, P.; Chevallier, F.; Yang, H.; Canadell, J.G.; Chen, Y.; Velde, I.R. Record-high CO2 emissions from boreal fires in 2021. Science 2023, 379, 912–917. [Google Scholar] [CrossRef] [PubMed]
  4. Giglio, L.; Csiszar, I.; Justice, C.O. Global distribution and seasonality of active fires as observed with the Terra and Aqua moderate resolution imaging spectroradiometer (MODIS) sensors. J. Geophys. Res. 2006, 111, G02016. [Google Scholar] [CrossRef]
  5. NASA Earth Data, Global Fire Maps. Available online: https://firms.modaps.eosdis.nasa.gov/map/#d:24hrs;@0.0,0.0,3.0z (accessed on 4 May 2025).
  6. Olson, D.L.; Cronan, J.B.; McKenzie, D.; Barnes, J.L.; Camp, A.E. Compiling, Synthesizing and Analyzing Existing Boreal Forest Fire History Data in Alasa, JFSP Research Project Reports, Paper 38. 2011. Available online: http://digitalcommons.unl.edu/jfspresearch/38 (accessed on 30 July 2025).
  7. Sierra-Hernández, M.R.; Beaudon, E.; Porter, S.E.; Mosley-Thompson, E.; Thompson, L.G. Increased fire activity in Alaska since the 1980s: Evidence from an ice core-derived black carbon record. J. Geophys. Res. Atmos. 2022, 127, e2021JD035668. [Google Scholar] [CrossRef]
  8. Alaska Fire History Chart with Data from Fire History and Stats, Other AICC Products, Alaska Interagency Coordination Center (AICC). Available online: https://fire.ak.blm.gov/predsvcs/intel.php. (accessed on 29 July 2025).
  9. Bieniek, P.A.; Waigl, C.F.; Bhatt, U.S.; Ballinger, T.; Lader, R.; Borries-Strigle, C.; Hostler, J.; Fischer, E.; Burgard, M.; Stevens, E.; et al. (submitted). The impact of snowoff timing and associated atmospheric drivers on the Alaska wildfire season. Earth Interact. 2025, 29, e240001. [Google Scholar] [CrossRef]
  10. Kasischke, E.S.; Verbyla, D.L.; Rupp, T.S.; McGuire, A.D.; Murphy, K.A.; Jandt, R.; Barnes, J.L.; Hoy, E.E.; Duffy, P.A.; Calef, M.; et al. Alaska’s changing fire regime-implications for the vulnerability of its boreal forests. Can. J. For. Res. 2010, 40, 1313–1324. [Google Scholar] [CrossRef]
  11. Thoman, R.; Walsh, J. Alaska’s Changing Environment: Documenting Alaska’s Physical and Biological Changes Through Observations; McFarland, H., Ed.; International Arctic Research Center, University of Alaska Fairbanks: Fairbanks, AK, USA, 2019. [Google Scholar]
  12. Flannigan, M.D.; Wotton, B.M.; Marshall, G.A.; de Groot, W.J.; Johnston, J.; Jurko, N.; Cantin, A.S. Fuel moisture sensitivity to temperature and precipitation: Climate change implications. Clim. Change 2016, 134, 59–71. [Google Scholar] [CrossRef]
  13. Hessilt, T.D.; Abatzoglou, J.T.; Chen, Y.; Randerson, J.T.; Scholten, R.C.; van der Werf, G.; Veraverbeke, S. Future increases in lightning ignition efficiency and wildfire occurrence expected from drier fuels in boreal forest ecosystems of western North America. Environ. Res. Lett. 2022, 17, 054008. [Google Scholar] [CrossRef]
  14. Wotton, B.M.; Nock, C.A.; Flannigan, M.D. Forest fire occurrence and climate change in Canada. Int. J. Wildland Fire 2010, 19, 253–271. [Google Scholar] [CrossRef]
  15. Price, C.; Rind, D. The Impact of a 2 × CO2 Climate on Lightning-Caused Fires. J. Clim. 1994, 7, 1484–1494. [Google Scholar] [CrossRef]
  16. Veraverbeke, S.; Rogers, B.M.; Goulden, M.L.; Jandt, R.R.; Miller, C.E.; Wiggins, E.B.; Randerson, J.T. Lightning as a major driver of recent large fire years in North American boreal forests. Nat. Clim. Change 2017, 7, 529–534. [Google Scholar] [CrossRef]
  17. Bieniek, P.A.; Bhatt, U.S.; York, A.; Walsh, J.E.; Lader, R.; Strader, H.; Ziel, R.; Jandt, R.; Thoman, R.L. Lightning Variability in Dynamically Downscaled Simulations of Alaska’s Present and Future Summer Climate. J. Appl. Meteorol. Climatol. 2020, 59, 1139–1152. [Google Scholar] [CrossRef]
  18. Jain, P.; Barber, Q.E.; Taylor, S.; Whitman, E.; Castellanos-Acuna, D.; Boulanger, Y.; Chavardès, R.D.; Chen, J.; Englefield, P.; Flannigan, M.; et al. Canada Under Fire—Drivers and Impacts of the Record Breaking 2023 Wildfire Season. ESS Open Arch. 2024. [Google Scholar] [CrossRef]
  19. Henry, D.M. Forecasting Fire Occurrence Using 500 mb Map Correlation; Technical Memorandum NWS AR-21. NWS; NOAA: Anchorage, AK, USA, 1978. [Google Scholar]
  20. Hess, J.C.; Scott, C.A.; Hufford, G.L.; Fleming, M.D. El Niño and its impact on fire weather conditions in Alaska. Int. J. Wildland Fire 2001, 10, 1–13. [Google Scholar] [CrossRef]
  21. Fauria, M.; Johnson, E.A. Large-scale climatic patterns control large lightning fire occurrence in Canada and Alaska forest regions. J. Geophys. Res. 2006, 111, G04008. [Google Scholar] [CrossRef]
  22. Zhao, Z.; Lin, Z.; Li, F.; Rogers, B.M. Influence of atmospheric teleconnections on interannual variability of Arctic-boreal fires. Sci. Total Environ. 2022, 838, 156550. [Google Scholar] [CrossRef]
  23. Duffy, P.A.; Walsh, J.E.; Graham, J.M.; Mann, D.H.; Rupp, T.S. Impacts of large-scale atmospheric-ocean variability on Alaskan fire season severity. Ecol. Appl. 2005, 15, 1317–1330. [Google Scholar] [CrossRef]
  24. Ballinger, T.; Lader, R.; Bieniek, P.A.; Strader, H.; Ziel, R.; Bhatt, U.S.; Borries-Strigle, C.; Hostler, J.; Stevens, E.; Waigl, C.F.; et al. Evaluating the Alaska Blocking Index as an indicator of wildfire potential in Alaska’s Central Eastern Interior. Int. J. Climatol. 2024, 44, 2230–2245. [Google Scholar] [CrossRef]
  25. Eden, J.M.; Krikken, F.; Drobyshev, I. An empirical prediction approach for seasonal fire risk in the boreal forests. Int. J. Climatol. 2020, 40, 2732–2744. [Google Scholar] [CrossRef]
  26. Justino, F.; Bromwich, D.H.; Schumacher, V.; daSilva, A.; Wang, S.-H. Arctic Oscillation and Pacific-North American pattern dominated-modulation of fire danger and wildfire occurrence. npj Clim. Atmos. Sci. 2022, 5, 52. [Google Scholar] [CrossRef]
  27. Bell, G. Special Climate Summary, April-July 2004, Hot in Alaska, Cool over Central North America, Wet in South-Central U.S. Available online: http://www.cpc.ncep.noaa.gov/products/expert_assessment/alaska.pdf. (accessed on 14 July 2025).
  28. Wendler, G.; Conner, J.; Moore, B.; Shulski, M.; Stuefer, M. Climatology of Alaskan wildfires with special emphasis on the extreme year of 2004. Theor. Appl. Climatol. 2011, 104, 459–472. [Google Scholar] [CrossRef]
  29. Skinner, W.R.; Stocks, B.J.; Martell, D.L.; Bonsal, B.; Shabbar, A. The association between circulation anomalies in the mid-troposphere and area burned by wildland fire in Canada. Theor. Appl. Climatol. 1999, 63, 89–105. [Google Scholar] [CrossRef]
  30. Skinner, W.; Flannigan, M.; Stocks, B.; Martell, D.L.; Wotton, B.M.; Todd, J.B.; Mason, J.A.; Logan, K.A.; Bosch, E.M. A 500 hPa synoptic wildland fire climatology for large Canadian forest fires, 1959–1996. Theor Appl Clim. 2002, 71, 157–169. [Google Scholar] [CrossRef]
  31. Lupo, A.; Kininmonth, W. Global Climate Models and Their Limitations. Climate Change Reconsidered II: Physical Science and its Summary for Policymakers, published by The Heartland Institute in September 2013 for the Nongovernmental International Panel on Climate Change (NIPCC). Available online: https://weather.missouri.edu/gcc/_09-09-13_%20Chapter%201%20Models.pdf. (accessed on 14 July 2025).
  32. Madden, R.A. Observations of large-scale traveling Rossby waves. Rev. Geophys. 1979, 17, 1935–1949. [Google Scholar] [CrossRef]
  33. Hoskins, B.J.; Ambrizzi, T. Rossby wave propagation on a realistic longitudinally varying flow. J. Atmos. Sci. 1993, 50, 1661–1671. [Google Scholar] [CrossRef]
  34. Hu, Y.; Yue, X. Chenguang Tian, Climatic drivers of the Canadian wildfire episode in 2023. Atmos. Ocean. Sci. Lett. 2024, 17, 100483. Available online: http://www.keaipublishing.com/en/journals/atmospheric-and-oceanic-science-letters/ (accessed on 14 July 2025). [CrossRef]
  35. Reeder, M.J.; Spengler, T.; Musgrave, R. Rossby waves, extreme fronts, and wildfires in southeastern Australia. Geophys. Res. Lett. 2015, 42, 2015–2023. [Google Scholar] [CrossRef]
  36. Ali, S.M.; Röthlisberger, M.; Parker, T.; Kornhuber, K.; Martius, O. Recurrent Rossby waves and south-eastern Australian heatwaves. Weather. Clim. Dynam. 2022, 3, 1139–1156. [Google Scholar] [CrossRef]
  37. Parker, T.; Berry, G.J.; Reeder, M.J. The Structure and Evolution of Heat Waves in Southeastern Australia. J. Clim. 2014, 27, 5768–5785. [Google Scholar] [CrossRef]
  38. Tamarin-Brodsky, T.; Harnik, N. The relation between Rossby wave-breaking events and low-level weather systems. Weather Clim. Dynam. 2024, 5, 87–108. [Google Scholar] [CrossRef]
  39. Riviere, G. Role of Rossby wave breaking in the west Pacific teleconnection. Geophys. Res. Lett. 2010, 37, 1802. [Google Scholar] [CrossRef]
  40. Antokhina, O.Y.; Antokhin, P.N.; Belan, B.D.; Gochakov, A.V.; Martynova, Y.V.; Pustovalov, K.N.; Tarabukina, L.D.; Devyatova, E.V. Effects of Rossby Waves Breaking and Atmospheric Blocking Formation on the Extreme Forest Fire and Floods in Eastern Siberia 2019. Fire 2023, 6, 122. [Google Scholar] [CrossRef]
  41. Russella, E.N.; Loikitha, P.C.; Ajibadeb, I.; Donec, J.M.; Lower, C. The meteorology and impacts of the September 2020 Western United States extreme weather event. Weather Clim. Extrem. 2024, 43, 100647. [Google Scholar] [CrossRef]
  42. Fire Weather. Available online: https://learnline.cdu.edu.au/units/env207/fundamentals/weather.html (accessed on 14 July 2025).
  43. Hayasaka, H.; Tanaka, H.; Bieniek, P. Synoptic-scale fire weather conditions in Alaska. Polar Sci. 2016, 10, 217–226. [Google Scholar] [CrossRef]
  44. Hayasaka, H. Forest Fires and Wind Flow. J. JSEM (Jpn. J. Jpn. Soc. Exp. Mech.) 2014, 14, 155–160. [Google Scholar]
  45. Stegall, S.T.; Zhang, J. Field Climatology, Changes, and Extremes in the Chukchi–Beaufort Seas and Alaska North Slope during 1979–2009. J. Clim. 2012, 25, 8075–8089. [Google Scholar] [CrossRef]
  46. Serreze, M.C.; Barrett, A.P. Characteristics of the Beaufort Sea High. J. Clim. 2011, 24, 159–182. [Google Scholar] [CrossRef]
  47. FIRMS; MODIS Collection 6. Available online: https://firms.modaps.eosdis.nasa.gov/download/ (accessed on 11 February 2025).
  48. MERRA-2, Modern-Era Retrospective Analysis for Research and Applications, Version 2. Available online: https://fluid.nccs.nasa.gov/reanalysis/classic_merra2/?field=wind&level=850&region=alaska&one_click=1&tau=12&track=none&fcst=20040617 (accessed on 25 December 2024).
  49. NCEP/NCAR 40-Year Re-analysis Data. Available online: https://psl.noaa.gov/data/composites/hour/ (accessed on 21 April 2025).
  50. WORLDVIEW. Available online: https://worldview.earthdata.nasa.gov (accessed on 18 April 2024).
  51. Tanaka, H.L.; Watarai, Y.; Kanda, T. Energy spectrum proportional to the squared phase speed of Rossby modes in the general circulation of the atmosphere. Geophys. Res. Lett. 2004, 31, 13109. [Google Scholar] [CrossRef]
  52. National Oceanic and Atmospheric Administration, Basic Wave Patterns. Available online: https://www.noaa.gov/jetstream/upper-air-charts/basic-wave-patterns (accessed on 11 July 2025).
  53. Hayasaka, H.; Yamazaki, K.; Naito, D. Weather Conditions and Warm Air Masses in Southern Sakha During Active Forest Fire Periods. J. Disaster Res. 2019, 14, 641–648. [Google Scholar] [CrossRef]
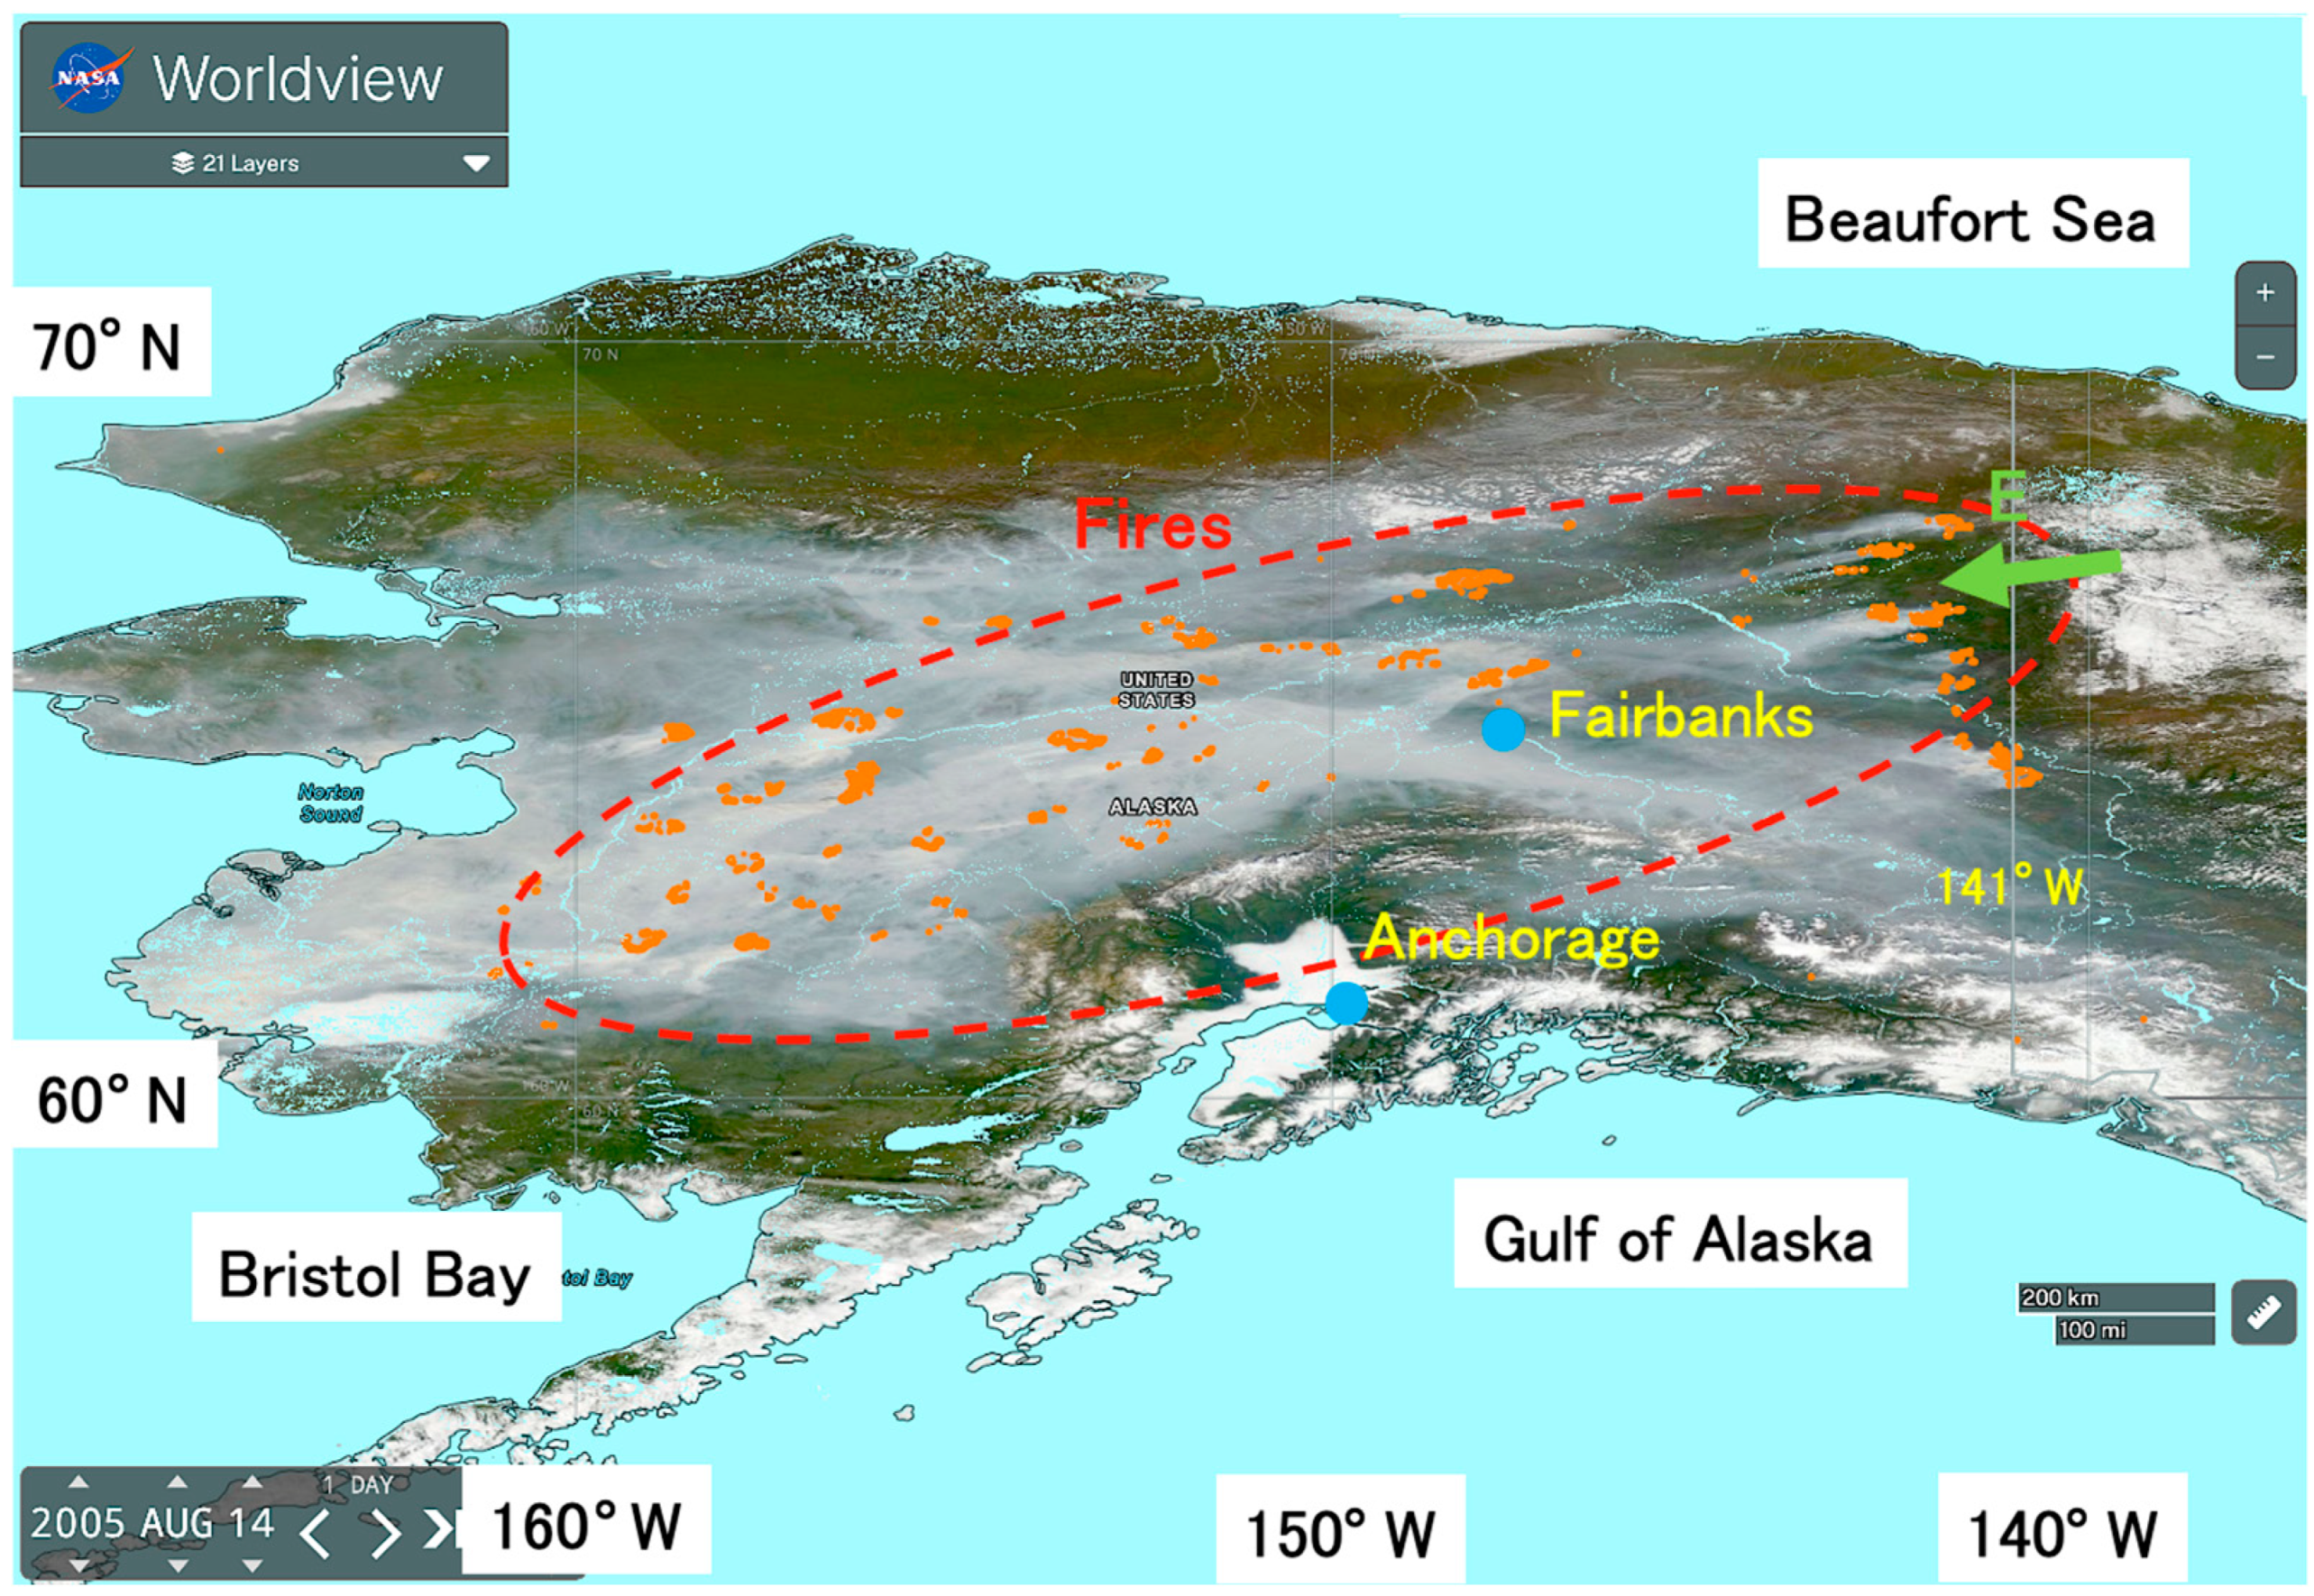
Figure 1. Map of the study area (main part of Alaska) by satellite image ((National Aeronautics and Space Administration) Worldview image on 14 August 2005 (https://worldview.earthdata.nasa.gov, accessed on 21 April 2025)). Red dots are hotspots (HSs) detected by MODIS (moderate resolution imaging spectroradiometer). Light blue colours are from Global 250 m and show sea, rivers, and lakes. The red dotted oval and two blue circles indicate main fire area and the location of Fairbanks and Anchorage. The white colour on the ground is mainly clouds, fog, snow and glaciers, while the grey colour is smoke (haze) from fires. The green arrow represents wind direction in the fire area.
Remotesensing 17 02719 g001
Figure 2. Daily hotspot (HS) changes of six fire years. (1), (2), … (13): Short name of active fire-periods. P1, P2, P3: Major HS peaks during each active fire-periods. (a) Three fire-periods ((2), (4), and (13)) in 2004. (b) Three fire-periods ((1), (9), and (11)) in 2005. (c) One fire-periods ((3)) in 2015. (d) Two fire-periods ((6) and (7)) in 2019. (e) Two fire-periods ((5) and (12)) in 2009. (f) Two fire-periods ((8) and (10)) in 2022.
Remotesensing 17 02719 g002
Figure 3. Annual number of hotspots (HSs) for the period 2002–2023. (1)–(13): Short name of 13 active fire-periods. (1) is the short name of (1) 14 Aug.2005 (see Table 1). R: RWB (Rossby Waves Break). T and R in bar graph are average number of HSs for 13 and 7 active fire-periods, respectively. σ: standard deviation.
Remotesensing 17 02719 g003
Figure 4. Various fire weather conditions on 10 August 2005 (the first fire (HS) peak P1 during the active fire-period “(1) 14 Aug.2005”). (a) Weather map with wind at 500 hPa. The red isoline for 5640 m is thickened to highlight the estimated location of the polar jet stream. The green arrow shows easterly wind. (b) Weather map with wind at 10 m. The green arrows indicate the respective wind direction. (c) Worldview image on 10 August 2005. The green arrows indicate the respective wind direction. (d) Temperature map at 925 hPa. The red number is the temperature over Alaska. The main conditions for each figure are listed in Table 1.
Remotesensing 17 02719 g004aRemotesensing 17 02719 g004b
Figure 5. Various weather and fire conditions on 14 August 2005 (the second fire (HS) peak P2 during the fire-period “(1) 14 Aug.2005”). (a) Weather map with wind at 500 hPa. The red isoline for 5640 m is thickened to highlight the estimated location of the polar jet stream. The green arrow shows easterly wind. (b) Weather map with wind at 10 m. The dotted red circle shows fire areas. H is high-pressure systems and V is high-pressure type vortex. The green arrow shows easterly wind. (c) Worldview image on 14 August 2005. The green arrows indicate the respective wind direction. (d) Temperature map at 925 hPa. Red number indicates the maximum temperature. The main conditions for each figure are listed in Table 1.
Remotesensing 17 02719 g005aRemotesensing 17 02719 g005b
Table 1. Seven active fire-periods related to RWB.
Fire-Period (Rank, Date of HSs Max. Peak)Max. HS During the Period.Total num. of HSs Fire-PeriodsNum. of Fire Days & PeriodName of HS PeakNumber of HSsHeight over Central Alaska at 500 hPa, mWind Direction on P1,P2Temp. at 925 hPa, °KType of BlockingBeaufort Sea High
(1) 14 Aug.2005549038,27414(Aug.8–21)(1)P137785880S, W294Rex
(1)P254905780E294Rex
(2) 29 Jun.2004491327,18217(Jun.18–Jul.4)(2)P120145760S293Ridge
(2)P249135830E293Ω
(3) 25 Jun.2015433728,12525(Jun.19–Jul.13)(3)P143375610SW, S288Ridge
(3)P231205790E293Ridge
(4) 20 Aug.2004327928,88724(Aug.6–29)(4)P114635820SW291Ridge
(4)P232795760E294Ω-Rex
(5) 4 Aug.2009316417,42219(Jul.18–Aug.5)(5)P117795780SE293Ridge
(5)P231645760E293Ridge
(6) 8 Jul.2019262115,92217(Jun.26–Jul.12)(6)P110285820W*293Rex
(6)P226215820E, NE294Rex
(7) 23 Jul.20191356861012(Jul.14–25)(7)P19835630W289Ridge
(7)P213565760E291Rex
W*: Wind direction one day before (6)P1, Max.: Maximum, Num.: Number, Temp.: Temperature, Jun: June, Jul: July, Aug: August. For more information on Rex and Ω-blocking, see the NOAA webpage [52]. ○: presence of the Beaufort Sea High.
Table 2. Six active fire-periods not related to RWB.
Fire-Period (Rank, Date of HSs Max. Peak)Max. HS During the PeriodTotal Num. of HSs Fire-PeriodsNum. of Fire Days & PeriodHeight over Central Alaska at 500 hPa, mWind Direction Changes During Fire-PeriodTemp. at 925 hPa, °K
(8) 30 Jun.2022241314,38818(Jun.24–Jul.11)5730W to E288
(9) 27 Jul.20051944891110(Jul.22–31)5640E to NW288
(10) 10 Jun.2022159163176(Jun.7–12)5730NE to SW287
(11) 28 Jun.2005154956255(Jun.26–30)5640E to W291
(12) 13 Jul.2009120626534(Jul.10–13)5780SW to E291
(13) 12 Jul.2004422715,85311(Jul.10–20)5640W, S293
Max.: Maximum, Num.: Number, Temp.: Temperature, Jun: June, Jul: July, Aug: August.
Disclaimer/Publisher’s Note: The statements, opinions and data contained in all publications are solely those of the individual author(s) and contributor(s) and not of MDPI and/or the editor(s). MDPI and/or the editor(s) disclaim responsibility for any injury to people or property resulting from any ideas, methods, instructions or products referred to in the content.