Article

Freezing Fog Microphysics and Visibility Based on CFACT Feb 19 Case

1
Department of Meteorological Engineering, Istanbul Technical University, Istanbul 34467, Türkiye
2
Ankara Aviation Vocational School, University of Turkish Aeronautical Association, Ankara 06790, Türkiye
3
Faculty of Engineering and Applied Sciences, Ontario Technical University, Oshawa, ON L1G 0C5, Canada
4
Department of Aeronautical Engineering, University of Turkish Aeronautical Association, Ankara 06790, Türkiye
5
Department of Civil and Environmental Engineering and Earth Science, University of Notre Dame, Notre Dame, IN 46556, USA
6
Department of Atmospheric Sciences, University of Utah, Salt Lake City, UT 84112, USA
7
Department of Mechanical Engineering, University of Utah, Salt Lake City, UT 84112, USA
8
National Center for Atmospheric Research, Earth Observing Laboratory, Boulder, CO 80301, USA
9
Department of Flight Training, University of Turkish Aeronautical Association, Ankara 06790, Türkiye
*
Author to whom correspondence should be addressed.
Remote Sens. 2025, 17(15), 2728; https://doi.org/10.3390/rs17152728
Submission received: 27 June 2025 / Revised: 1 August 2025 / Accepted: 2 August 2025 / Published: 7 August 2025

Abstract

The objective of this study is to analyze microphysical parameters affecting visibility parameterizations of a freezing fog case that occurred on 19 February 2022, during the Cold Fog Amongst Complex Terrain (CFACT) project conducted in a high-elevation alpine valley in Utah, USA. Observations are collected using visibility, droplet spectra, ice crystal spectra, and aerosol spectral instruments, as well as in-situ meteorological instruments. Particle phase is determined from relative humidity with respect to water (RHw) as well as ground cloud imaging probe (GCIP), ceilometer (CL61) depolarization ratio, and icing accumulation on the platforms. Results showed that freezing droplet density can affect visibility (Vis) up to 100 m during Vis less than 1 km. In addition, increasing volume can lead to up to a 2 μm increase in droplet radius due to a change in the chemical composition of aerosols from Sodium Chloride (NaCl) to Ammonium Nitrate (NH4NO3). Overall, comparisons suggested that Vis parameterizations are highly variable, and freezing fog conditions resulted in lower Vis values compared to warm fog microphysical parameterizations. Furthermore, riming of freezing fog conditions can lead to more than 50% uncertainty in Vis. It is concluded that changing aerosol composition and freezing fog droplet density and riming can play a major role in Vis simulations.

1. Introduction

Fog, composed of droplets, ice crystals, or mixed phase particles, with a horizontal Vis less than 1 km is defined for aviation applications [1]. The decrease in Vis due to fog significantly impacts human activities in various fields such as transportation, shipping, ecosystem, healthcare, and aviation, marine, and military operations; therefore, inaccurate forecasts of foggy conditions can lead to significant economic losses and loss of human lives [2,3]. Furthermore, its microphysical and dynamical environments are still not properly known, and freezing fog (FFG) creates further issues related to icing effects and low Vis conditions (the definitions used in this work are provided in Abbreviations part).
FFG consists of suspended tiny, supercooled droplets (SDs) in the air at/or near Earth’s surface that often reduces Vis less than 1 km for −10 °C ≤ T ≤ 0 °C at the saturation levels with respect to water (RHw~100%) [3]. SD’s formation and survival in colder temperatures can be possible down to about −40 °C [4,5]. These SDs can freeze in the air and reduce Vis compared to warm fog (WFG) conditions, and depending on particle density, upon contact with the surfaces, leads to icing conditions.
Cold fog, including FFG and ice fog (IFG), over regions of complex terrain has not yet received sufficient attention from the research community [6,7]. For several decades, most fog experiments focused on WFG conditions, and most experiments have taken place along the California coast [8,9,10]. Although WFG and FFG are physically identical, their Vis for the same droplet number concentration (Nd) with changing particle density (for water as ρw and ice as ρi) can be significantly different [11]. Gultepe et al. [12] suggested that FFG droplets can enlarge their size due to decreasing density; therefore, FFG Vis can be lower than WFG due to increasing droplet size.
Recent field programs have been conducted in mountainous regions [13,14] to study fog-affected stable atmospheric boundary layers. These studies have emphasized dynamical processes without focusing on microphysical (MP) processes. The Local and Non-local Fog Experiment (LANFEX) concentrated radiation-fog formation in complex terrain but did not focus on cold fog [15]. A pilot cold-fog field experiment was conducted as part of the Mountain Terrain Atmospheric Modeling and Observations (MATERHORN) program in the mountains of Utah [16,17]. MATERHORN project outcomes were limited due to a lack of FFG events and MP (droplet size spectra) and aerosol measurements.
Cold fog conditions, in addition to FFG, can also include IFG [17,18] and mixed-phase fog types. Pu et al. [7] presented an overview of the cold fog conditions in the high-elevation alpine terrain of Utah during the CFACT project using various platforms and instruments. In the context of CFACT, they stressed that Vis due to IFG based on Weather Research and Forecast Model (WRF) runs, was not simulated accurately at least 50% of the time. This might be due to limited cloud condensation nuclei (CCN) and ice nuclei (IN) parameterizations leading to lower Nd or ice number concentration (Ni) and underestimating the saturation rates in an atmospheric boundary layer (ABL) with smaller RHw values. FFG conditions were also studied by Gultepe et al. [19], who stated that FFG conditions were highly possible in marine environments when the air temperature (Ta) falls below to about 0 °C, and can be detected by the Rosemount Icing Detector (RID).
The life cycle of cold fog involves complex interactions between various scales of atmospheric motion (from synoptic-scale to micro-scale e.g., turbulent motion), thermodynamical processes, and a delicate balance between radiation, turbulence, thermodynamics, and MP processes [20,21]. The intensity of turbulence, together with the turbulence dissipation rate occurring during the life cycle of radiation fog, were studied by [22,23,24], who suggested that turbulence intensity plays an important role over the fog life cycle. Gultepe et al. [24] developed a Vis physical parameterization using eddy dissipation rate to improve the Vis prediction. The nature of the interaction between fog dynamics and MP processes is complex and still not fully understood properly [25]. Later work suggested that improvements in nucleation processes can reduce the uncertainties in the estimation of Vis. Because of limited FFG experiments, new field observations of cold fog conditions can be used to better evaluate the life cycle (including formation, development, and dissipation) and MP structure of FFG [2].
Cold fog formation processes can be dominated by large-scale patterns, including ridging and cold-air advection as well as collision processes and mixing of air pockets of different temperatures and moisture contents [26]. Cold pool type fog formation is an example of mountain FFG formation [15,27]. Cold fog, described as supercooled fog, can also significantly affect marine and aviation operations. Examples of these types of fog are FFG occurrences at the cold surfaces in marine environments. Therefore, FFG studies are very important for aircraft icing, marine shipping, and wire icing, and need to be further studied when the air is saturated with respect to water near 0 °C and below.
Meteorological conditions, such as the environment Ta, dew point temperature (Td), and RHw, as well as CCN/IN, and droplet growth rate, along with turbulence and vertical air velocity, play an important role in Nd prediction, thereby affecting Vis estimation [28,29]. In this regard, Gultepe et al. [30] suggested that accurate predictions of both Nd and Liquid Water Content (LWC) are critical for Vis prediction, and that parameterizations that only use LWC, as suggested in [31,32], are insufficient. Vis is usually diagnosed in the post-processing stage of forecast model outputs that utilize the Stoelinga–Warner [32] study, leading to large uncertainties in fog Vis prediction [19,33]. In fact, FFG conditions are not represented well in numerical weather prediction (NWP) model studies because of scale issues and underestimating Nd; therefore, FFG predictions need to be improved.
The single-moment and double-moment microphysical schemes often used in NWP models were applied to analyze cloud/fog MP parameters. LWC is usually a prognostic variable, and Nd is assumed as a fixed value or is obtained either deterministically or prognostically by making several assumptions about the physical terms affecting Nd. If Nd is not fixed, a modified gamma distribution is usually assumed to represent fog droplet size distribution (DSD), which is used to obtain Nd. Previous studies have found that fog forecasting is sensitive to the choice of Vis algorithm [2,34,35,36,37]. These studies indicated that a Vis algorithm may work well for a specific fog type but not for all fog types. In fact, FFG conditions have not been studied in detail using NWP models. This point needs to be further studied and FFG droplet density should be emphasized for Vis simulations.
The objectives of this study are to evaluate the MP processes leading to FFG formation. The main objectives of this work are to (1) evaluate the influence of large-scale synoptic conditions and aerosol composition effect on Vis, (2) investigate Vis change related to droplet growth mechanisms, and (3) develop physical parameterizations for FFG prediction. In the analysis, the synoptic and atmospheric conditions responsible for the development of FFG conditions are evaluated. The influence of chemical composition on CCN activation during particle-to-droplet transition processes was investigated using the Kappa (κ)-Köhler method. To improve freezing fog prediction, new parameterizations were developed and assessed in comparison with existing formulations reported in the literature.
The paper is composed of six sections, as follows: Section 1 provides the Introduction. Section 2 focuses on synoptic conditions as well as the CFACT field campaign and observations. Section 3 summarizes the method being used and Section 4 provides the results. Finally, Section 5 and Section 6 are given for discussions and conclusions, respectively.

2. Field Campaign and Observations

This section involves the CFACT campaign location and observations that include a summary of the instruments. Nine fog cases were conducted during the CFACT field campaign to investigate various mountainous weather patterns and cold fog conditions. Additional details are given in Pu et al. [7]. In this work, the IOP 8 (19 February 2022) freezing fog event is selected for the analysis because of its unique weather conditions.

2.1. Project Location and Observations

The CFACT field campaign took place in Heber Valley, Utah, USA, during the winter of 2022 from 5 January to 28 February 2022. The project was designed to capture the temporal and spatial variability of cold fog using ground-based, airborne, and remote sensing platforms. During the campaign, numerical simulations using the WRF model were performed to predict the formation and dissipation of cold fog. The CFACT study area (see Figure 1a) is centered at approximately 40.50°N, 111.42°W and is located about 50 km southeast of Salt Lake City. Heber Valley is an alpine basin characterized by suburban and agricultural land cover, surrounded by canyons and high-elevation mountains. The Provo River runs through the valley from the Jordanelle Reservoir and flows into Deer Creek Reservoir, which lies at an elevation of 1652 m [7]. The highest surrounding peaks reach up to 3500 m, particularly to the west and southwest of the valley.
Cold-air pool fog, together with IFG, has often been observed in the Heber Valley during cold seasons. The field campaign was funded by the National Science Foundation (NSF) and instrumentation support was provided by the Lower Atmospheric Observing Facilities (LAOF) managed by the National Center for Atmospheric Research (NCAR), specifically by its Earth Observing Laboratory (EOL) [7]. The University of Utah (UU) and Ontario Technical University (OntTecU) also participated in the project design and performing campaign observations. The CFACT field deployment included two supersites and nine satellite sites that were composed of an aerosol measurement trailer, an MP measurement site [34], and eight low-cost weather stations [7]. Figure 1b summarizes project location and supersites used in the study.
At the Deer Creek Supersite (DC SS), in-situ ground-based measurements were collected by several instruments, including the present weather detectors and visibility sensor (PWD22), broadband radiometers (Kipp and Zonen—CMP21), cloud droplet spectrometer (Droplet Measurement Technologies—DMT—FM120), a ground-based cloud imaging probe (DMT—GCIP), a scanning mobility particle sizer (TSI—SMPS), Total Air Sampler (Airmetric MiniVol) (MTAS), 3D sonic anemometer (Campbell Scientific CSAT3), hygrothermometers (Sensiron—SHT85), and celiometers (Vaisala—CL31 and CL61) (see Figure 1c and Table 1). With these instruments, fog MP properties, including LWC or ice water content (IWC), mean volume diameter (MVD), Nd, aerosol composition, particle shape, infrared (IR) and shortwave (SW) up-down radiative fluxes, and vapor mixing ratio (qv) and 3D wind components, as well as atmospheric profiles of extinction coefficient (βext) and depolarization, were obtained. The CL31 was oriented in the horizontal direction to detect the horizontal extent of the fog. Vertical profiles of βext were obtained using a CL61 with depolarization capability. The observations used in the analysis were collected at the Deer Creek Microphysics supersite (DC MP) and at the Aerosol Trailer (DC AT) site. Spectral measurements of droplet microphysics (30 channels between 2–50 μm) were measured by FM120 at 1Hz sampling rate. The FM120 measurements were averaged over 1-min intervals to match the temporal resolution of the PWD visibility data. However, when compared with the SMPS measurements, a 5-min averaging interval was applied to ensure consistency between the datasets. The GCIP data were only used for discriminating droplets from ice crystals that likely affected Vis.
Aerosol composition and spectral measurements were performed using various instruments at the DC SS and DC AT. These instruments were used to evaluate the physical and chemical properties of aerosols (Figure 1b) and the results are summarized in Table 1. In-situ size-resolved measurements of ambient aerosols were obtained using a TSI Inc. SMPS, operating over a size range from 8 nm to 19.81 mm across 128 bins, as described in Carrillo-Cardenas et al. [38]. The SMPS measurements, collected at 5-min scan intervals, were used to quantify aerosol physical properties. Additionally, Teflon filters were collected using Airmetrics MTAS at a flow rate 5 L min−1 for particulate matter (PM10; size < 10 μm). Using SMPS and Teflon filters, aerosol physical and chemical properties are analyzed to show the aerosol impact on freezing fog conditions from 8 nm up to 10s of micrometer size range.

2.2. Synoptic Weather Systems

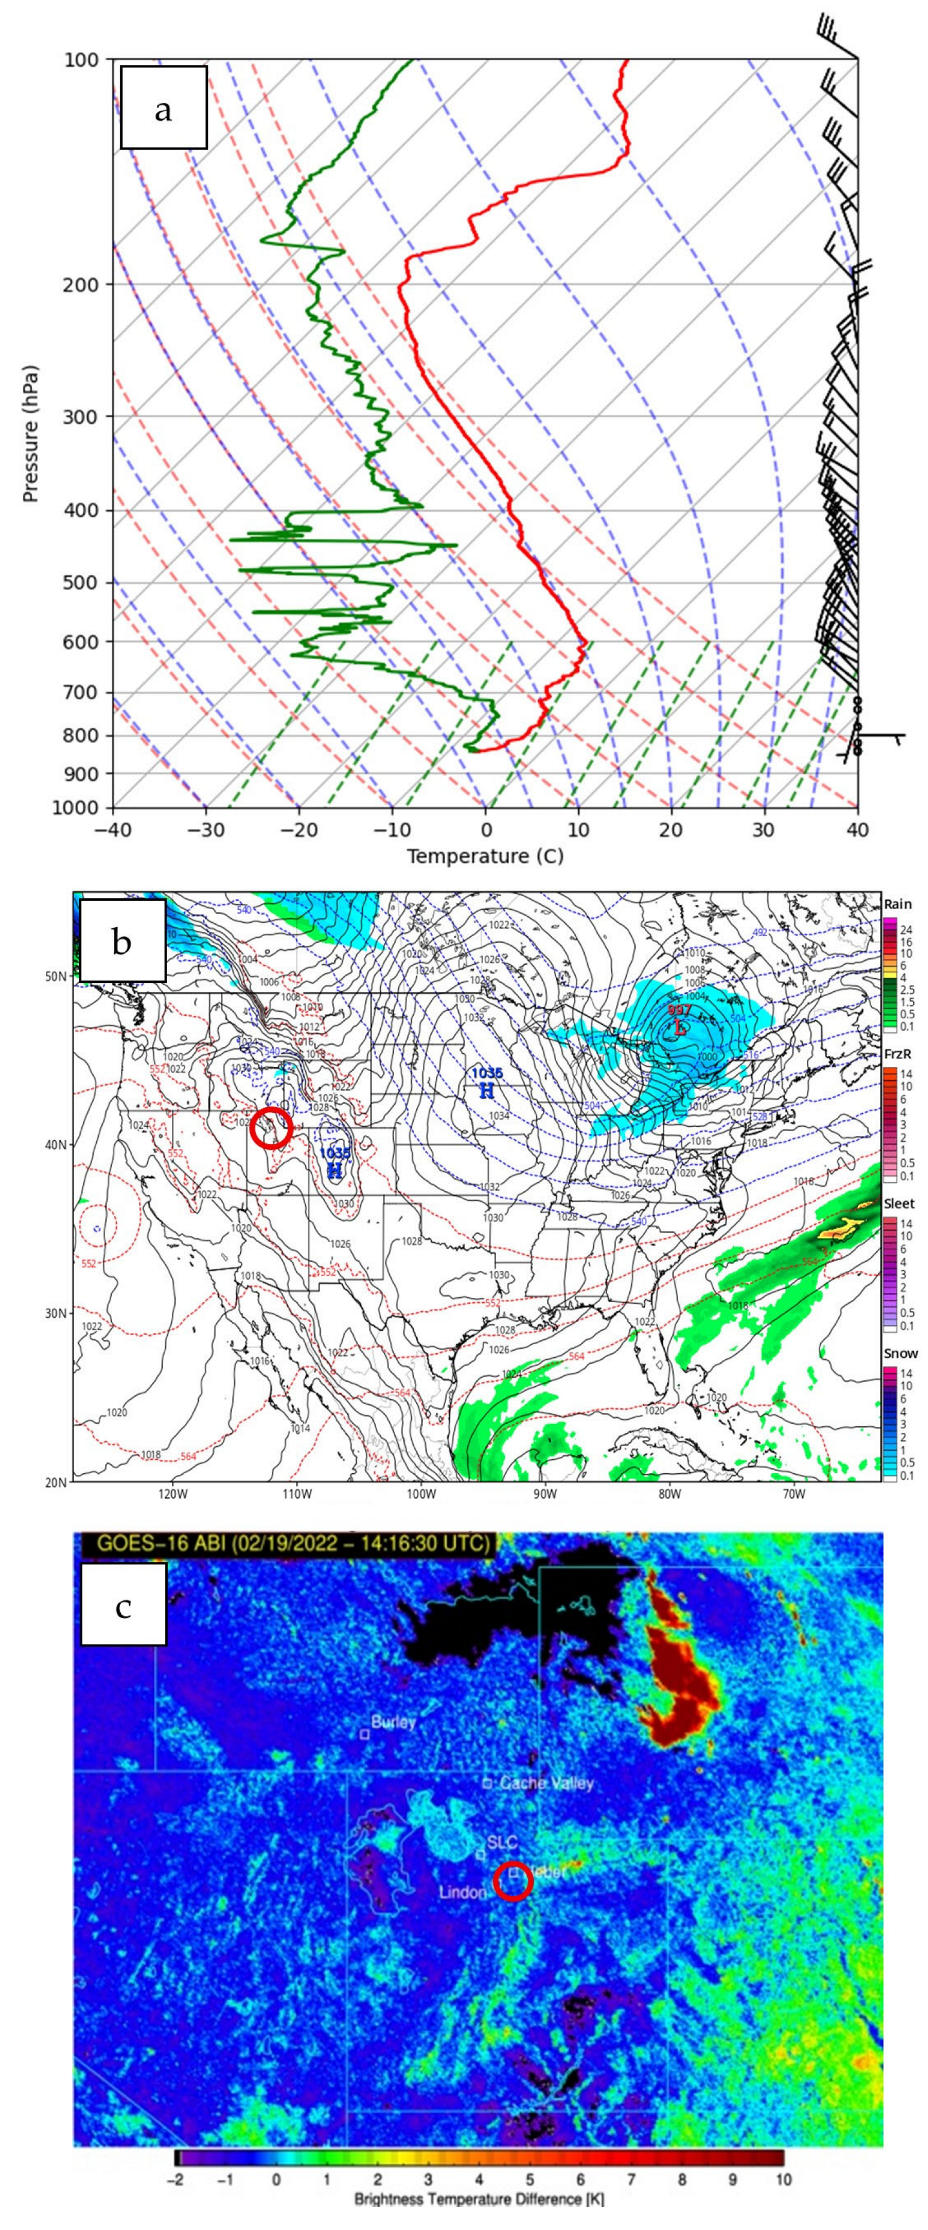
Synoptic systems can affect the cold fog life cycle. Usually, cold high-pressure (HP) systems with clear skies lead to cold fog (IFG or FFG) formation that is related to infrared cooling [18,34]. In addition to synoptic conditions, local meteorological factors also influence FFG formation, particularly over mountainous slopes and valleys [39]. During the FFG event that occurred on 19 February 2022, its unique physical conditions led to supercooled FFG formation. The fog occurred between 05:30 and 14:20 UTC. Specifically, an HP system dominated the Heber Valley, which led to FFG formation. Figure 2 shows a radiosonde profile, the US Global Forecast Model (GFS) model forecast, and the Shortwave infrared (SWIR)-IR temperature difference based on Geostationary Operational Environmental Satellites (GOES-R). Figure 2a shows that the surface ABL was saturated with respect to water (RHw~100%) and winds were relatively calm (<2 m s−1). Figure 2b shows the pressure centers, 6-h precipitation rate (color bar), and 500 mb thickness. The FFG event in this case was directly related to the HP system moving from NW to SE with its center at ~1030 mb over the Heber Valley. The SWIR-IR difference (Figure 2c) is less than 1–2 °C and indicates the likely presence of cold foggy regions.

2.3. Observations

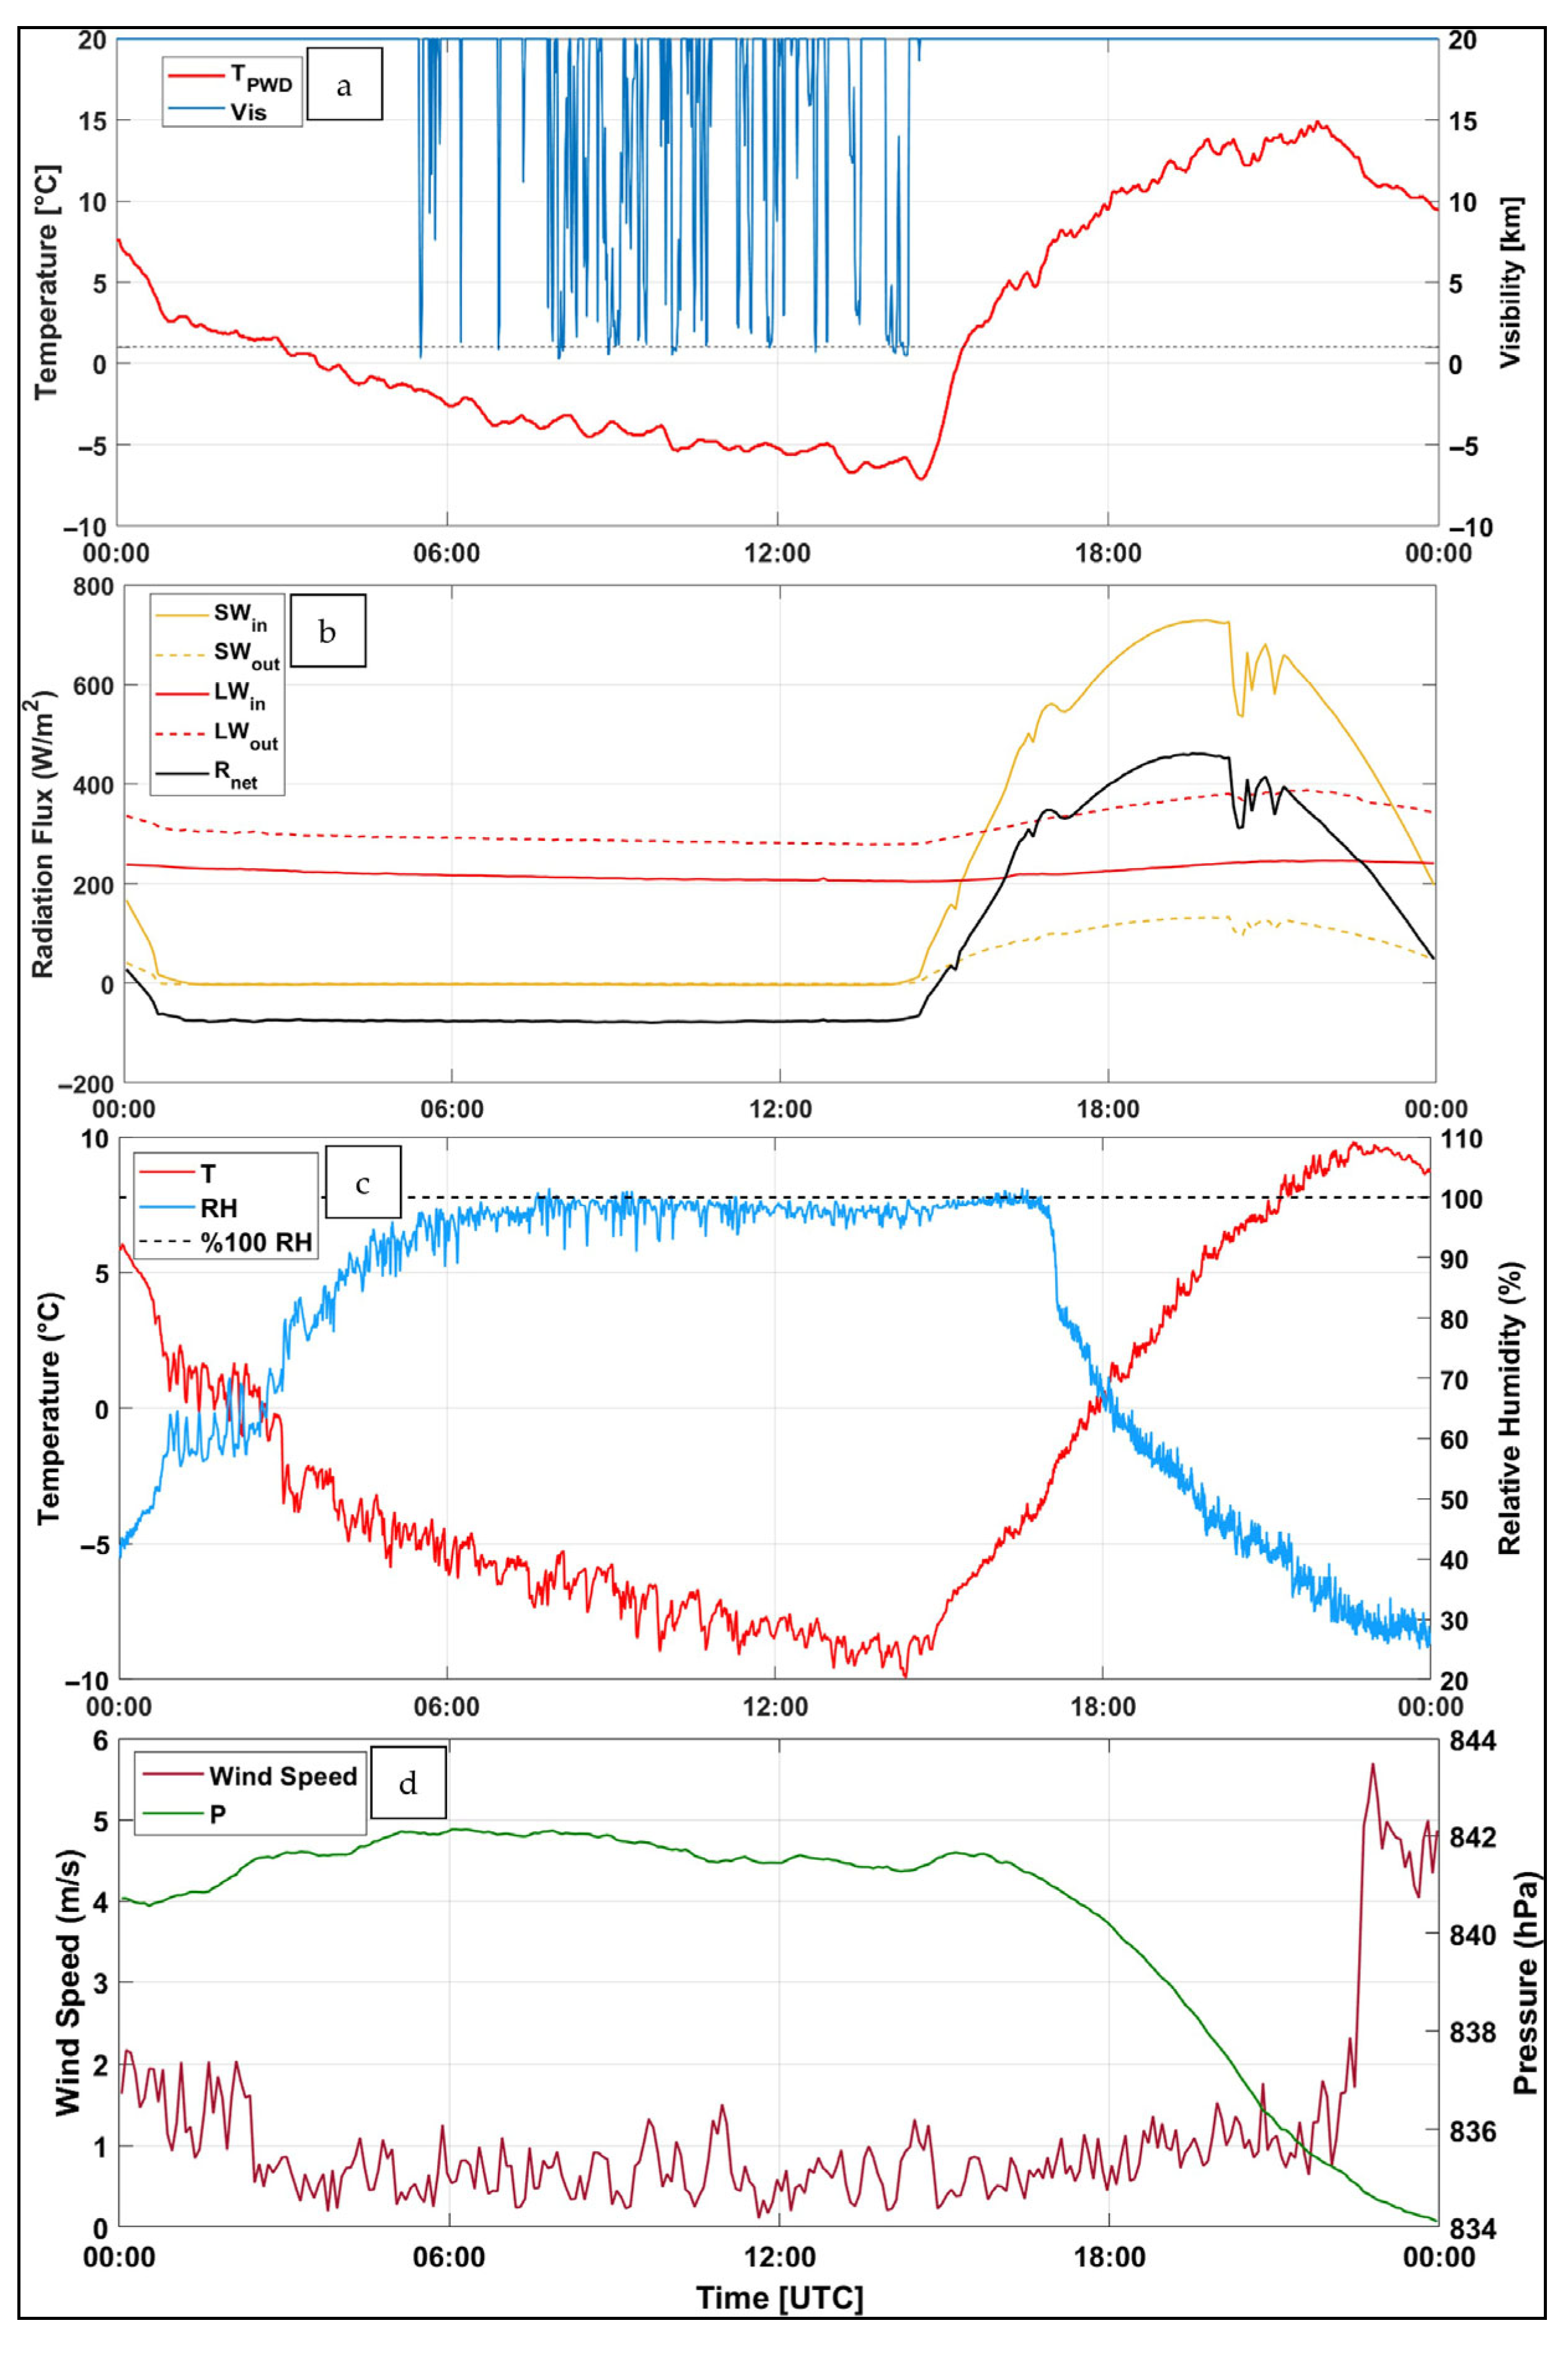
Figure 3a shows time series of Ta and Vis from the PWD. FFG occurred during IOP 8 between 05:30 and 14:20 UTC, during which Vis decreased down to about 300 m and Ta decreased from −2 °C to −7.1 °C. Note that Ta values from PWD (TPWD) are about 3 °C higher than environmental Ta measurements because TPWD sensor was located inside PWD pole. On this day, the fog event continued until the downward short wave radiative flux (SWRF) reached 100 Wm−2 (Figure 3b). A detailed analysis of radiative fluxes is provided in the results section. Figure 3c shows the time series of Ta and RHw where, during fog occurrence, RHw is found to be about 100%, indicating that during FFG conditions, Ta ranged between 0 °C and −10 °C. In the same time period, pressure (P) increased from 840.5 mb to 842 mb and wind speed (Uh) decreased from 2 m s−1 down to about 0.5–1 m s−1 (Figure 3d).
CL31h (horizontal looking) and CL61v (vertical looking) provided the backscatter coefficient (β) time-height cross-sections at the DC SS MP, as shown in Figure 4. It is important to note that the ceilometer-based fog-top heights cannot be accurate because of strong extinction of transmitted light when a large number of fog liquid droplets exists, but this was not the case during the Feb 19 case. Figure 4 suggests that fog formation on 19 Feb case was very patchy, and its duration was between 30 min and 60 min. Figure 4a shows time series of CL31, indicating that the top of the fog layer was about 200 m. Figure 4b,c show CL61 and linear depolarization ratio (LDR) time-height cross sections, respectively. The LDR indicates that the lowest foggy layer was noisy but β shows high values.

3. Method

In the analysis, microphysical processes associated with a FFG event that occurred on 19 February 2022 are investigated. First, the κ-Köhler approach is used to show aerosol chemical composition effect on droplet activation and growth, then Vis is calculated using FM120 spectral measurements for FFG fog conditions. Measurement issues are provided in the next section. Second, to simulate the time-dependent growth of an individual droplet during the initial 30-min period of the fog event min of the fog event, the droplet growth equation is used and the critical radius (rc) and critical saturation ratio (Sc) values are derived from the Köhler curve [40]. Vis estimations were obtained based on Gultepe et al. [24], using MP parameters (droplet radius (r), LWC, and Nd) retrieved from FM-120 measurements. The results are then evaluated by comparing them with direct visibility measurements from PWD; these results are provided in the discussion section. The following sections provide κ-Köhler theory application with aerosol composition effects, droplet growth equation, aerosol impact on FFG conditions, and the freezing fog MP parameterizations. These sections are related to the aerosol composition from filter samples, FM120 MP measurements, and PWD Vis data.

3.1. Aerosol Composition Impact on Droplet Size

Köhler equation is described for the activation of cloud droplets. Similar to clouds, the saturation ratio with respect to water (S) during FFG formation is given by Pruppacher and Klett [40] as:
S r = e * r e s , w = 1 + a r b r 3 .
In Equation (1), e*(r) and es,w(∞) equilibrium vapor pressure over a solution droplet and saturated water vapor pressure over a flat pure water surface (see Abbreviations part). The effects of droplet curvature (Kelvin’s term) and solute concentration (Raoult’s term) on droplet growth are provided in 2nd and 3rd terms of Equation (1), where a = 2 σ w ρ l R v T a and b = 3 i m s M w 4 π ρ l M S . In coefficient a, σw is the surface tension of water in air, ρl the density of water, Rv the specific gas constant of water vapor, and Ta the air temperature in K. In coefficient b, i is the Van’t Hoff factor, ms the solute mass, Mw the molecular weight of water, and Ms the molecular weight of solute. The point at which the S reaches a level where droplets form is defined as the Sc corresponding to the rc. The rc and Sc are given, respectively, as:
r c = 3 b a ,
and
S c = 1 + 4 a 3 27 b .
Sc indicates the minimum saturation ratio for a droplet to grow on its own while rc indicates the minimum radius at which the solution droplet will become active, leading to particle growth.
To simplify the complex chemical requirements of the Köhler theory, a method describing CCN activity using a single hygroscopicity parameter (κ), the κ-Köhler theory, was developed by Petters and Kreidenweis [41] to define the saturation ratio as follows:
S = a w exp 4 σ s / a M w R T ρ w D ,
where R is the universal gas constant, D is the diameter of the droplet, and aw is the activity of water in solution. The κ is defined through its effect on the water activity of the solution:
a w = 1 1 + κ V s V w ,
where Vs is the volume of the dry particulate matter and Vw is the volume of the water.
Using Equations (1)–(5), rc and S are calculated for NaCl and NH4NO3 aerosol compositions based on studies by Carrillo-Cardenas et al. [38] and Chow et al. [42]. The mass concentration estimates of the elemental composition from the Teflon filter samples were calculated using mass reconstruction equations from the Interagency Monitoring of Protected Visual Environment (IMPROVE) network, as specified by Chow et al. [42], using Airmetric MiniVol samplings. The IMPROVE equation set estimates the contributions of components such as salt, organic matter (OM), organic carbon (OC), geological minerals (Soil), ammonium nitrate, and ammonium sulfate ((NH4)2SO4) [42]. However, the Teflon filters used in this study were analyzed only for inorganic species. This analysis is applied to droplet growth equations to study aerosol composition effects on droplet growth and Vis.

3.2. Droplet Growth During Freezing Fog Event

To show the effect of aerosol composition on Vis, we need to provide a droplet growth equation as a function of droplet size. The cloud droplet size growth rate is given by Pruppacher and Klett [40] as:
r d r d t = ( S 1 ) a / r + b / r 3 F k + F d ,
where Fk and Fd are provided, respectively, as:
F k = L R v T a 1 ρ l L K T a ρ l L v 2 K R v T a 2 , a n d   F d = ρ l R v T a D v e s T a .
In Equation (7), the Fk is related to heat conduction as a function of Ta. The Lv is latent heat of vaporization and K is the thermal conductivity. The ρl is the droplet water density, but for freezing fog, it should be replaced with the density of ice (ρi) as 0.91 g cm−3. The effect of density on freezing droplet growth and Vis is calculated using Equation (6), which is related to Equation (7) with particle density parameter. The Fd above is the water vapor diffusion term, which is a function of the saturated vapor pressure (es), Ta, and the water vapor diffusion coefficient in air (Dv), Beard and Pruppacher [43], which is given as:
D v = 2.11 × 10 5 T a T 0 1.94 P 0 P
where T0 and P0 are surface values of air temperature and pressure, respectively. Then, Equation (6) can be used to emphasize aerosol composition impact on droplet growth.

3.3. Freezing Droplet Effect on Extinction Coefficient

In fog conditions, Vis can be obtained by direct measurement of the extinction coefficient from the difference between the transmitted and received radiation or by using MP droplet spectral measurements such as Nd, LWC, and effective radius (reff) (or MVD). Generally, Vis is obtained using either PWD-based direct measurements of the extinction or fog microphysical spectral measurements using FM120, but the results cannot be the same for both Vis calculations due to measurement issues such as wind speed and directions [24]. To show aerosol impact on Vis, we first need to obtain Vis as a function of LWC and Nd (or MVD) where Nd is related to aerosol number concentration (Na).
Based on Koschmieder’s law [44], Vis is defined as a function of a brightness contrast threshold (C) and βext. The visibility range then can be defined as:
V i s = l n ( C ) β e x t ,
In Equation (9), C is defined as a threshold value at which the human eye can recognize an object at a certain distance in daytime conditions and is taken as 0.05 in meteorological applications [34]. βext is calculated for water droplets as:
β e x t = i = 1 m π Q e f f r n r r 2 d r ,
where m represents the number of particle spectral bins and Qeff is the extinction efficiency, which is ~2 for spherical large water droplets at visible wavelengths according to Mie theory. The n(r) and r2 denote particle number concentration and spherical particle cross-sectional area, respectively. For freezing droplets, Equation (10) becomes:
β e x t = i = 1 m π Q e f f ( r + Δ r ) n ( r + Δ r ) r 2 d r ,
where Δr represents the difference between freezing droplet radius (ri) and liquid droplet radius (rw). The ri is then calculated as:
r i = r w + Δ r = r w ρ w ρ i 1 / 3 .
Equation (12) is used to calculate the difference between freezing fog and liquid fog, and that is used to obtain Vis differences between FFG and WFG.

3.4. Microphysical Parameterizations

FFG particles can be WFG droplets, but if droplets freeze, the volume of spherical ice particles become greater than liquid droplets. To develop visibility parameterization for freezing fog, MP parameters are needed for both the liquid (like Nd, LWC, MVD) and ice forms (such as Ni, IWC, MVDice). It can be estimated that visibility for ice crystals (Visice) can be different than visibility with respect to liquid droplets (Visliq) because frozen droplet density can lead to formation of larger particle sizes.
Using warm fog microphysical spectral measurements, Gultepe et al. [24,34] developed a parametrization based on the theory of extinction of visible light in a volume of fog droplets as:
V i s = 4 3 l n ( ε ) ρ w r 1 r 2 n ( r ) r 3 Δ r Q eff   L W C r 1 r 2 n ( r ) r 2 Δ r .
Equation (13) can be simplified and used as a theoretical model for parameterizations:
V i s = 5.216 ρ w r e f f Q eff   L W C ,
where ρw is 1000 kg m−3. Visibility can be obtained from Equation (14) if the effective radius (reff) and LWC are obtained from FM120 measurements. For the calculation of FFG microphysical parameters, LWC and Nd are replaced with IWC and Ni, respectively. The r and LWC values in Equations (13) and (14) can be presented as freezing droplet radius when we assume as ice (ri) and IWC for freezing droplets, respectively [17]. The final equations used for WFG and FFG are obtained, respectively, as:
Vis liq   = α ρ w Q e f f N d L W C γ ,
and
Vis ice = α ρ i Q e f f N i I W C γ ,
where ρi is 917 kg m−3, Qeff ~2 for large particles, and α and γ are regression constants. The ice crystal number concentration (Ni) (# cm−3) and IWC (g m−3) are obtained from FM120 spectral measurements.
Assuming that Qeff, ρw, and ρi are constants, Equations (15) and (16) can be rewritten, correspondingly, as:
Vis liq   = α 1 N d L W C γ ,
and
Vis ice = α 1 N i I W C γ .
Equations (17) and (18) are used to obtain Vis based on liquid droplets and frozen droplets, respectively. In NWP models, visibility is usually diagnosed using the post-processed model outputs. If numerical forecast model simulations can resolve MP processes at small time and space scales in ABL, Vis can also be predicted diagnostically. This bulk parametrization of the cloud MP parameters does not need a droplet spectrum at each time-step, which increases calculation time significantly. Therefore, the above equations are used to show freezing fog impact on Vis, and the results are given in the next section.

4. Results

The results related to the FFG event on 19 February 2022 are presented in this section. First, time series of microphysical parameters are given. Second, the influence of aerosol chemical composition on Vis and droplet growth are provided using theoretical and observational data. Finally, the impact of water phase (liquid vs. ice) on Vis is evaluated, and a newly developed, site-specific visibility parameterization is introduced.

4.1. Time Series of Microphysical Parameters

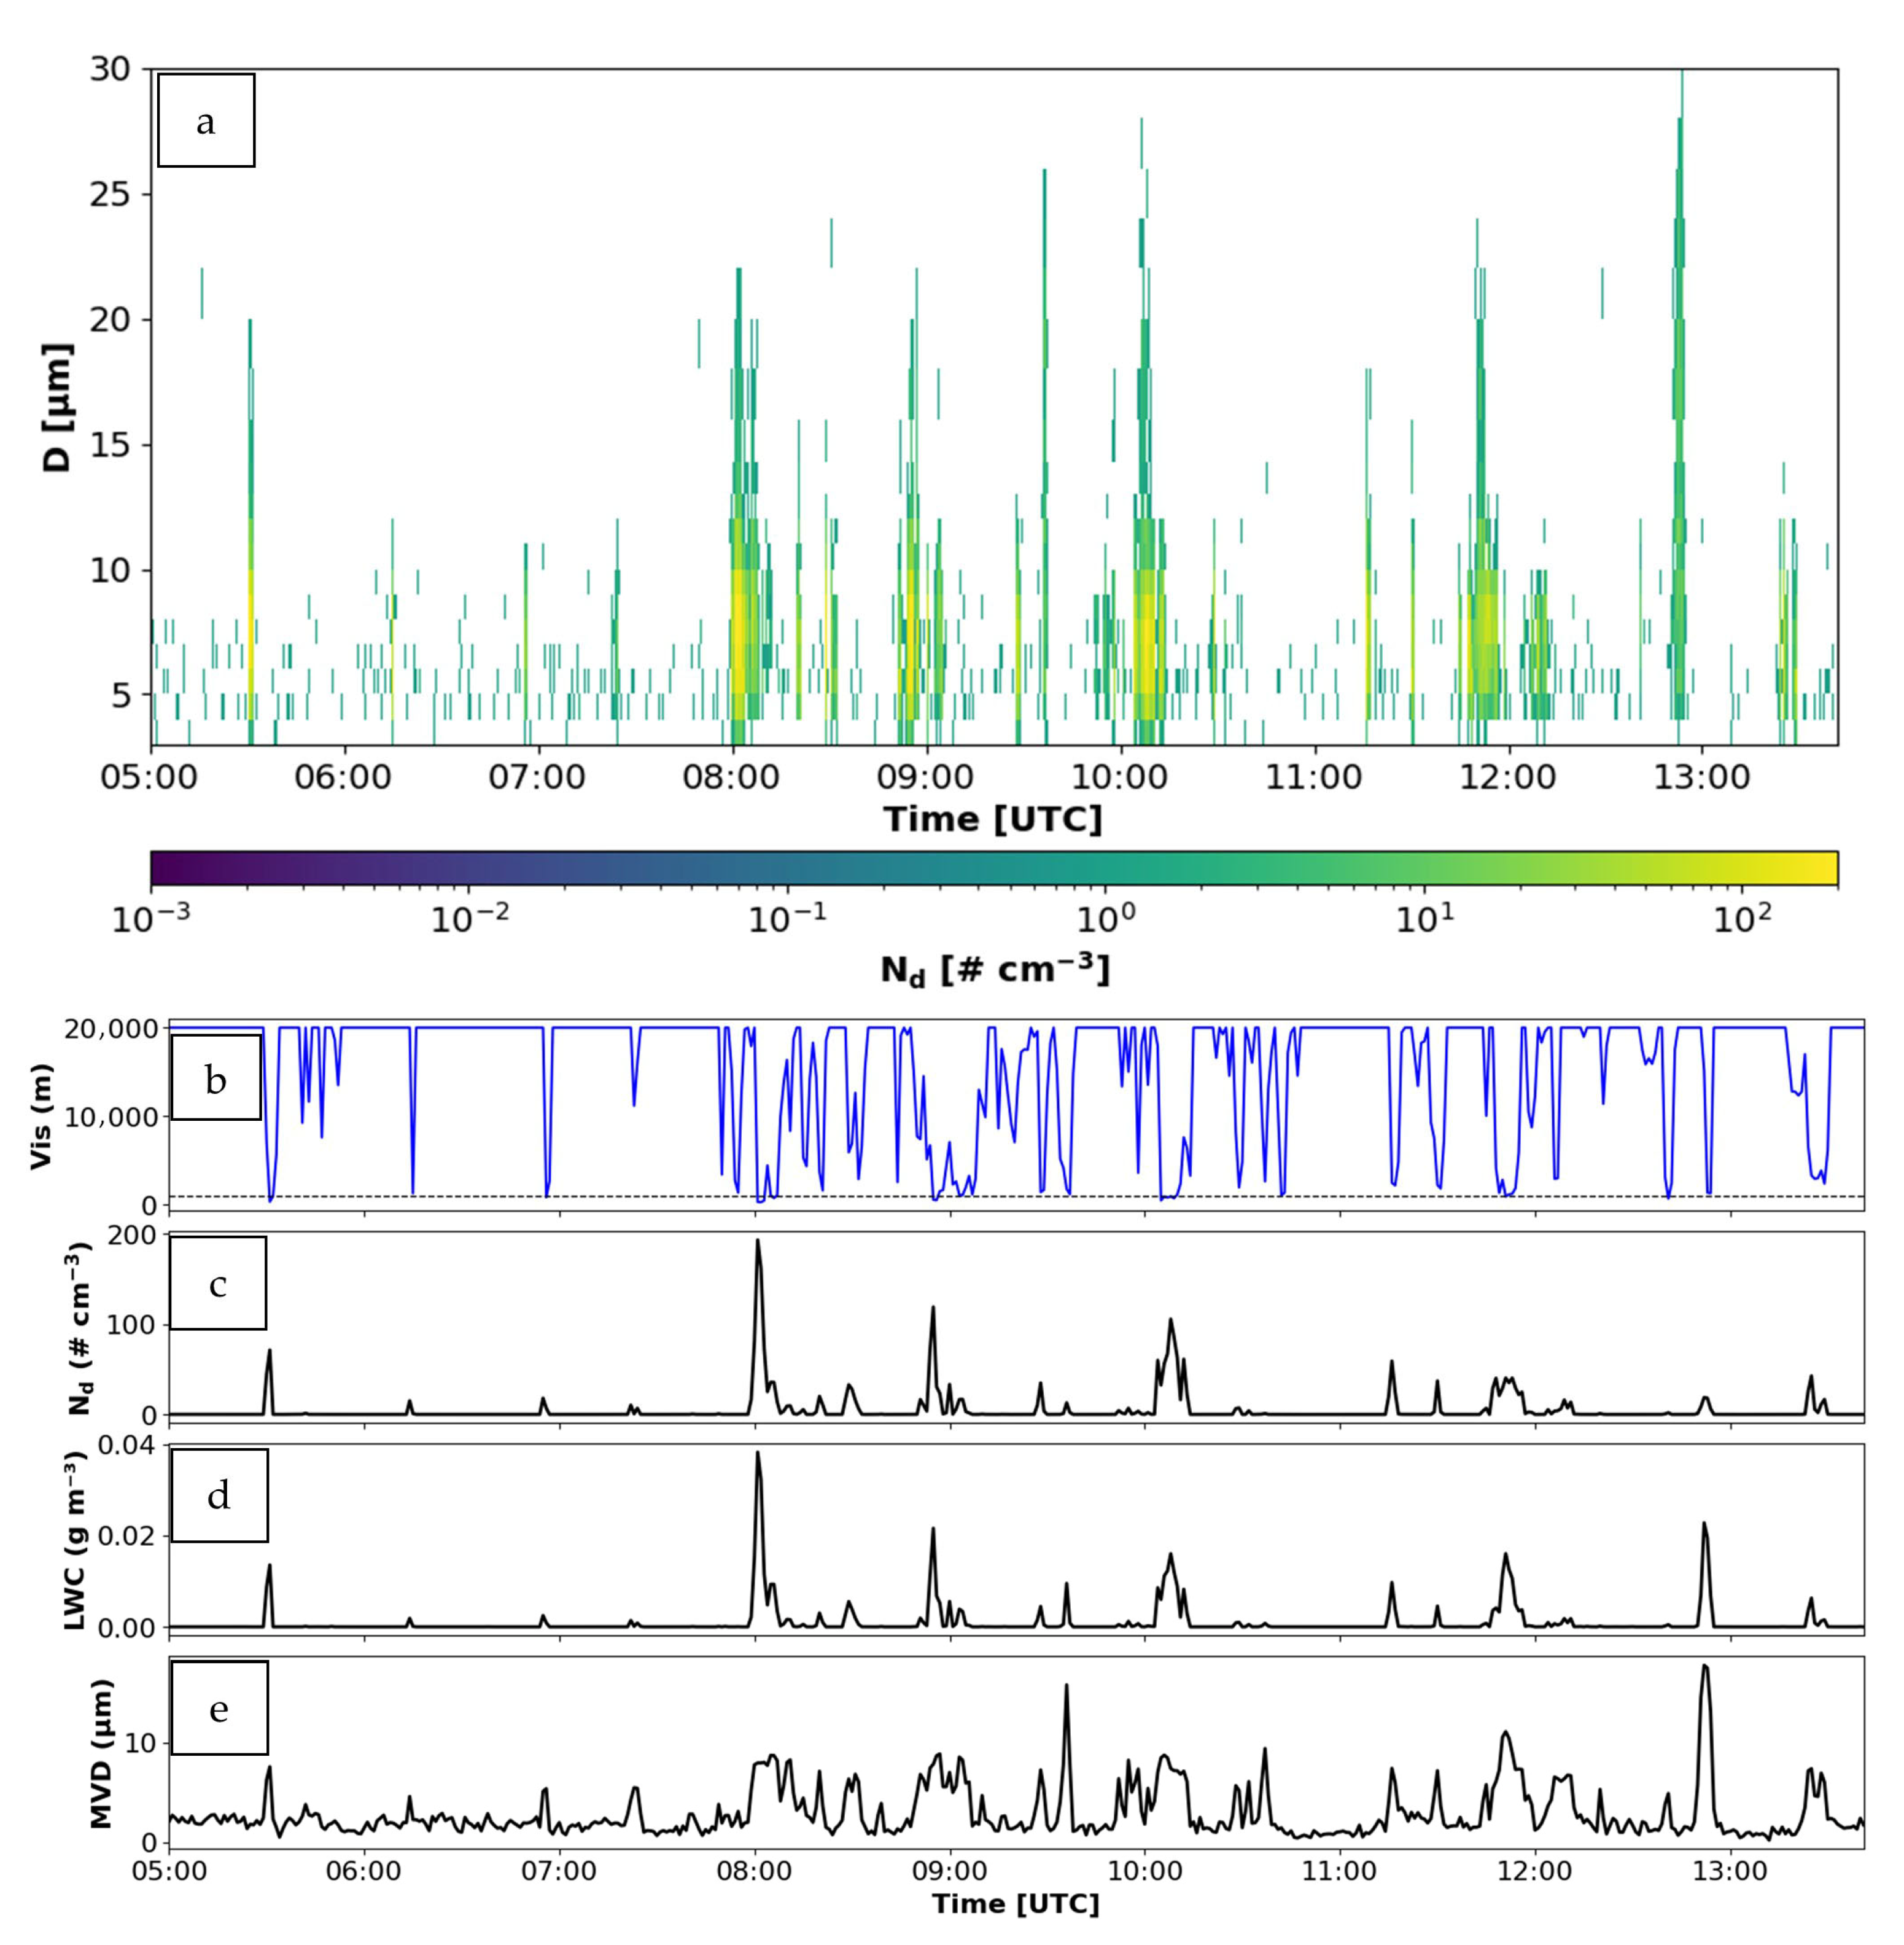
Time series of droplet spectra obtained from the FM120 are shown in Figure 5a. The color bar indicates contours of Nd. Several foggy segments are seen from 08:00 to 13:00 UTC where Nd values for each segment indicate strong temporal variability. Measured Vis, Nd, LWC, and MVD parameters are shown in Figure 5b and Figure 5c–e, respectively. Vis measurements were obtained from PWD at 1-min sampling rate and microphysical parameters are obtained from 1-s FM120 measurements. To enable a consistent comparison between the two datasets, FM120 data were visualized as 1-min averages using a moving average. Figure 5b shows the freezing fog event that is clearly observed between 05:30 to 13:40 UTC, during which Vis decreased to as low as 300 m. The Nd values reached up to 200 cm−3 (Figure 5c). During this FFG event, the LWC (Figure 5d) was less than 0.05 g m−3. Although the MVD was usually less than 10 µm (Figure 5e), it reached occasionally up to 20 µm. This characteristic of MVD was consistent with measurements of PWD Vis because decreasing Vis matched well with increasing Nd and MVD.

4.2. Aerosol Chemical and Physical Effects on Visibility

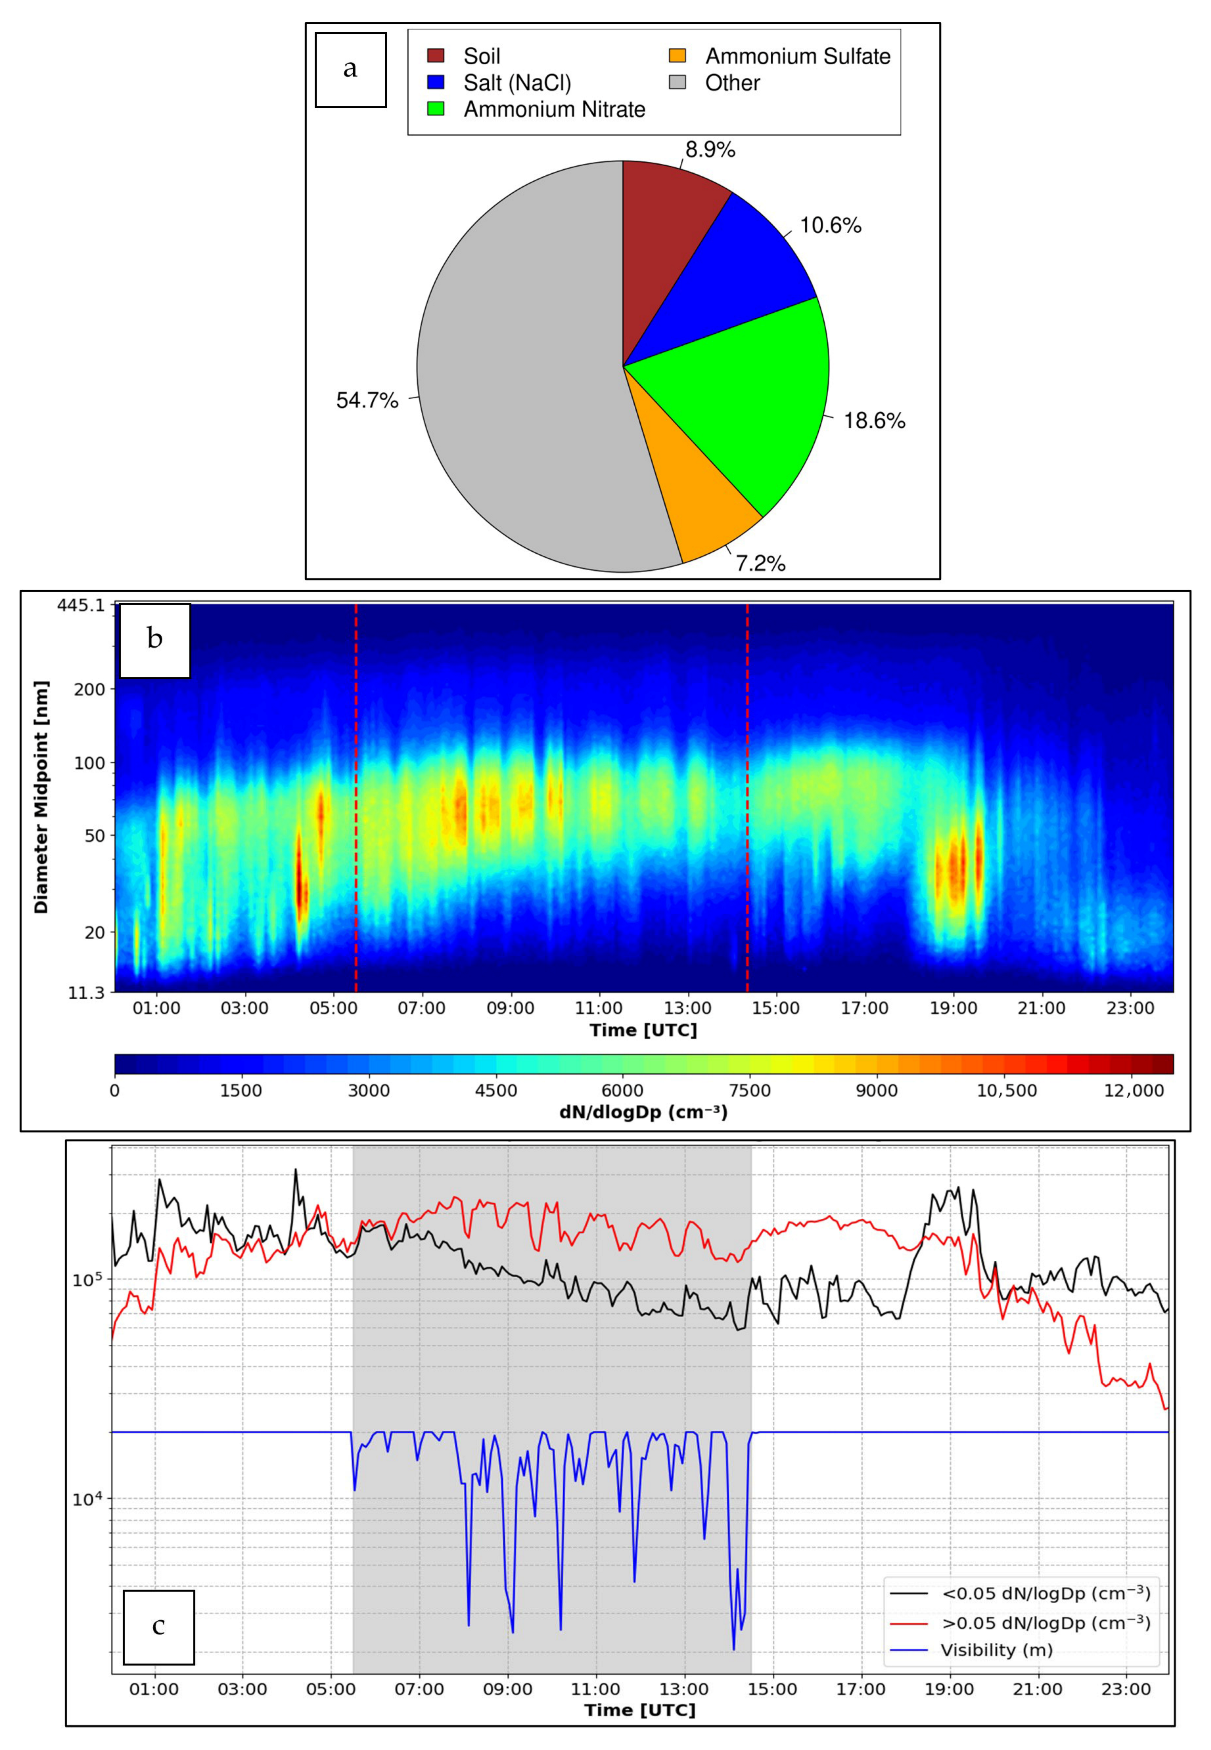
Aerosol chemical and physical characteristics affect fog MP properties. Figure 6a shows aerosol chemical composition for a 24 h period from 18 February 21:09 to 19 February 20:43 UTC for a MiniVol flow rate of 5 L min−1. Figure 6a displays the aerosol mass distribution from nine Teflon filters, showing that 45.3% of the mass is made up of inorganic compounds, while the remaining 54.7% is labeled as “Other”. NaCl and NH4NO3 compounds are the most common type of CCN or IN.
A time series of aerosol number size distribution from SMPS is shown in Figure 6b. Na spectral density reached its maximum at about 104 cm−3 with diameter of 40–80 nm size interval during freezing fog conditions. On Figure 6b, after 05:30 UTC, a rapid decrease in Na when D < 40 nm was observed but at about 19:00 UTC, small Na values were consistent with newly formed CCN particles after evaporation of water molecules from aerosol particles.
To show a comparison between PWD Vis versus Na, time series of PWD Vis and Na for small aerosols particles (Nas) with D < 0.05 μm and large aerosols particles (Nal) with D > 0.05 μm are shown in Figure 6c. Overall, decreasing Vis was consistent with decreasing Nas, suggesting increasing Nd. The Nal also indicated the same result, but its values were higher than Nas during fog but less before and after the fog event, indicating that large aerosols were acting as CCN.

4.3. Aerosol Composition Effect on Droplet Growth

Fog nucleation chemical properties are another factor affecting fog formation [45,46]. Figure 7a,b is obtained using Equations (1)–(5) and displays the classic and κ-Köhler curves for NaCl and NH4NO3 with Raoult and Kelvin effects. Calculations were performed using the dry aerosol density of 2200 kg m−3, I = 2, Ta = 268.15, and σw = 0.0756 Nm−1, and are used in the calculations. Using the classical Köhler approach, Sc and rc were calculated as 1.0015 and 0.608 µm for NaCl, and as Sc = 1.0020 and rc = 0.463 µm for NH4NO3. Using the κ-Köhler approach, the corresponding values were obtained as rc = 0.555 µm and Sc = 1.0016 for NaCl, and rc = 0.431 µm and Sc = 1.0021 for NH4NO3. If a droplet has grown to critical radius (r > rc), it is called an activated droplet, and can grow up to 100 µm [47], while collision-coalescence processes lead to large particles. Figure 7a,b shows that for higher S values, smaller aerosol particles can be activated. In Figure 7c, κ-Köhler curves are plotted for NaCl using κ = 1 and κ = 1.33 in order to demonstrate the effect of the κ parameter. These values were selected within the experimentally observed range of κ = 0.91–1.33 reported by Petters et al. [41]. It is seen in Figure 7 that rc for NH4NO3 is smaller than for NaCl aerosols, and this suggests that NH4NO3 aerosols will activate earlier than NaCl aerosols. Using NaCl and NH4NO3 aerosols, droplet growth rate is obtained using Equation (6). The result is shown in Figure 7d, in which NaCl particles acting as CCN led to formation of droplets of sizes 2 µm smaller than for the NH4NO3 aerosol case.

4.4. Freezing Fog and Density Effects on Vis

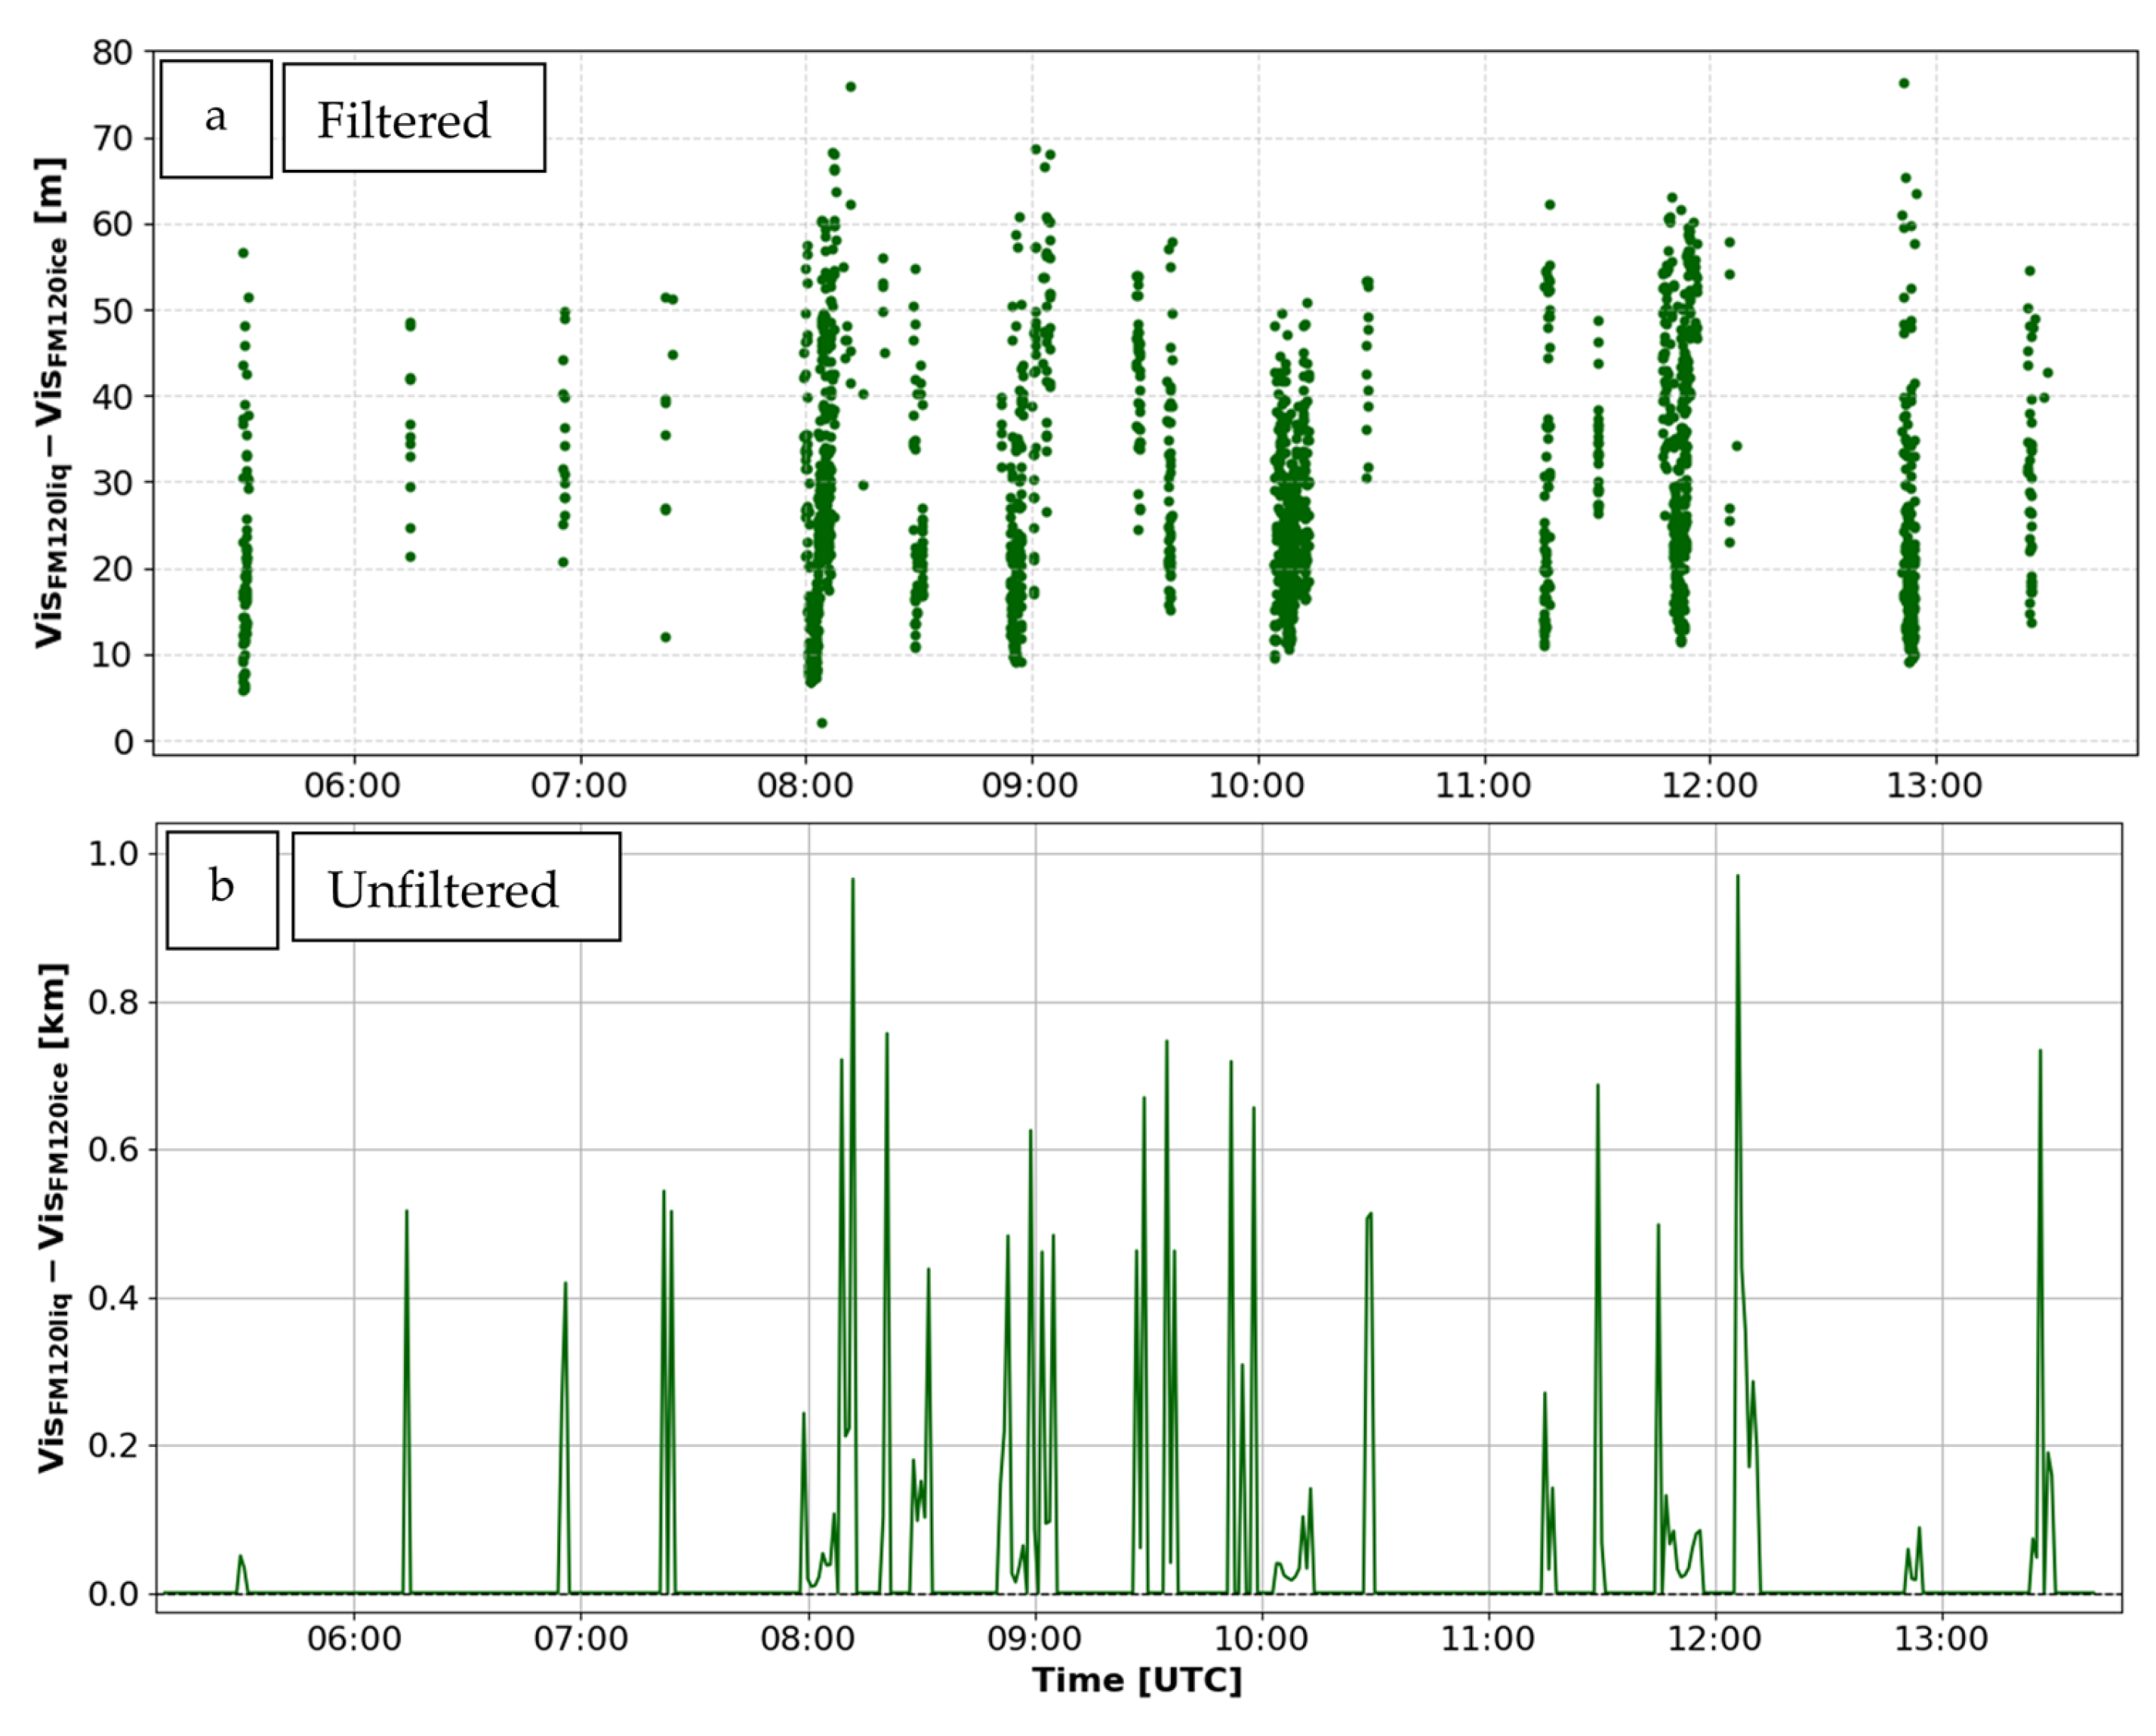
FFG occurs either when droplets in the air are supercooled (Ta~0 °C) or, on the ground, touch on the surfaces like aircraft and ships as well as ground structures. Assuming that the Nd = Ni in the air after freezing conditions, droplet size and volume change as a function ice crystal density. If we assume Nd = Ni and mw = mi (water mass = ice crystal mass), it can be shown, using Equation (14), that an estimated volume difference between droplet and ice crystal mass can be about 8.3% due to the lower density of ice. To investigate the impact of this density-related size change on Vis estimates, using Nd spectra obtained from FM120 measurements (filtered using Nd > 1 cm−3 and LWC > 0.005 g m−3 [48]), we calculated the differences between Visliq and Visice, and the results are shown in Figure 8a. This figure shows that difference can reach up to about 80 m, which is significant compared to 1 km Vis criteria. Similarly, without using any filtering of the data, Vis differences between the FFG and IFG cases can be up to 1 km depending on Vis magnitude (Figure 8b).

4.5. Visibility Parameterization

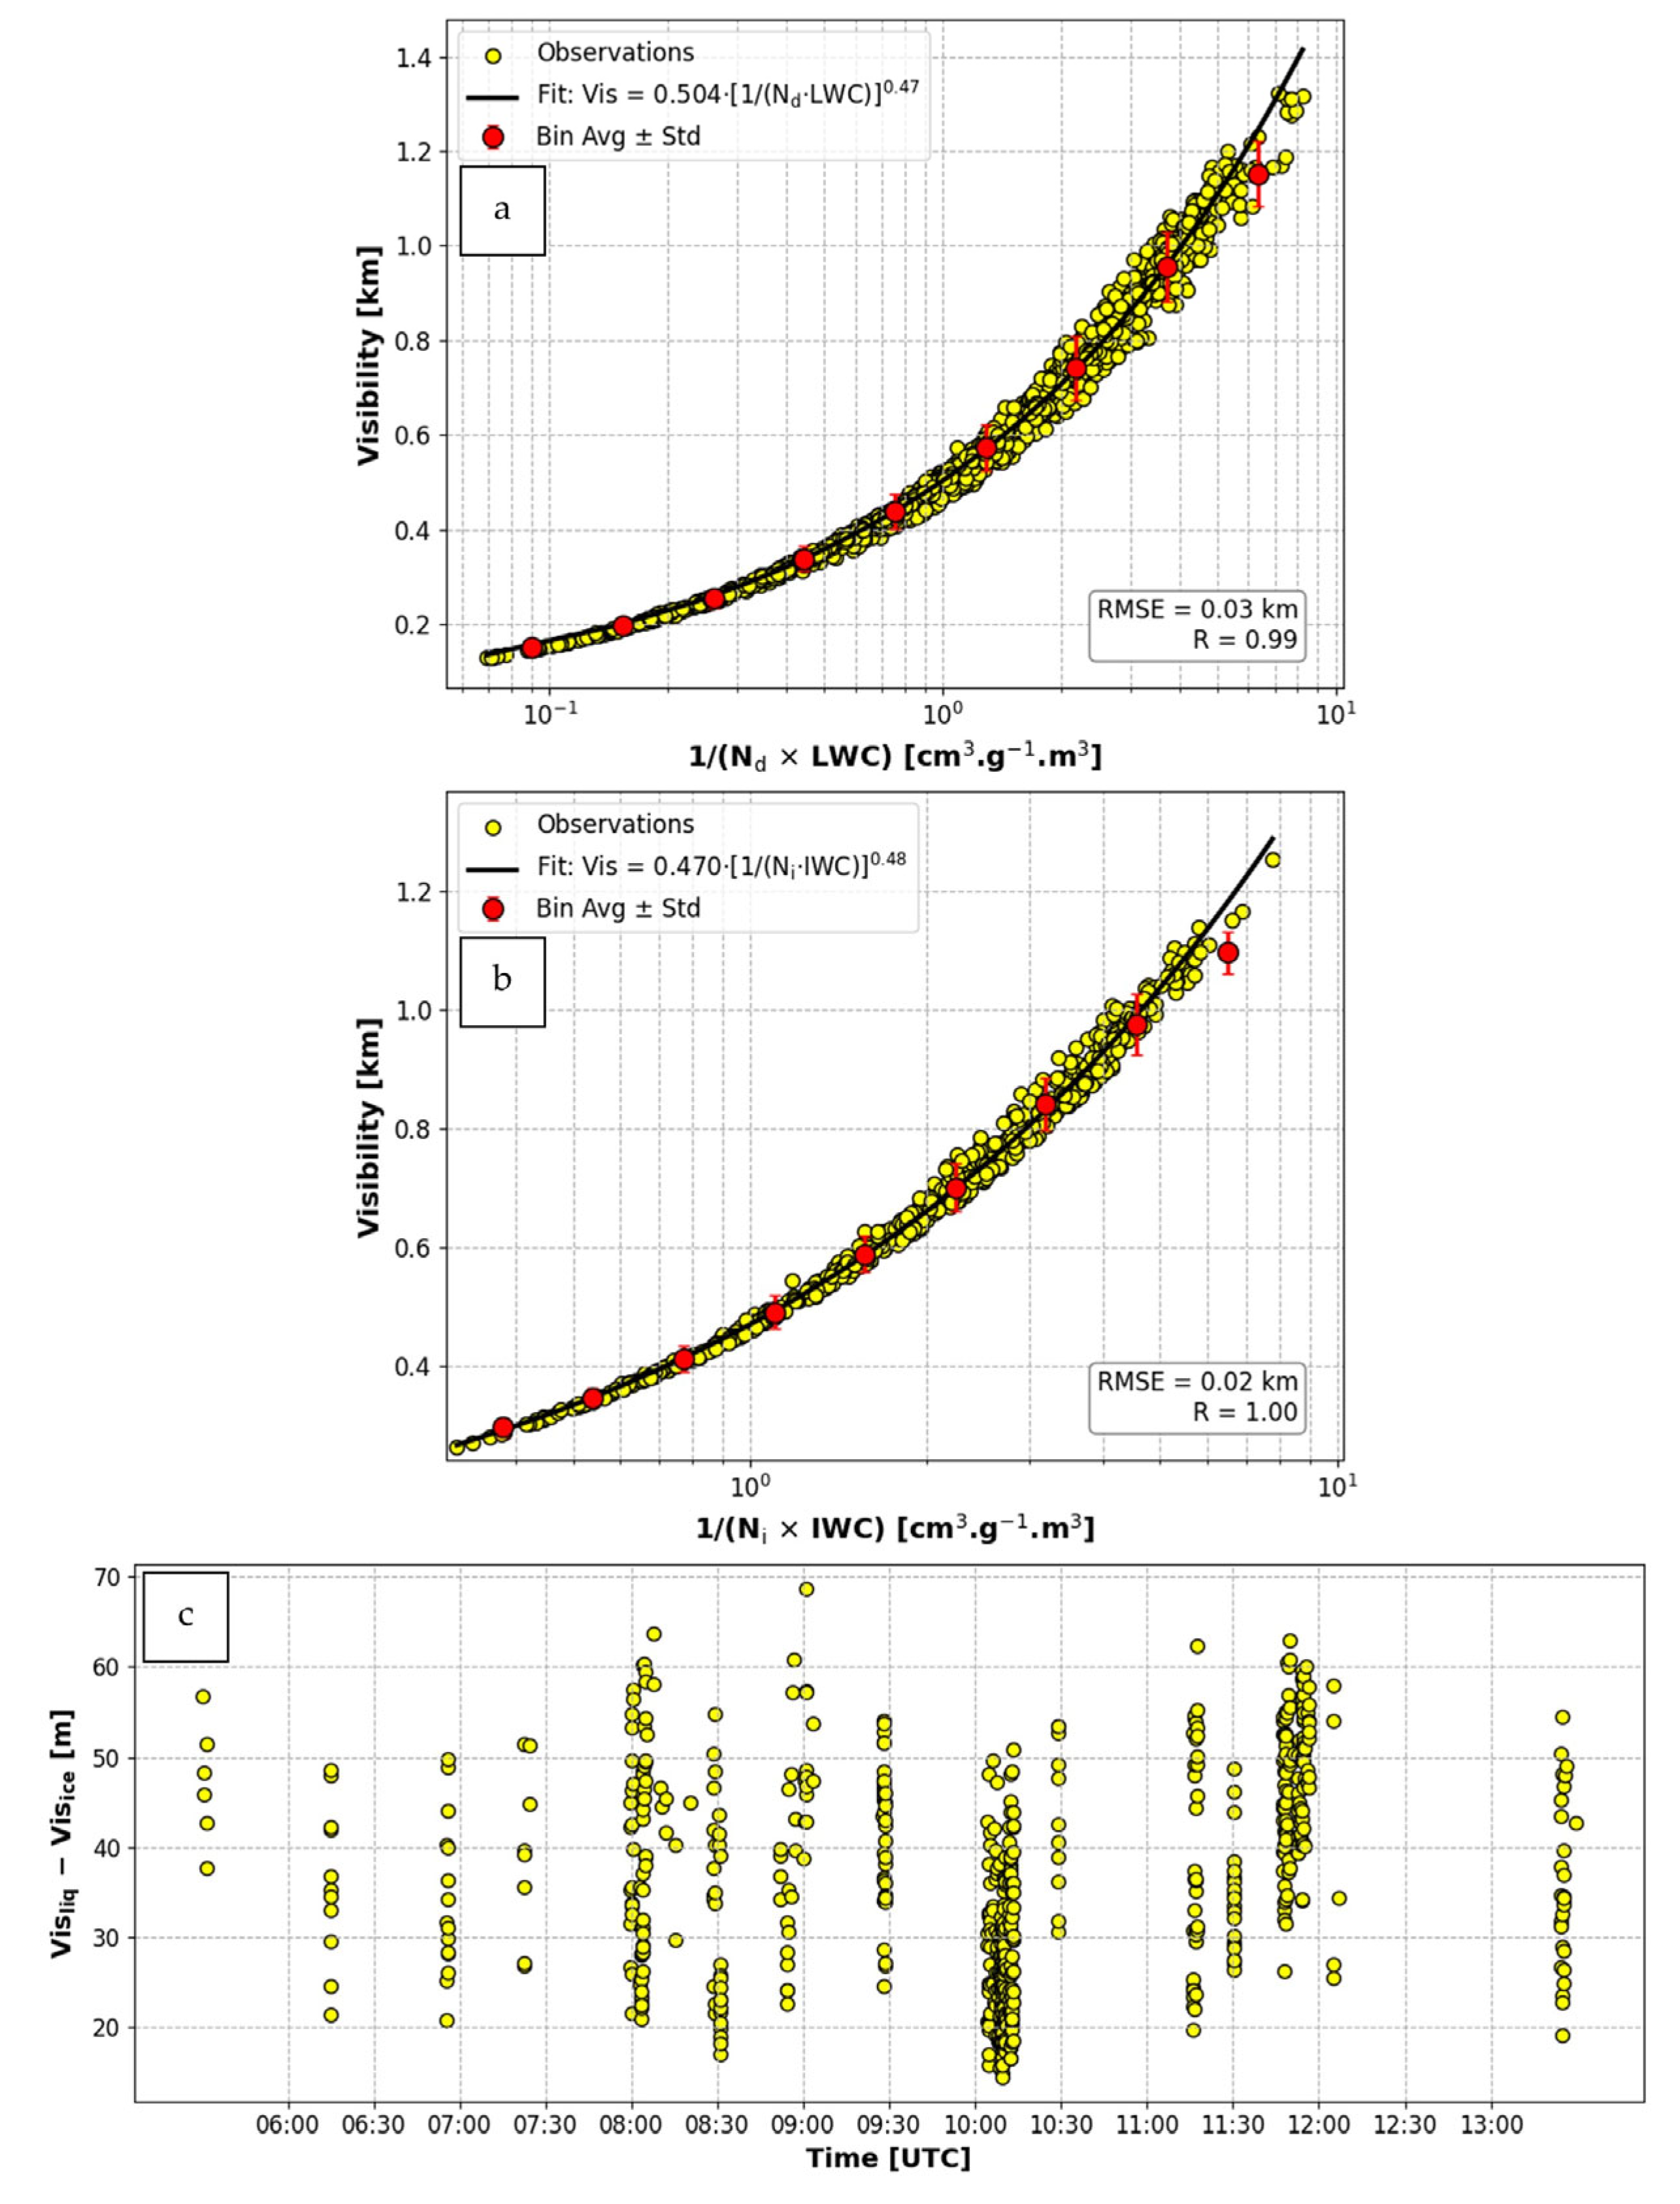
Visibility parameterization can be derived in different ways using (1) bulk MP parameters such as LWC (IWC), Nd (Ni), and MVD (for liquid droplets as MVDliq and ice crystals as MVDice), and (2) assumed particle size distribution parameters [24]. Here, the first method is applied, and the results are compared with theoretical estimations and previously developed parameterizations. It should be noted that the results are site-specific and depend on the measurements. Similar to Gultepe et al. [17,19], Vis was estimated using Equation (9), derived from Koshimider law based on βext calculation using FM120 spectral measurements. Both liquid droplets and ice particles are assumed to be spherical. Vis for supercooled liquid fog droplets or spherical ice crystals are calculated using Equations (17) and (18), respectively, and then Vis is plotted as a function of fog index (FI = 1/(Nd LWC) [17]). Figure 9a,b show Vis as a function of FI, including observed data points and a fit with standard deviations (Sd) values. The fitted visibility parameterizations for the liquid and ice phases are given as:
V i s l i q = 0.504 N d L W C 0.47 ,
and
V i s i c e = 0.431 N i I W C 0.48 .
The fits on Figure 9a,b had root mean square errors as 30 m and 20 m, respectively, but maximum error can be up to 100 m for both fits. Figure 9c shows differences (mean as 31.16 m) between Vis for liquid droplets and spherical ice crystals conditions. This shows that if a FFG (with spherical ice crystals) event happens, fog Vis can decrease up to 70 m.

5. Discussion

Fog prediction can be important for aviation and marine environments as well as economic and ecosystem planning. The rapid changes in fog intensity (represented with Vis) are related to the short time and spatial scales as well as nonlinear relationships between surface and atmospheric conditions. There are several methods for fog prediction that includes the rule-based techniques [49,50], statistical [51,52] and numerical forecasting [51,52,53,54], and integrated nowcasting methods [55,56]. Lately, artificial intelligence (AI) techniques are being applied for Vis predictions based on observations and NWP models [57].
Here, some issues related to Vis predictions and measurements are provided that include fog size changes at the cold temperatures, uncertainty in measuring and calculation of Vis, particle density, as well as theoretical concepts.

5.1. Freezing Droplet Size Effect on Vis Calculations

The Vis parameterization formula is modified to obtain Vis as a function of MVD when droplet freezes up. For this purpose, Equation (13) as a function of MVD can be expressed as follows:
N d = 1 k L W C M V D 3 ,
where k = (4/3)πρ. By replacing Nd in Equations (17) and (18) with Equation (21), Vis can be rewritten for liquid droplets as:
V i s l i q = α 1 k liq L W C M V D 3 / 2 2 γ ,
and for freezing droplets (ice particles) as:
V i s i c e = α 1 k ice I W C ( M V D + Δ r ) 3 / 2 2 γ .
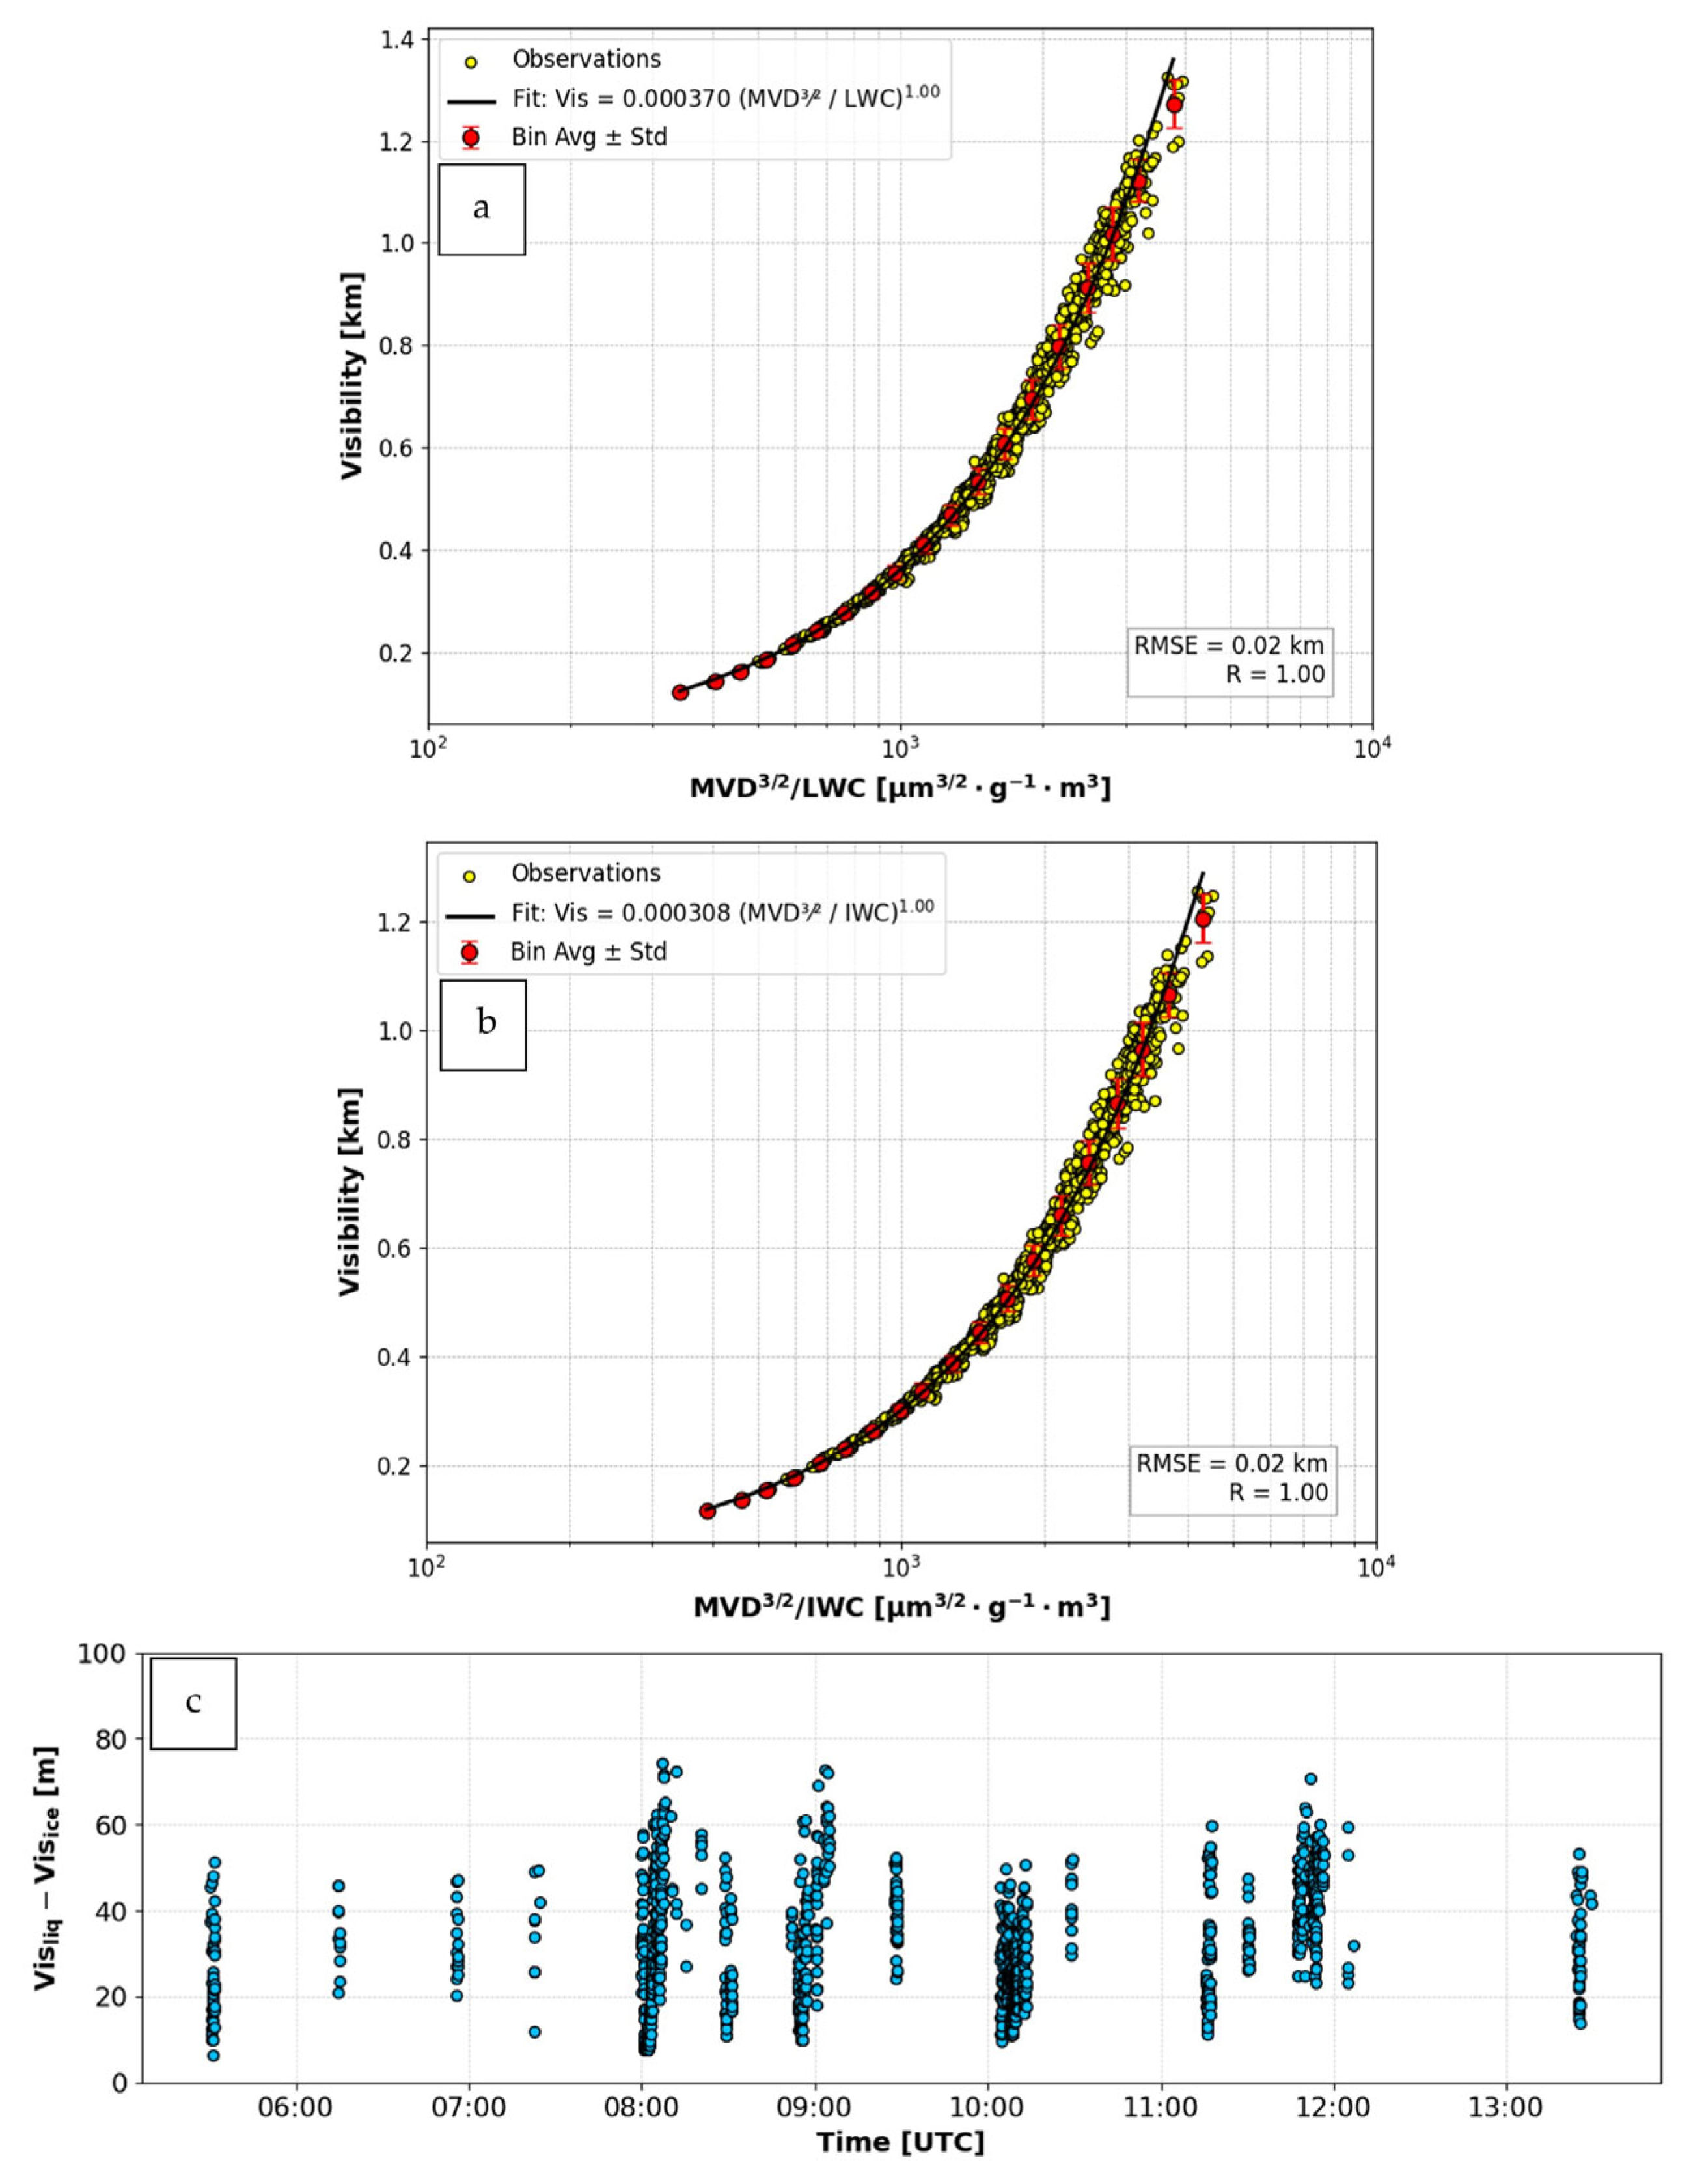
In Equations (22) and (23), kliq = (4/3)πρw, kice = (4/3)πρice. Figure 10a shows Vis versus MVD and LWC and Figure 10b Vis versus MVD and IWC, along with best fits to the observations. Figure 10c shows the difference between them based on fits (Visliq − Visice). This difference can be up to about 60–70 m. Note that this figure shows the effect of size enlargement due to icing conditions, and it can be important for Visice predictions. Therefore, freezing fog particle size enlargement should be added to Vis calculations that can affect up to 10% variation in Vis estimates.

5.2. Uncertainty in Measurement of Microphysical Parameters

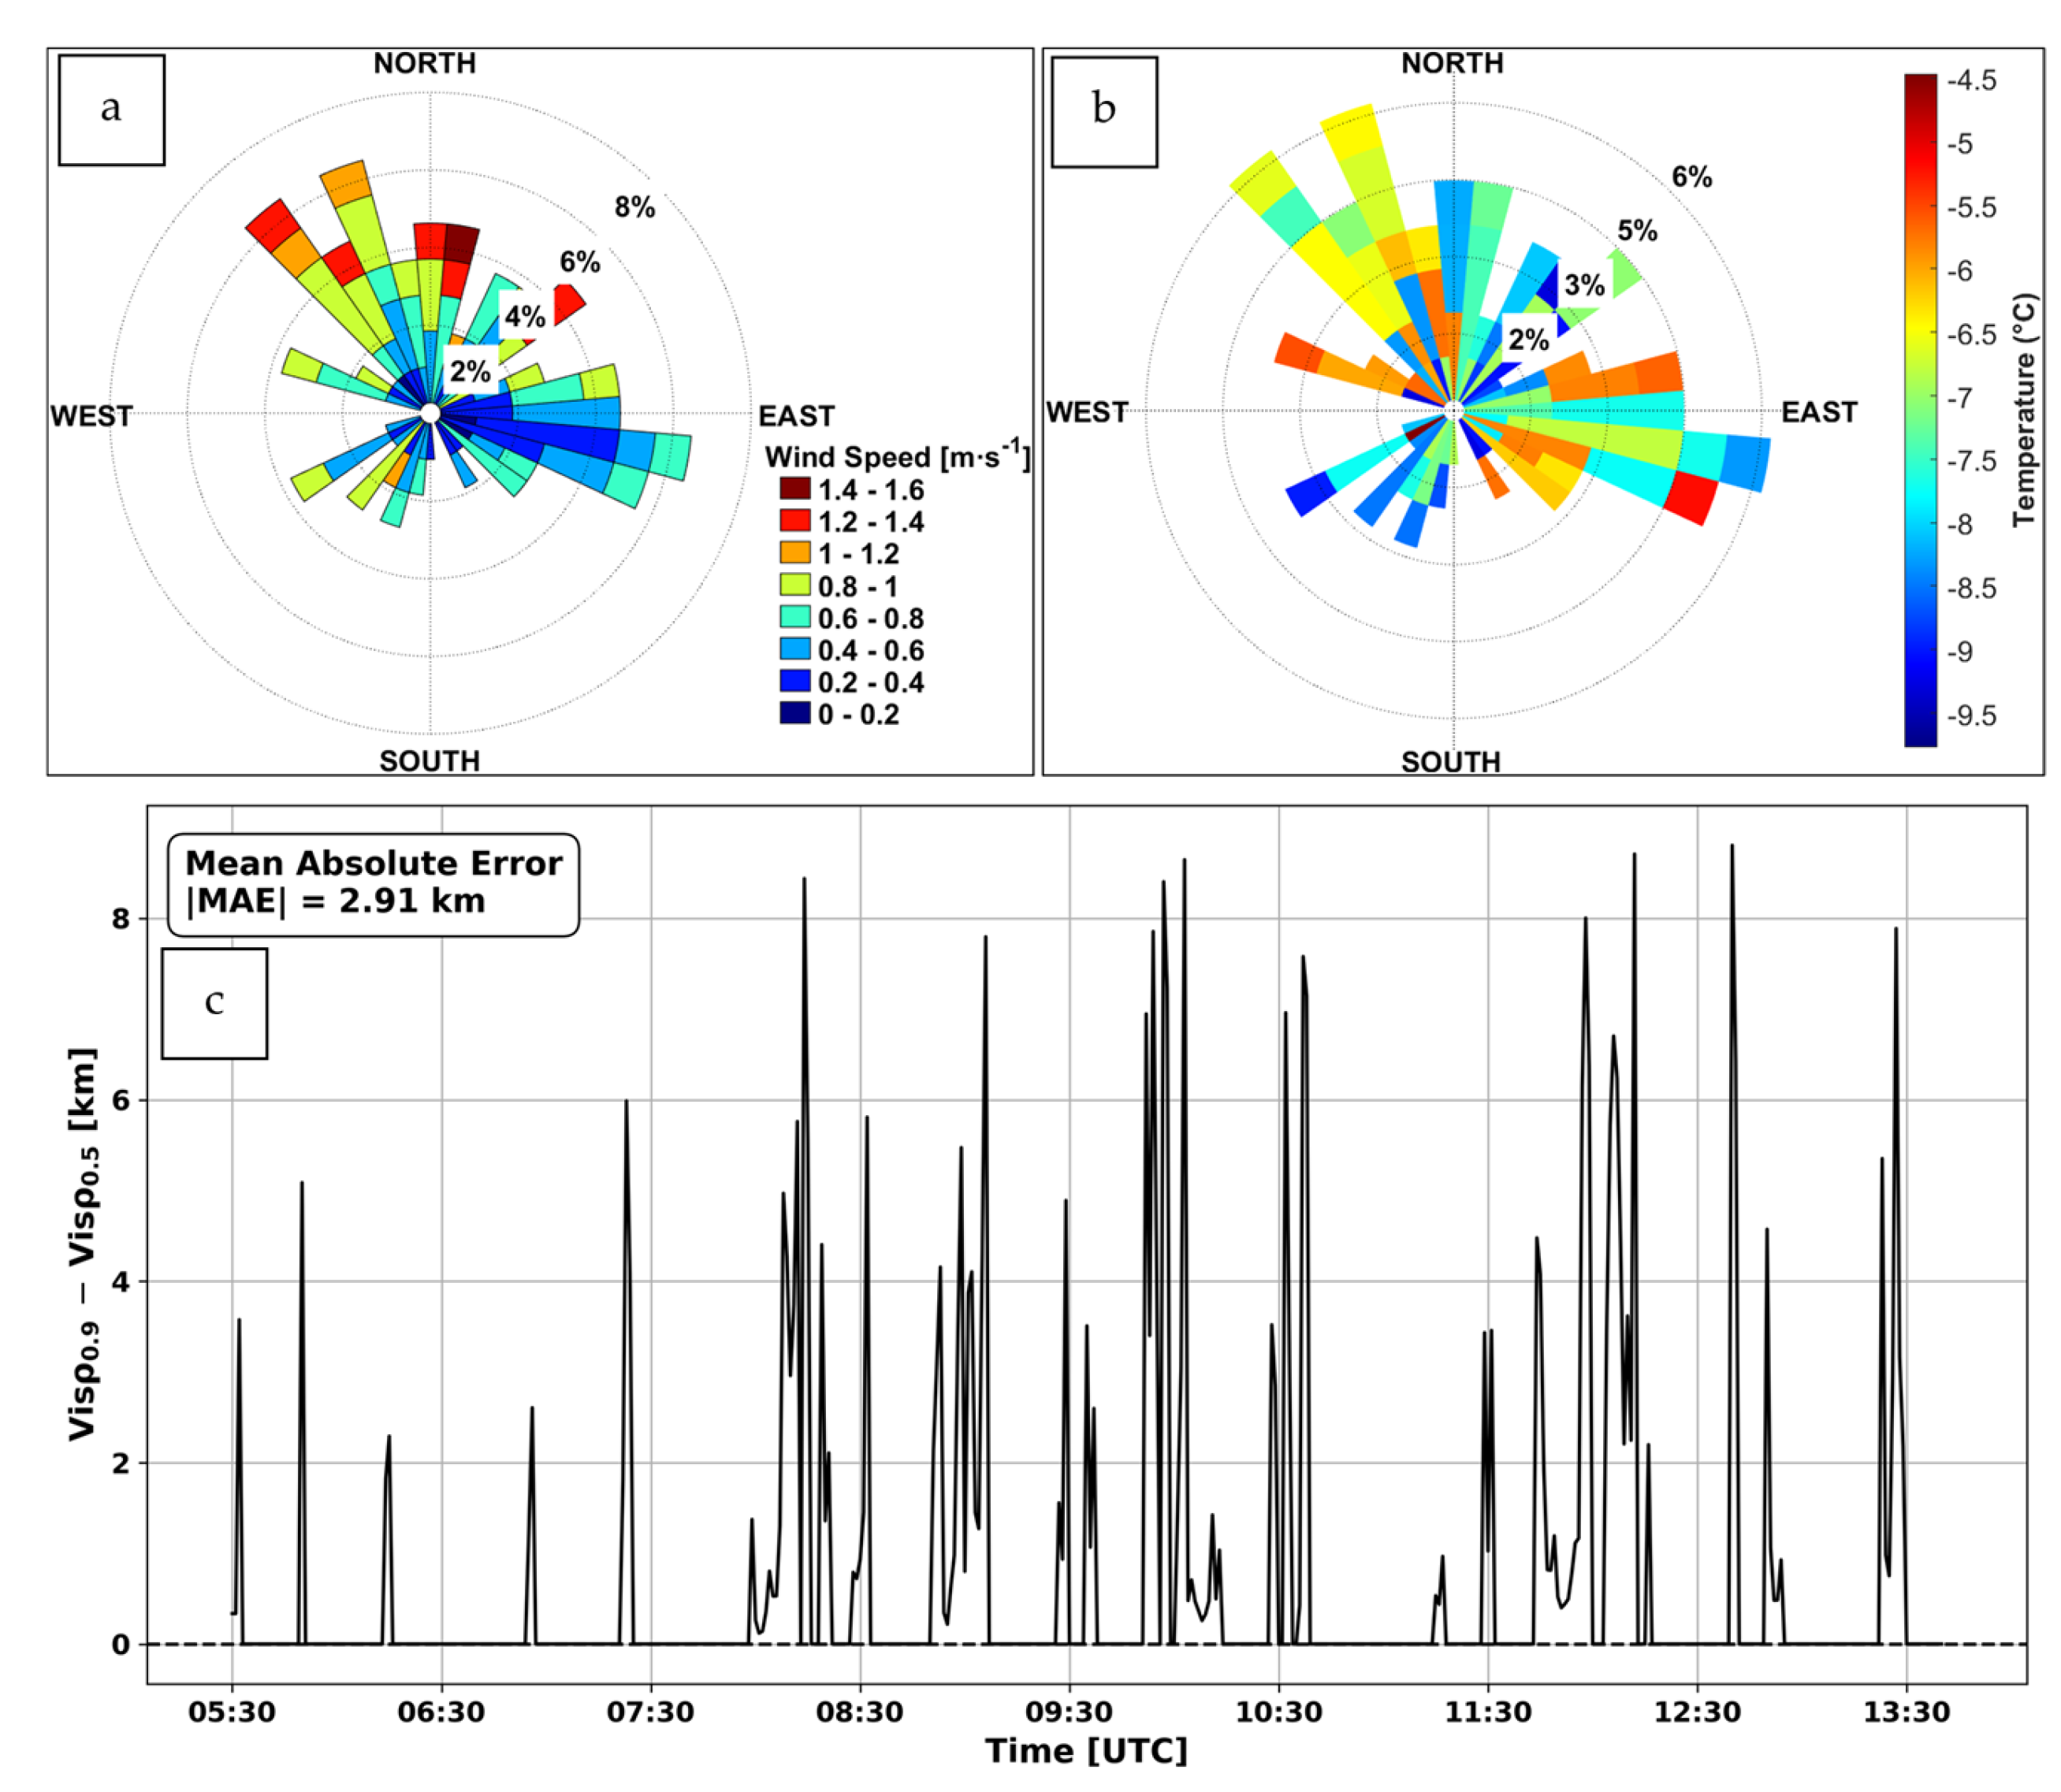
Measurements of droplet spectra can be highly affected by the wind speed (Uh) and direction. Here, true air speed (TAS) used was about 25 m s−1 (measured). If TAS decreases due to changing wind direction changes, Nd increases significantly. This uncertainty can be assumed as negligible during low Uh conditions. Figure 11a shows Uh rose plot and Figure 11b conditional Ta plot with respect to wind speed criteria. The wind speed was typically less than 1 m s−1 during Feb 19 (Figure 11a), and cold air advection was both northerly and easterly, but T was usually between −6 °C and −9 °C. This suggests that the freezing fog event formed in a stable atmospheric boundary layer. Figure 11c shows the ice particle density effect on Vis calculated using Equation (14), assuming ρi = 0.9 g cm−3 (glazed ice) and 0.5 g cm−3 (rimed ice). This plot shows that ice crystal density effect on Vis can be very large, up to 4–8 km, and is related to Vis magnitude. Further research on ABL ice fog conditions is needed to better evaluate Vis predictions.

5.3. FM120 and PWD Vis Comparison

In the literature, significant differences have been stated for Vis obtained from PWD and FM120 measurements [58]. These differences can be due to various reasons, including calibration errors, assumed coefficients in the calculations, as well as averaging time and space scales. Figure 12a and Figure 12b shows PWD and FM120 Vis time series, and the differences in Vis comparisons for liquid and freezing droplets (spherical ice crystals) are shown in Figure 12c and Figure 12d, respectively. As indicated by the figures, ΔVis for both liquid (Figure 12c) and ice cases (Figure 12d) can be more than a few km. Further research is needed to better understand these differences.

5.4. Visibility Comparisons Using Observations and Parameterizations

Verification of the bulk parameterization equations derived here is obtained using FM120 Vis values calculated from the droplet spectra. Determining the visibility, Gultepe et. al. [19] developed a parameterization as:
Vis = 1.002 L W C × N d 0.6473
Equation (24) is compared with the Kunkel [31] method that used βext values directly related to LWC for visibility calculation. The βext as a function of LWC is given by Kunkel [31] as:
β ext   = 144.7 L W C a .
where a = 0.88.
Figure 13 shows Vis versus LWC scatter plot for Equations (9), (14), (22), (24) and (25), assuming various fixed reff and using Nd = 10 and 100 cm−3. Vis values from Equation (24) [19] for marine environmental conditions are relatively higher than the current work. With Nd = 100 cm−3, Vis comparisons are found to be comparable to the parameterized ones of the current work. Using Equation (14) with reff = 5 µm, Gultepe et al.’s [24] Vis values are also found to be comparable with the current work results. Overall, the variability among the results suggests that Vis parameterizations are highly dependent on variability in microphysical parameters and for FFG conditions. It is found out that ρice changes due to riming can also play an important role for significantly reducing Vis. This suggests that decreasing ice crystal density can further reduce Vis when riming take a place.

6. Conclusions

Vis associated with freezing fog conditions in an alpine mountain valley was studied. Microphysical parameters including LWC (IWC), Nd (Ni), and MVD (or reff) along with dynamic parameters were studied using observations obtained during a fog event that occurred on 19 February 2022 during the CFACT campaign. Aerosol and droplet spectral characteristics are used to study FFG Vis parameterizations considering aerosol composition and particle density. Based on the results, the following conclusions are drawn:
  • Synoptic weather conditions are found to affect local fog conditions and colder temperature advection likely created instability for FFG formation over the complex terrain. Moving an HP system over the project area (e.g., Heber Valley) was a reason for FFG formation.
  • Freezing fog can occur at temperatures as low as −10 °C when IR cooling at night happens.
  • Freezing fog dissipation is initiated after sunrise with increasing SW radiative heating.
  • Aerosol composition effect on Vis can be significant and can reach up to 1000 m at low LWC values, and droplet size can increase up to 2 µm affecting Vis.
  • Aerosols had an occurrence of 54.7.3% based on Teflon filter observation and were not included in the analysis. Only inorganic components are considered based on availability of the observations. Among the inorganic components, soil-based aerosols accounted for 8.9%, NaCl for 10.6%, NH4NO3 for 18.6%, and (NH4)2SO4 for 7.2%.
  • Freezing droplet density with riming can be an important factor reducing Vis down to at least 50% but freezing fog density can affect Vis at about 10% during FFG event.
  • Differences in Vis parameterizations suggest that FFG and WFG conditions can be different, and this can be more than 50% when the crystal shape and density change significantly.
  • Large differences between PWD Vis and FM120 Vis can be significant and reach up to 1 km, and that needs to be further researched.
Overall, because of a possible increase in Ta based on climate simulations, FFG events are expected to increase in the northern latitudes and that can lead to much lower Vis values. This suggests that cold fog intensity (Vis) in FFG events will likely increase over the high mountainous and polar regions. For this reason, further cold fog studies need to be performed, and an ice fog project should be considered in the northern latitudes.

Author Contributions

The authors contributed the manuscript in following ways: Conceptualization, O.D. and I.G.; methodology, O.D.; software, O.D. and S.W.H.; validation, O.D., I.G., E.R.P. and A.G.H.; formal analysis, O.D., A.G.H., G.C.-C. and S.W.H.; investigation, O.D., I.G., A.P. and Z.P.; resources, S.W.H. and G.C.-C.; data curation, O.D., S.W.H., A.P. and G.C.-C.; writing—original draft preparation, O.D. and I.G.; writing—review and editing, O.D., I.G. and S.D.; visualization, O.D., S.W.H., A.P. and G.C.-C.; supervision, I.G. and O.S.; project administration, Z.P., I.G. and E.R.P.; funding acquisition, Z.P. and E.R.P. All authors have read and agreed to the published version of the manuscript.

Funding

This project was funded by United States National Science Foundation Award #2049100. The NSF Physical and Dynamic Meteorology program managers, the NSF LAOF program, and the NCAR EOL managers are all appreciated. The Cold Fog Amongst Complex Terrain (CFACT) project is also partially funded by Scientific and Technological Research Council of Türkiye (TUBITAK) with project number as: 221N057.

Data Availability Statement

The CFACT field campaign catalog and observations are available at a data repository managed by NCAR’s Earth Observing Laboratory at https://catalog.eol.ucar.edu/cfact. The project data is also avaliable from the University of Utah and Ontario Technical University (OntTecU) upon request. Software Availability: All data processing were performed using MATLAB R2022b (The MathWorks Inc., Natick, MA, USA) and Python 3.12 (Python Software Foundation, https://www.python.org/). Codes are available in request from the first author.

Conflicts of Interest

The authors declare no conflict of interest.

Abbreviations

The following abbreviations are used in this manuscript:
ABLAtmospheric boundary layer
a.g.l.Above ground level
AIArtificial intelligence
CBrightness contrast threshold
CCNCloud condensation nuclei
CL31hThe horizontal looking CL31 ceilometer
CFACTCold Fog Amongst Complex Terrain
DDiameter of droplet
DC ATDeer Creek Aerosol Trailer
DC FTDeer Creek Flux Tower
DC MPDeer Creek Microphysics supersite
DC SSDeer Creek Supersite
DSDDroplet size distribution
DvWater vapor diffusion coefficient in air
EOLEarth Observing Laboratory
e*(r)Equilibrium vapor pressure over a solution droplet
esSaturated water vapor pressure
es,w (∞)Saturated water vapor pressure over a flat pure water surface
FFGFreezing fog
FIFog index
FM120Fog monitor model FM-120
GCIPGround cloud imaging probe
GFSGlobal Forecast Model
GOESGeostationary Operational Environmental Satellites
HPHigh-pressure
iVan’t Hoff factor
IFGIce fog
IMPROVEInteragency Monitoring of Protected Visual Environement
INIce nuclei
IOPIntensive Observation Period
IRInfrared
IWCIce water content
KThermal conductivity coefficient
LANFEXThe Local and Non-local Fog Experiment
LAOFLower Atmospheric Observing Facilities
LDRLinear depolarization ratio
LvLatent heat of vaporization
LWCLiquid Water Content
mNumber of particle spectral bins
MATERHORNMountain Terrain Atmospheric Modeling and Observations
MAEMean Absolute Error
miIce crystal mass
MPMicrophysical
MsMolecular weight of solute
msSolute mass
MSLMean sea level
MTASMiniVol tactical air sampler
MVDMean volume diameter
MVDiceMean volume diameter for ice crystals
MVDliqMean volume diameter for liquid droplets
mwWater mass
n(r)Particle number concentration with radius r
NaClSodium chloride
NalLarge aerosols particles
NasSmall aerosols particles
NaAerosol number concentration
NCARNational Center for Atmospheric Research
NdDroplet number concentration
NH4NO3Ammonium Nitrate
(NH4)2SO4Ammonium Sulfate
NiIce crystal number concentration
NSFNational Science Foundation
NWPNumerical weather prediction
OntTecUOntario Technical University
P0Surface pressure
PM10Particular matter with diameter < 10 micrometer
PRPrecipitation rate
PWD22Present weather detector and visibility sensor model 22
qvVapor mixing ratio
QeffExtinction efficiency
RUniversal gas constant
rDroplet radius
r2Spherical particle cross-sectional area when multiplied by π
rcCritical radius
rdryDry radius
reffEffective radius
RHwRelative Humidity with respect to water
RIDRosemount Icing Detector
riFreezing droplet radius when assume as ice
RvSpecific gas constant of water vapor
rwLiquid droplet radius
SSaturation ratio with respect to water
sSupersaturation
ScCritical saturation ratio
SdStandard deviation
SDsSupercooled droplets
SMPSScanning mobility particle sizer
SWShortwave
SWIRShortwave infrared
SWRFShort wave radiative flux
T0Surface air temperature
TaAir temperature
TASTrue air speed
TdDew point temperature
TPWDTemperature at the PWD inlet
UhWind speed
UUUniversity of Utah
VisVisibility
VisiceVisibility for ice crystals
VisliqVisibility for liquid droplets
VsVolume of the dry particulate matter
VwVolume of the water
WFGWarm fog
WRFWeather Research and Forecast Model
βBackscatter coefficient
βextExtinction coefficient
βhHorizontal backscattering ratio
ΔrDifference between freezing droplet radius and liquid droplet radius
ρiDensity of ice
ρlDensity of water droplet
ρwDensity of water
σwSurface tension of water in the air
κParticle hygroscopicity (Kappa) parameter

References

  1. AMS (American Meteorological Society). Glossary of Meteorology; AMS: Amsterdam, The Netherlands, 2024; Available online: https://glossary.ametsoc.org (accessed on 14 June 2025).
  2. Gultepe, I.; Pearson, G.; Milbrandt, J.A.; Hansen, B.; Platnick, S.; Taylor, P.; Gordon, M.; Oakley, J.P.; Cober, S.G. The Fog Remote Sensing and Modeling Field Project. Bull. Amer. Meteor. Soc. 2009, 90, 341–360. [Google Scholar] [CrossRef]
  3. Gultepe, I.; Heymsfield, A.J.; Gallagher, M. Arctic Ice Fog: Its Microphysics and Prediction. In Physics and Chemistry of the Arctic Atmosphere; Kokhanovsky, A., Tomasi, C., Eds.; Springer Polar Sciences; Springer International Publishing: Cham, Switzerland, 2020; pp. 361–414. ISBN 978-3-030-33565-6. [Google Scholar]
  4. Heymsfield, A.J.; Sabin, R.M. Cirrus Crystal Nucleation by Homogeneous Freezing of Solution Droplets. J. Atmos. Sci. 1989, 46, 2252–2264. [Google Scholar] [CrossRef]
  5. Sassen, K.; Dodd, G.C. Homogeneous Nucleation Rate for Highly Supercooled Cirrus Cloud Droplets. J. Atmos. Sci. 1988, 45, 1357–1369. [Google Scholar] [CrossRef]
  6. Gultepe, I.; Heymsfield, A.J.; Gallagher, M.; Ickes, L.; Baumgardner, D. Ice Fog: The Current State of Knowledge and Future Challenges. Meteorol. Monogr. 2017, 58, 4.1–4.24. [Google Scholar] [CrossRef]
  7. Pu, Z.; Pardyjak, E.R.; Hoch, S.W.; Gultepe, I.; Hallar, A.G.; Perelet, A.; Beal, R.; Carrillo-Cardenas, G.; Li, X.; Garcia, M.; et al. Cold Fog Amongst Complex Terrain. Bull. Am. Meteorol. Soc. 2023, 104, E2030–E2052. [Google Scholar] [CrossRef]
  8. Noonkester, V.R. Coastal Marine Fog in Southern California. Mon. Weather Rev. 1979, 107, 830–851. [Google Scholar] [CrossRef]
  9. Leipper, D.F. Fog on the U.S. West Coast: A Review. Bull. Amer. Meteor. Soc. 1994, 75, 229–240. [Google Scholar] [CrossRef]
  10. Kloesel, K.A. A 70-Year History of Marine Stratocumulus Cloud Field Experiments off the Coast of California. Bull. Amer. Meteor. Soc. 1992, 73, 1581–1585. [Google Scholar] [CrossRef]
  11. Gultepe, I.; Milbrandt, J.A. Probabilistic Parameterizations of Visibility Using Observations of Rain Precipitation Rate, Relative Humidity, and Visibility. J. Appl. Meteorol. Climatol. 2010, 49, 36–46. [Google Scholar] [CrossRef]
  12. Gultepe, I.; Zhou, B.; Milbrandt, J.; Bott, A.; Li, Y.; Heymsfield, A.J.; Ferrier, B.; Ware, R.; Pavolonis, M.; Kuhn, T.; et al. A Review on Ice Fog Measurements and Modeling. Atmos. Res. 2015, 151, 2–19. [Google Scholar] [CrossRef]
  13. Lareau, N.P.; Crosman, E.; Whiteman, C.D.; Horel, J.D.; Hoch, S.W.; Brown, W.O.J.; Horst, T.W. The Persistent Cold-Air Pool Study. Bull. Am. Meteorol. Soc. 2013, 94, 51–63. [Google Scholar] [CrossRef]
  14. Paci, A.; Staquet, C.; Allard, J.; Barral, H.; Canut, G.; Cohard, J.-M.; Jaffrezo, J.-L.; Martinet, P.; Sabatier, T.; Troude, F.; et al. La Campagne Passy-2015: Dynamique Atmosphérique et Qualité de l’air Dans La Vallée de l’Arve. Pollut. Atmos. 2016, 231–232. [Google Scholar] [CrossRef]
  15. Price, J.D.; Lane, S.; Boutle, I.A.; Smith, D.K.E.; Bergot, T.; Lac, C.; Duconge, L.; McGregor, J.; Kerr-Munslow, A.; Pickering, M.; et al. LANFEX: A Field and Modeling Study to Improve Our Understanding and Forecasting of Radiation Fog. Bull. Am. Meteorol. Soc. 2018, 99, 2061–2077. [Google Scholar] [CrossRef]
  16. Fernando, H.J.S.; Pardyjak, E.R.; Di Sabatino, S.; Chow, F.K.; De Wekker, S.F.J.; Hoch, S.W.; Hacker, J.; Pace, J.C.; Pratt, T.; Pu, Z.; et al. The MATERHORN: Unraveling the Intricacies of Mountain Weather. Bull. Am. Meteorol. Soc. 2015, 96, 1945–1967. [Google Scholar] [CrossRef]
  17. Gultepe, I.; Fernando, H.J.S.; Pardyjak, E.R.; Hoch, S.W.; Silver, Z.; Creegan, E.; Leo, L.S.; Pu, Z.; De Wekker, S.F.J.; Hang, C. An Overview of the MATERHORN Fog Project: Observations and Predictability. Pure Appl. Geophys. 2016, 173, 2983–3010. [Google Scholar] [CrossRef]
  18. Gultepe, I.; Kuhn, T.; Pavolonis, M.; Calvert, C.; Gurka, J.; Heymsfield, A.J.; Liu, P.S.K.; Zhou, B.; Ware, R.; Ferrier, B.; et al. Ice Fog in Arctic During FRAM–Ice Fog Project: Aviation and Nowcasting Applications. Bull. Am. Meteorol. Soc. 2014, 95, 211–226. [Google Scholar] [CrossRef]
  19. Gultepe, I.; Isaac, G.A.; Rasmussen, R.M.; Ungar, K. A Freezing Fog/Drizzle Event during the FRAM-S Project. In Proceedings of the SAE 2011 International Conference on Aircraft and Engine Icing and Ground Deicing, Chicago, IL, USA, 13–17 June 2011. SAE Technical Paper 2011-38-0028. [Google Scholar]
  20. Ghude, S.D.; Bhat, G.S.; Prabhakaran, T.; Jenamani, R.K.; Chate, D.M.; Safai, P.D.; Karipot, A.K.; Konwar, M.; Pithani, P.; Sinha, V.; et al. Winter Fog Experiment Over the Indo-Gangetic Plains of India. Curr. Sci. 2017, 112, 767. [Google Scholar] [CrossRef]
  21. Pithani, P.; Ghude, S.D.; Jenamani, R.K.; Biswas, M.; Naidu, C.V.; Debnath, S.; Kulkarni, R.; Dhangar, N.G.; Jena, C.; Hazra, A.; et al. Real-Time Forecast of Dense Fog Events over Delhi: The Performance of the WRF Model during the WiFEX Field Campaign. Weather Forecast. 2020, 35, 739–756. [Google Scholar] [CrossRef]
  22. Zhou, B.; Ferrier, B.S. Asymptotic Analysis of Equilibrium in Radiation Fog. J. Appl. Meteorol. Climatol. 2008, 47, 1704–1722. [Google Scholar] [CrossRef]
  23. Price, J.D. On the Formation and Development of Radiation Fog: An Observational Study. Bound.-Layer Meteorol. 2019, 172, 167–197. [Google Scholar] [CrossRef]
  24. Gultepe, I.; Heymsfield, A.J.; Fernando, H.J.S.; Pardyjak, E.; Dorman, C.E.; Wang, Q.; Creegan, E.; Hoch, S.W.; Flagg, D.D.; Yamaguchi, R.; et al. A Review of Coastal Fog Microphysics During C-FOG. Bound.-Layer Meteorol. 2021, 181, 227–265. [Google Scholar] [CrossRef]
  25. Mazoyer, M.; Burnet, F.; Denjean, C. Experimental Study on the Evolution of Droplet Size Distribution during the Fog Life Cycle. Atmos. Chem. Phys. 2022, 22, 11305–11321. [Google Scholar] [CrossRef]
  26. Hang, C.; Nadeau, D.F.; Gultepe, I.; Hoch, S.W.; Román-Cascón, C.; Pryor, K.; Fernando, H.J.S.; Creegan, E.D.; Leo, L.S.; Silver, Z.; et al. A Case Study of the Mechanisms Modulating the Evolution of Valley Fog. Pure Appl. Geophys. 2016, 173, 3011–3030. [Google Scholar] [CrossRef]
  27. Beal, R.L.; Pu, Z.; Pardyjak, E.; Hoch, S.; Gultepe, I. Evaluation of Near-surface and Boundary-layer Meteorological Conditions That Support Cold-fog Formation Using Cold Fog Amongst Complex Terrain Field Campaign Observations. Q. J. R. Meteorol. Soc. 2024, 150, 4329–4347. [Google Scholar] [CrossRef]
  28. Schwenkel, J.; Maronga, B. Large-Eddy Simulation of Radiation Fog with Comprehensive Two-Moment Bulk Microphysics: Impact of Different Aerosol Activation and Condensation Parameterizations. Atmos. Chem. Phys. 2019, 19, 7165–7181. [Google Scholar] [CrossRef]
  29. Gultepe, I.; Pagowski, M.; Milbrandt, J. A new visibility parameterization for warm-fog applications in numerical weather prediction models. J. Appl. Meteorol. 2005, 44, 1296–1306. [Google Scholar] [CrossRef]
  30. Gultepe, I.; Pagowski, M.; Reid, J. A Satellite-Based Fog Detection Scheme Using Screen Air Temperature. Weather Forecast. 2007, 22, 444–456. [Google Scholar] [CrossRef]
  31. Kunkel, B.A. Parameterization of Droplet Terminal Velocity and Extinction Coefficient in Fog Models. J. Climate Appl. Meteor. 1984, 23, 34–41. [Google Scholar] [CrossRef]
  32. Stoelinga, M.T.; Warner, T.T. Nonhydrostatic, Mesobeta-Scale Model Simulations of Cloud Ceiling and Visibility for an East Coast Winter Precipitation Event. J. Appl. Meteor. 1999, 38, 385–404. [Google Scholar] [CrossRef]
  33. Gultepe, I.; Tardif, R.; Michaelides, S.C.; Cermak, J.; Bott, A.; Bendix, J.; Müller, M.D.; Pagowski, M.; Hansen, B.; Ellrod, G.; et al. Fog Research: A Review of Past Achievements and Future Perspectives. Pure Appl. Geophys. 2007, 164, 1121–1159. [Google Scholar] [CrossRef]
  34. Gultepe, I.; Milbrandt, J.A.; Zhou, B. Marine Fog: A Review on Microphysics and Visibility Prediction. In Marine Fog: Challenges and Advancements in Observations, Modeling, and Forecasting; Koračin, D., Dorman, C.E., Eds.; Springer Atmospheric Sciences; Springer International Publishing: Cham, Switzerland, 2017; pp. 345–394. ISBN 978-3-319-45227-2. [Google Scholar]
  35. Lin, C.; Zhang, Z.; Pu, Z.; Wang, F. Numerical Simulations of an Advection Fog Event over Shanghai Pudong International Airport with the WRF Model. J. Meteorol. Res. 2017, 31, 874–889. [Google Scholar] [CrossRef]
  36. Pu, Z.; Chachere, C.N.; Hoch, S.W.; Pardyjak, E.; Gultepe, I. Numerical Prediction of Cold Season Fog Events over Complex Terrain: The Performance of the WRF Model During MATERHORN-Fog and Early Evaluation. Pure Appl. Geophys. 2016, 173, 3165–3186. [Google Scholar] [CrossRef]
  37. Chachere, C.N.; Pu, Z. Numerical Simulations of an Inversion Fog Event in the Salt Lake Valley during the MATERHORN-Fog Field Campaign. Pure Appl. Geophys. 2019, 176, 2139–2164. [Google Scholar] [CrossRef]
  38. Carrillo-Cardenas, G.; Hoch, S.W.; Pardyjak, E.; Garcia, M.; Brown, W.; Pu, Z.; Hallar, A.G. Elucidating New Particle Formation in Complex Terrain During the Winter 2022 Cold Fog Amongst Complex Terrain (CFACT) Campaign. JGR Atmos. 2025, 130, e2024JD042307. [Google Scholar] [CrossRef]
  39. Chachere, C.N.; Pu, Z. Connections Between Cold Air Pools and Mountain Valley Fog Events in Salt Lake City. Pure Appl. Geophys. 2016, 173, 3187–3196. [Google Scholar] [CrossRef]
  40. Pruppacher, H.R.; Klett, J.D. Microphysics of Clouds and Precipitation; Springer: Dordrecht, The Netherlands, 1978; ISBN 978-90-277-1106-9. [Google Scholar]
  41. Petters, M.D.; Kreidenweis, S.M. A Single Parameter Representation of Hygroscopic Growth and Cloud Condensation Nucleus Activity. Atmos. Chem. Phys. 2007, 7, 1961–1971. [Google Scholar] [CrossRef]
  42. Chow, J.C.; Lowenthal, D.H.; Chen, L.-W.A.; Wang, X.; Watson, J.G. Mass Reconstruction Methods for PM2.5: A Review. Air Qual. Atmos. Health 2015, 8, 243–263. [Google Scholar] [CrossRef]
  43. Beard, K.V.; Pruppacher, H.R. A Wind Tunnel Investigation of the Rate of Evaporation of Small Water Drops Falling at Terminal Velocity in Air. J. Atmos. Sci. 1971, 28, 1455–1464. [Google Scholar] [CrossRef]
  44. Koschmieder, H. Theorie der horizontalen Sichtweite. Beiträge Physik Freien Atmosphäre 1924, 12, 33–55. [Google Scholar]
  45. Girard, E.; Blanchet, J.-P. Simulation of Arctic Diamond Dust, Ice Fog, and Thin Stratus Using an Explicit Aerosol–Cloud–Radiation Model. J. Atmos. Sci. 2001, 58, 1199–1221. [Google Scholar] [CrossRef]
  46. Girard, E.; Dueymes, G.; Du, P.; Bertram, A.K. Assessment of the Effects of Acid-coated Ice Nuclei on the Arctic Cloud Microstructure, Atmospheric Dehydration, Radiation and Temperature during Winter. Int. J. Climatol. 2013, 33, 599–614. [Google Scholar] [CrossRef]
  47. Lohmann, U.; Lüönd, F.; Mahrt, F. An Introduction to Clouds: From the Microscale to Climate, 1st ed.; Cambridge University Press: Cambridge, UK, 2016; ISBN 978-1-107-01822-8. [Google Scholar]
  48. Gultepe, I.; Isaac, G.A. Aircraft Observations of Cloud Droplet Number Concentration: Implications for Climate Studies. Q. J. R. Meteorol. Soc. 2004, 130, 2377–2390. [Google Scholar] [CrossRef]
  49. Toth, G.; Gultepe, I.; Milbrandt, J.; Hansen, B.; Pearson, G.; Fogarty, C.; Burrows, W. The Environment Canada Handbook on Fog and Fog Forecasting; Environment Canada: Gatineau, QC, Canada, 2010; ISBN 978-1-100-52518-1. [Google Scholar]
  50. Zhou, B.; Du, J. Fog Prediction from a Multimodel Mesoscale Ensemble Prediction System. Weather Forecast. 2010, 25, 303–322. [Google Scholar] [CrossRef]
  51. Claxton, B.M. Using a Neural Network to Benchmark a Diagnostic Parametrization: The Met Office’s Visibility Scheme. Q. J. R. Meteorol. Soc. 2008, 134, 1527–1537. [Google Scholar] [CrossRef]
  52. Miao, Y.; Potts, R.; Huang, X.; Elliott, G.; Rivett, R. A Fuzzy Logic Fog Forecasting Model for Perth Airport. Pure Appl. Geophys. 2012, 169, 1107–1119. [Google Scholar] [CrossRef]
  53. Bott, A.; Sievers, U.; Zdunkowski, W. A Radiation Fog Model with a Detailed Treatment of the Interaction between Radiative Transfer and Fog Microphysics. J. Atmos. Sci. 1990, 47, 2153–2166. [Google Scholar] [CrossRef]
  54. Bott, A.; Trautmann, T. PAFOG—A New Efficient Forecast Model of Radiation Fog and Low-Level Stratiform Clouds. Atmos. Res. 2002, 64, 191–203. [Google Scholar] [CrossRef]
  55. Golding, B.W. A Study of the Influence of Terrain on Fog Development. Mon. Weather Rev. 1993, 121, 2529–2541. [Google Scholar] [CrossRef]
  56. Haiden, T.; Kann, A.; Pistotnik, G. Nowcasting with INCA During SNOW-V10. Pure Appl. Geophys. 2014, 171, 231–242. [Google Scholar] [CrossRef]
  57. Gultepe, E.; Wang, S.; Blomquist, B.; Fernando, H.J.S.; Kreidl, O.P.; Delene, D.J.; Gultepe, I. Machine Learning Analysis and Nowcasting of Marine Fog Visibility Using FATIMA Grand Banks Campaign Measurements. Front. Earth Sci. 2024, 11, 1321422. [Google Scholar] [CrossRef]
  58. Fernandez, D.; Kim, S.; Robinson, T. Standard Fog Collector and Dual FM-120 Comparisons. Atmos. Res. 2025, 315, 107869. [Google Scholar] [CrossRef]
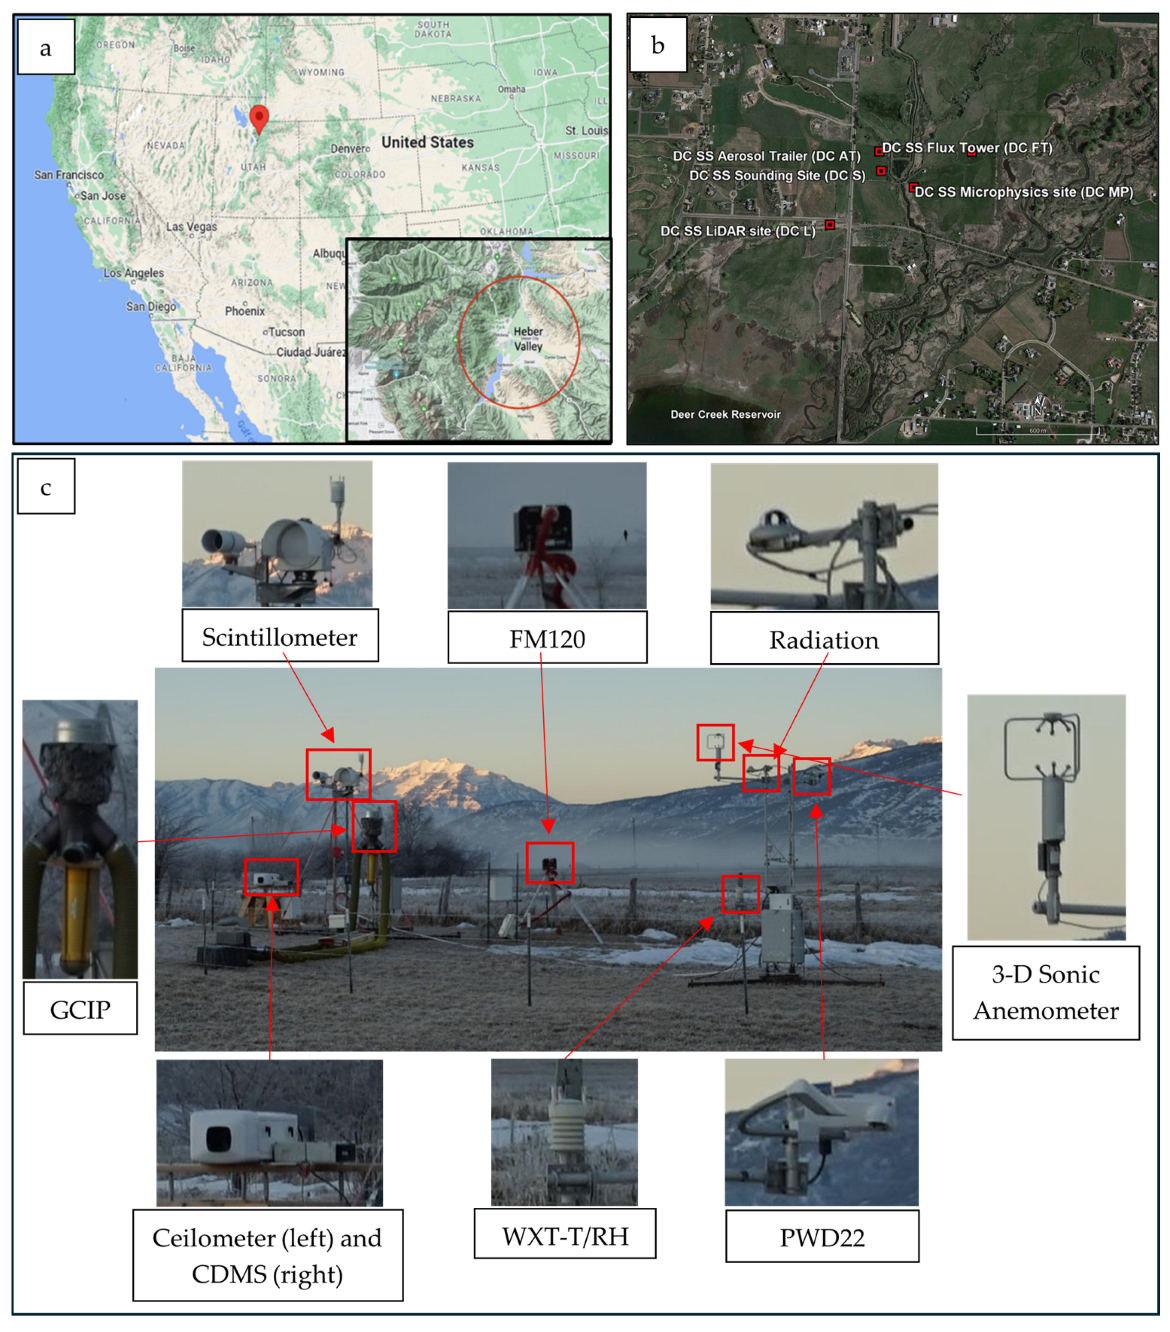
Figure 1. Shows the CFACT field campaign location and platforms with instrumentations at DC Supersite (DC SS). (a) The location of Heber Valley, UTAH is marked with a red pin and a large circle in the inset map. (b) Overview of the instrument deployment sites used in the study, including the DC SS components such as the Aerosol Trailer (DC AT), Flux Tower (DC FT), Sounding Site (DC S), LIDAR Site (DC L), and Microphysics Site (DC MP). (c) Instruments deployed at the DC Microphysical Supersite (DC MP) on 19 February 2022, including the FM120, PWD22, GCIP, ceilometer, radiation sensors, WXT temperature and humidity sensor, 3D sonic anemometer, and scintillometer (Photograph by Sebastian Hoch [7]).
Remotesensing 17 02728 g001
Figure 2. (a) The radiosonde profile for 19 February 2022, case at 11:15:24 UTC, with Ta (red line) and Td (green line) (b) US GFS model output showing 6-h precipitation rates (color shaded), surface pressure centers, and 1000–500 mb thickness fields. (c) Brightness temperature difference (ΔT = SWIR-IR) derived from GOES-R observations. Heber Valley is indicated by a red-filled circle.
Remotesensing 17 02728 g002
Figure 3. Time series of meteorological variables observed during the FFG event on 19 February 2022 in Heber Valley. (a) Vis (1000 m is shown dashed line) and TPWD measurements obtained from a PWD. (b) Radiative fluxes time series (SW in-out, IR in-out, and net radiation). (c) Ta and RHw time series. (d) Wind speed (Uh) and pressure (P) times series at 2-m height observed on 19 February 2022 at DC supersite flux tower (DC FT).
Remotesensing 17 02728 g003
Figure 4. (a) Time-distance cross-section of backscatter coefficient (β) from the horizontally-looking CL31 ceilometer at the DC Microphysical Supersite (DC MP). (b) Time-height cross-section of β from the vertical pointing CL61 ceilometer measurements. (c) Linear depolarization (LDR) ratio for CL61 at the DC SS Sounding site (DC S).
Remotesensing 17 02728 g004
Figure 5. (a) Time series of droplet size distribution from the FM120 for 3–30 μm size range across 30 size bins from 05:00 UTC to 13:40 UTC on 19 February 2022. The vertical axis is droplet diameter D (μm), while the color scale indicates droplet number concentration Nd (cm−3, where # indicates counts of droplets). (b) Time series of visibility (Vis) from PWD, droplet number concentration (Nd), Liquid water content (LWC), mean volume diameter (MVD), (ce) respectively, obtained from FM120 measurements at 1 min intervals between 05:00–13:40 UTC on 19 February 2022.
Remotesensing 17 02728 g005
Figure 6. (a) Aerosol chemical composition derived from Teflon filter samples between 18 Feb 2022 on 21:09 UTC and 19 February 2022 on 20:43 UTC from MiniVol Tactical Air Sampler (MTAS) measurements (created by Gerardo Carrillo-Cardenas). (b) Time series of aerosol size distribution for 19 February 2022 from SMPS measurements. The color bar scale represents the particle spectral density (dNa/dlogDp) (similar to [7]). (c) Time series of total aerosol spectral concentration (dN/logDp) for aerosol sizes smaller 0.05 and larger than 0.05 plotted together with 5-min averaged visibility.
Remotesensing 17 02728 g006
Figure 7. (a) Aerosol composition effects on droplet formation: Köhler curves, represented by S(r) using black solid and dashed line for NaCl and NH4NO3, respectively. Kelvin effect is shown by blue solid line and Raoult effect is shown by red solid and dashed line. (b) It is same as in (a) but calculations are obtained using κ-Köhler theory with κ = 1.12 for NaCl and κ = 0.67 for NH4NO3, and calculations are obtained using κ = 1.12 for NaCl and 0.67 for NH4NO3, as suggested by Petters et al. [41].The critical radius for activation are assumed as rc = 0.56 µm for NaCl and 0.43 µm for NH4NO3, and Sc = 1.0016 for NaCl and Sc = 1.0021 for NH4NO3. (c) obtained using κ-Köhler theory for NaCl using κ = 1.00 and κ = 1.33. (d) Droplet radius change with time when the Köhler and κ-Köhler theories are used for NaCl and NH4NO3, respectively.
Remotesensing 17 02728 g007
Figure 8. (a) Time series of visibility difference caused by water to ice phase change using FM120 filtered data (using Nd > 1 # cm−3, LWC > 0.005 g m−3 filter). (b) Vis differences based on unfiltered FM120 data resulting from the phase change between liquid water and ice.
Remotesensing 17 02728 g008
Figure 9. (a) Scatterplot of Vis versus 1/(Nd × LWC) for WFG. (b) For IFG defined as Vis versus 1/(Ni × IWC). (c) Time series of Vis difference between liquid droplets and spherical ice crystals. The solid black lines are for fits applied to bin averaged mean values (red circles) overlaid on 1 s observations (yellow filled circles). The Sd (vertical red bars) at each bin is also shown on the plots. The equations for each relationship applied to mean values are shown in legends. RMSE and Pearson correlation coefficients (R) are also shown in the text boxes.
Remotesensing 17 02728 g009
Figure 10. (a) Microphysical differences between liquid and freezing fog droplets; Vis versus MVDliq3/2/LWC. (b) Vis versus MVDice3/2/IWC. (c) Time series of the Vis difference between WFG and IFG cases. The solid black lines are for fits applied to bin averaged mean values (red circles) overlaid on 1 s observations (yellow filled circles). The Sd (vertical red bars) at each bin is also shown on the plots. The equations for fits are shown in legends.
Remotesensing 17 02728 g010
Figure 11. (a) Wind rose and (b) air temperature rose plots for 19 February 2022. Color bars show the magnitude of wind speed (a) and air temperature (b), respectively. The circular grid indicates the relative frequency of each parameter. Dark blue bars indicate calm wind and cold Ta conditions during FFG event. (c) Time series of Vis difference for IFG particle density ρi = 0.9 g cm−3 (spherical ice crystals) and 0.5 g cm−3 (rimed ice).
Remotesensing 17 02728 g011
Figure 12. (a) Time series of PWD and FM120 Vis for liquid phase, (b) ice phase, and (c) difference of Vis for liquid droplets, and (d) for spherical ice crystals. The blue solid lines are for observed Vis obtained from PWD and red dashed lines are for calculated Vis from FM120.
Remotesensing 17 02728 g012
Figure 13. Comparison of visibility as a function of liquid water content (LWC) shown using various parameterizations. Colored solid lines represent the parameterizations by Gultepe et al. [24] (Equation (14)) for reff of 5, 10, and 20 μm. The dashed black line corresponds to the parameterization equation (Equation (22)) developed in this study. The blue diamond markers represent the parameterization from Kunkel [31] (Equation (25)), while green squares and orange triangles represent the Gultepe et al. [19] method (Equation (24)) assuming droplet number concentrations of Nd = 20 and 100 cm−3, respectively. Purple plus markers indicate visibility calculated using the Gultepe et al. [19] method (Equation (24)), and yellow circles represent visibility using Koschmieder’s law [44] (Equation (9)) using FM120 data.
Remotesensing 17 02728 g013
Table 1. Shows the instruments used in this study used during the CFACT project. DC SS indicates Deer Creek Supersite, MP: Microphysics site, AT: Aerosol Trailer, S: Sounding Site, and FT: Flux Tower. Parameters in column 4 are Vis (visibility), PR (precipitation rate), Ta (air temperature), βh (horizontal backscattering ratio), RH (relative humidity), Nd (droplet number concentration), LWC (liquid water content), MVD (mean volume diameter), Na (aerosol number concentration), u, v, and w (wind components), dir (wind direction), Uh (wind speed), MSL (mean sea level), a.g.l. (above ground level), H (a.g.l. height) and P (pressure).
SiteLat Lon and Elevation (m, MSL)InstrumentMeasured or Retrieved
Parameters
H (a.g.l., m)Manufacturer
DC MP40.488 320°N
111.468 143°W
1659m
Present Weather Detector (PWD22)Vis < 20 km and PR (mm/h—10 min interval), Ta5Vaisala Inc., Vantaa, Finland
Celiometer (CL31)Horizontal looking
βh
1.5Vaisala Inc., Vantaa, Finland
Weather Transmitter (WXT520)Ta/RH/Uh/dir 1.5Vaisala Inc., Vantaa, Finland
Cloud particle Spectrometer
Fog Monitor (FM120)
Nd, LWC, MVD from Size Distribution (2–50 μm, 30 size bins)2DMT, Boulder, CO, USA
Ground-based cloud
imaging probe (GCIP)
Cloud particle size distribution (10–1000 μm)3DMT, Boulder, CO, USA
DC AT40.489 940°N,
111.470 331°W
1661m
Scanning Mobility Particle Sizer (SMPS Model 3938)Na size distribution in 128 bin (8 nm to 19.81 mm)2TSI Inc, Minneapolis, MN, USA
MiniVol Tactical Air Sampler (MTAS)(PM10 Filters—smaller than 10 μm)2Airmetric, Eugene, OR, USA
DC S40.489027°N
111.470164°W
1660 m
Celiometer (CL61)Vertical looking
β and depolarization ratio
2Vaisala Inc., Vantaa, Finland, USA
DC FT40.490101°N
111.464737°W
1659 m
Broadband Radiometer (CMP21)4-component radiation2Kipp and Zonen, Delft, Netherlands
Hygrothermometer (SHT85)Ta, RH2Sensirion, Stäfa, Switzerland
3D sonic anemometer (CSAT3)u, v, w, dir2Campbell Scientific, Logan, UT, USA
NanobarometerP2Paroscientific Inc., Redmond, WA, USA
Disclaimer/Publisher’s Note: The statements, opinions and data contained in all publications are solely those of the individual author(s) and contributor(s) and not of MDPI and/or the editor(s). MDPI and/or the editor(s) disclaim responsibility for any injury to people or property resulting from any ideas, methods, instructions or products referred to in the content.