Article

Application and Comparison of Satellite-Derived Sea Surface Temperature Gradients to Identify Seasonal and Interannual Variability off the California Coast: Preliminary Results and Future Perspectives

by
Jorge Vazquez-Cuervo
1,*,
Marisol García-Reyes
2,
David S. Wethey
3,
Daniele Ciani
4 and
Jose Gomez-Valdes
5
1
Jet Propulsion Laboratory, California Institute of Technology, Pasadena, CA 91109, USA
2
Farallon Institute, Petaluma, CA 94952, USA
3
Department of Biological Sciences, University of South Carolina, Columbia, SC 29208, USA
4
Consiglio Nazionale delle Ricerche, Istituto di Scienze Marine (CNR-ISMAR), 00133 Rome, Italy
5
Physical Oceanography Department, Center for Scientific Research and Higher Education at Ensenada, Ensenada 22860, Baja California, Mexico
*
Author to whom correspondence should be addressed.
Remote Sens. 2025, 17(15), 2722; https://doi.org/10.3390/rs17152722
Submission received: 10 April 2025 / Revised: 17 July 2025 / Accepted: 25 July 2025 / Published: 6 August 2025

Abstract

The application of satellite-derived sea surface temperature in coastal regions is critical for resolving the dynamics of frontal features and coastal upwelling. Here, we examine and compare sea surface temperature (SST) gradients derived from two satellite products, the Multi-Scale Ultra-High Resolution SST Product (MUR, 0.01° grid scale) and the Operational SST and Ice Analysis (OSTIA, 0.05° grid scale), available through the Group for High Resolution SST (GHRSST). Both products show similar seasonal variability, with maxima occurring in the summer time frame. Additionally, both products show an increasing trend of SST gradients near the coast. However, differences exist between the two products (maximum gradient intensities were around 0.11 and 0.06 °C/km for OSTIA and MUR, respectively). The potential contributions of both cloud cover and the collocation of the MUR SST onto the OSTIA SST grid product to these differences were examined. Spectra and coherences were examined at two specific latitudes along the coast where upwelling can occur. A major conclusion is that future work needs to focus on cloud cover and its impact on the derivation of SST in coastal regions. Future comparisons also need to apply collocation methodologies that maintain, as much as possible, the spatial variability of the high-resolution product.

1. Introduction

Application of high-resolution remote sensing to coastal areas around the world is critical for determining changes on interannual to climate scales. Remote sensing allows for resolving changes in frontal dynamics directly linked to many coastal processes, such as coastal upwelling. However, a major limitation of the application of remote sensing in coastal regions is the gaps due to cloud cover in infrared sensors. Infrared sensors allow for high spatial resolution (1 km) of sea surface temperatures (SSTs) but only under cloud-free conditions. Microwave sensors are not limited by clouds but can resolve SSTs at lower spatial resolutions (25 km). Although algorithms to provide high-resolution SST products despite cloudy conditions exist, it is important to understand how conditions impact the identification of high-resolution coastal features.
This study primarily focuses on characterizing and inter-comparing SST gradients from space-based observations. SST gradients are closely linked to ocean and lower atmosphere dynamics. These gradients arise from various processes, including (i) the meeting of water masses from different origins, such as in frontal zones along the Antarctic Circumpolar Current or major western boundary currents [1,2]; (ii) local modifications of upper-ocean heat content via vertical advection [3] and mixing driven by mesoscale and submesoscale features [4]; and (iii) localized momentum and energy exchanges at the air–sea interface [5,6]. This interface is where the ocean gradually integrates atmospheric variability over time, while the atmosphere rapidly responds to spatial variability in oceanic fields [7,8]. Numerous studies have shown links between SST gradients, changes in sea surface roughness, wind speed, and even storm track modulation [9,10,11,12].
In coastal regions, SST gradient patterns often signal upwelling systems, which are vital for marine ecosystems by enhancing primary productivity and affecting higher trophic levels [3,13]. Accurate SST gradient retrieval is thus essential for studying these processes and has been the focus of quality assessments of both single/multi-sensor (Level 3, L3) and interpolated (Level 4, L4) SST products using in situ data [14,15]. Furthermore, satellite-derived SST gradients are increasingly important for practical applications, such as improving altimeter-derived surface geostrophic currents from the Copernicus Marine Service and enhancing satellite-based sea surface salinity monitoring. SST gradients help refine the effective spatial resolution of satellite oceanographic products [16,17,18,19,20,21].
Two landmark papers [22,23] show the summer time coupling between SST gradients and winds off the California Coast. Summer time obviously coincided with the period of major upwelling. A major conclusion of the papers was that the representation of the coupling was poorly represented in the model due to poor resolution. Thus, the issue of high spatial resolution was critical for resolving the air–sea coupling during the major upwelling season when colder waters reach the surface. Overall, they found a statistically significant relationship between the wind stress and SST gradients. This suggested a strong feedback between the winds and the SST gradients. Additionally, the importance of high resolution is highlighted. Ref. [23] specifically shows the coupling in an area of strong frontal activity, the California Current System. The results are important in showing clear evidence for why high-quality SST gradients are needed for defining air–sea coupling in coastal areas as well as currents, inclusive of western boundary currents. The work intends to make a contribution to better understand the quality of SST gradients in these important regions, specifically the California Coast.
This work will focus on the application and comparison of two satellite-derived SST products, the Operational SST and Ice Analysis (OSTIA) and the Multi-Scale Ultra-High Resolution SST (MUR). These two products have been previously validated in [14], with key results indicating that the OSTIA and MUR SST root mean square differences (RMSDs) relative to in situ data from Saildrone uncrewed vehicles were within 0.05 °C of the average daily variability of Saildrone SST, indicating that OSTIA and MUR are capturing the majority of the daily spatial patterns of the coastal SST. There are also correlations of 0.97 (MUR) and 0.98 (OSTIA) with SSTs derived from Saildrones [14], confirming the ability of MUR and OSTIA to represent the spatial structure of the coastal SST. Correlations of 0.81 between the MUR- and Saildrone-derived SST gradients indicate that MUR also resolved the spatial pattern and intensity of SST gradients and fronts along the California coastal region [24]. Based on these results, it was decided to use MUR- and OSTIA-derived SST gradients to examine the seasonal and interannual variability of SST gradients along the California Coast. Because the MUR and OSTIA grid scales differ, it was possible to examine the influence of spatial resolution on the detection of seasonal and interannual patterns.
Coastal upwelling is a wind-driven process in which deep, cold, salty, and nutrient-rich water is brought up to the surface at the coast and then transported offshore. These nutritious waters fuel a rich ecosystem in the regions where upwelling occurs, including some of the most important fisheries in the world. Upwelling areas are also populated by submesoscale oceanographic features contributing to horizontal transport (i.e., filaments, eddies) [25]. These features are important for the ecosystem as they transport and aggregate nutrients and plankton. To better understand these ecosystems and how they are changing, high-resolution SST data that resolve these features are important. Ref. [24] demonstrated that an analysis of SST gradients captures areas with strong upwelling-related activity, capturing submesoscale features. In the California Current region, as in other eastern boundary current regions, coastal upwelling is a seasonal process, peaking in the warm months due to seasonal migration of the oceanic high-pressure systems [25,26,27]. This can lead to foggy and cloudy conditions, cooled marine air, and subsiding warm air associated with the pressure systems [28]. In winter, passing storms also lead to cloudy conditions. Since clouds prevent high-resolution (1–4 km scale) infrared SST retrievals, products such as MUR and OSTIA use interpolation methods and/or 25 km scale microwave SST retrievals to fill the gaps during cloudy periods such as the upwelling season. Therefore, it is essential to understand how cloudy conditions affect the identification of high-resolution SST features in coastal upwelling areas, in order to properly assess these physically and biologically important ocean conditions and their change. In other words, how much high-resolution information remains after gap-filling during cloudy conditions?
Trends in upwelling are an important factor for determining future fisheries. Both salinity and temperature impact ocean biology [29]. Upwelling is associated with the upward vertical movement of colder and saltier waters to the surface. A predicted increase in winds in upwelling systems, due to climate change, has been examined since 1990 [29,30,31,32,33,34,35]. Such changes are already having an impact [34,36], inclusive of ocean acidification [33]. Researchers used several wind products to examine impacts on upwelling, but they also found differences between the products themselves. Trends in the SST have also shown different results depending on the product and the period of study [34,37].
Here, in order to examine trends, we will focus on using the magnitude of SST gradients as a possible proxy for upwelling because SST gradients can provide a measure of the spatial structure of upwelling. Their use has been limited in studying coastal upwelling due to the limitations of remote sensing because of cloud cover [38,39]. Prior work [38,39] used Level 2 (instrument swath) data with gaps due to clouds, whereas here, we use Level 4 (gap-free interpolated) data. The work will focus on examining the signals in SST gradients off the California Coast. The importance of these changes in upwelling are critical, and SST gradients provide an additional parameter that can be used for monitoring changes in coastal upwelling.
There are two goals in this work:
Examine seasonal signals and differences in gradients from two satellite-derived gap-free Level 4 SST products, the OSTIA and MUR SSTs. Both of these are available through the Group for High Resolution SST (GHRSST).
Examine linear trends analysis to determine long-term changes in upwelling based on SST gradients derived from both products.
This paper is divided into five sections: (1) Introduction, (2) Materials and Methods, (3) Results, (4) Discussion, and (5) Conclusions. The Section 3 contains the major results of the work, followed by the Discussion and a summary in the Conclusions. The Discussion focuses on the interpretation of seasonal signals with further spectral analysis of the gradients.

2. Materials and Methods

2.1. Data

The two primary datasets used in this study were NASA’s MUR and the UK Met Office’s OSTIA. Both products produce a foundation temperature, defined as the temperature not impacted by daytime heating, with OSTIA gridded at a 0.05° × 0.05° resolution and MUR at a 0.01° × 0.01° resolution. A brief description of these datasets follows. Both datasets are produced as part of the GHRSST. They are available through the Physical Oceanography Distributed Active Archive Center (PO.DAAC). Thus, both datasets follow the GHRSST Data Specification version 2 format and can be considered GHRSST products.
The version 4.1 MUR L4 analysis is based on nighttime GHRSST L2P skin and subskin SST observations from several instruments including the NASA Advanced Microwave Scanning Radiometer-EOS (AMSR-E), the JAXA Advanced Microwave Scanning Radiometer 2 (AMSR-2) on GCOM-W1, the US Navy microwave WindSat radiometer, infrared observations from the Moderate Resolution Imaging Spectroradiometers (MODIS) on the NASA Aqua and Terra platforms, infrared observations from the Advanced Very High Resolution Radiometer (AVHRR) on several NOAA and Eumetsat satellites, and in situ SST observations from the NOAA iQuam project. JAXA is the Japanese Aerospace Exploration Agency located in Chiyoda City, Tokyo, Japan. The MUR product provides daily gap-free maps of foundation SSTs at approximately a 1 km spatial resolution. MUR only uses nighttime data to avoid issues of diurnal warming. This information is found in the landing page of the PO.DAAC (https://podaac.jpl.nasa.gov/dataset/MUR-JPL-L4-GLOB-v4.1, accessed on 1 November 2024). Wavelet basis functions are used to grid the data. The wavelet basis functions preserve the location of the SST pixels. More information on the MUR SST data may be found in [40].
The OSTIA system is run by the UK’s Met Office. OSTIA uses satellite data provided by the GHRSST project together with in situ observations to determine the SST. A high-resolution (1/20°—approx. 6 km) daily analysis of SSTs is produced for the global ocean and some lakes. The OSTIA analysis uses satellite data from over 10 unique sensors that include infrared data from the AVHRR, the Visible Infrared Imaging Radiometer Suite (VIIRS), the Spinning Enhanced Visible and Infrared Imager (SEVIRI), the Geostationary Operational Environmental Satellite (GOES) imagers, the Along Track Scanning Radiometer (ATSR) family of instruments, the Infrared Atmospheric Sounding Interferometer (IASI), and microwave data from AMSR-E, AMSR-2, the Tropical Rainfall Measuring Mission Microwave Imager (TMI), the Special Sensor Microwave Imager (SSMI) and Special Sensor Microwave Imager Sounder (SSMIS), and in situ data from ships and drifting and moored buoys. Unlike MUR, OSTIA uses both daytime (for wind speed larger than 6 ms−1) and nighttime data. The data are distributed as part of the GHRSST products through the Copernicus Marine Service and mirrored by PO.DAAC. Information can be found at the following website: https://podaac.jpl.nasa.gov/dataset/OSTIA-UKMO-L4-GLOB-v2.0 (accessed on 1 November 2024). OSTIA has now implemented a variational data assimilation technique based on the Nucleus for European Modeling of the Ocean (NEMOVAR) model. More detailed information on data processing and the algorithm may be found in [41]. Specifically, Version 2.0 of the OSTIA reprocessed data was used in the analysis. A user guide is also found at the following website: https://documentation.marine.copernicus.eu/PUM/CMEMS-SST-PUM-010-001.pdf (accessed on 1 November 2024).

2.2. Methods

The goal of this work is to assess and understand the differences between the OSTIA and MUR datasets in detecting SST gradients in the dynamic California Coast. For this, we will examine and compare SST gradients (i) at seasonal scales, as they are known to be associated with seasonal coastal upwelling, and (ii) on the scale of the temporal availability of the SST products by calculating their linear trends.
Previous work has shown there is a pronounced seasonality to the upwelling along the California Coast [42]. Thus, this work focused on comparing the seasonal signals using OSTIA and MUR. In this work, we will also examine possible linear trends in the magnitude of SST gradients off the California Coast. In previous work, MUR SST gradients were validated using data from the Saildrone uncrewed vehicle [24].
To calculate the gradients, first the MUR SST data were collocated to match the OSTIA SST data 5 km grid, using a nearest neighbor approach. Then, SST gradients for MUR and OSTIA were derived using a simple finite difference approach.
x S S T ( j , i ) = ( S S T ( j + 1 , i ) S S T ( j 1 , i ) ) / Δ x
y S S T ( j , i ) = ( S S T ( j , i + 1 ) S S T ( j , i 1 ) ) / Δ y
S S T g r a d ( j , i ) = ( x S S T ( j , i ) ) 2 + y S S T ( j , i ) ) 2
where x and y represent the distance in kilometers along the longitudinal and latitudinal directions, and ∂xSST(j,i) and ∂ySST(j,i) represent the gradients in the longitudinal and latitudinal directions at location (j,i). ∆x and ∆y are equal to 2 multiplied by the grid spacing. Once the SSTgrad was calculated, it was used to derive trends in the gradients. A simple linear regression was fit to the magnitude of the SST gradients. The regression equation is:
Y = MX + B
where Y represents the SST gradient magnitude, M is the slope of the fit (rate of change in SST gradient magnitude), B is the y-intercept, and X is the date.
A major concern is how the collocation of the MUR SST with the OSTIA SST could impact the comparative results. This issue was addressed because, although re-gridded at a lower resolution (5 km), the MUR collocated data for seasonal means showed decreased gradients compared to OSTIA. The rationale for using the nearest neighbor approach to compare SST datasets was to minimize the computer processing needed, due to the analysis being run over a 20-year time span ranging from 2002 to 2023. To examine how the nearest neighbor approach impacts the comparison results between datasets, we compared this approach with a collocation performed by calculating the mean values for a specific date: 19 August 2002.
The results were focused on the seasonal averaged values, where winter was defined as January-March, spring as April-June, summer as July-September, and fall as October-December. This approach was used in the attempt to derive conclusions based also on the seasonality of the results and direct comparison with previous results. This is especially critical in the coastal dynamics off California where the upwelling has a strong seasonal dependence [26,42].
To quantify differences between the MUR and OSTIA products, standard statistics were applied, such as the mean differences (MDs), RMSDs, and Pearson correlations. The statistics was also calculated on the seasonal time scales. Additionally, spectral analyses, including coherences, were derived to further quantify possible differences in the time scales of the MUR and OSTIA products. All the software used was based on the Interactive Data Language (IDL v8.3).

3. Results

The results were focused on derived climatological seasonal mean gradients for the MUR and OSTIA products, at a 5 km resolution (after the collocation of MUR). Additionally, the mean differences and root mean square differences between the seasonal means were examined between the products.
Figure 1 shows the mean seasonal SST gradients derived from the MUR product. The results are consistent with documented seasonality in upwelling [42], showing larger gradients in spring as upwelling starts in central California, and maxima in SST gradients during the summer in the northern California region. A reduction in the gradient magnitude is observed in the fall, coinciding with the relaxation of upwelling. Maxima values in the summer time reach 0.11 °C/km for OSTIA and 0.06 °C/km for MUR (see Table 1).
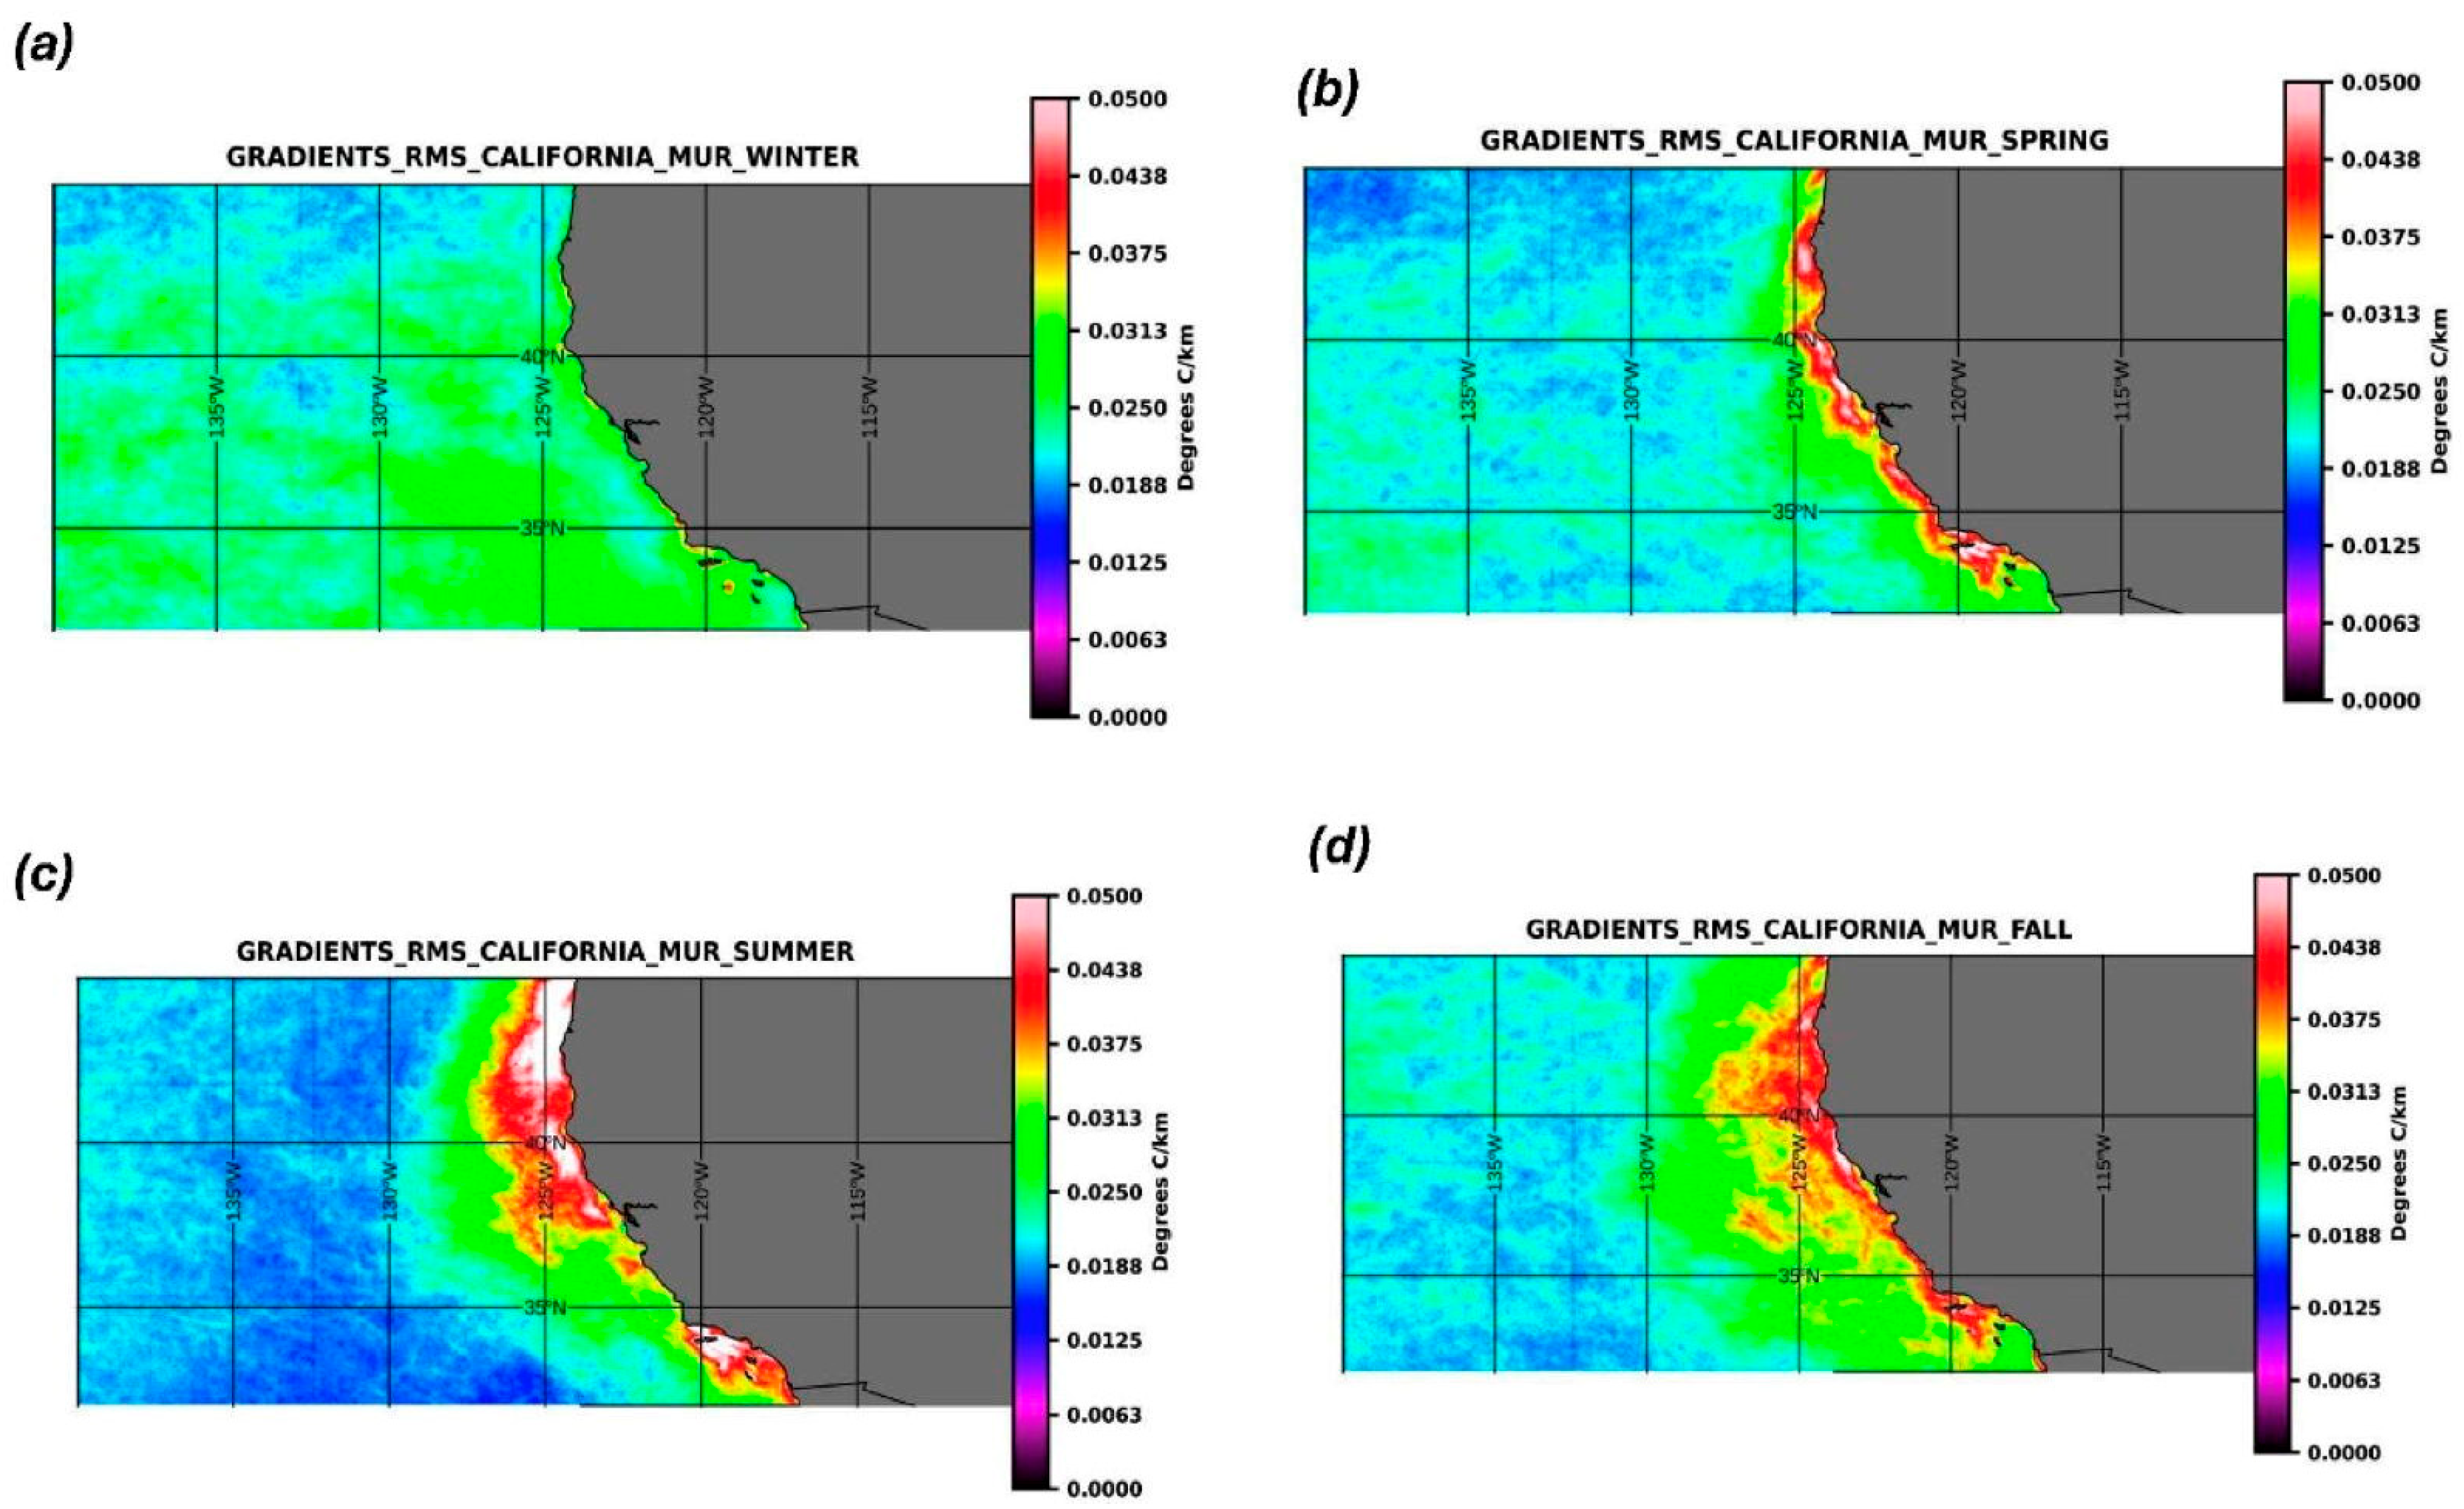
Figure 2 shows the root mean square variability of the MUR SST for the different seasons. Winter clearly has the overall lowest variability and summer the maxima variability. Fall shows variability that is consistent with the relaxation of the upwelling season.
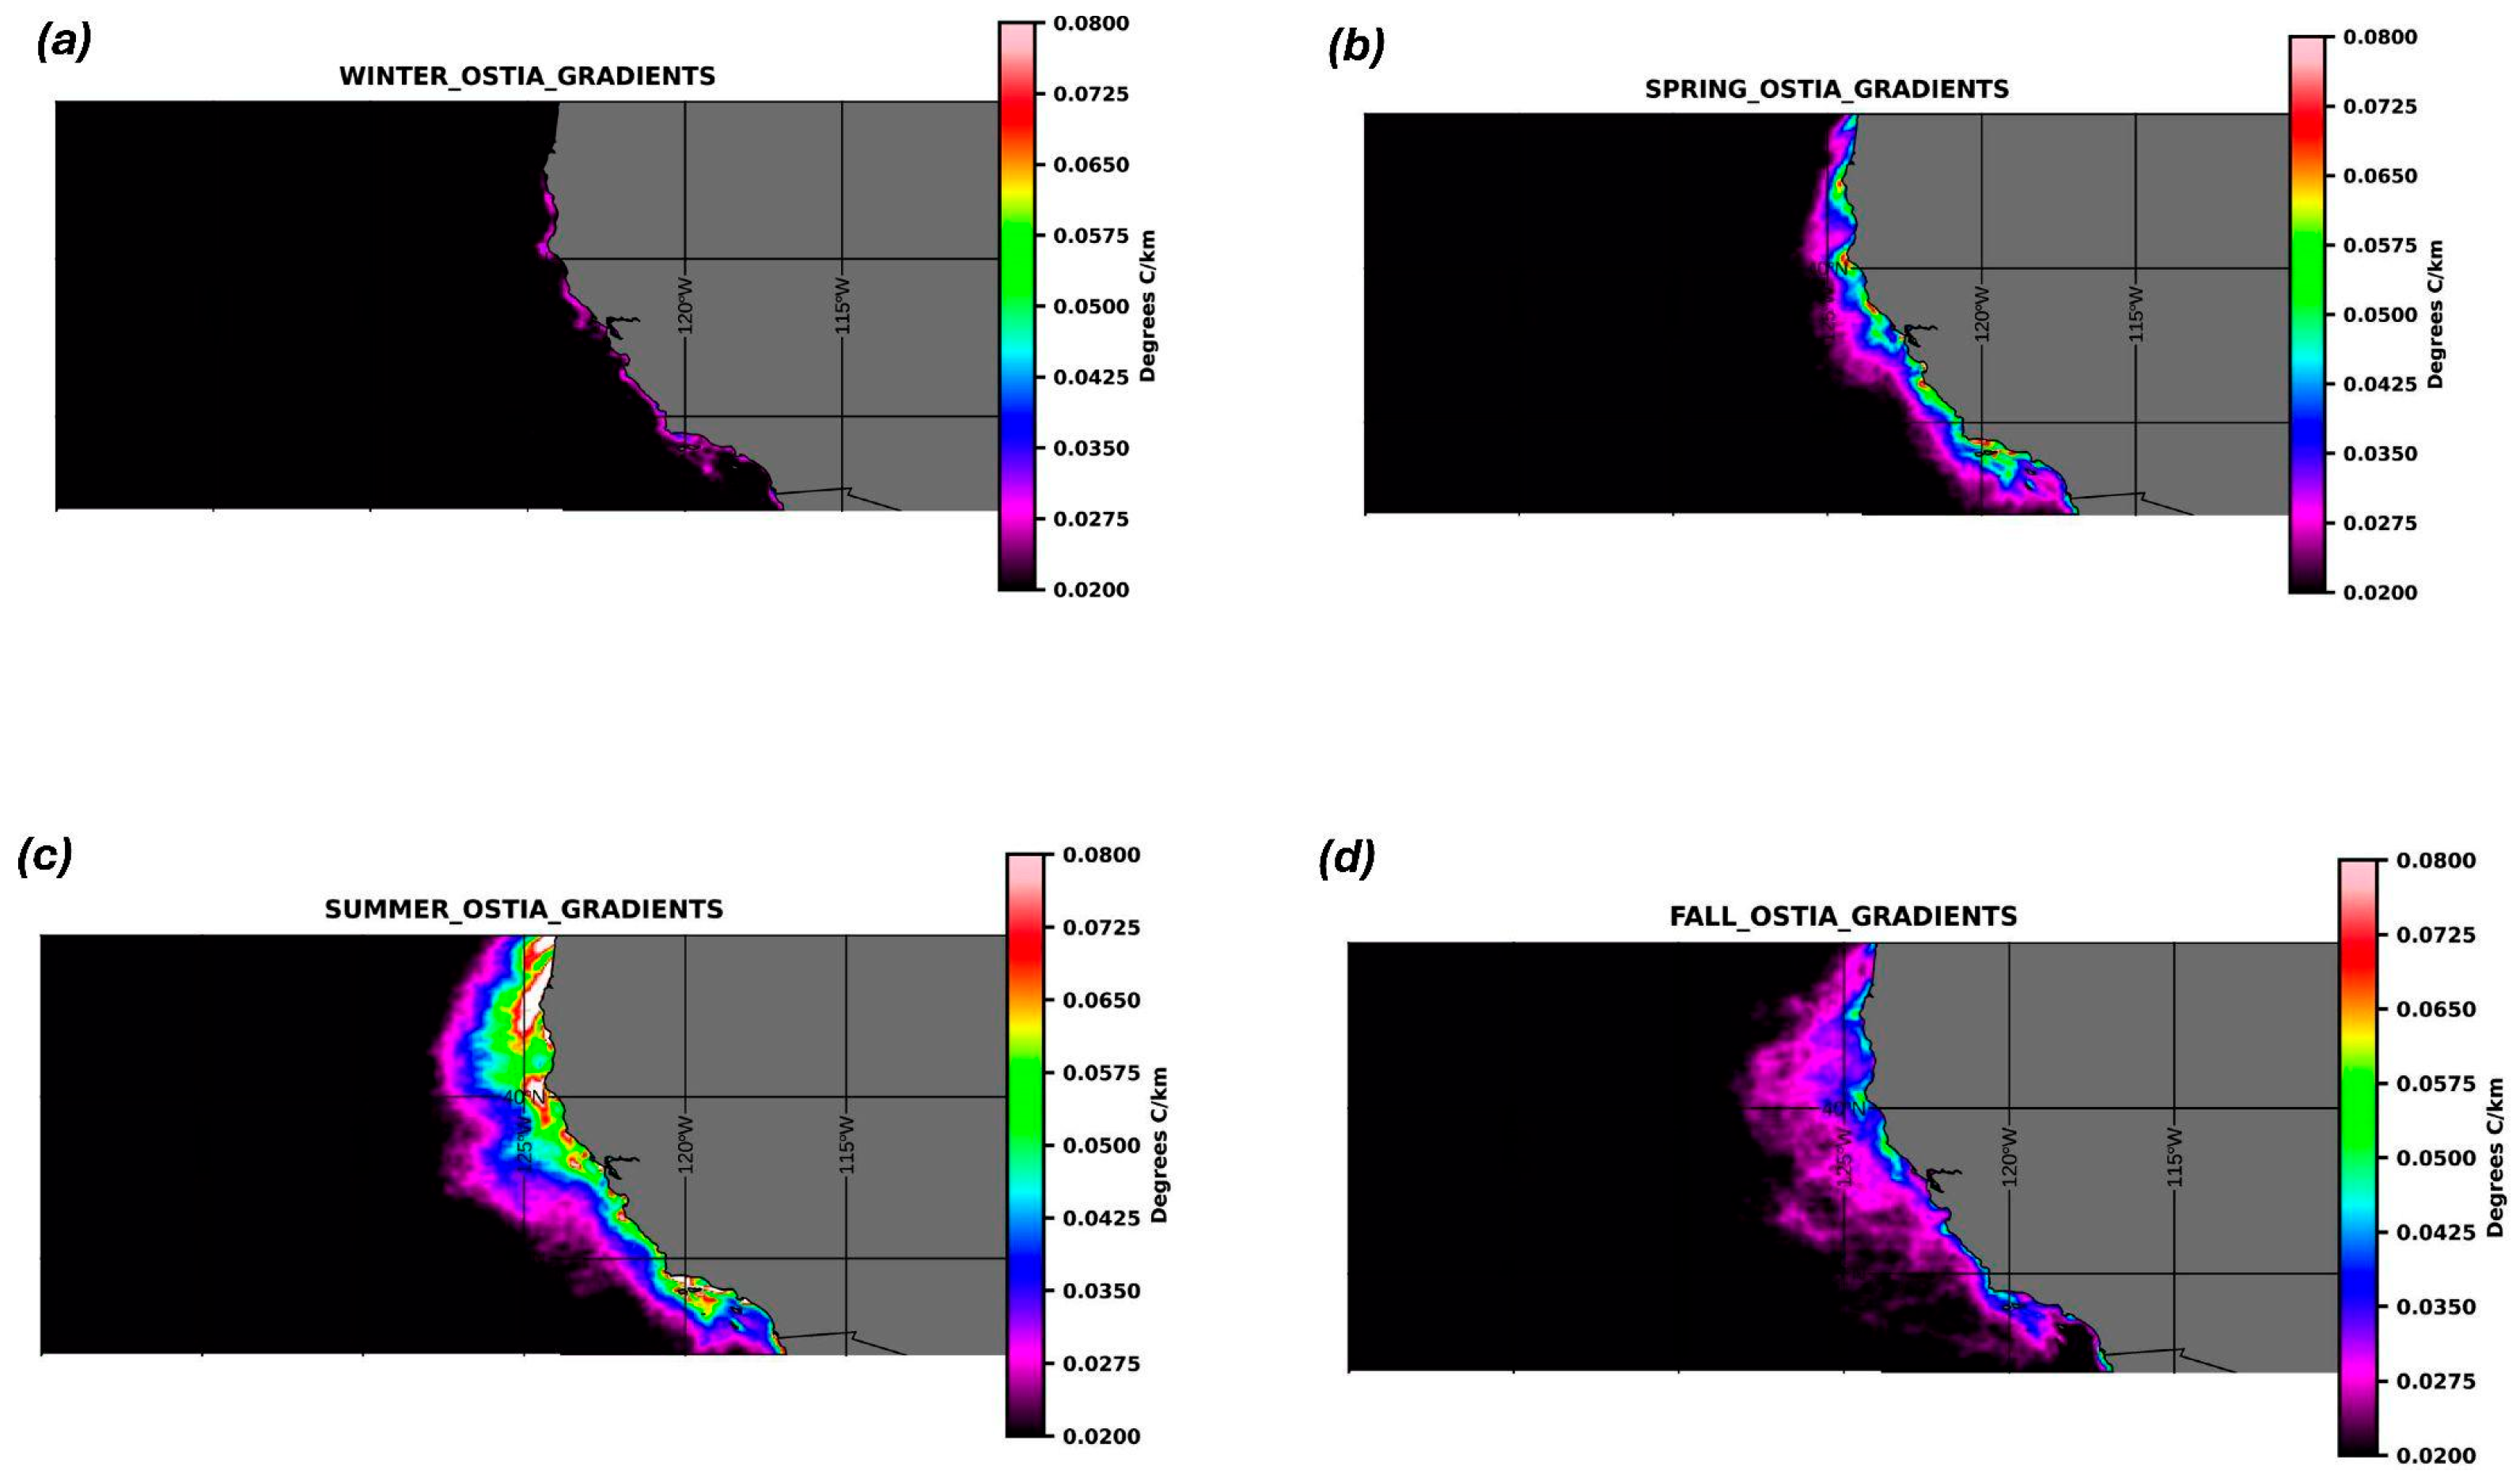
Figure 3 shows the mean seasonal gradients for the OSTIA dataset. The results are consistent with MUR in showing the largest gradients in the summer time frame and the lowest gradients in the winter time frame. A relaxation of the gradients is once again seen in the fall time frame. Visually, the results are consistent with the MUR dataset. The OSTIA gradients during the maxima in summer appear smoother than MUR, with MUR showing more characteristics of frontal structures. This will be examined further in the Section 4.
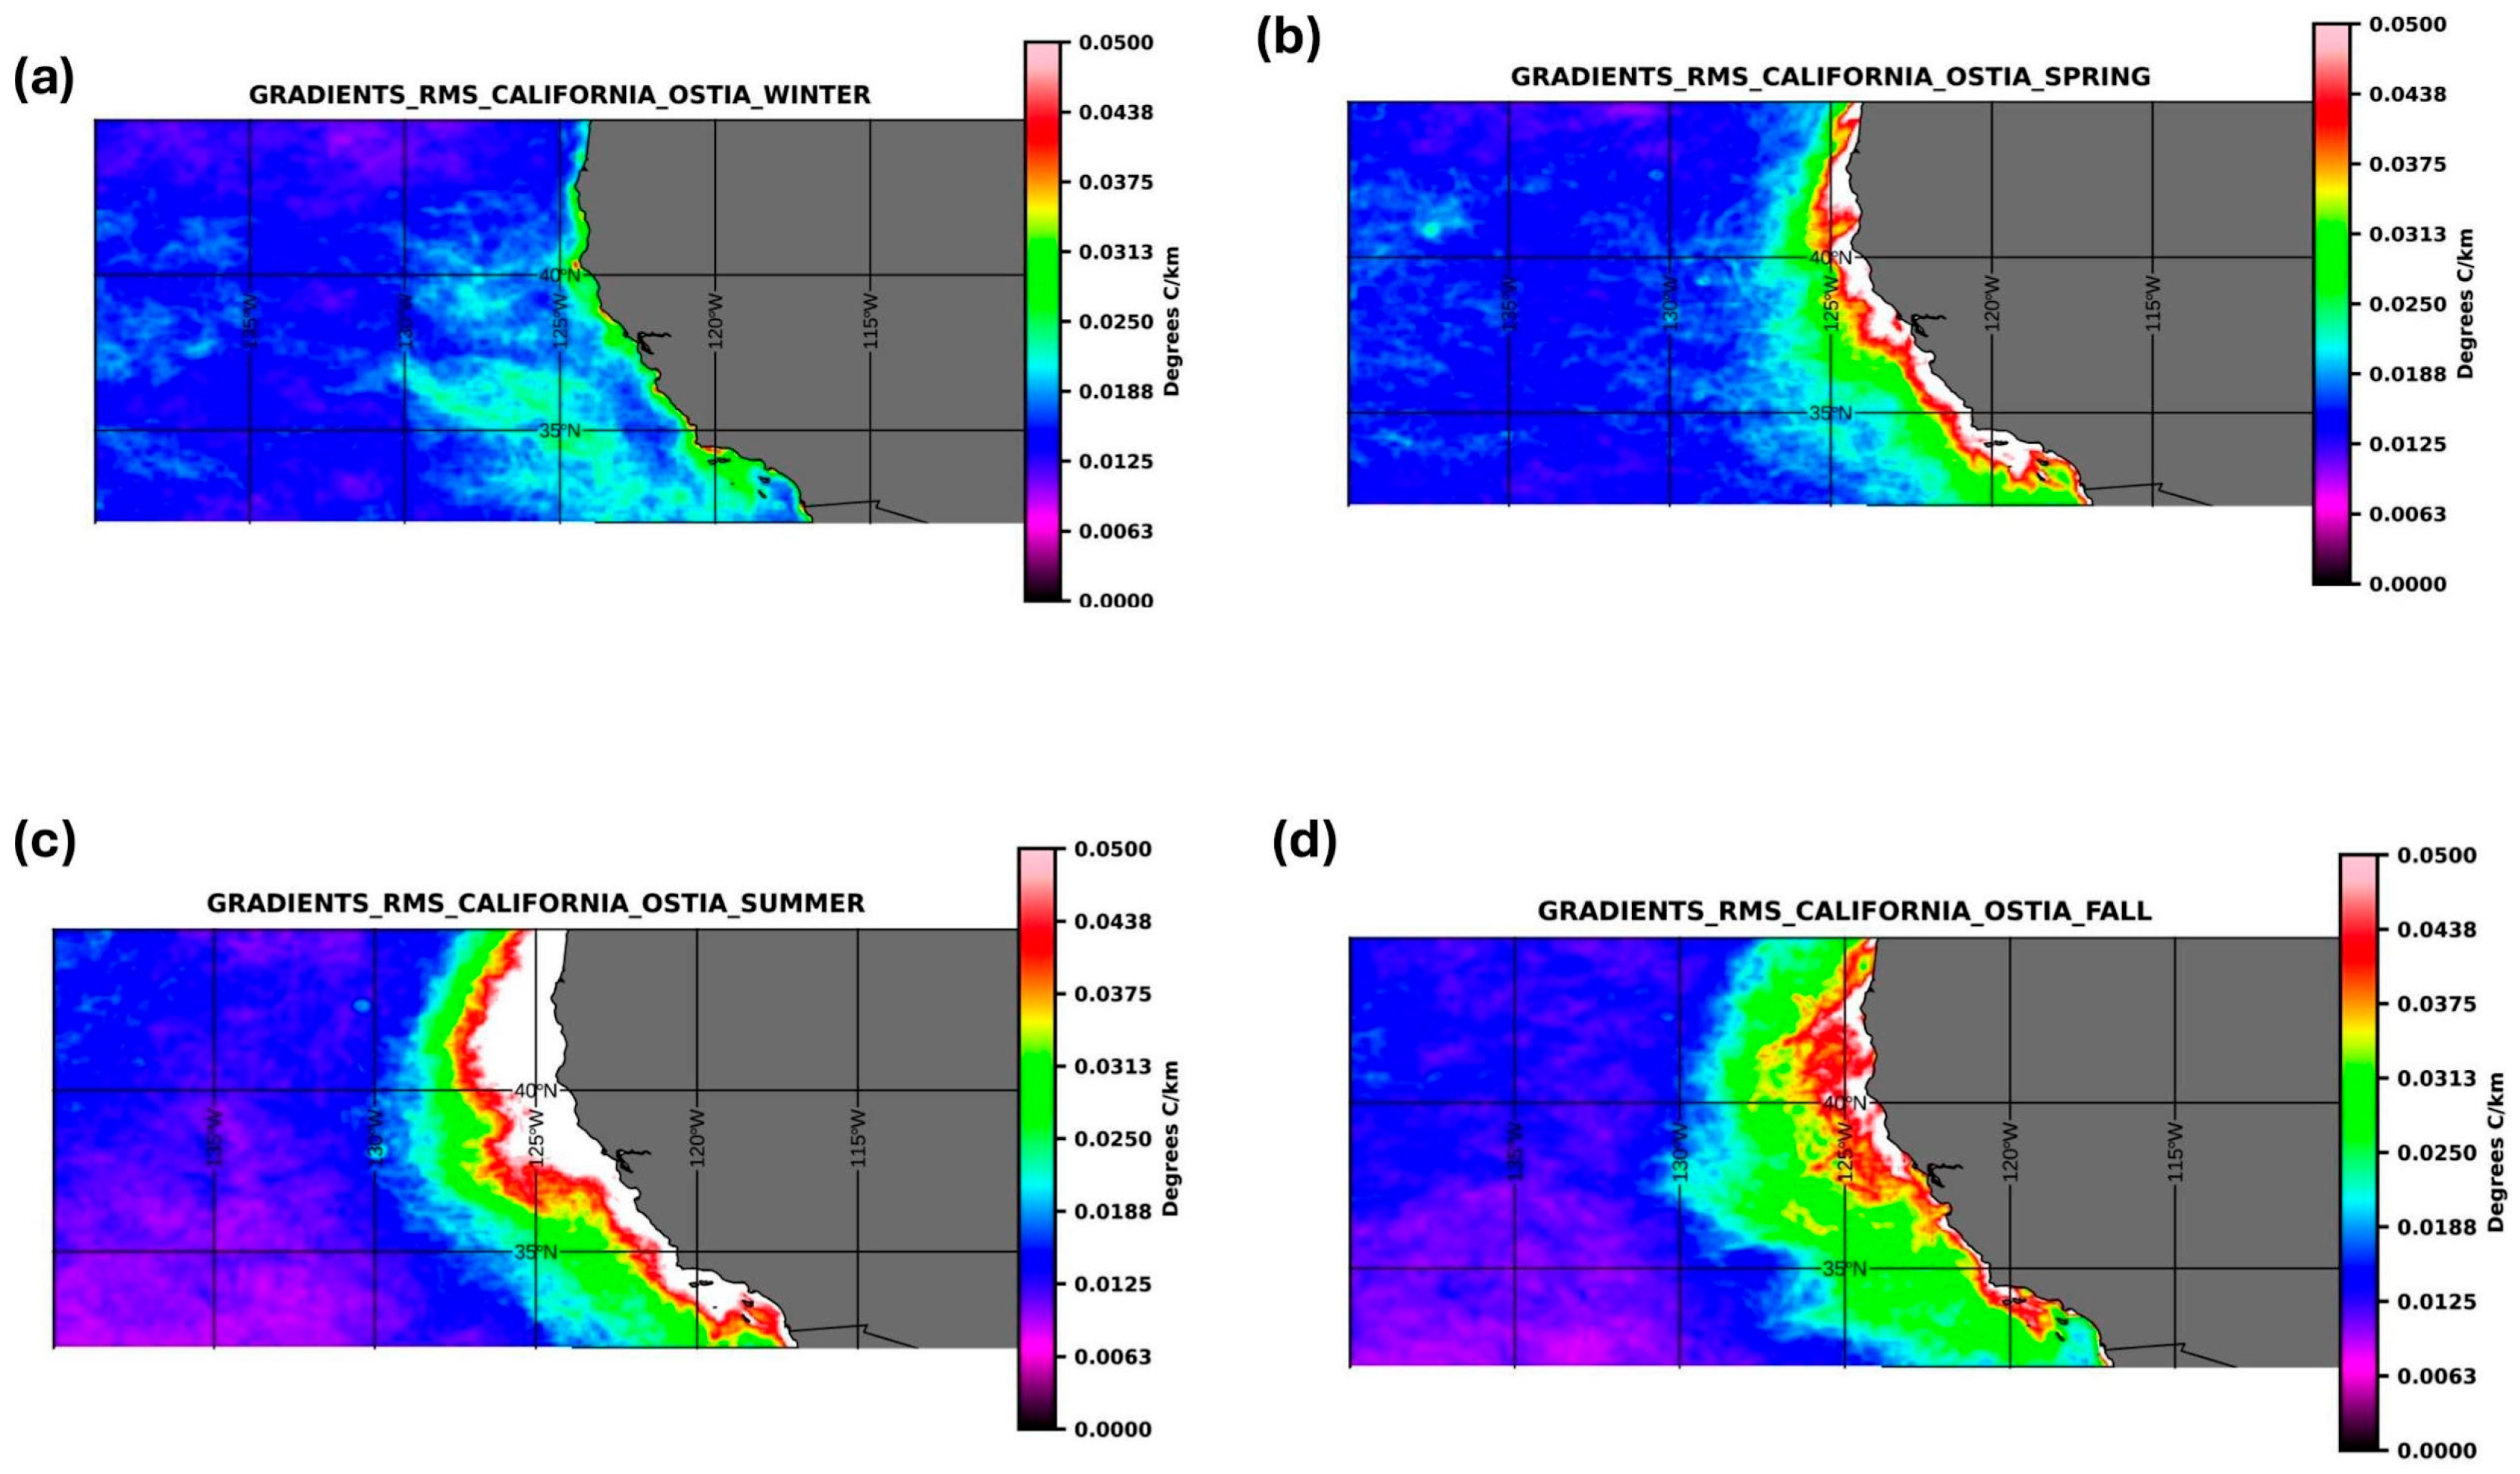
Figure 4 shows the root mean square variability associated with the OSTIA SSTs for the different seasons. Consistent with MUR, the maxima variability is seen in the summer time frame and is associated with the maxima in the coastal upwelling. The maxima values reach 0.11 °C/km during the summer (Table 1). The OSTIA SST gradients extend farther offshore than MUR’s. This is also most likely due to the smoothness of the OSTIA dataset when compared with MUR, as well as cloudy conditions close to the coast. OSTIA incorporates geostationary data, which would lead to more cloud-free pixels. One possibility is that the lower-resolution OSTIA is smoother over frontal features. A detailed analysis is beyond the scope of this work but needs to be a part of future research.
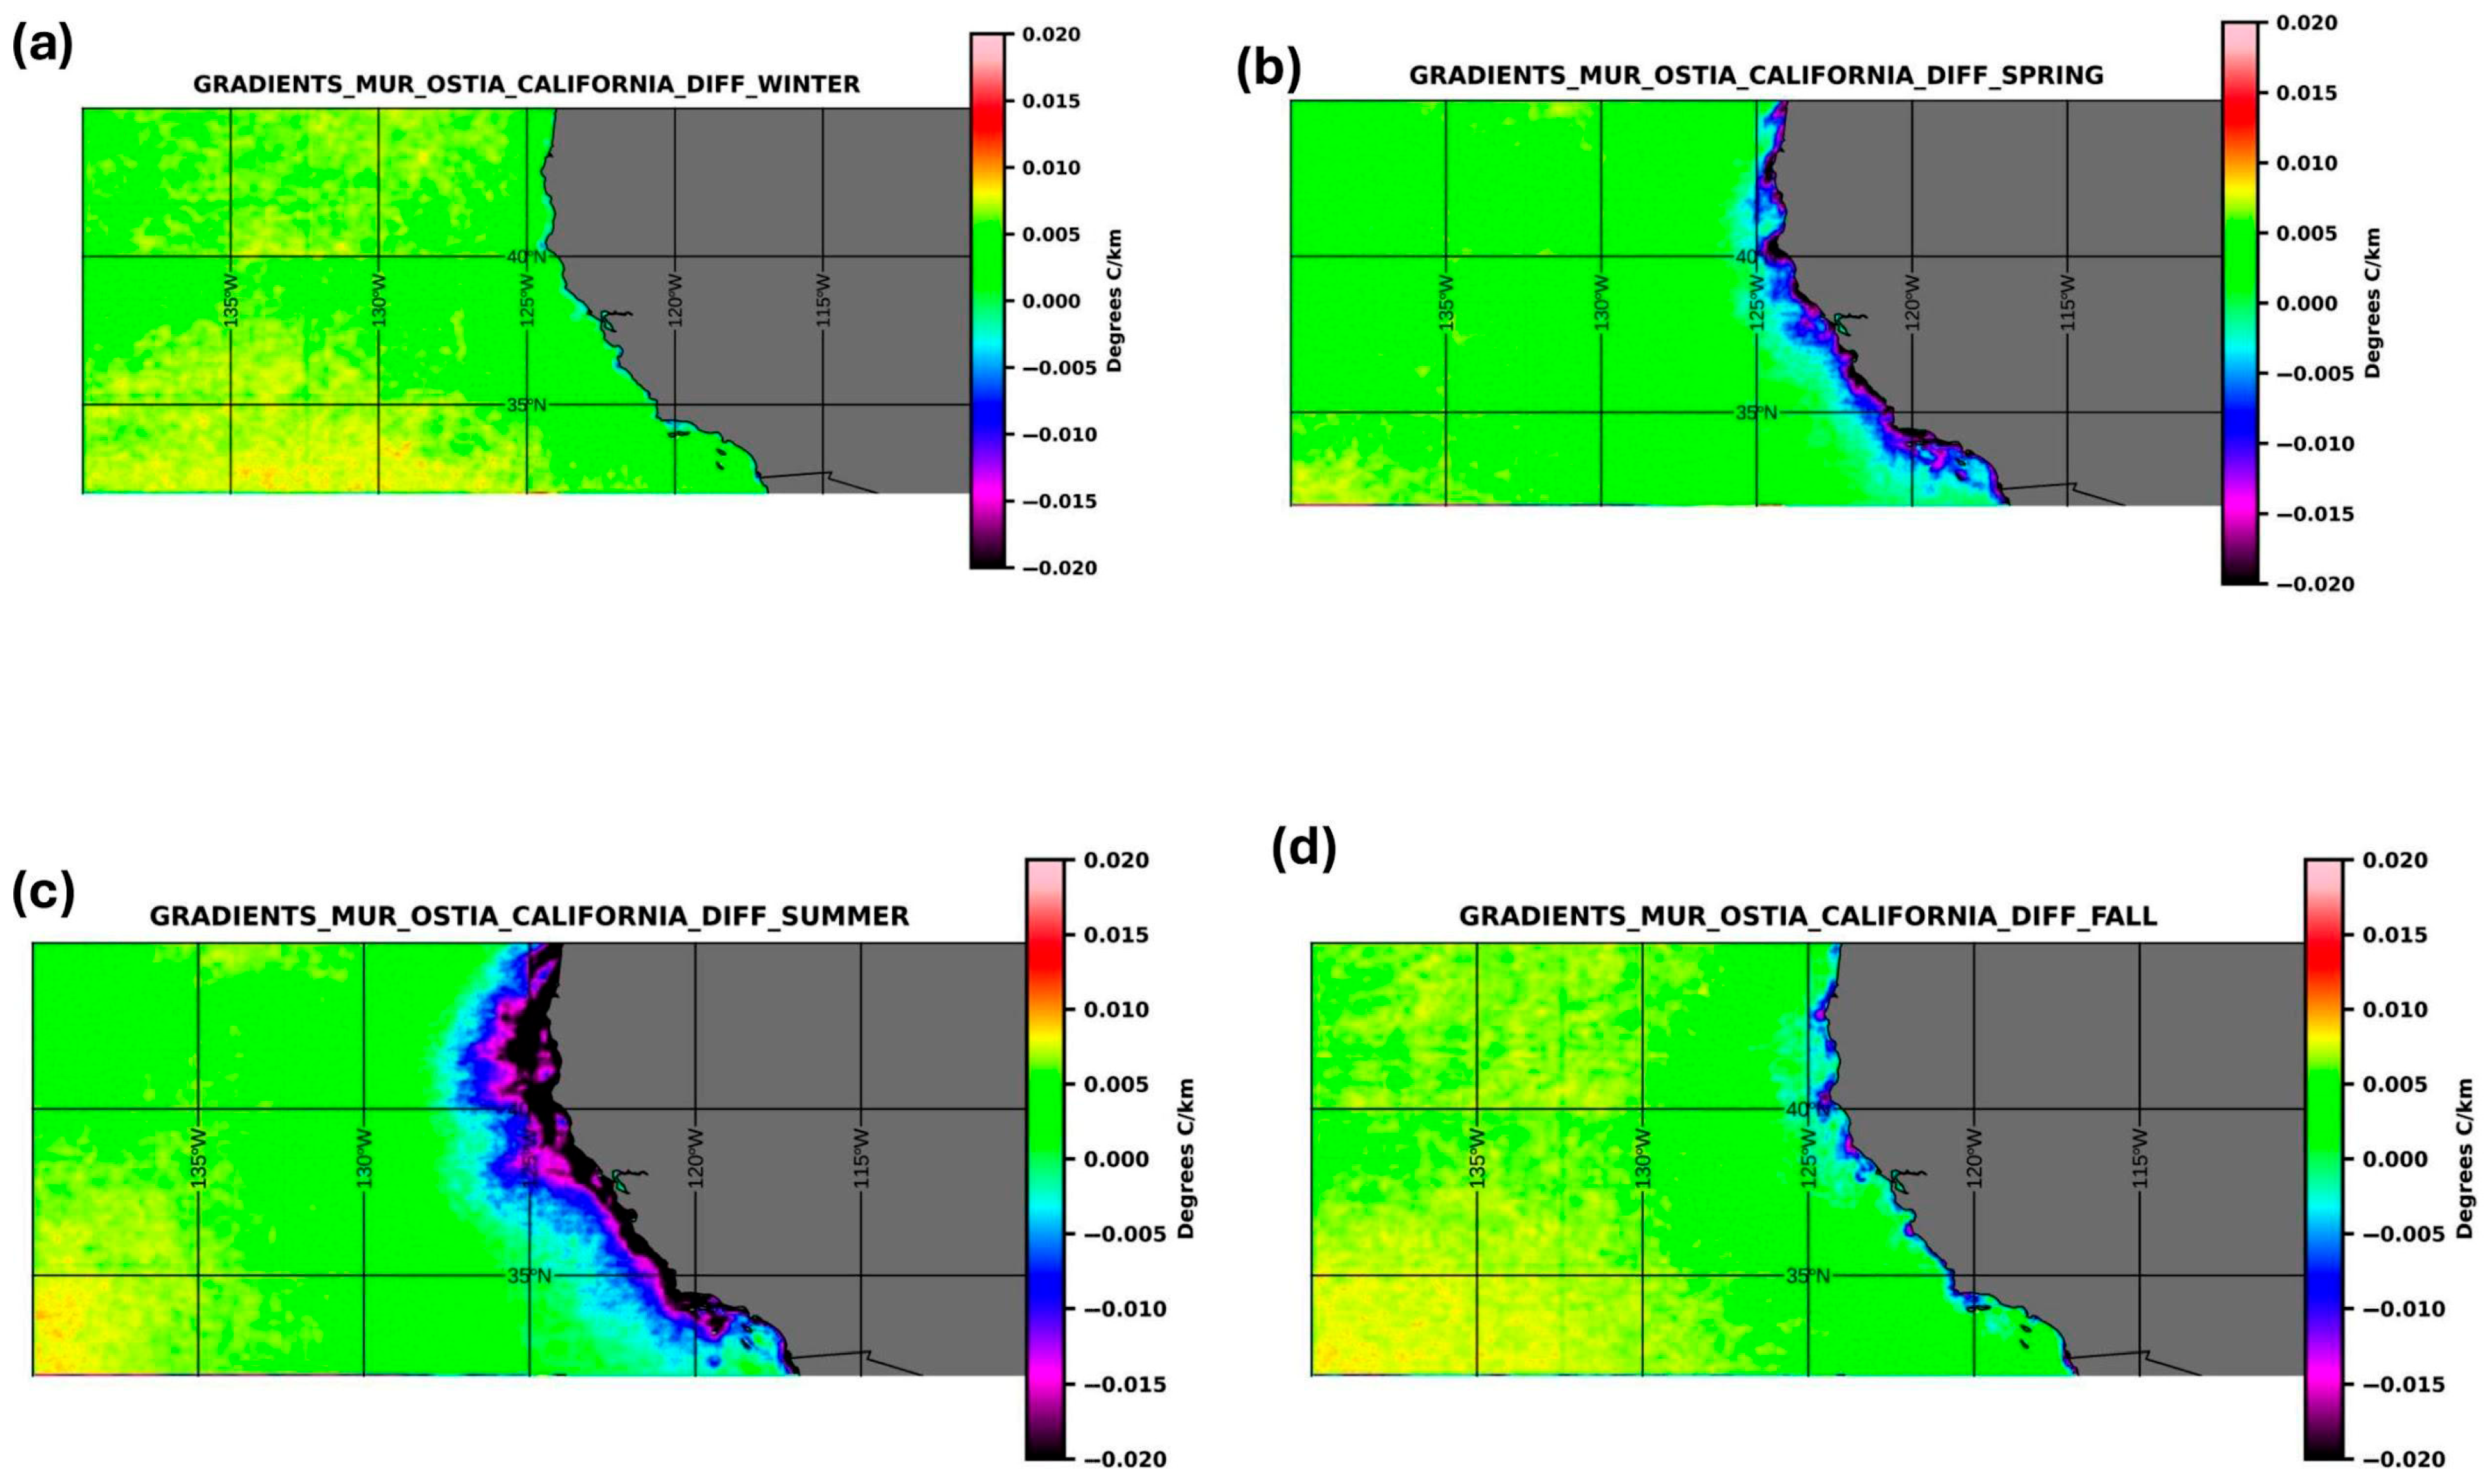
Figure 5 shows the seasonal mean differences in gradients between the MUR and OSTIA datasets. During the winter, the differences are closest to zero. The largest mean differences occur during the summer time, which is the season associated with the maxima in upwelling. MUR shows a decrease in the gradient by 0.01 to 0.015 °C/km. The blue and purple colors indicate that the MUR-derived SST gradients are lower than the OSTIA gradients. This could be due to issues of cloud cover where the inclusion of geostationary data in OSTIA could increase the number of cloud-free pixels. This is discussed further in the Conclusions. A reduction in the mean differences is associated with a period of relaxation during the fall time frame. The differences between the OSTIA and MUR SST gradients could be due to the reduced gradients associated with the collocation of MUR to OSTIA using the nearest neighbor approach. This will be discussed further in the next section.
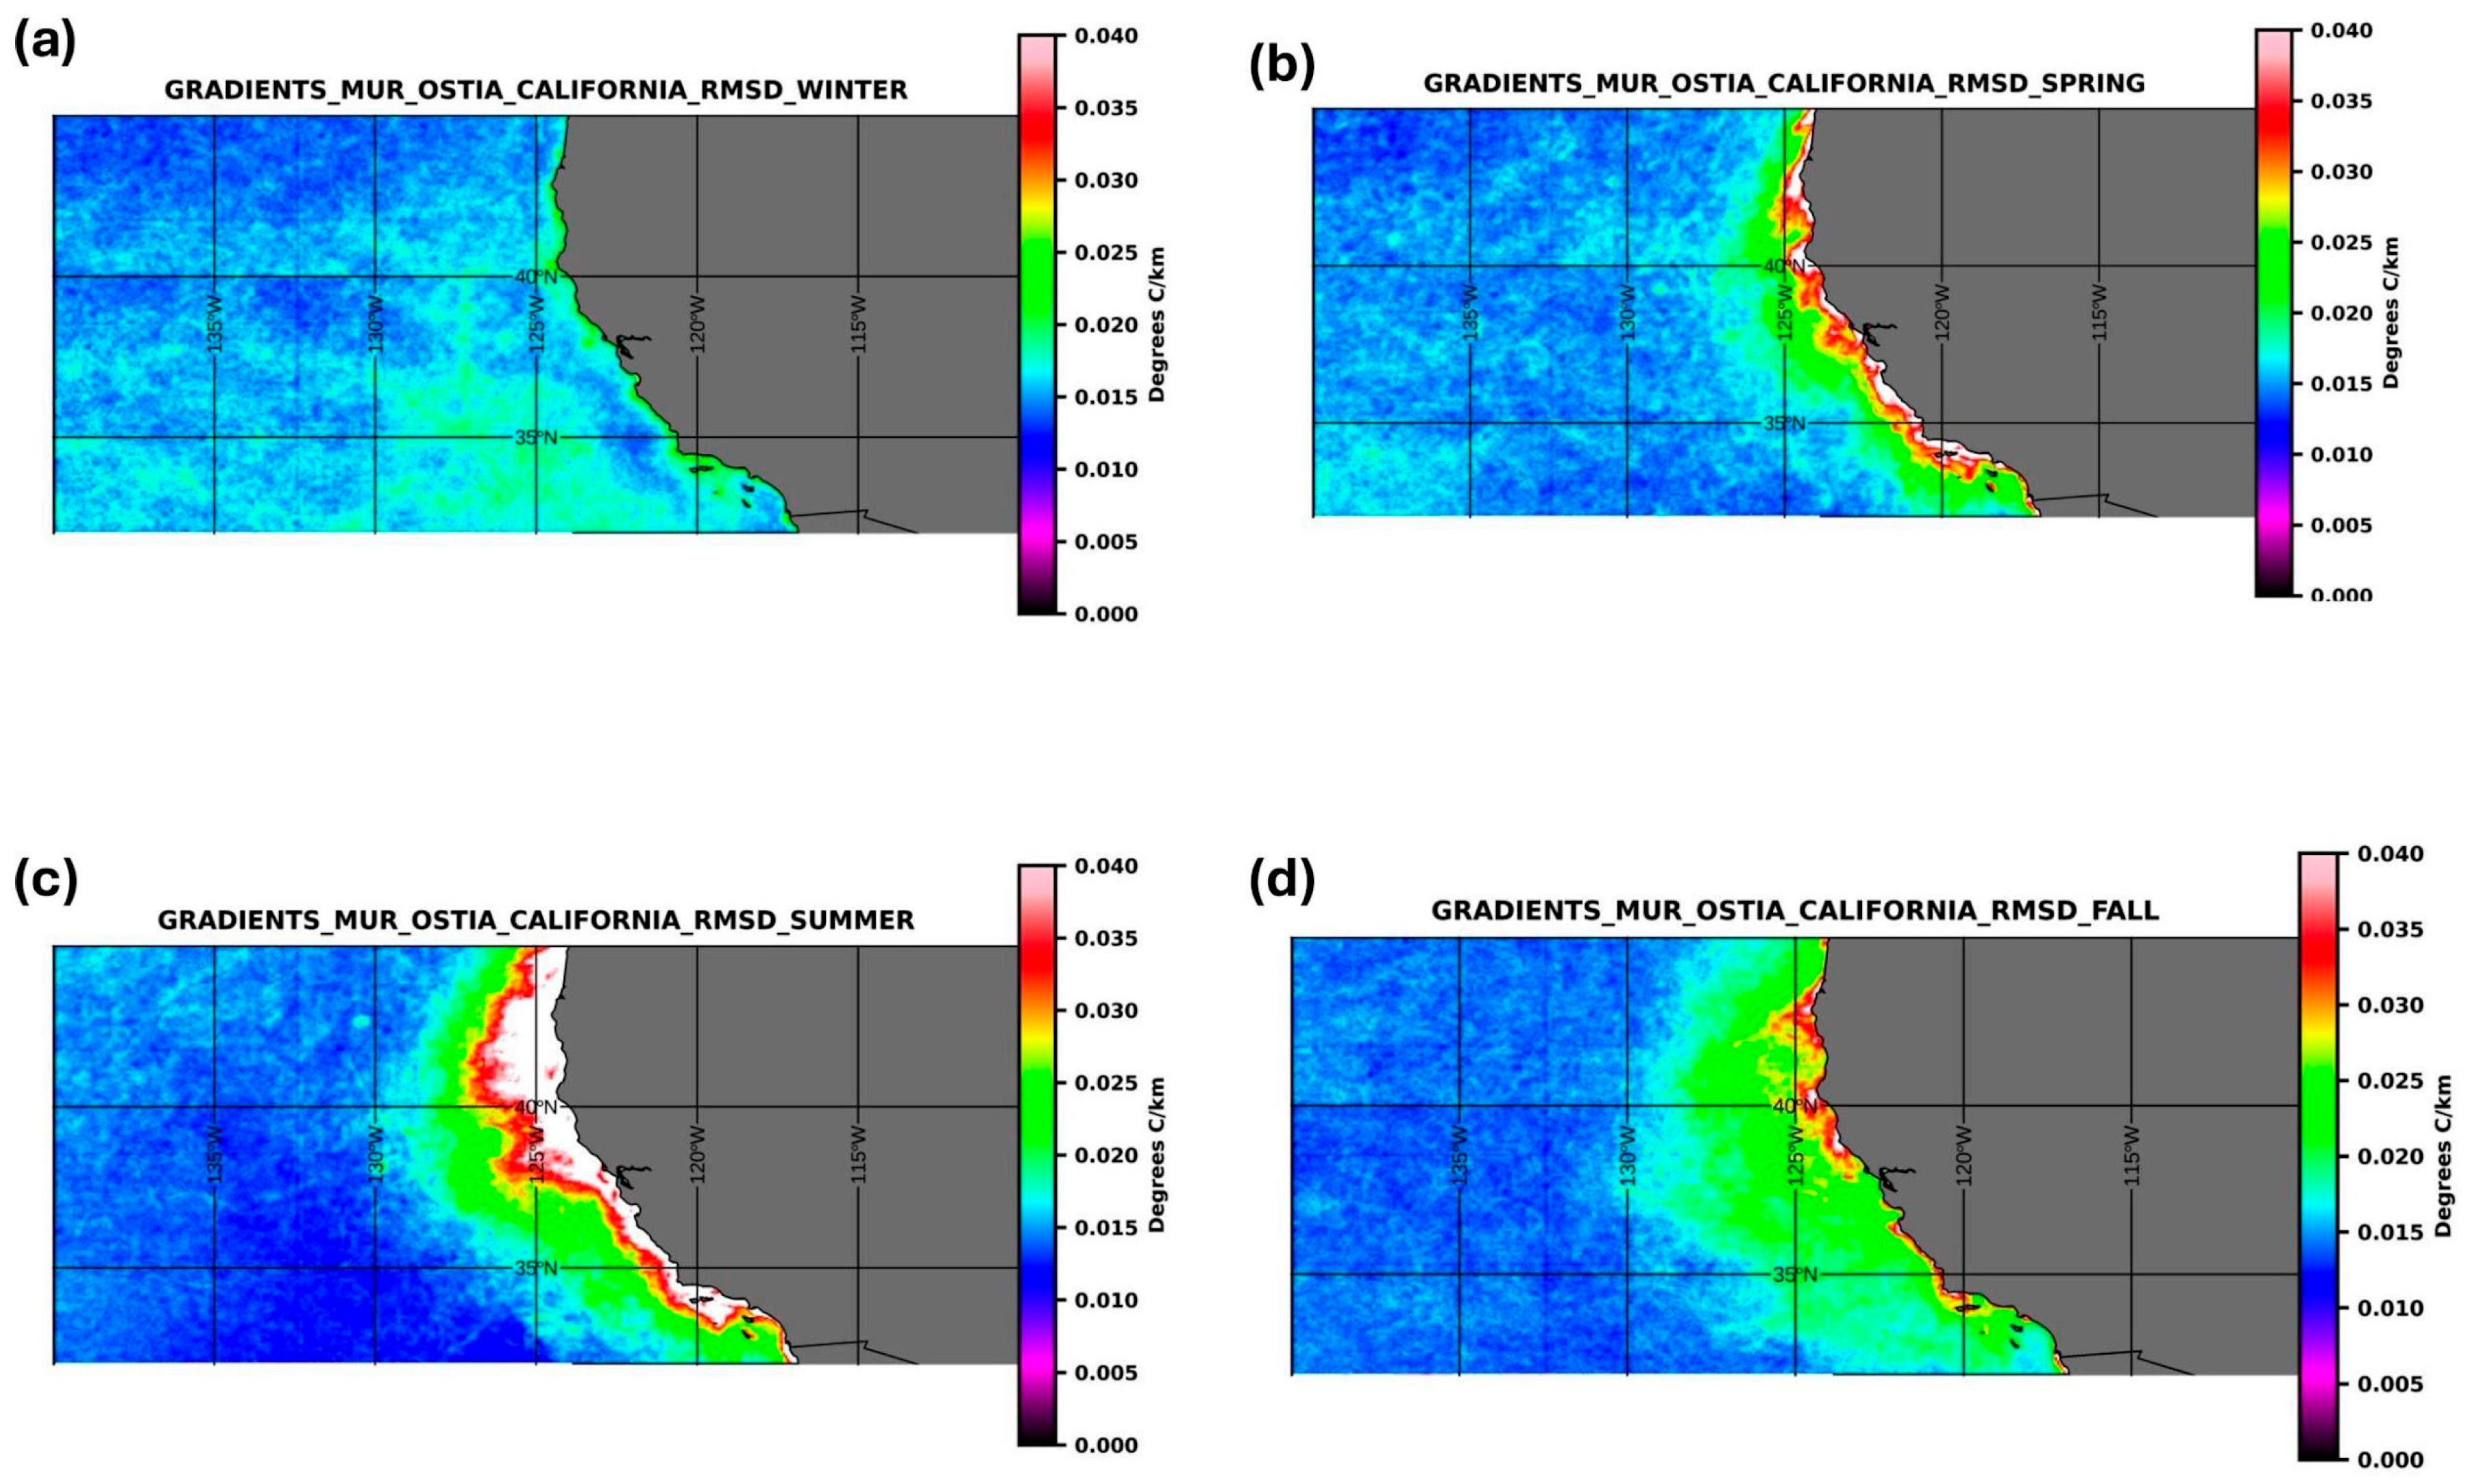
Figure 6 shows the seasonal root mean squared differences between the MUR- and OSTIA-derived SST gradients. The largest differences are seen in the summer time frame, consistent once again with the maxima in upwelling. The maxima RMSD of approximately 0.08 °C/km occurs in the summer time frame, with the spring and fall seasons showing high values only near the coast. The minima RMSD is seen in winter during the minimum in upwelling. The differences reach 0.02 °C/km. Thus, the differences between these datasets all seem to be associated with the seasonality of the coastal dynamics.
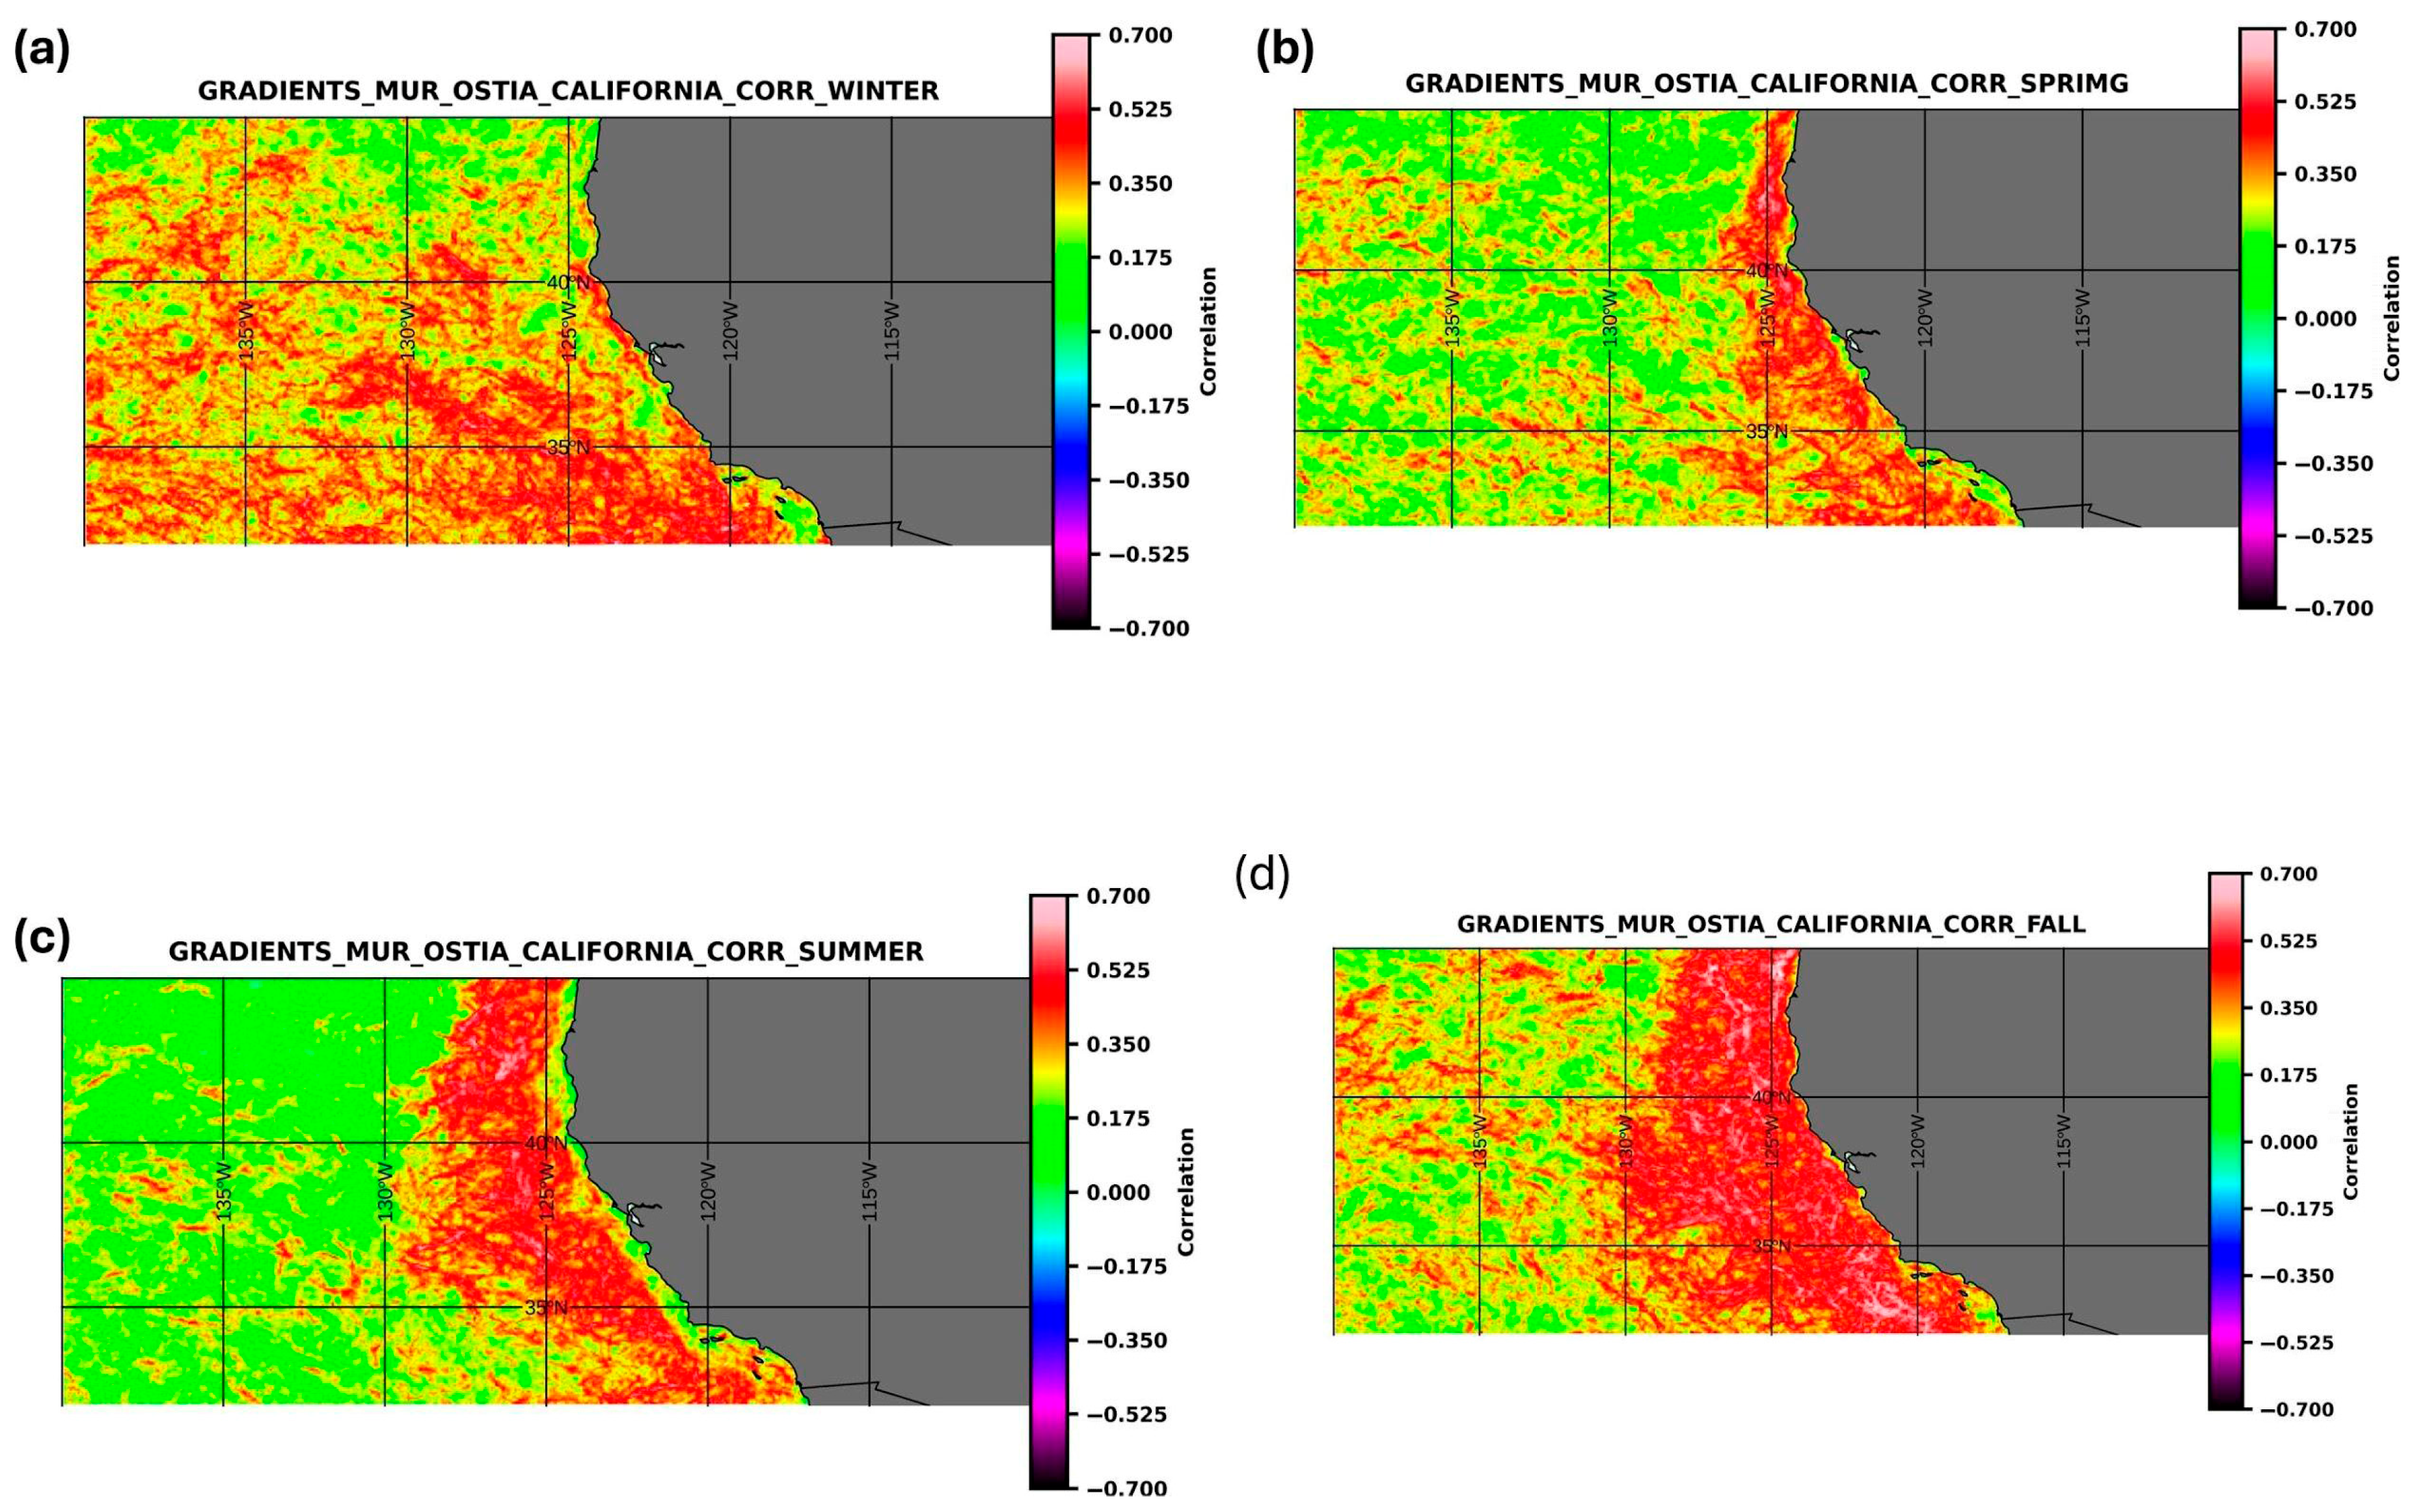
Figure 7 shows the correlation between SST gradients from the OSTIA and MUR datasets for the four different seasons. Significant differences in correlations exist depending on the season. Compared to the other seasons, winter shows a band of low correlation along the coast. Spring shows increasing correlations, but lower correlations still exist along the coast. Summer shows high correlations in the California Current System (CCS) region offshore from the coast and lower correlations in the coastal band. Lower correlations exist along the coast, indicative of differences in the area of coastal upwelling. Fall shows the overall highest correlations extending offshore several hundreds of kilometers covering the coastal regions and also the region associated with the CCS. Figure 7 indicates that the highest correlations were on the order of 0.5. A confidence test for 6000 independent samples (the MUR dataset has 7518 daily files) would indicate statistical significance of a 0.5 correlation with a p-value of 0.05 or 95 percent confidence. Thus, over a majority of the area close to the coast (red), statistically significant correlations exist between MUR and OSTIA.
An issue that will be addressed further are the differences in the magnitude of the gradients resolved by the two products. Table 1 shows a summary of the maxima of the SST gradient for the four seasons for each product. For all four seasons, the maxima in the OSTIA-derived SST gradients were greater than the MUR SST gradients. The difference was greatest during the summer when the maxima in upwelling occur. The maximum in the OSTIA-derived SST gradients was 0.11 °C/km, while for MUR, the maximum was 0.06 °C/km. The winter time frame showed the minimum in SST gradients, with both OSTIA and MUR showing maxima in gradients on the order of 0.037 °C/km. The differences between the two products will be examined further in the Section 4.
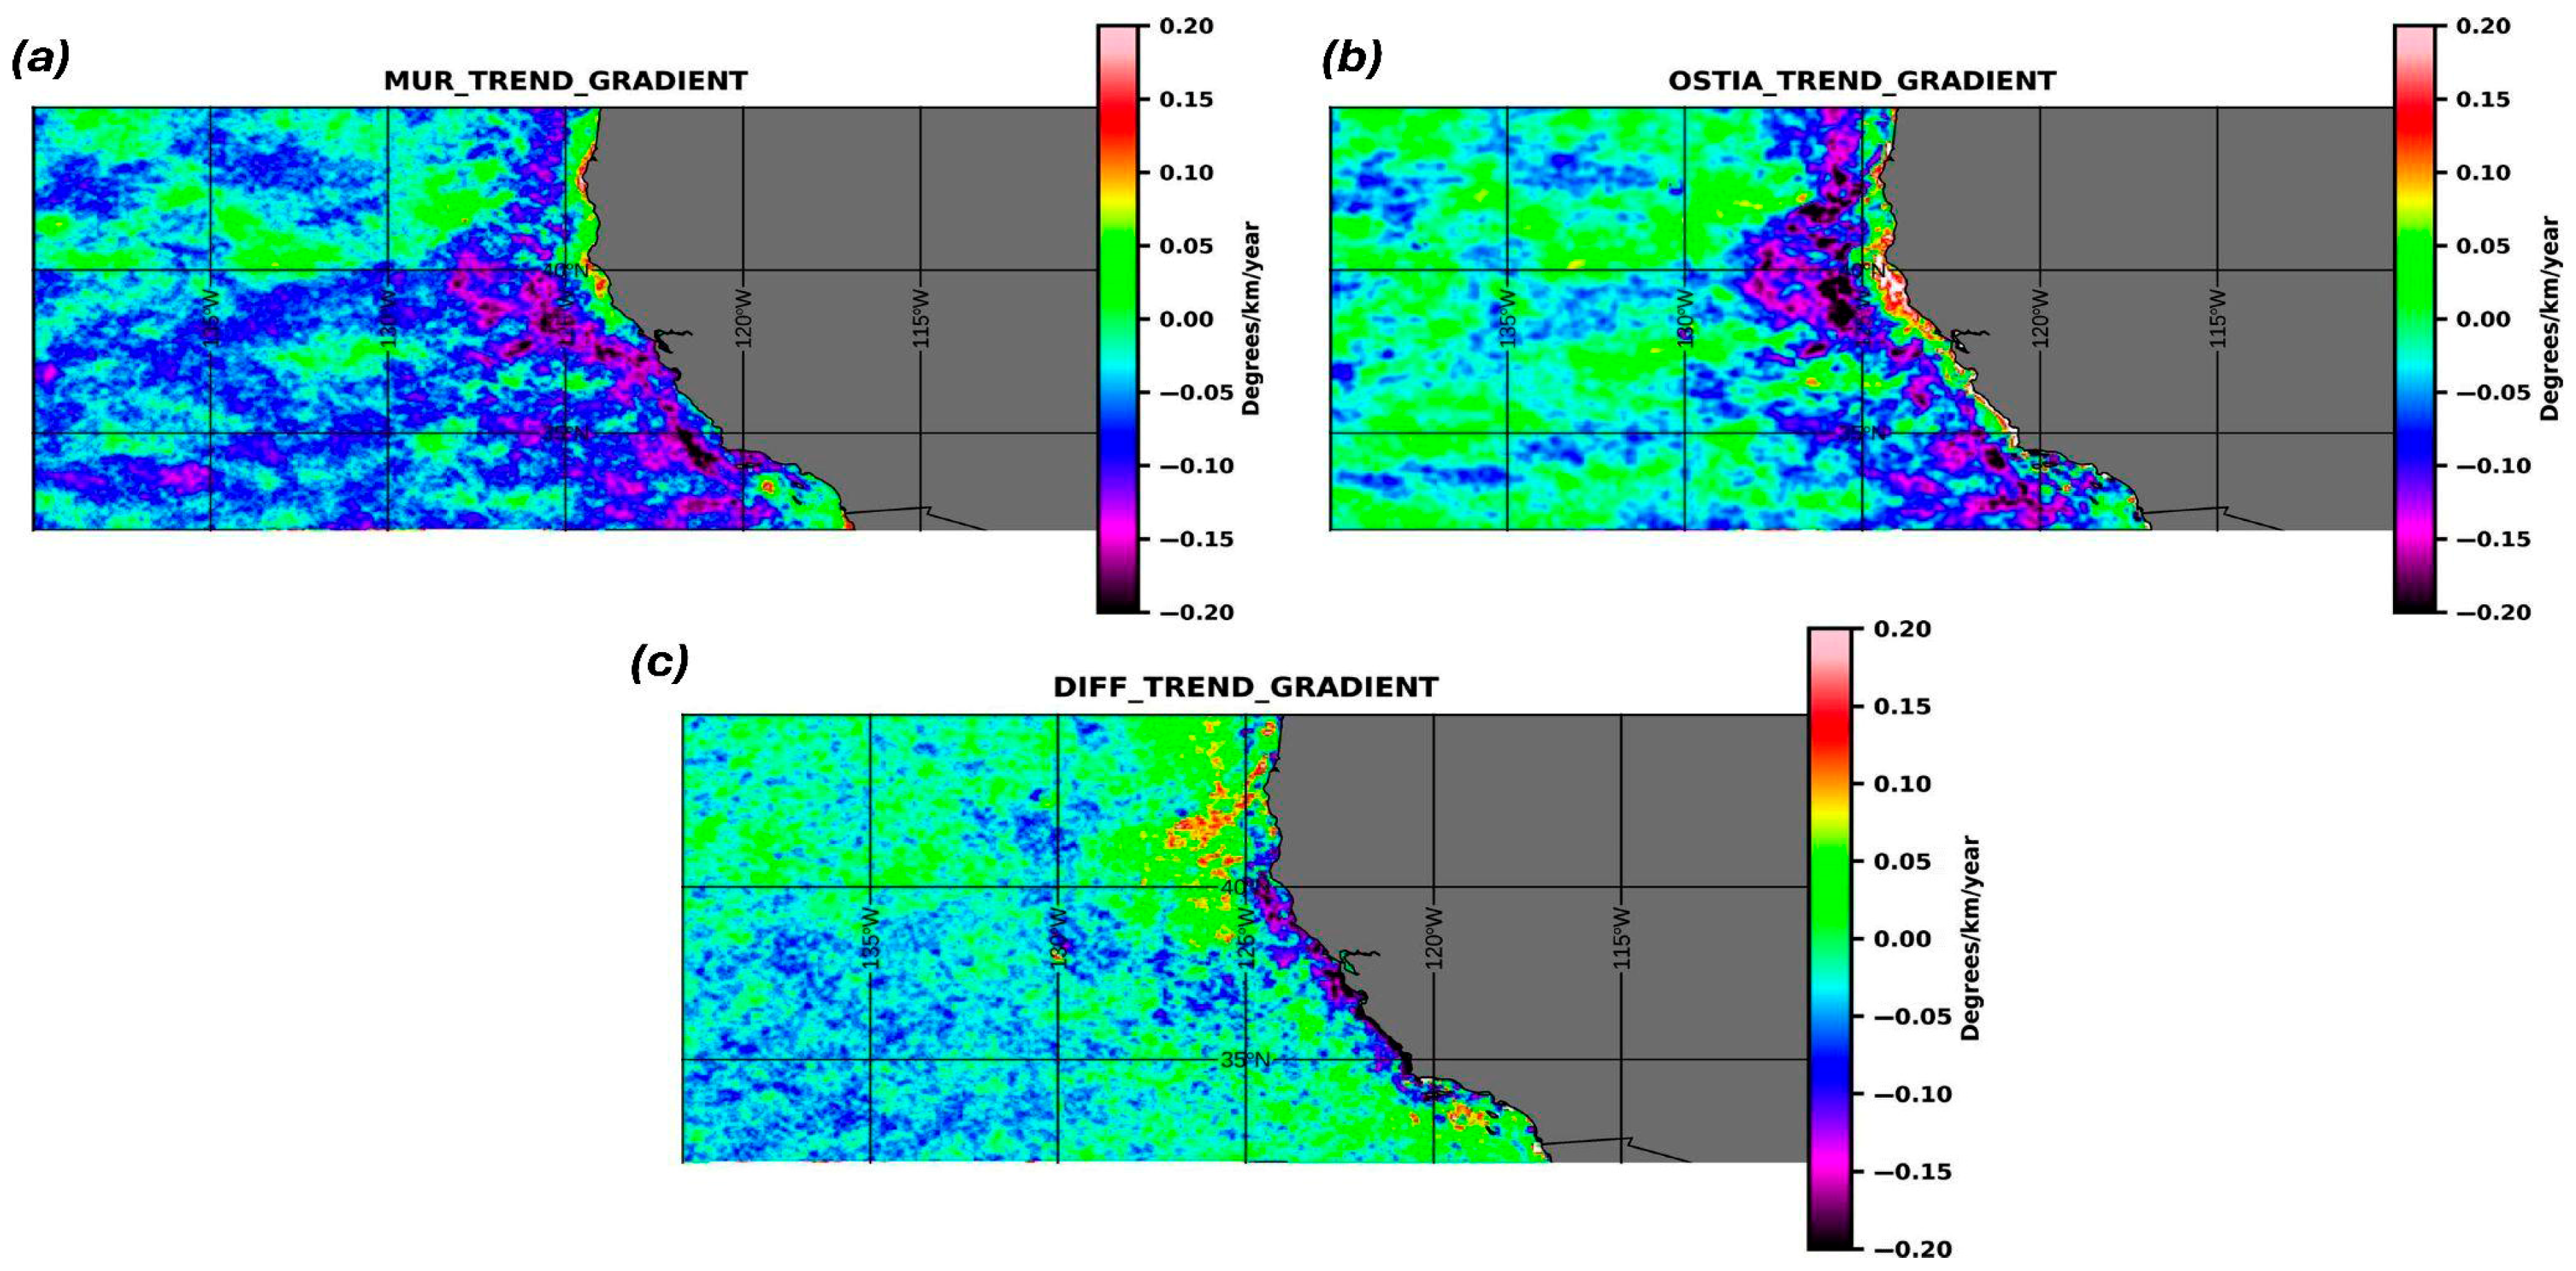
Figure 8 shows the application of a linear trend to the MUR and OSTIA SST data, over the full time period from 2002 to 2023. Close to the coast, both MUR and OSTIA show a positive increasing trend in SST gradients. Maxima values of approximately 0.3 C/km/year occurred near the coast between 38°N and 43°N. Negative values of −0.3 °C/km/year occurred at approximately 38°N around 200 km offshore. The largest values appear along the coast. Negative trends appear in the California Current at distances greater than 100 km from shore, associated with the California Current proper. Using the IDL linfit routine, we examined the statistical significance for the trends observed in Figure 8. The linfit routine in IDL allows one to derive a SIGMA value, which is the uncertainty in the trend. Close to the coast, the uncertainty values in the trends were on the order of 0.000015 °C/km/day, while the trends were on the order of 0.0002 °C/Km/day. Thus, the uncertainties were considerably lower than the magnitude of the trends, indicative of the statistical significance of the trends. Additionally, the IDL linfit routine has a probability value that indicates the overall probability of the trend being different from zero. Thus, values close to the coast, based on these tests, could all be identified as non-zero trends in the MUR and OSTIA data.
A difference between the two datasets in the coastal region can be identified between 35°N and 38°N. The largest differences (Figure 8c) occurred between 35°N and 40°N, with MUR showing lower values than OSTIA. Overall, in the CCS region MUR and OSTIA showed similar values. Positive values along the coast would be consistent with increasing upwelling. Future work will have to focus on analyzing these differences, as well as possible explanations for the negative SST gradient trends farther offshore. The work is important as it relates directly to the monitoring of upwelling in coastal systems and possible changes in the CCS.

4. Discussion

4.1. Seasonal Signal

The first goal of this work was to examine the seasonality in SST gradients in both SST products. Both the MUR- and OSTIA-derived SST gradients show a similar seasonal signal with maxima gradients occurring in the summer time frame. Table 1 summarizes the maxima gradients in the study regions for the four seasons for the MUR- and OSTIA-derived SST gradients. Minima gradients occur in the winter time frame for both the OSTIA and MUR SST gradients. For all four seasons, the maxima in the MUR SST gradients are less than in the OSTIA SST gradients. This will be discussed further in Section 4.3. Ref. [42], using buoys off the California Coast, found a similar seasonality for coastal upwelling. These results show an important application of SST gradients and follow up on the results of [24] in a validation study. Ref. [24] showed that in comparisons with SST gradients derived from the Saildrone uncrewed vehicle, statistically correlated gradients of 0.85 were found between the MUR- and Saildrone-derived gradients. The results should be considered as motivation for future work and the application of SST gradients to identify annual cycles in fronts associated with both mesoscale and submesoscale frontal variability off the California Coast.

4.2. Trend Analysis

The second goal was to examine linear trends in the SST gradients between OSTIA and MUR. Trend analysis is commonly used to assess changes in conditions during the period of the available data. The OSTIA and MUR SST gradients show different values of linear trends, in magnitude—near the coast, the OSTIA trend is larger—and sign—offshore MUR shows negative trends. OSTIA also shows negative trends but over different spatial areas than MUR. Research [31,35,37,43] has found a trend of strengthening winds along the California Coast that should be consistent with an increase in the magnitude of the associated SST gradients due to increased upwelling activity. However, important differences are seen between products at the coast, where coastal upwelling occurs. The OSTIA SST gradients show large and positive trends along the coast, which are larger in northern California, indicating increased activity. On the other hand, the MUR SST gradients show a positive trend in northern California, although not extended offshore, while it shows negative trend values in central and southern California, indicating decreased activity.
These differences are important to analyze in depth, as this type of analysis is standard for assessing changes in conditions, and we need to understand why these products give such different results. In the next section, we discuss the potential sources of the differences in SST gradients and the trends between products.

4.3. Analysis of Differences Between MUR and OSTIA Seasonal Gradients

It is obvious that differences occur between the MUR- and OSTIA-derived SST gradients. Differences in the SST between the two SST products in upwelling areas have been reported previously [44]. A major focus of the work is on what could be causing the larger magnitudes in the OSTIA-derived gradients. This result seems to contradict that a higher spatial resolution (1 km) should show larger magnitudes of the gradients. There are several reasons this could be the cause, which include issues such as the MUR 1 km gradients being derived after collocating with 5 km OSTIA using a nearest neighbor approach. The nearest neighbor would mask out variability that is associated with smaller scale frontal features. An additional factor is the issue of cloud cover. This is relevant as OSTIA incorporates geostationary data, which have an hourly temporal resolution and thus increase the opportunity for a cloud-free pixel.
In order to interpret trend differences in the products, it is important to analyze the differences between the products themselves. A major difference is that the magnitude of the MUR SST gradients was reduced compared to the OSTIA gradients. Frontal features and submesoscale variability can be associated with scales < 5 km from the coast [45]. The scales of variability associated with the upwelling can vary. Ref. [45] determined that differences occurred between upwelling at <50 km from the coast and >50 km from the coast. The study indicated that resolution could be a determining factor in resolving the scales of variability. Thus, one possible explanation for the difference between the MUR- and OSTIA-derived SST gradients is their spatial resolution.
One possible cause that was examined for the differences between the MUR and OSTIA SST gradients was whether the collocation of the MUR 1 km SST to the OSTIA 5 km gridded SST could be impacting the magnitudes. This was performed of course to examine the root mean square differences and the mean difference. Using a nearest neighbor approach, unlike an average, or interpolation could lead to missing high-resolution frontal features in the MUR SST data. The nearest neighbor was chosen to facilitate processing of the 20+-year dataset. The derivation of SST gradients, even for subsetted regions, can be computer-intensive. Other possible explanations were that MUR incorporates only nighttime data, while OSTIA incorporates both daytime and nighttime data as well as data from the geostationary satellites. The incorporation of daytime data, as well as the geostationary-derived SSTs, would increase the number of cloud-free pixels. We looked at both of these issues to examine if they could impact the results.
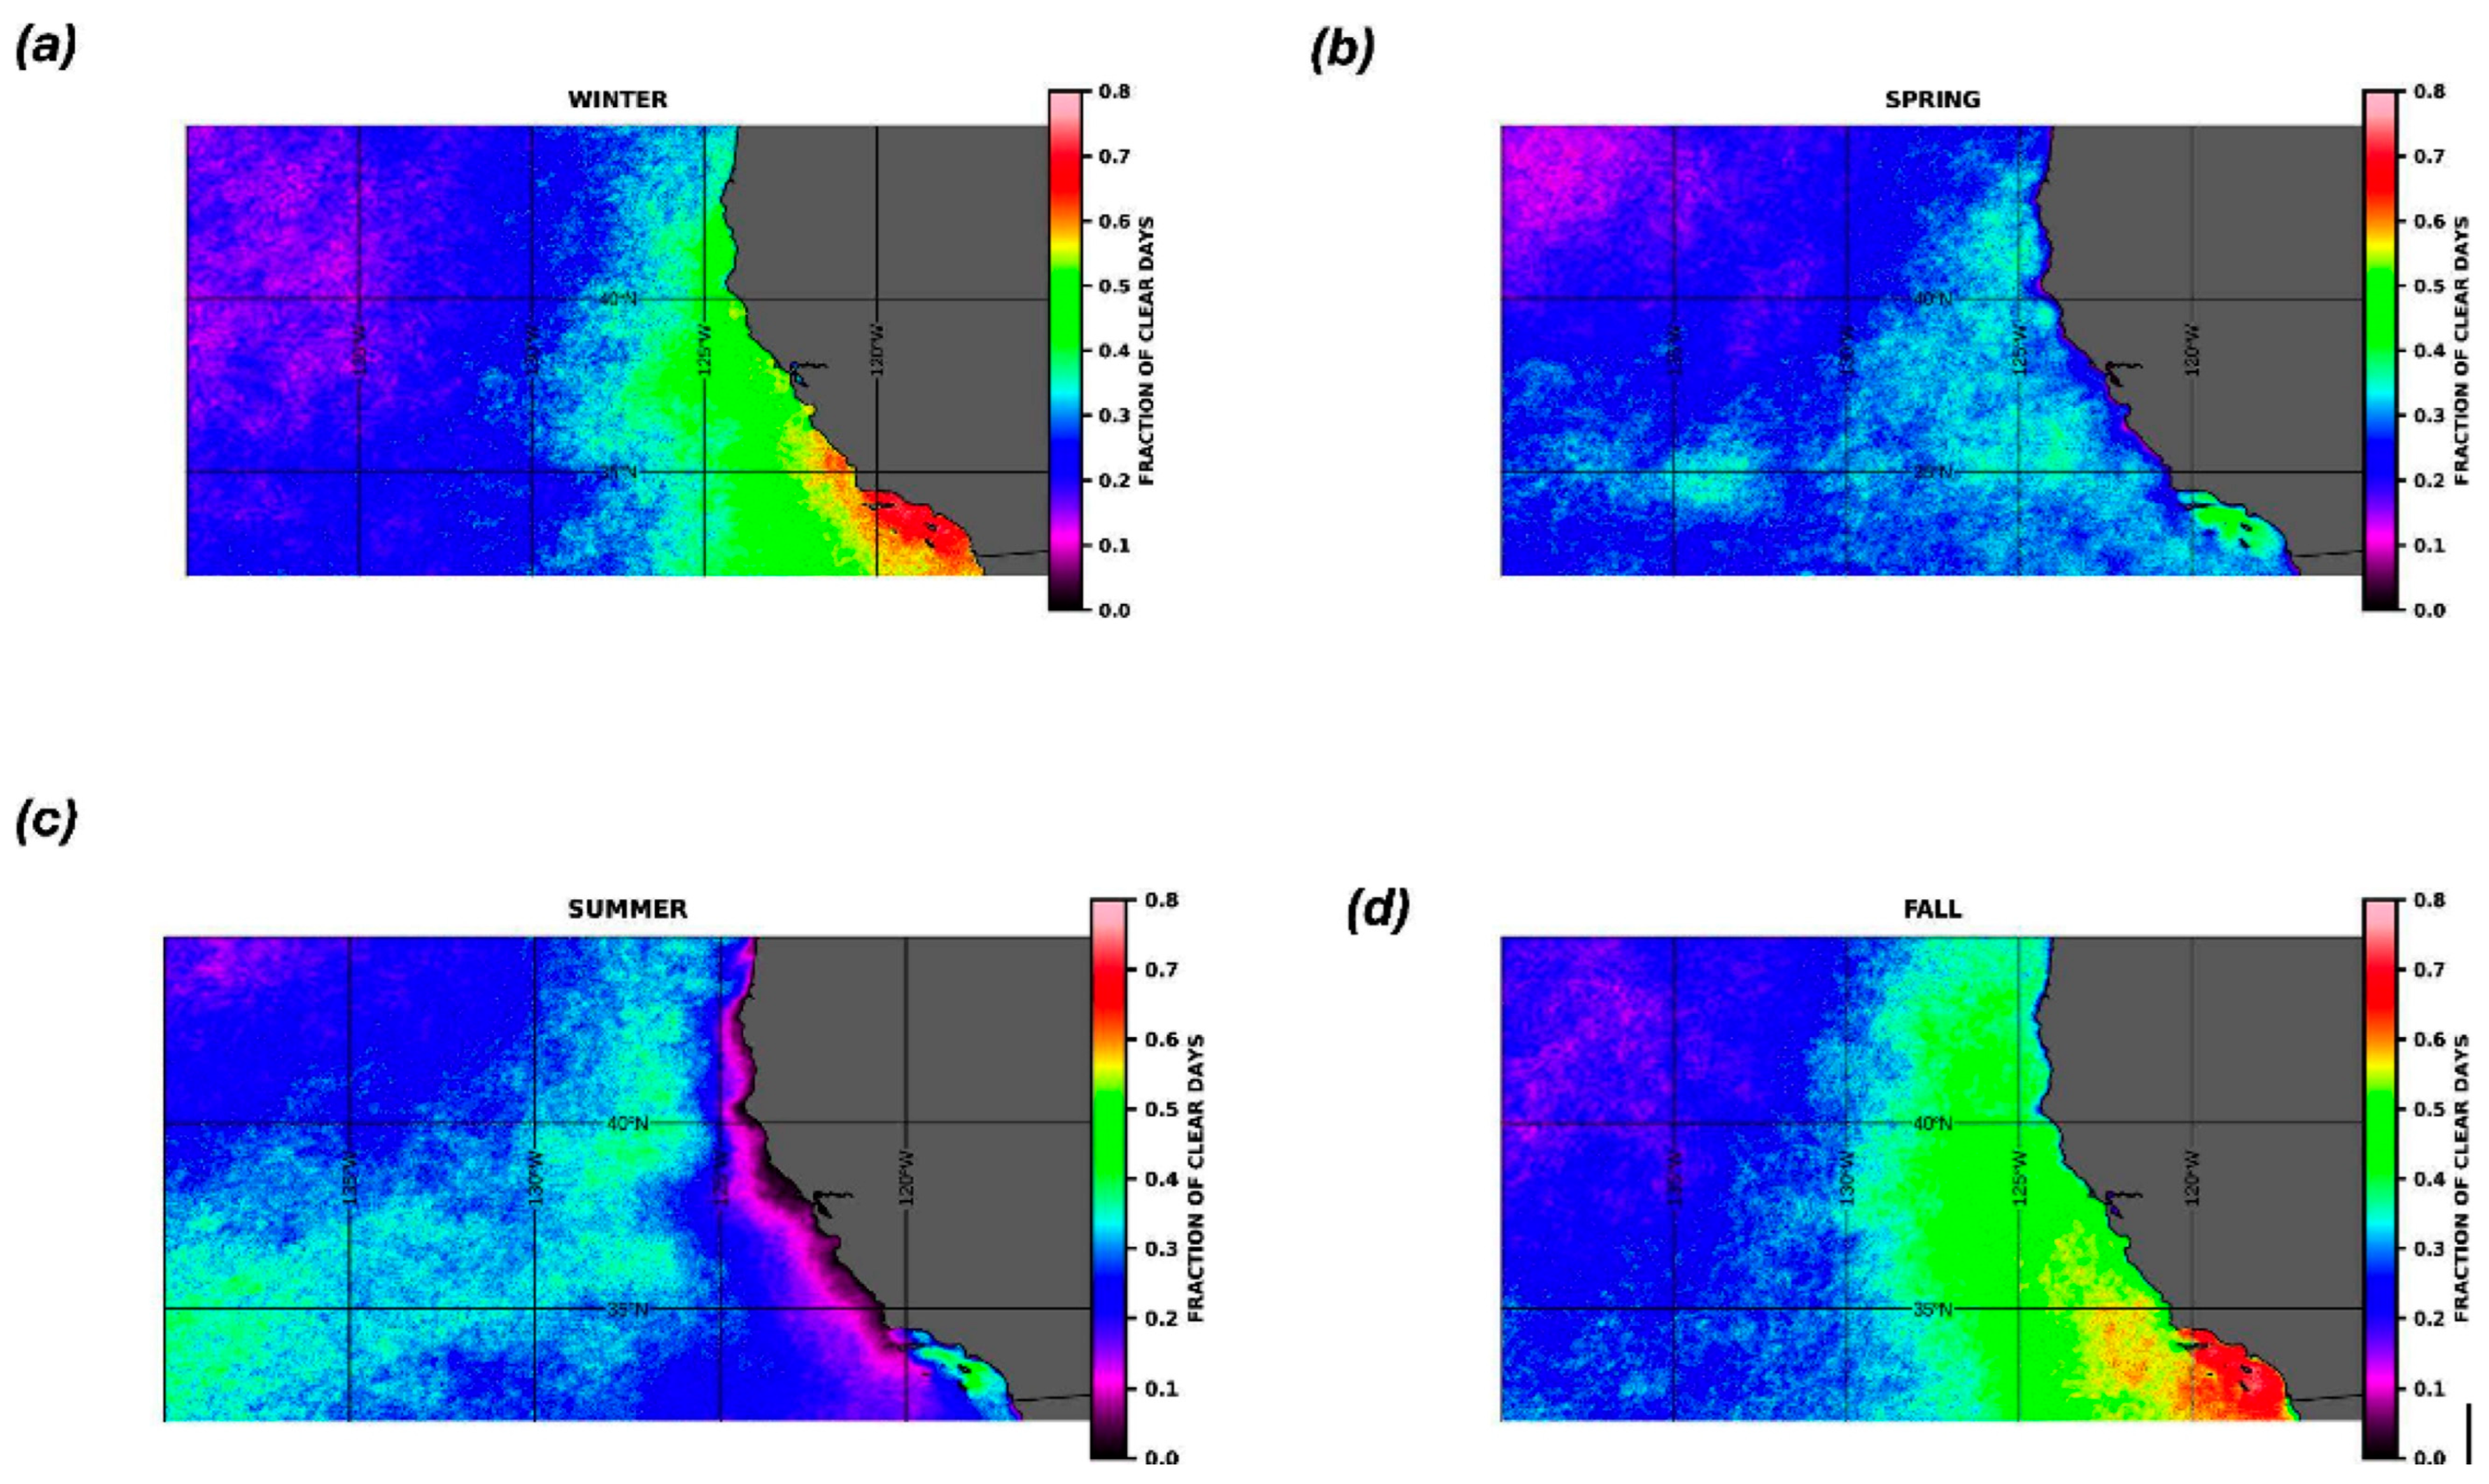
As the California Coast is a region that is impacted by cloud coverage that is also seasonally dependent, we used the dt latency parameter in the MUR data to derive seasonal maps of the differences in cloud coverage. The dt_1 km_data variable contains the number of hours between the analysis time of the MUR file and the most recent MODIS 1 km L2P datum within 0.01° of the grid point. MODIS cloud-free data are only ingested if they are available within the ±2 days of the analysis time of the MUR file, so the dt variable has a range of −50 to 50 h. The dt value was used to derive the fraction of clear 1 km pixels for each season. Figure 9 shows the fraction of clear 1 km pixels for each season: (a) winter, (b) spring, (c) summer, and (d) fall. Clearly, Figure 9c shows that close to the coast, the summer season has the lowest fraction of clear 1 km pixels with only a 0.1 fraction of clear pixels. The issue of cloud cover can also be relevant to other upwelling regions of the world’s oceans. Along the Oregon Coast and Northwest Coast, summers can be cloudy offshore. In both the winter and fall time frames along the coast, the fraction of clear 1 km pixels is approximately 0.5, reaching 0.7 off the California/Baja Coast. Thus, based on these results, the incorporation of daytime and geostationary data in OSTIA would certainly provide more cloud-free pixels at ~2 km spatial scale, which could account for an increase in gradient magnitudes. This would also be consistent with Figure 7, which shows the minima in correlation between the OSTIA and MUR gradients during the summer time frame. These results indicate that the issue of the impact of clouds on the application of satellite-derived SST gradients needs to be a part of future work. Additionally, the benefits of incorporating geostationary SSTs needs to be explored further. The region off the California and Northwest Coast is important as the seasons with the minima fraction of clear pixels occur during the maxima in upwelling.
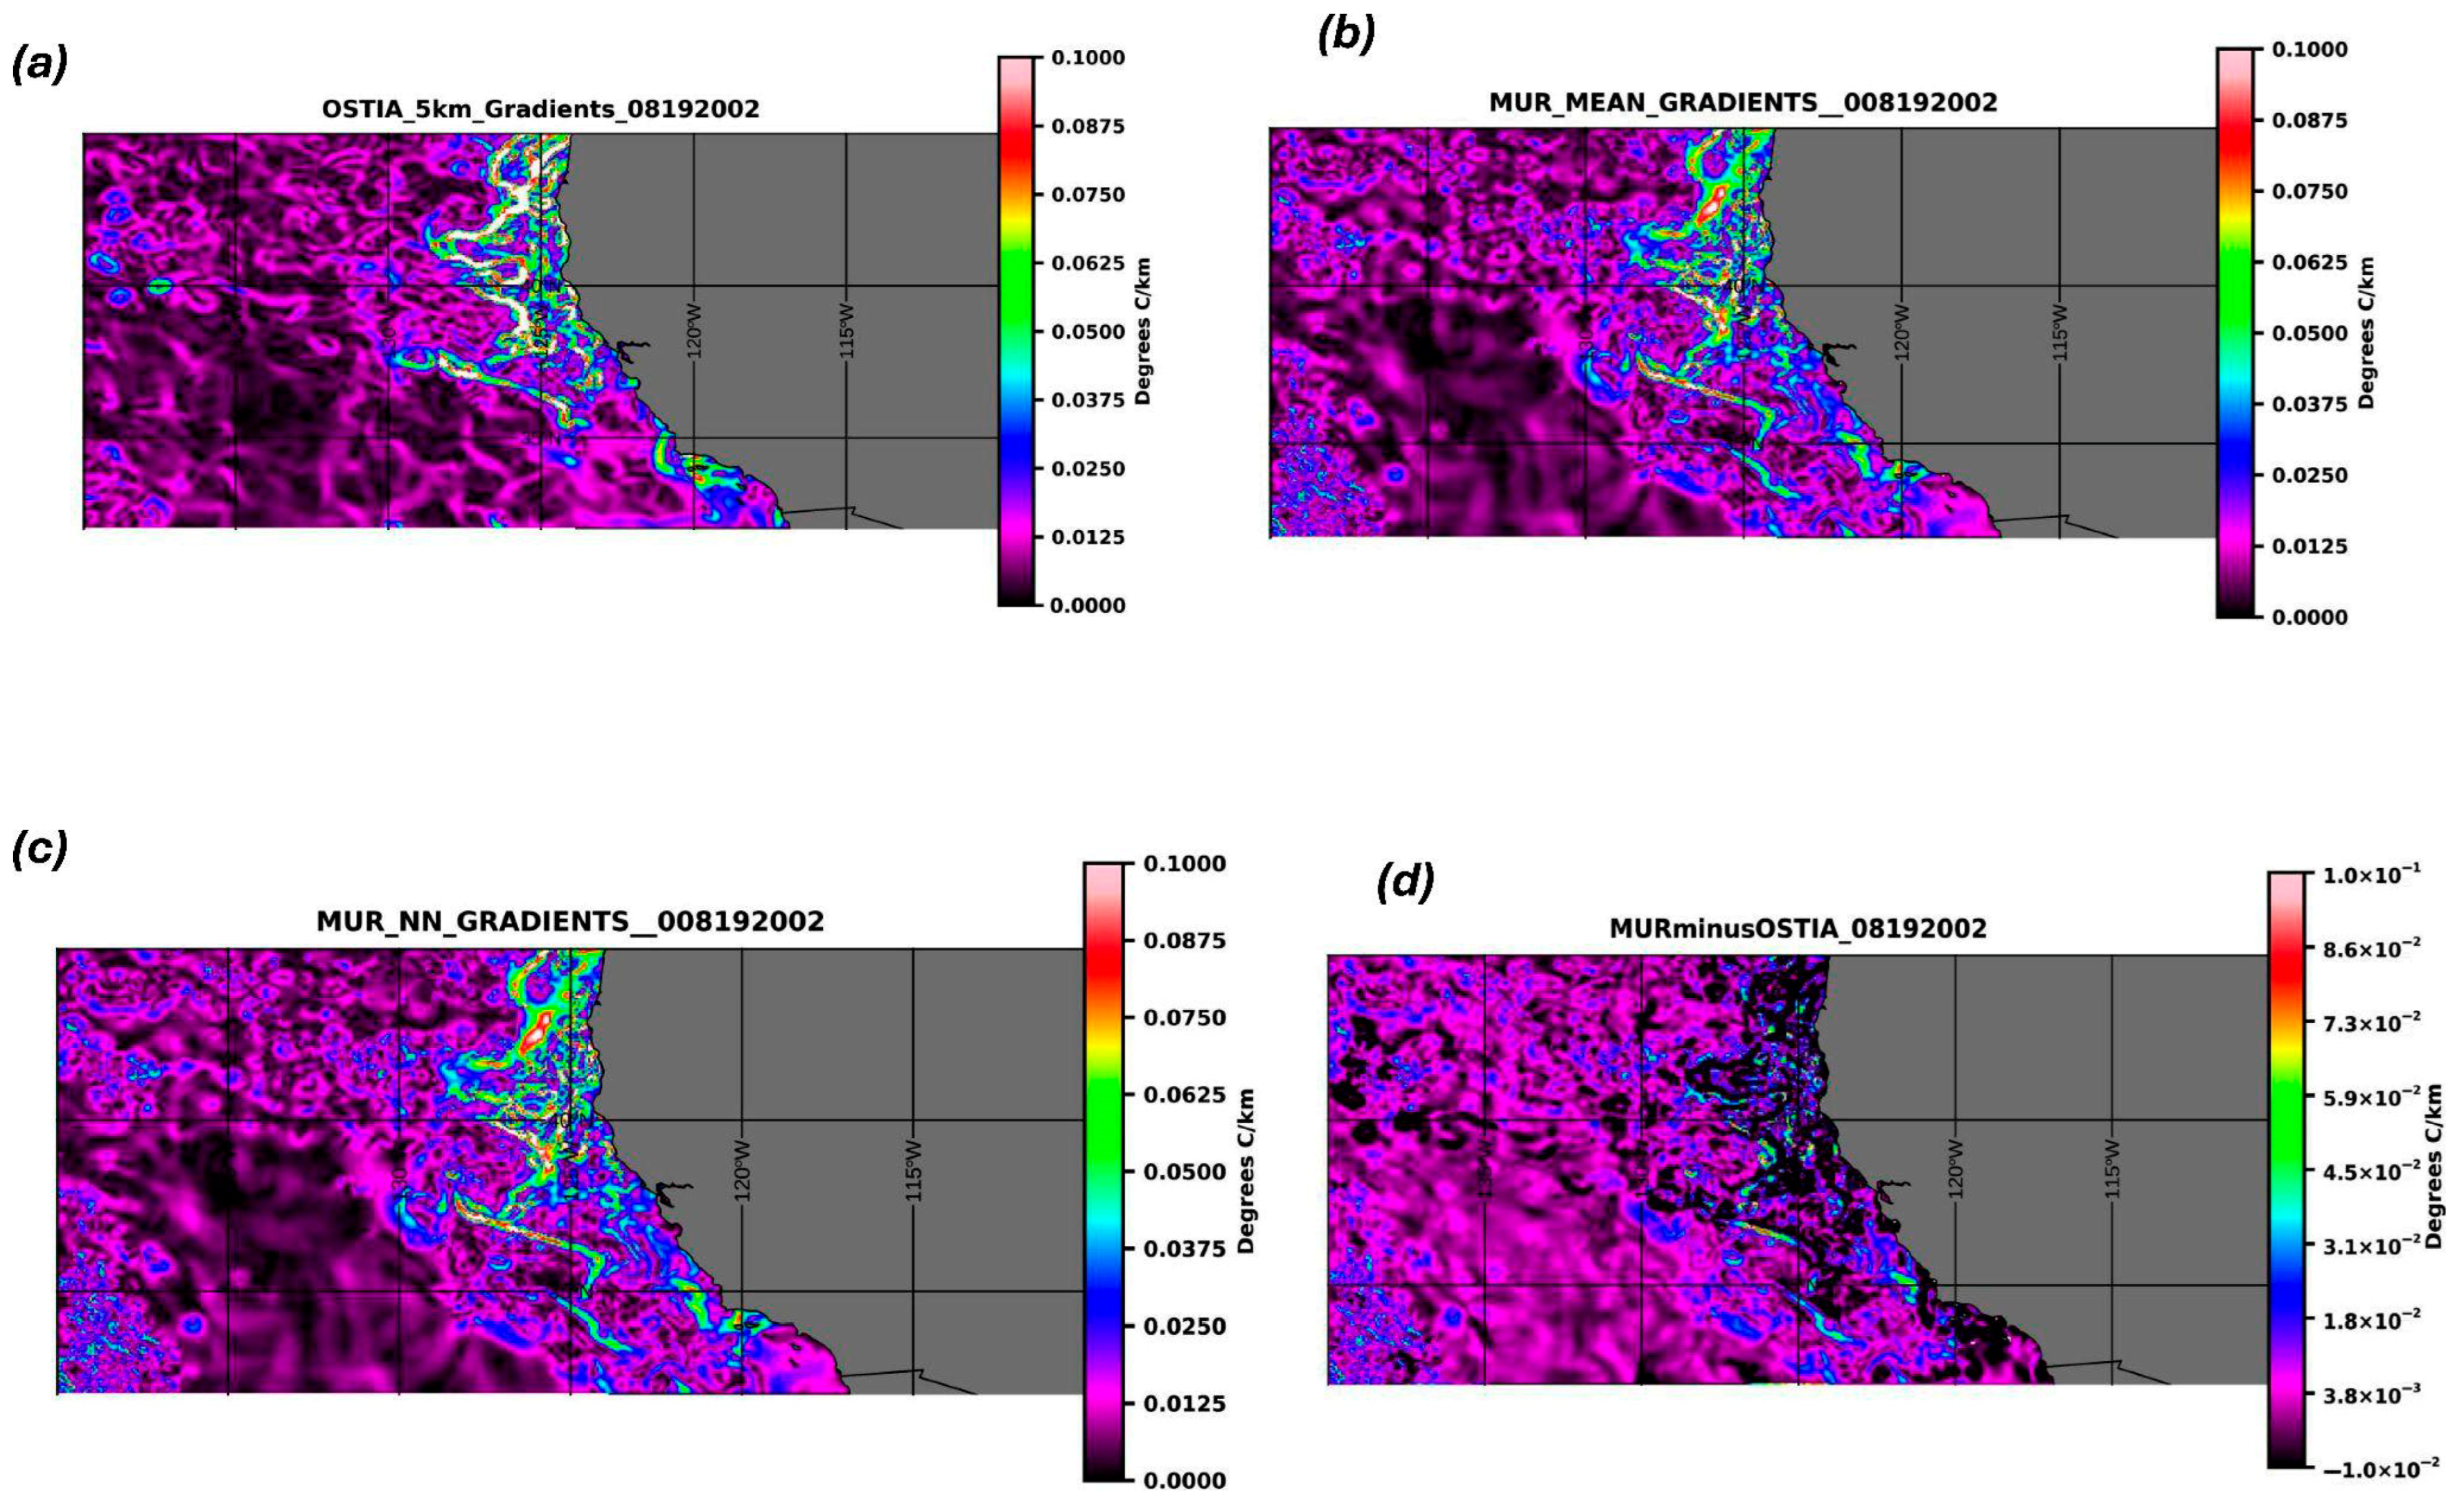
To further explore the cause for the differences between the OSTIA and MUR SST gradients, 19 August 2002 was chosen as exemplary data for further investigation. The date was chosen as it corresponds to a time period of maximum coastal upwelling. Figure 10 shows the MUR and OSTIA SST gradients derived for 19 August 2002. Figure 10a shows the OSTIA gradients. Clearly visible are the gradients associated with fronts along the California Coast. Figure 10b shows the gradients derived from the MUR 1 km product averaged over the 5 km grid size, while Figure 10c shows the gradients derived using MUR but applying the nearest neighbor. Visually, it is difficult to determine differences between the products and the methodology used for the collocation of the MUR SST product to the OSTIA 5 km grid. Overall, the largest gradients are approximately 0.1 °C/km. Figure 10d shows the difference between the MUR SST gradients and the OSTIA SST gradients. Positive values indicate that MUR SSTs have large magnitudes. Overall OSTIA has larger magnitudes. However, there are spatial features that appear to be associated with fronts where the MUR SSTs have larger magnitudes. Based on these results, we examined and compared the magnitudes of the two products at two different latitudes: 34°N and 40°N. 40°N should be in the zone of maxima upwelling, while 34°N should be in an area of reduced upwelling along the California Coast. Figure 11a–c shows the plot at 34°N and 40°N for the OSTIA and MUR SST gradients on 19 August 2002. 19 August was chosen as it is during the strong upwelling season. Figure 11a shows the gradients for the OSTIA and MUR at 34°N using both the (a) nearest neighbor and (b) means for the collocation of MUR with OSTIA. The maxima gradients are close to 0.10 °C/km at 34°N and 0.15 °C/km at 40°N, consistent with the latitude of greater upwelling. Overall, at these latitudes, and for this date, there is not a significant difference between using the nearest neighbor or mean for the collocation of MUR with OSTIA. The results indicate that off the California Coast, high resolution is important for effectively resolving frontal features. This is also confirmed by the statistics summarized in Table 2. For both 34°N and 40°N, overall, the differences between the nearest neighbor and using the mean for collocation were insignificant. Correlations of 0.61 and 0.63 indicate a statistically significant relationship between the OSTIA- and MUR-derived gradients. The overall biases were on the order of 0.001 °C/km, with RMS values around 0.02 °C/km. The correlation using the mean was slightly higher (0.63 versus 0.61), but the insignificant difference indicates that for this date, both methods of collocation were giving similar results.
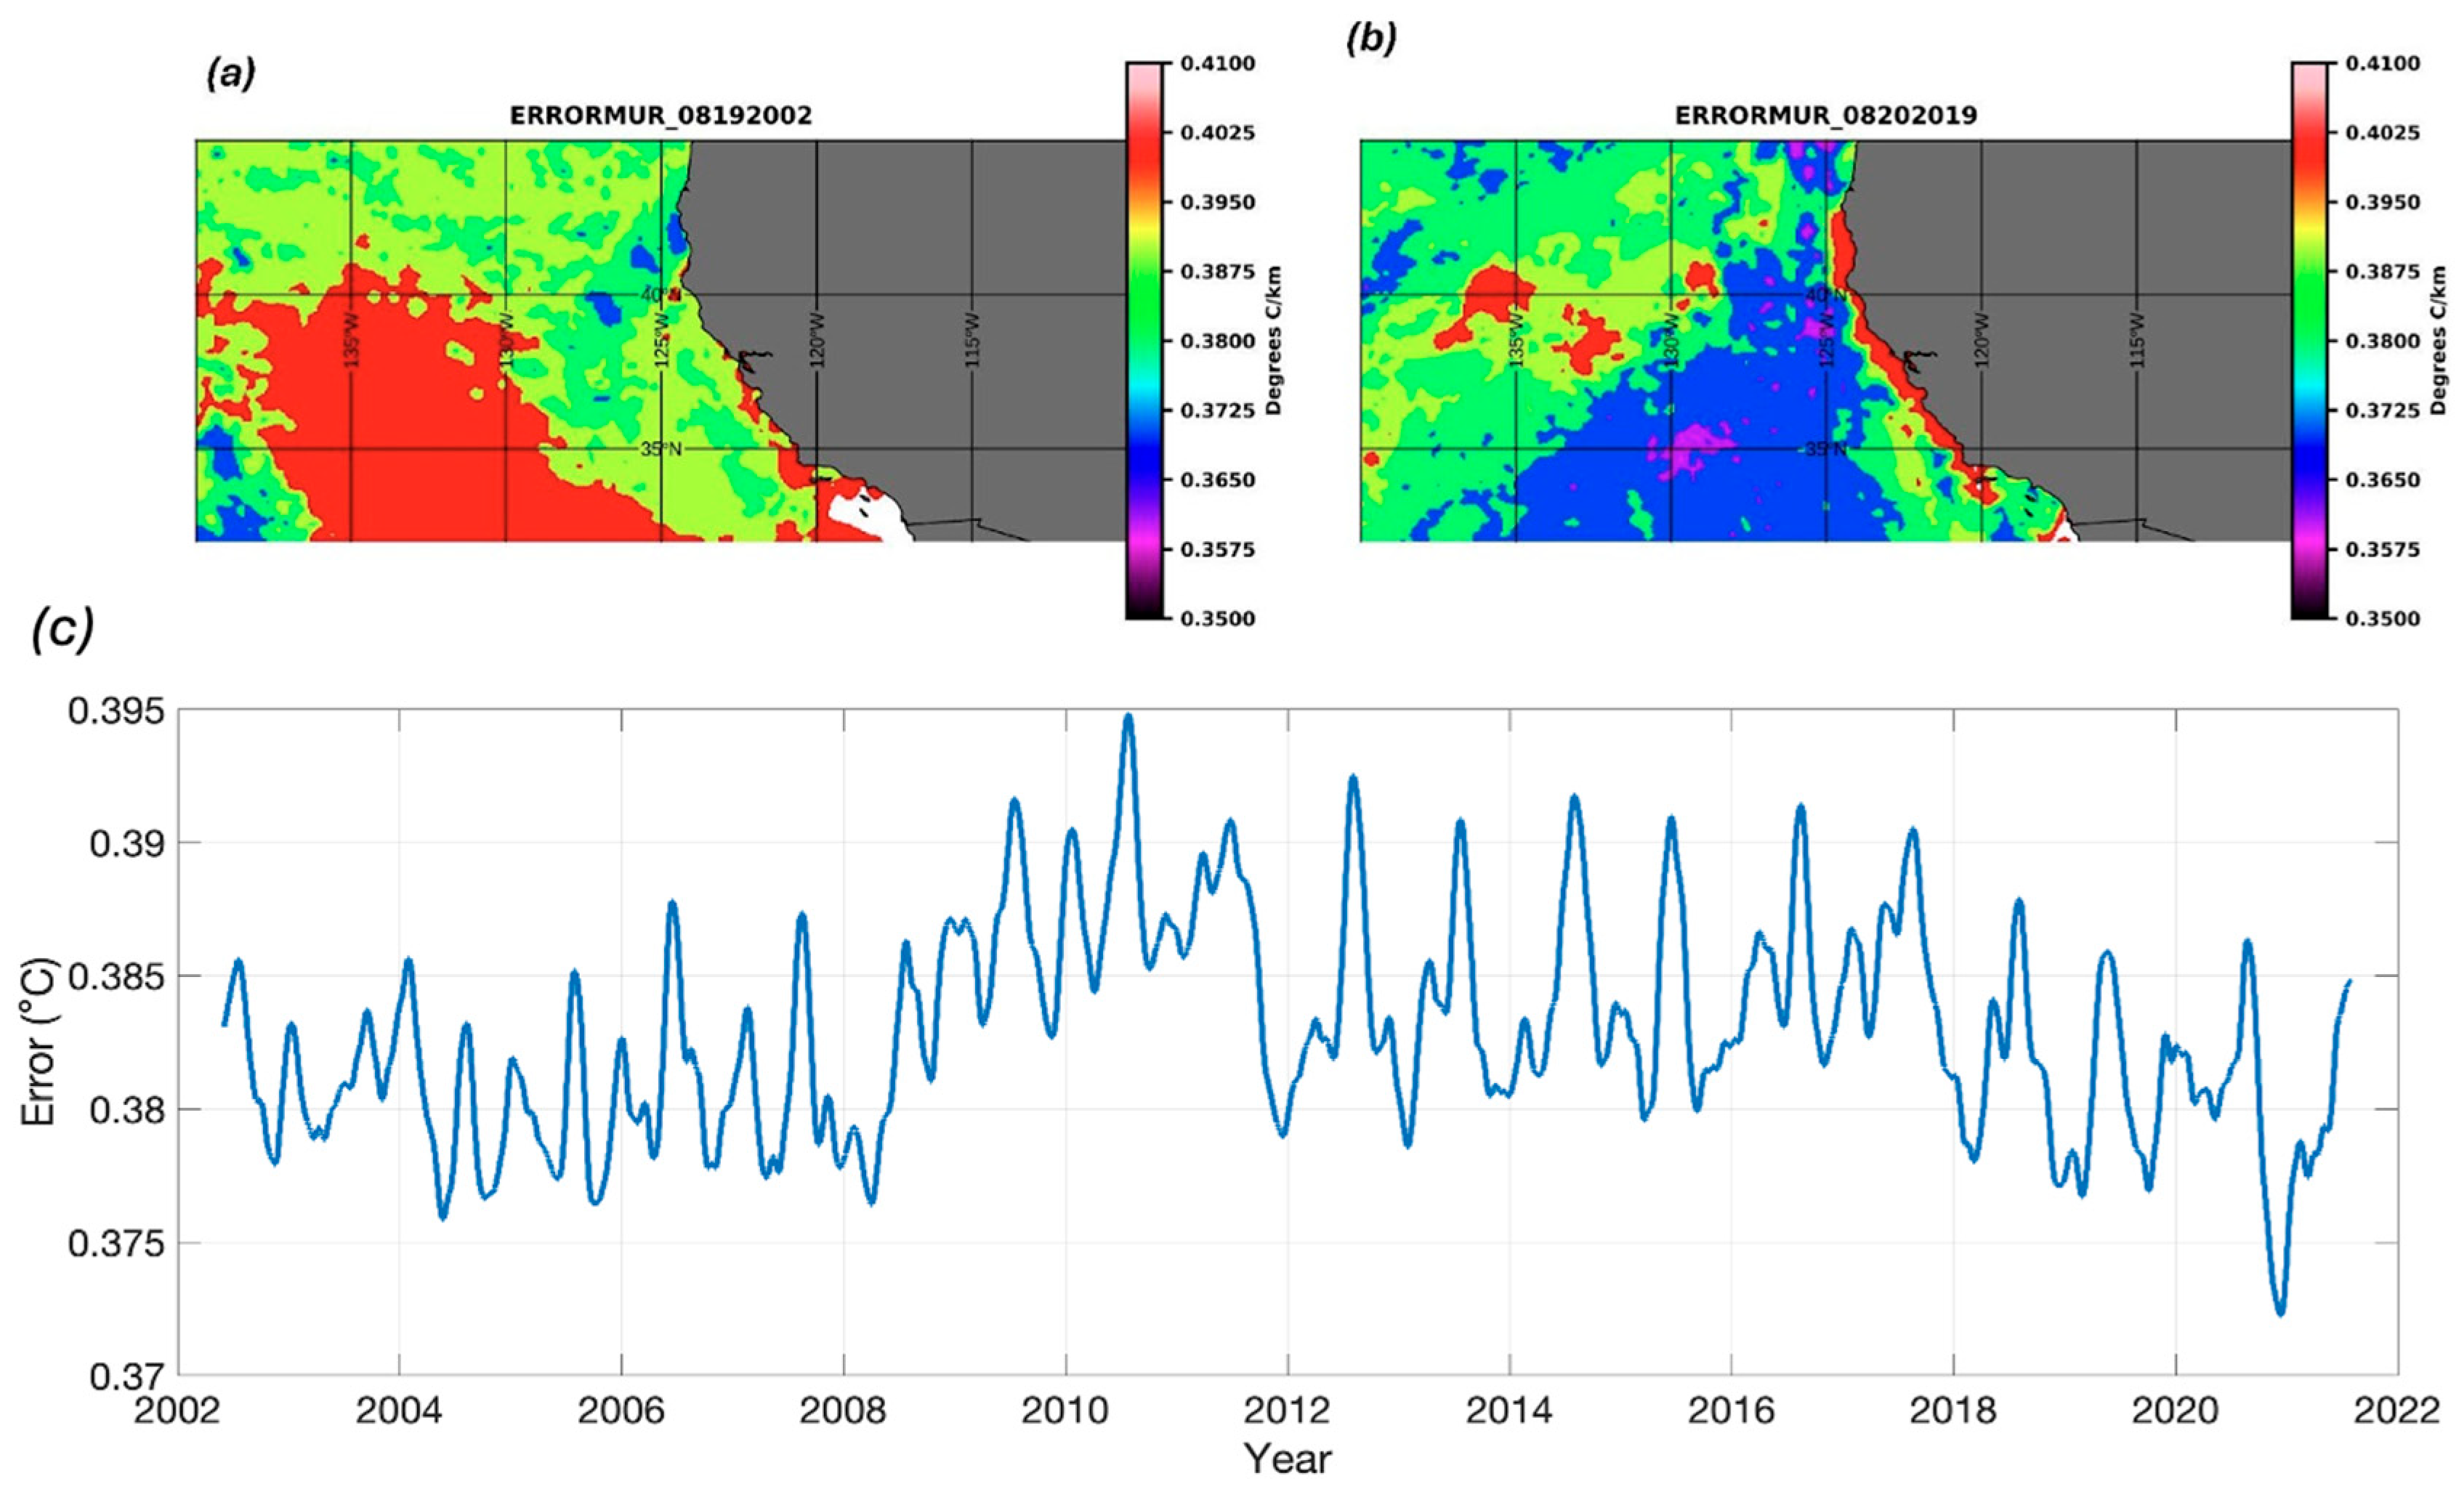
Another issue that needs to be examined to understand the differences between the OSTIA- and MUR-derived gradients is cloud cover. It is obvious that the extent of cloud cover in the region has a significant seasonal signal (see Figure 9). The period of minimum cloud cover is also associated with the period of maxima in the SST gradients. In this context, for future work, Figure 12 shows the analyzed error for MUR for 19 August 2002 and 20 August 2019. There are clear differences (associated with cloud cover), with 2019 clearly showing increased errors along the coast. Errors overall range from 0.3 to 0.4 °C. Several hundred kilometers offshore, 19 August 2002 clearly shows a large spatial area with increased errors. A major point is that differences in cloud cover can potentially have impacts on the derivation of SST gradients. MUR has a hierarchical approach to the filling of data gaps due to clouds. If 1 km clear sky MODIS nighttime data are not available, MUR ingests 4 km AVHRR nighttime data, and if clear sky AVHRR data are not available, MUR ingests 25 km microwave nighttime data. So, during nighttime cloudy conditions, MUR will have an effective resolution of 25 km. OSTIA, on the other hand, ingests both daytime and nighttime observations from both polar and geostationary infrared instruments, so there is a greater chance of some gaps in the clouds in the OSTIA data stream than in the MUR data stream, and the effective spatial resolution of OSTIA may be finer than that of MUR during cloudy periods. The issue of cloud cover needs to be explored in more detail in future work to better understand the performance of Level 4 products in evaluating SST gradients.
Another possibility for the difference in gradient magnitudes between OSTIA and MUR is a difference in the precision of the datasets. This is unlikely because all GHRSST datasets are stored in files meeting the GHRSST Data Standard 2, which specifies that sea surface temperature be stored with at least two significant figures after the decimal. Both OSTIA and MUR ingest GDS 2 L2P swath data and produce GDS 2 L4 output files. Raw digitizer quantization by the original sensors is 10 bit (AVHRR, SLSTR) or 12 bit (VIIRS, MODIS, AMSR-2). The instrument noise levels (NEdT) are 0.12 K (AVHRR), 0.025 K (MODIS, VIIRS), 0.003 K (SLSTR), and 0.34 K (AMSR-2). OSTIA and MUR use combinations of sensors with 10 bit and 12 bit digitizers and infrared instruments with 0.003 to 0.12 K noise levels, and they both use AMSR-2 microwave data with 0.34 K noise. Therefore, it is unlikely that there are large enough differences in the precision of the input or output datasets to account for the difference in the gradient magnitudes.
Figure 11 shows the MUR and OSTIA SST gradients at 34°N and 40°N for 19 August 2019. Figure 11a shows the gradients at 34°N using a nearest neighbor approach to collocate the MUR to OSTIA grid. Figure 11b is the same but using the mean for MUR over the 5 km OSTIA grid. Both datasets clearly show the maxima gradients along the coastal areas, but differences do exist farther offshore. At 40°N, Figure 11c reveals that a significant difference exists at approximately −142°W, where OSTIA has a significant maxima not seen in the MUR SST. Figure 11d, using the mean approach, does not show a large difference. Thus, for 19 August 2002, at 34°N and 40°N, there appears to be little difference between the nearest neighbor and using the mean approach. Additionally, both datasets clearly show the increased upwelling at 40°N based on the greater magnitudes of the SST gradients. Table 2 summarizes some statistics at 34°N for the nearest neighbor and using the mean for collocation. The values do not vary significantly with statistically significant correlations of approximately 0.63 and 0.61. Using the mean approach for collocation gives slightly higher mean values for MUR of 0.016 °C/km than for OSTIA of 0.013 °C/km. The nearest neighbor approach gives similar values. Thus, for this particular date and at 34°N, there does not appear to be a significant difference between the MUR- and OSTIA-derived SST gradients.
As mentioned, another possibility for the differences between the two products is the cloud masking. Figure 12a,b shows the SST error analysis for August dates in 2002 and 2019. Clearly, there are large differences between the two dates. In addition to biases, the error field would also be impacted by cloud cover. 20 August 2019 shows a clear increase in errors along the coast but lower errors at distances offshore. 19 August 2002 shows lower errors along the coast but an increase in a region offshore. This in itself indicates that differences in cloud cover could impact the retrieval and derivation of SST gradients. Although microwave sensors can retrieve SSTs through clouds, their resolution of approximately 25 km will not resolve spatial gradients associated with submesoscale activity. Additionally, microwave sensors are impacted by land contamination.
Figure 12c shows a time series of the SST error for a point along the coast at 40°N. Overall, there is a clear annual cycle with maxima in the summer time frame. A maximum occurs in 2011 of approximately 0.395 °C. An increasing trend occurs between 2002 and 2011. Prior to 2011, there also appears to be a semiannual component. The results indicate that a detailed analysis of the impacts of clouds and SST errors on gradients needs to be a focus of future work.
Table 2 summarizes the statistics for the MUR- and OSTIA-derived SST gradients for 19 August 2002. The statistics are derived for both collocation methods, using the nearest neighbor and the average of MUR derived for the OSTIA 5 km grid. The mean and biases are very similar for both approaches. Correlations of approximately 0.60 indicate statistical significance between the OSTIA- and MUR-derived SST gradients. The approach of using the mean for collocation has a slightly higher correlation of 0.63, compared to 0.61 for the nearest neighbor.

4.4. Spectra and Coherence

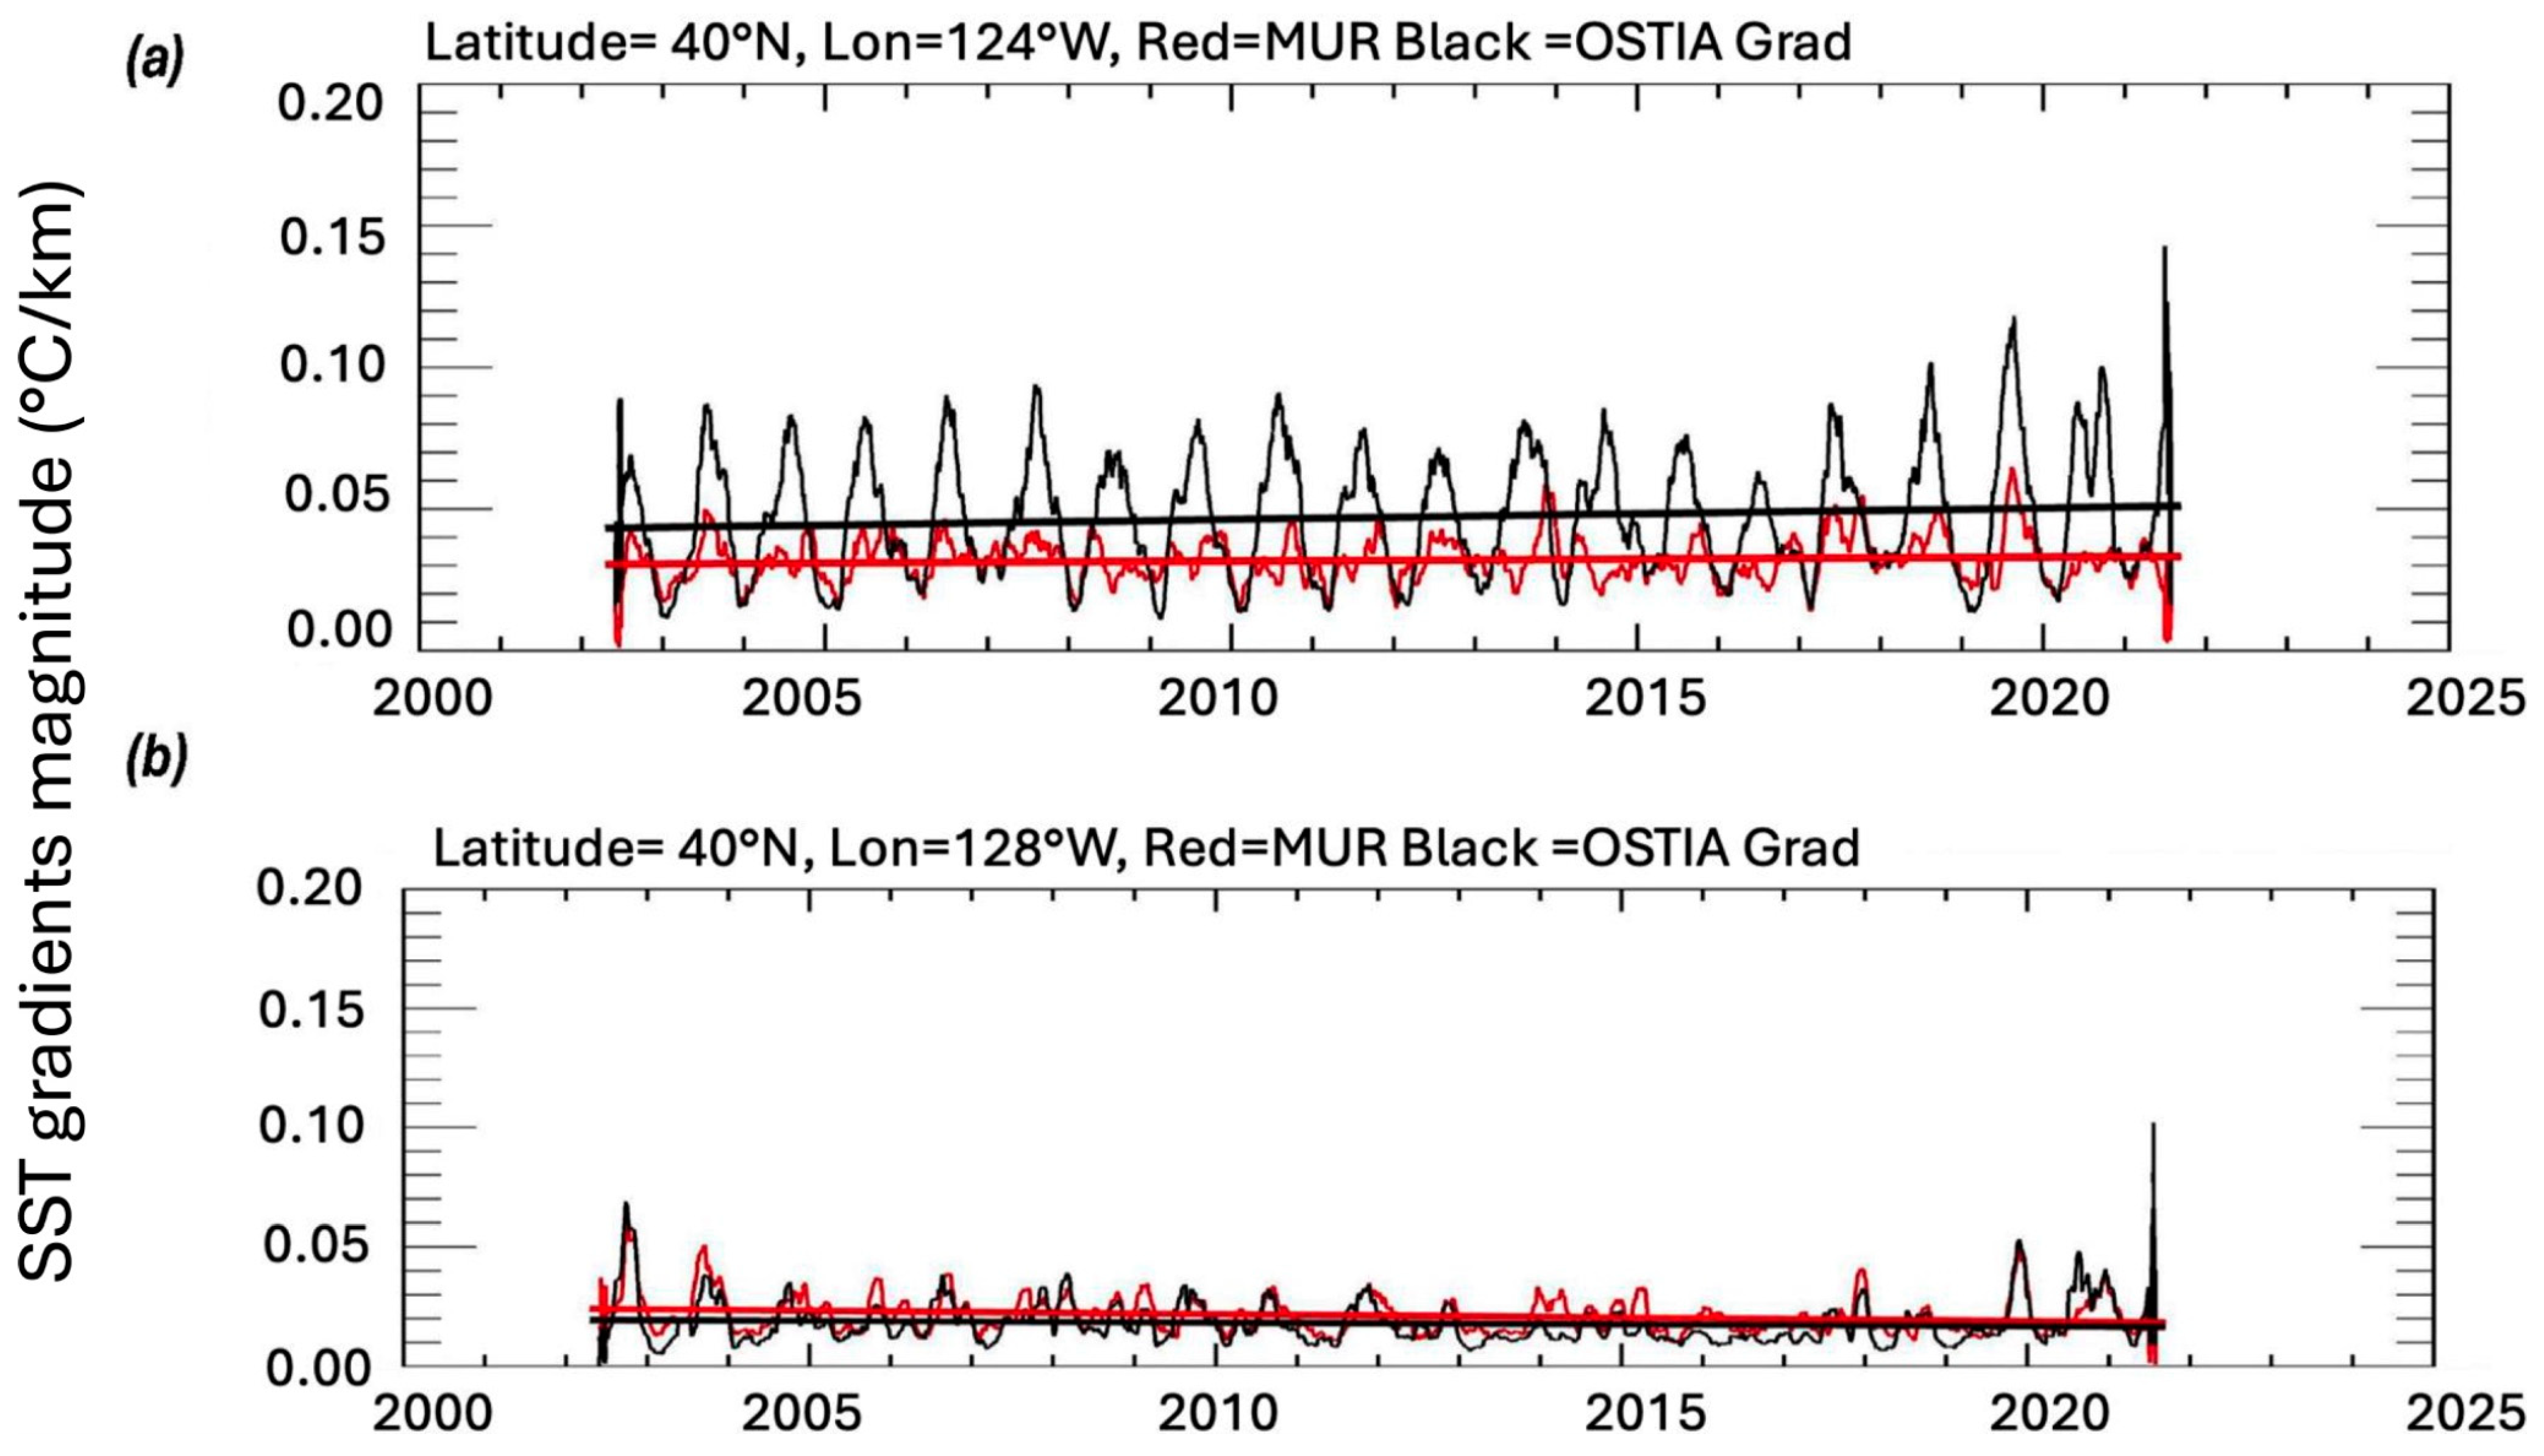
To further analyze the difference between datasets, we examine the spectral characteristics of the gradients, using time series chosen at specific longitudes and latitudes. One example chosen was the time series at 40°N near the coast and farther offshore. Figure 13a,b shows the time series of the SST gradients at 40°N, −124°W (close to shore) and −128°W (offshore). Near the coast, both the MUR- and OSTIA-derived SST gradients show an increasing trend, with OSTIA showing greater magnitudes and an increased linear trend. Offshore at −128°W, the magnitudes of the SST gradients are reduced. Additionally, no linear trend is identified. To further analyze the temporal scales in the time series, the spectra and coherences were derived.
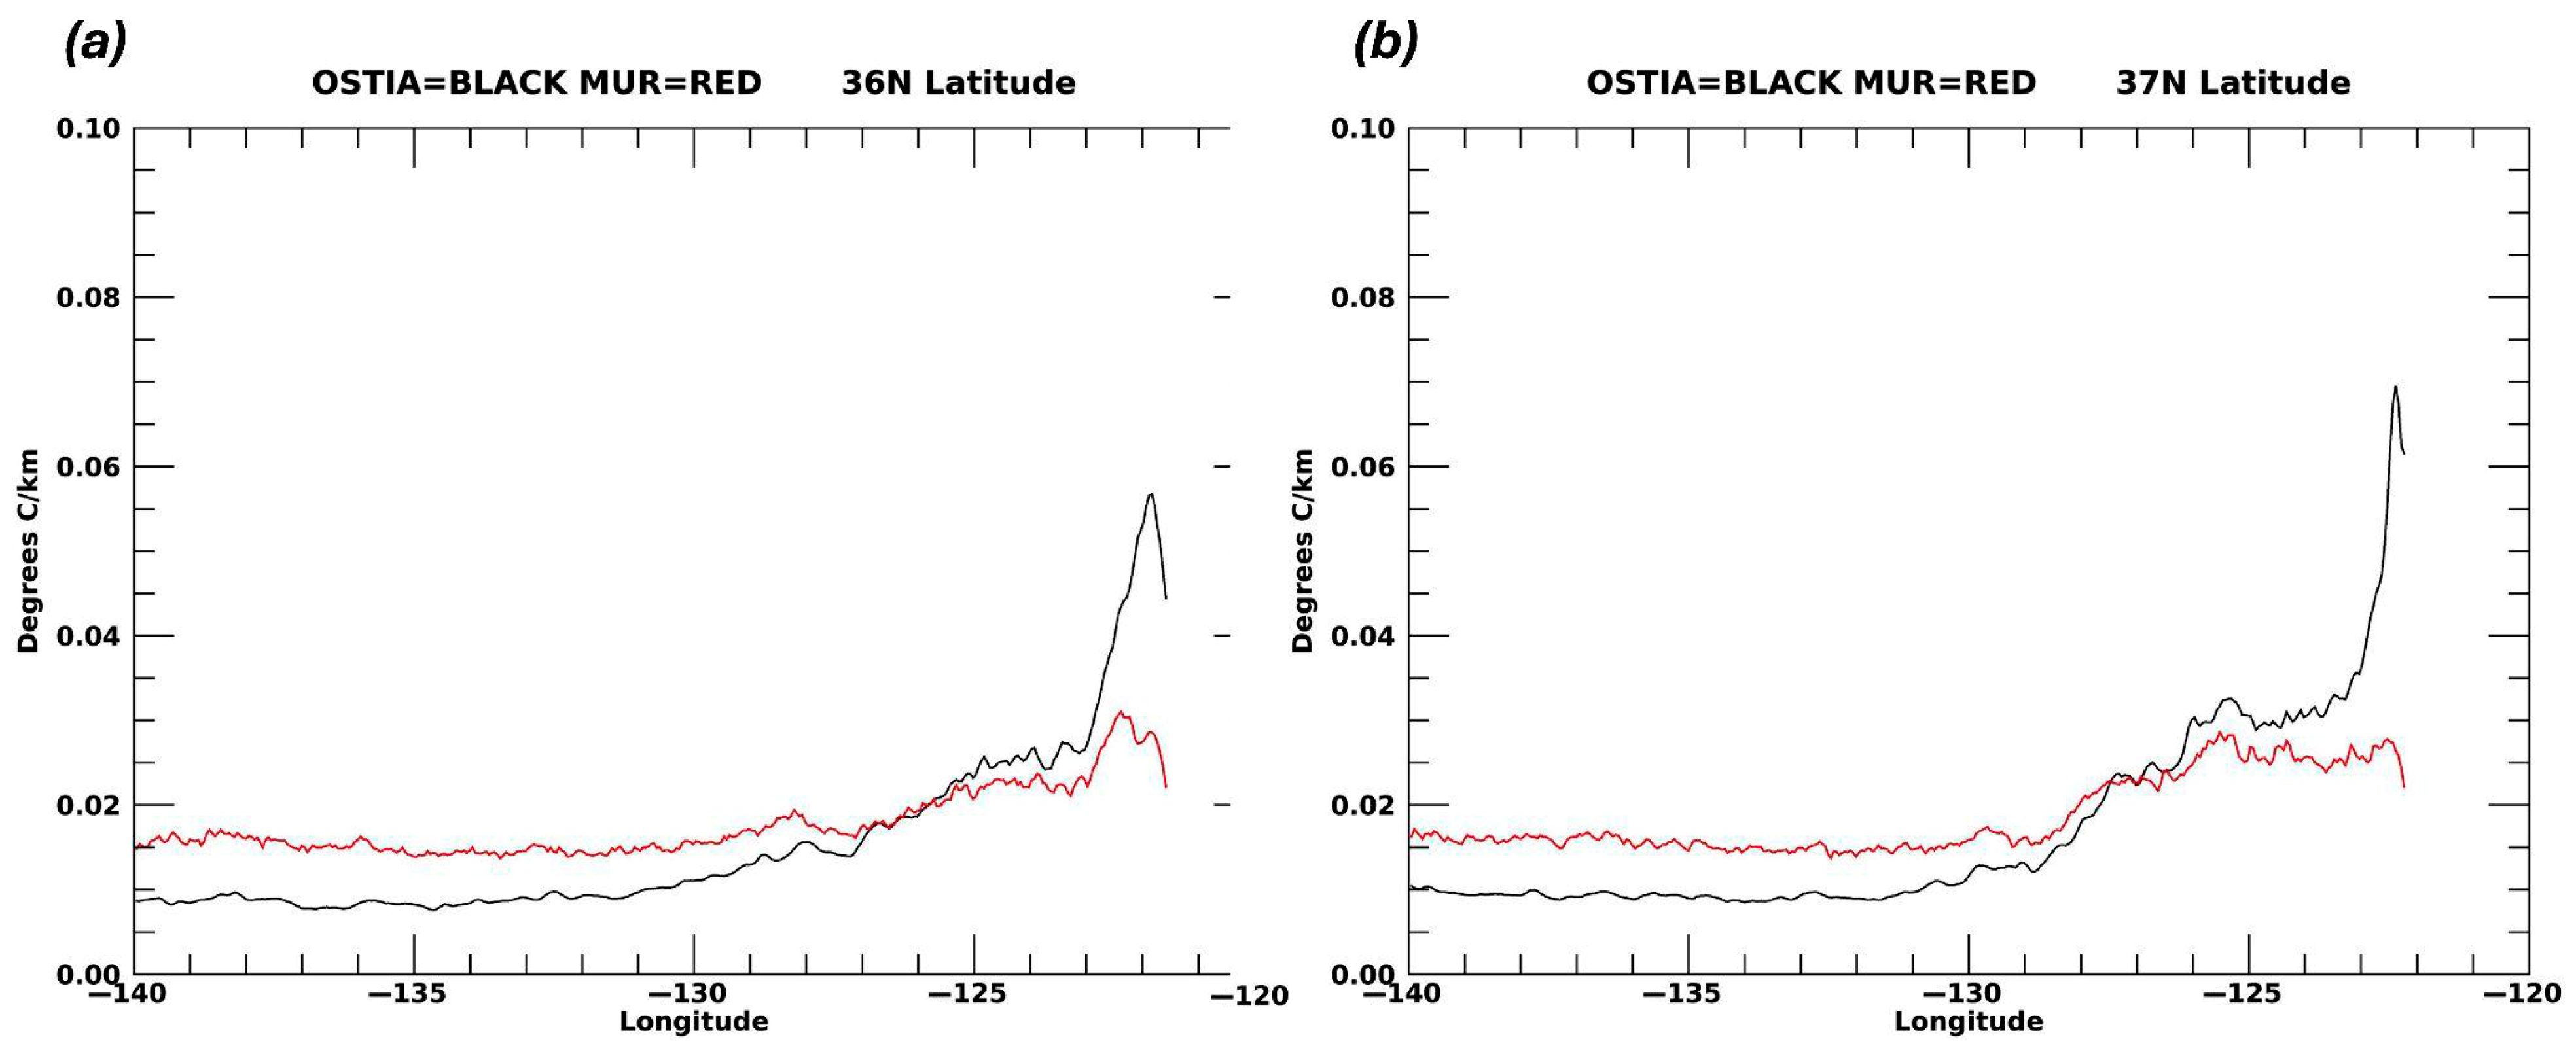
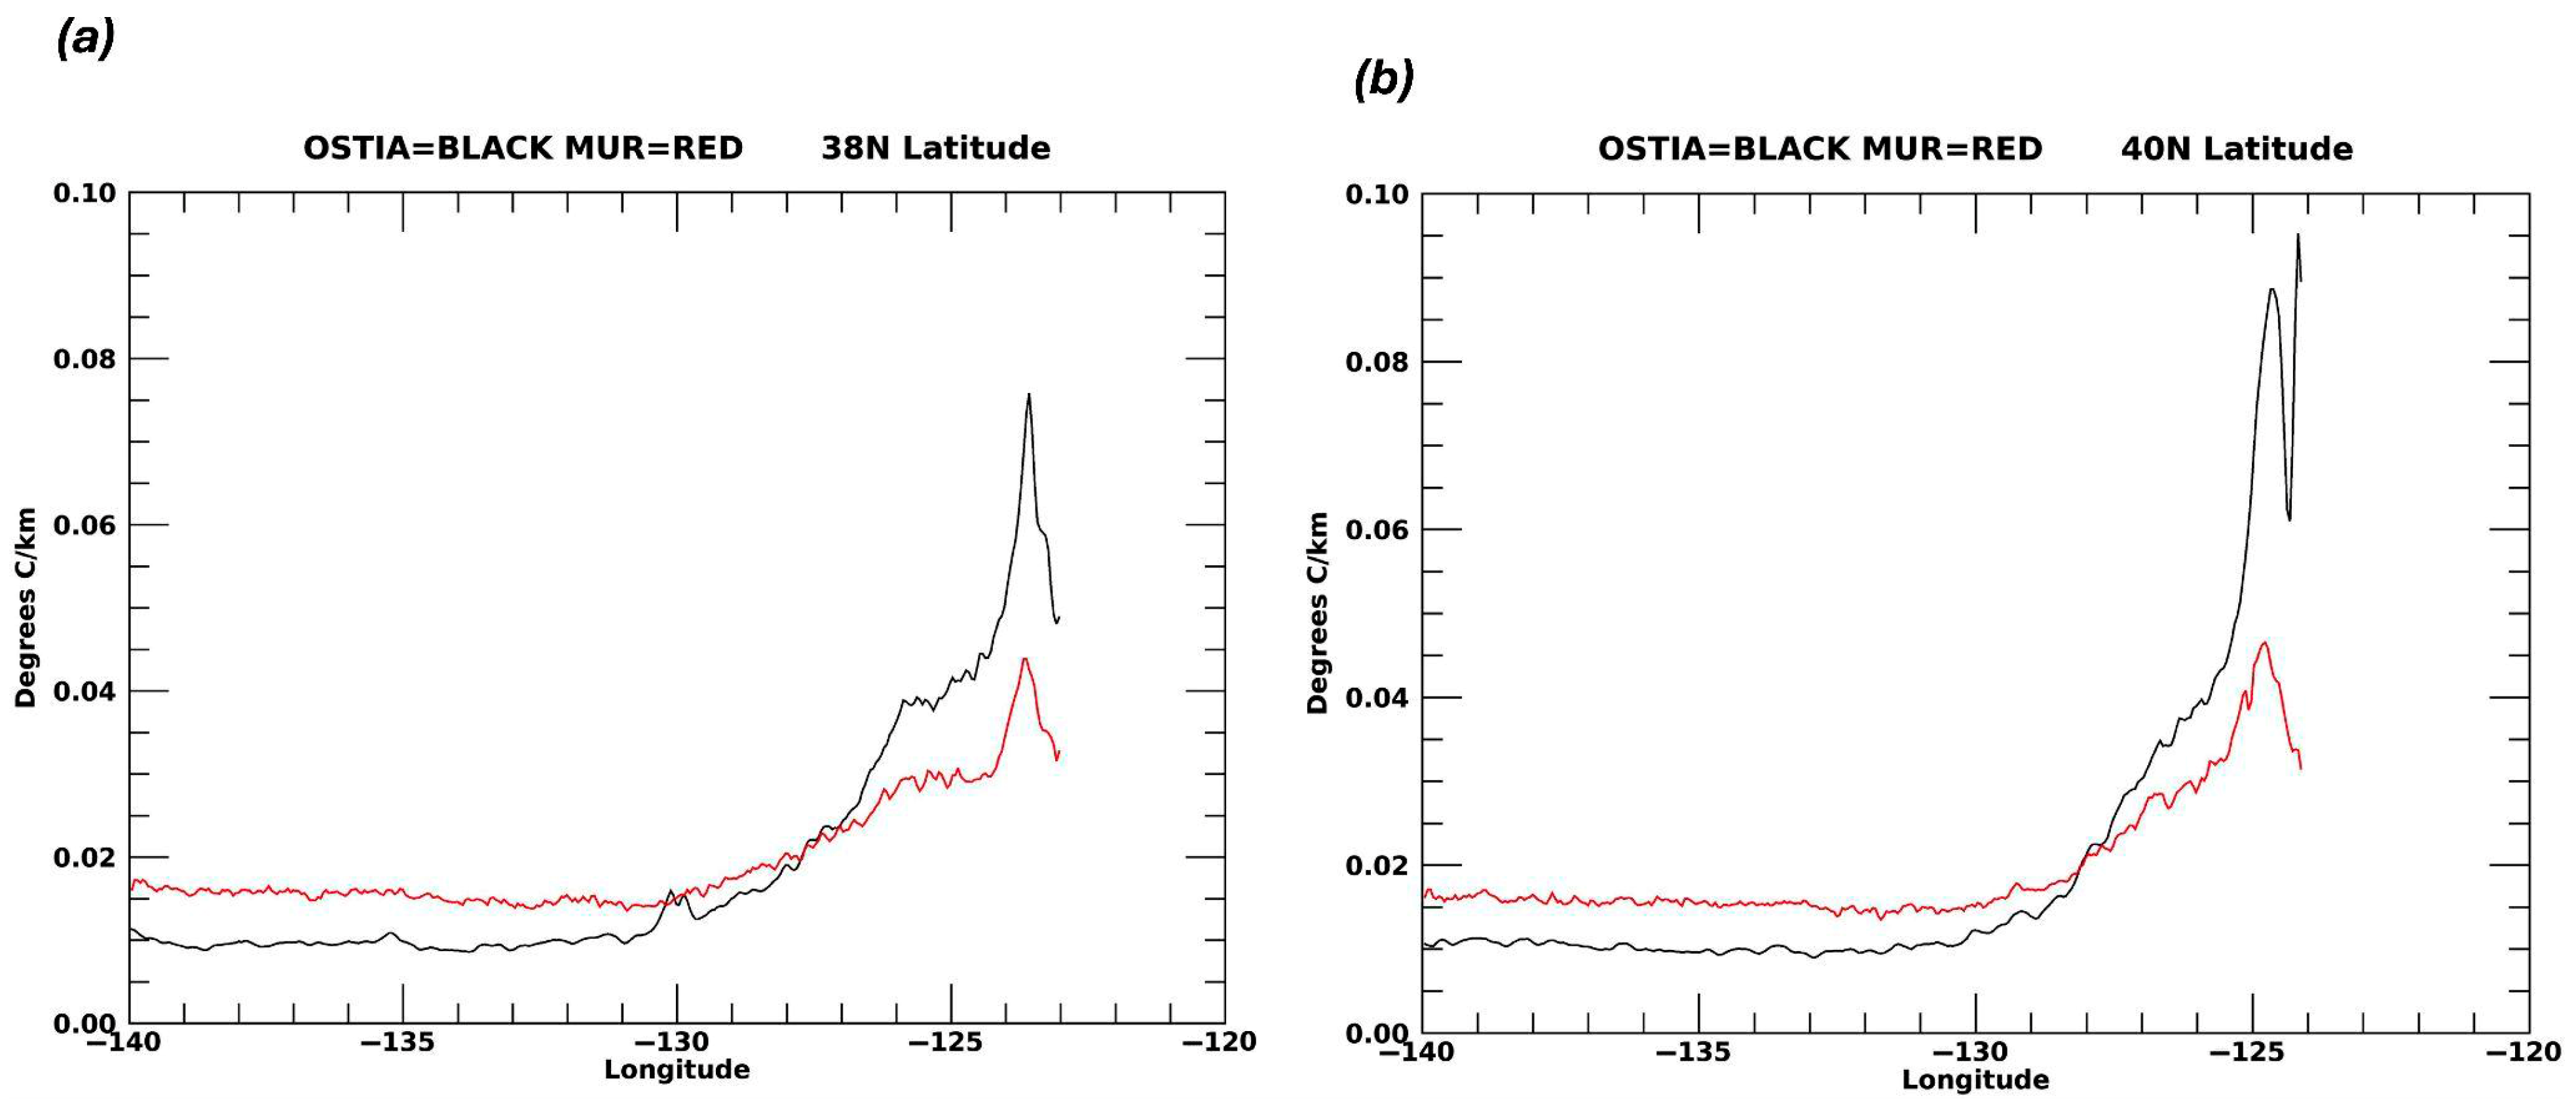
To first examine the spatial variability as a distance from the coast, Figure 14, Figure 15 and Figure 16 show the SST gradients for MUR and OSTIA versus longitude at six different latitudes. The gradient cross-sections are taken from the summer time frame during the maxima in SST gradients. The latitudes examined include 33°N, 34°N, 36°N, 37°N, 38°N, and 40°N. The maxima in the gradients occur at 34°N and 40°N. The results are consistent with the major areas of upwelling off the California Coast [42]. The graphs help accentuate latitudes near the coast of maxima gradients. Large differences between the MUR and OSTIA gradients occur at the middle latitudes of 36°N and 37°N. OSTIA shows large gradients near the coast of 0.06 °C/km, while the MUR gradients reach 0.02 °C/km. These results are consistent with Figure 1 and Figure 3, which show that OSTIA has large SST gradients along the entire coast, while the MUR-derived gradients decrease along the central coast.
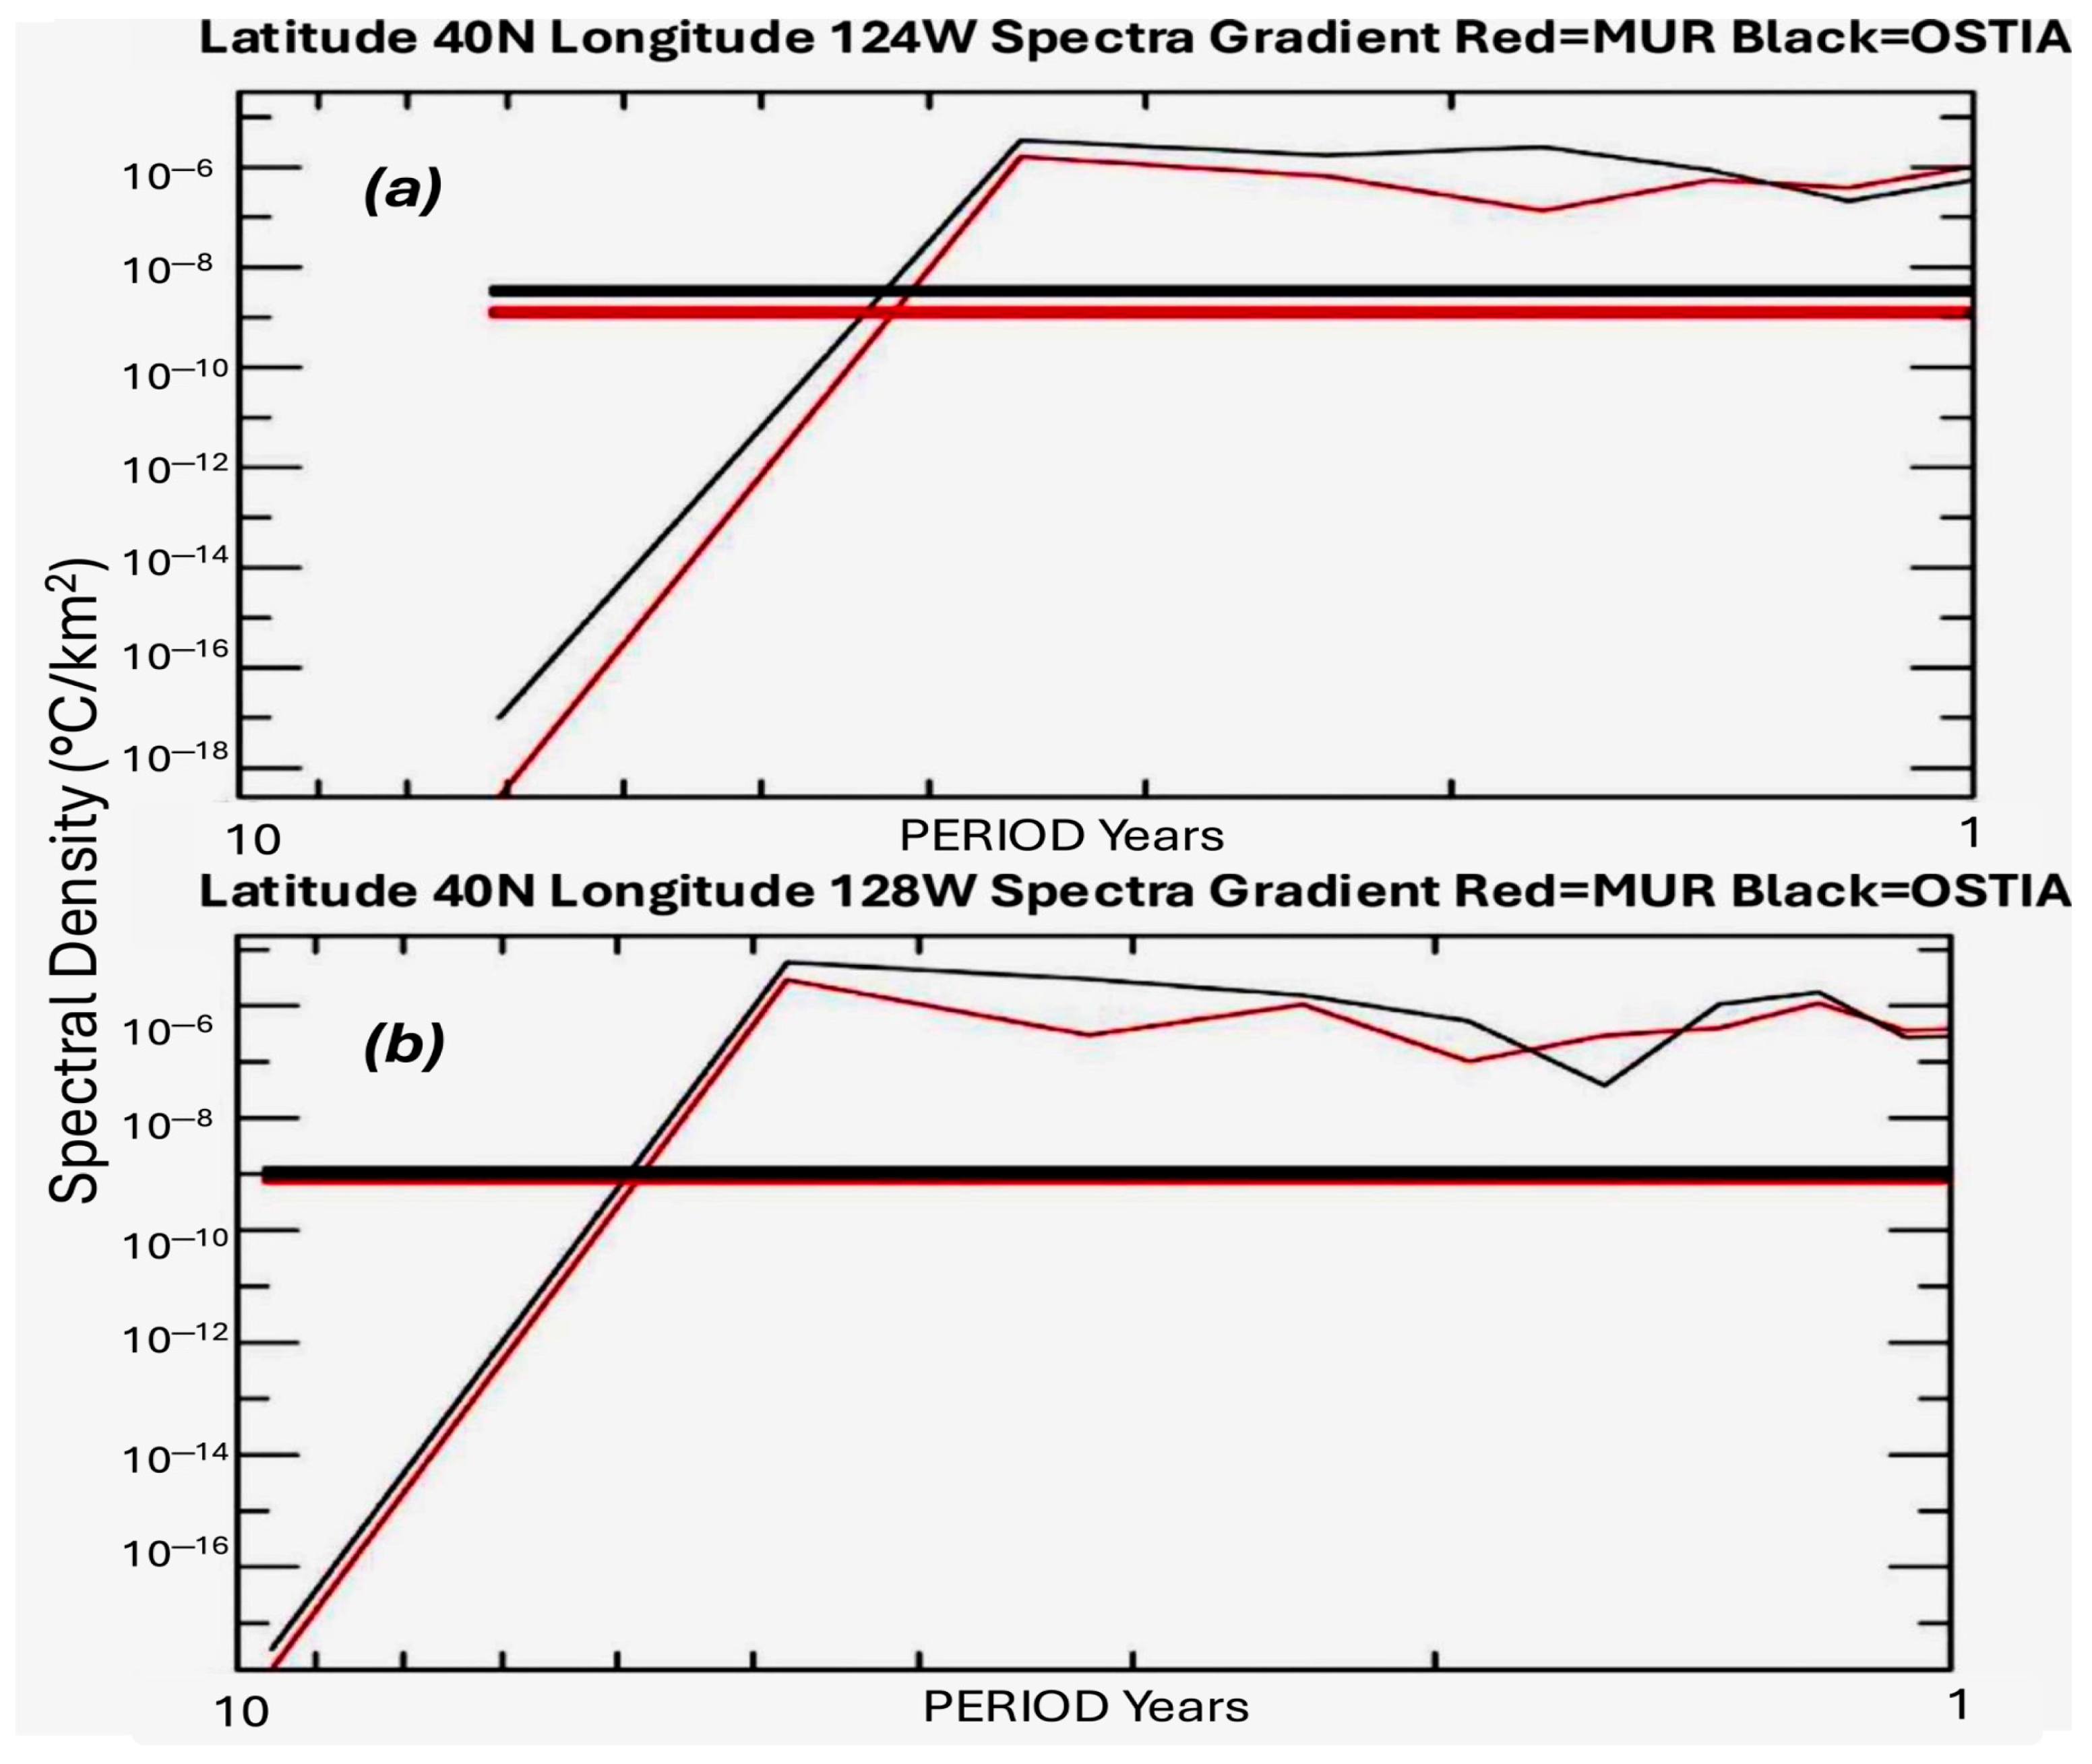
Figure 17a,b shows the derived spectra for the MUR and OSTIA SST gradients at the offshore point 40°N and −128°W and at the coast at −124°W, 40°N. The spectra and coherences are derived for the full time series from 2002 to 2023. The black and blue lines are the 95 percent confidence limits for the MUR and OSTIA spectra, respectively. Both spectra clearly show a peak at the annual signal. The largest difference is that the spectra offshore have more energy at longer periods (7 years). Along the coast, the spectral density increases and becomes significant for periods less than 4 years. The results indicate there is statistically significant interannual variability in the SST gradients. Both the MUR- and OSTIA-derived SST gradients follow similar patterns, with MUR showing slightly less spectral density.
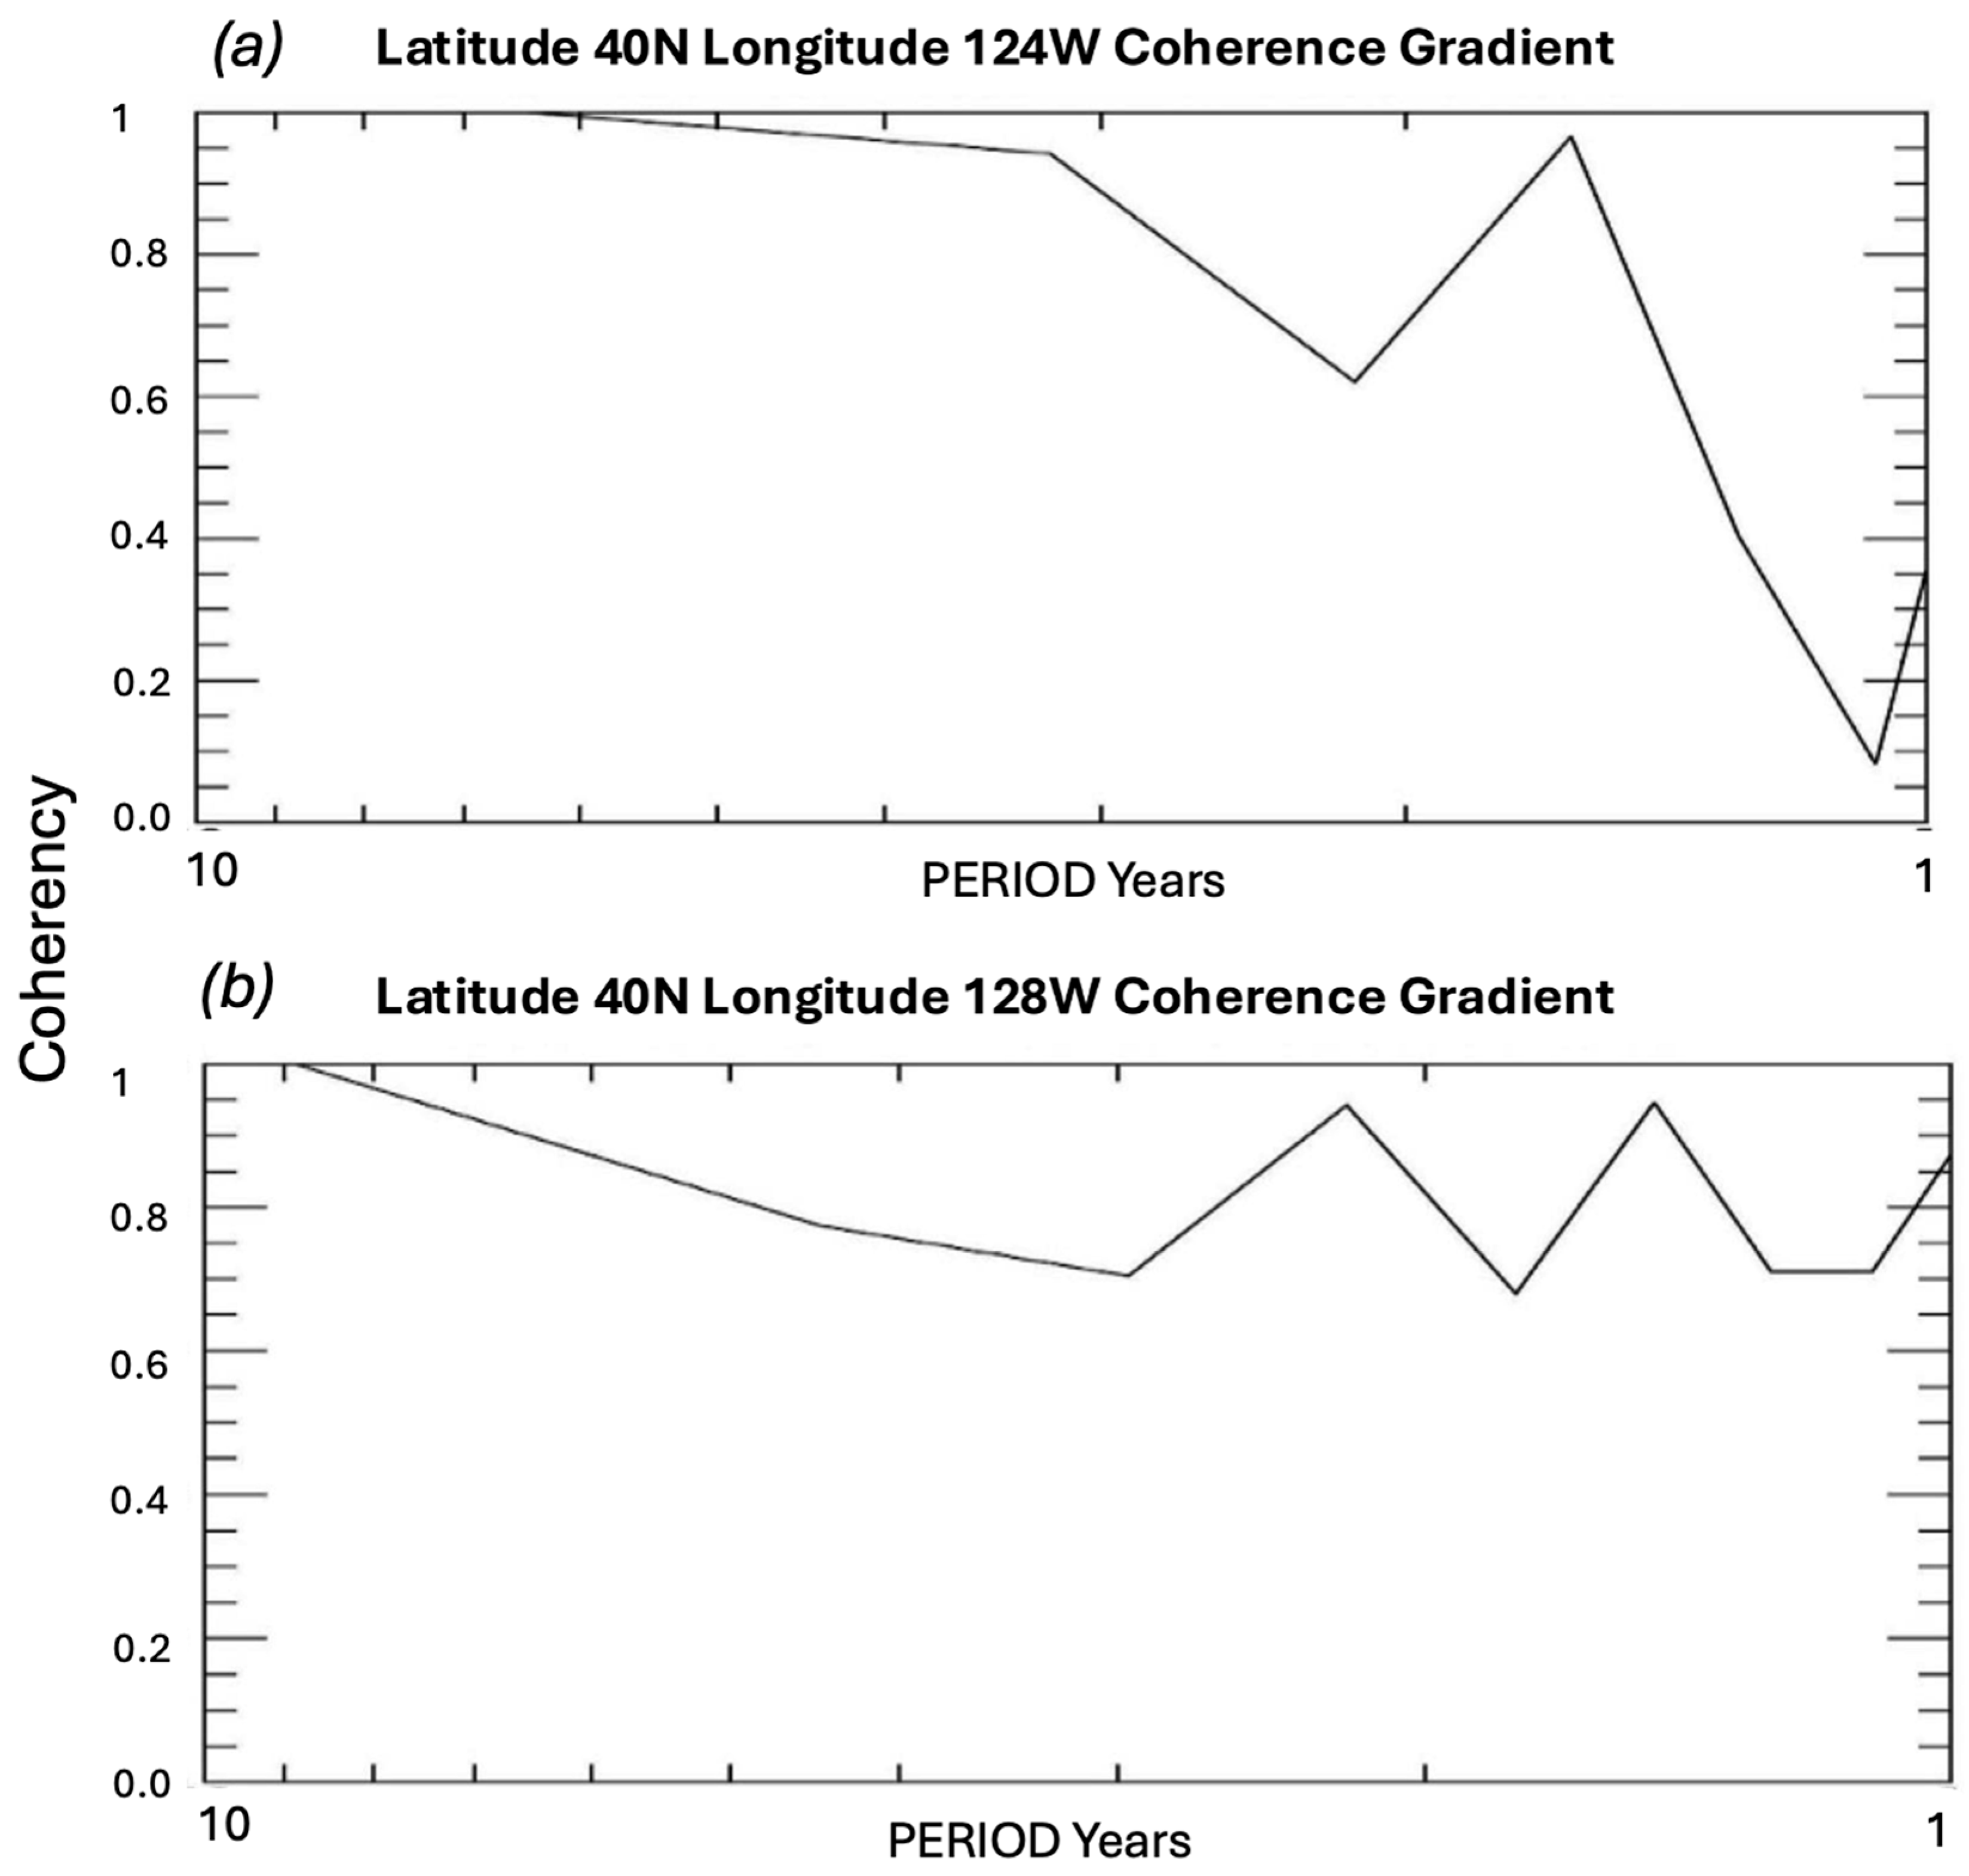
Figure 18a,b shows the coherence between the MUR and OSTIA SST gradients at the same locations as Figure 17. The coherence between the two products at −128°W offshore shows statistically significant coherence for periods < 4 years. At −128°W, all coherences are above 0.60, indicating a strong relationship between the MUR- and OSTIA-derived SST gradients from the interannual to annual time scales. A major difference when compared with the coherence at the coast (−124°W, 40°N) is the decrease in coherence at a period less than 2 years. The coherences drop to 0.2 at the annual signal. Thus, the relationship between the MUR- and OSTIA-derived SST gradients at the coast is statistically insignificant at the annual cycle. These differences need to be explored further in future work to examine specifically whether they are related to issues of spatial resolution and/or cloud cover. The coherences and spectra were all derived based on the collocated MUR data for comparison purposes.

5. Conclusions

A comparison of a 20+-year time series of SST gradients based on the OSTIA and MUR SST products indicates important similarities but also significant differences. To the best of our knowledge, this is the first time satellite-derived SST gradients have been examined for long period trends and comparisons off the California Coast. Both the MUR- and OSTIA-derived SST gradients show similar seasonal cycles with a maxima in SST gradients occurring during the summer time. Differences in the magnitude of the SST gradients between OSTIA and MUR were identified. In the seasonal means, larger gradients were identified in the OSTIA SSTs. Two possible reasons were identified. One is that to derive the seasonal gradients for comparisons, a nearest neighbor approach was used to collocate the MUR 1 km SST to the OSTIA 5 km grid. This was done to allow for efficient processing for the full 20+-year time series. In comparison with using a mean MUR SST value derived over the OSTIA 5 km grid, the mean approach had slightly, but overall insignificant, larger values. An examination of cloud cover in the area indicates that the issue of clouds could potentially impact the derivation of SST gradients. The results indicate that this issue needs to be examined further, as the OSTIA data incorporate geostationary data, which would increase the number of cloud-free pixels.
Overall, both OSTIA and MUR showed increasing trends in SST gradients close to the coast, consistent with increasing upwelling. This result would be consistent with the increase in alongshore Ekman transport winds [31,35,43]. A major difference identified between the trends in the MUR and OSTIA gradients was along the central coast where the OSTIA-derived gradients showed increasing magnitudes, while MUR indicated there was no trend in the gradients.
The coherence and spectra were examined for time series of the MUR and OSTIA SST gradients at two offshore locations at 40°N. Offshore, the coherences between MUR and OSTIA are statistically significant over the broad range of temporal scales. In the coastal region, the coherences between the OSTIA and MUR SST gradients decrease sharply at time scales less than 2 years. This is most likely due to differences in the two datasets resolving the coastal upwelling.
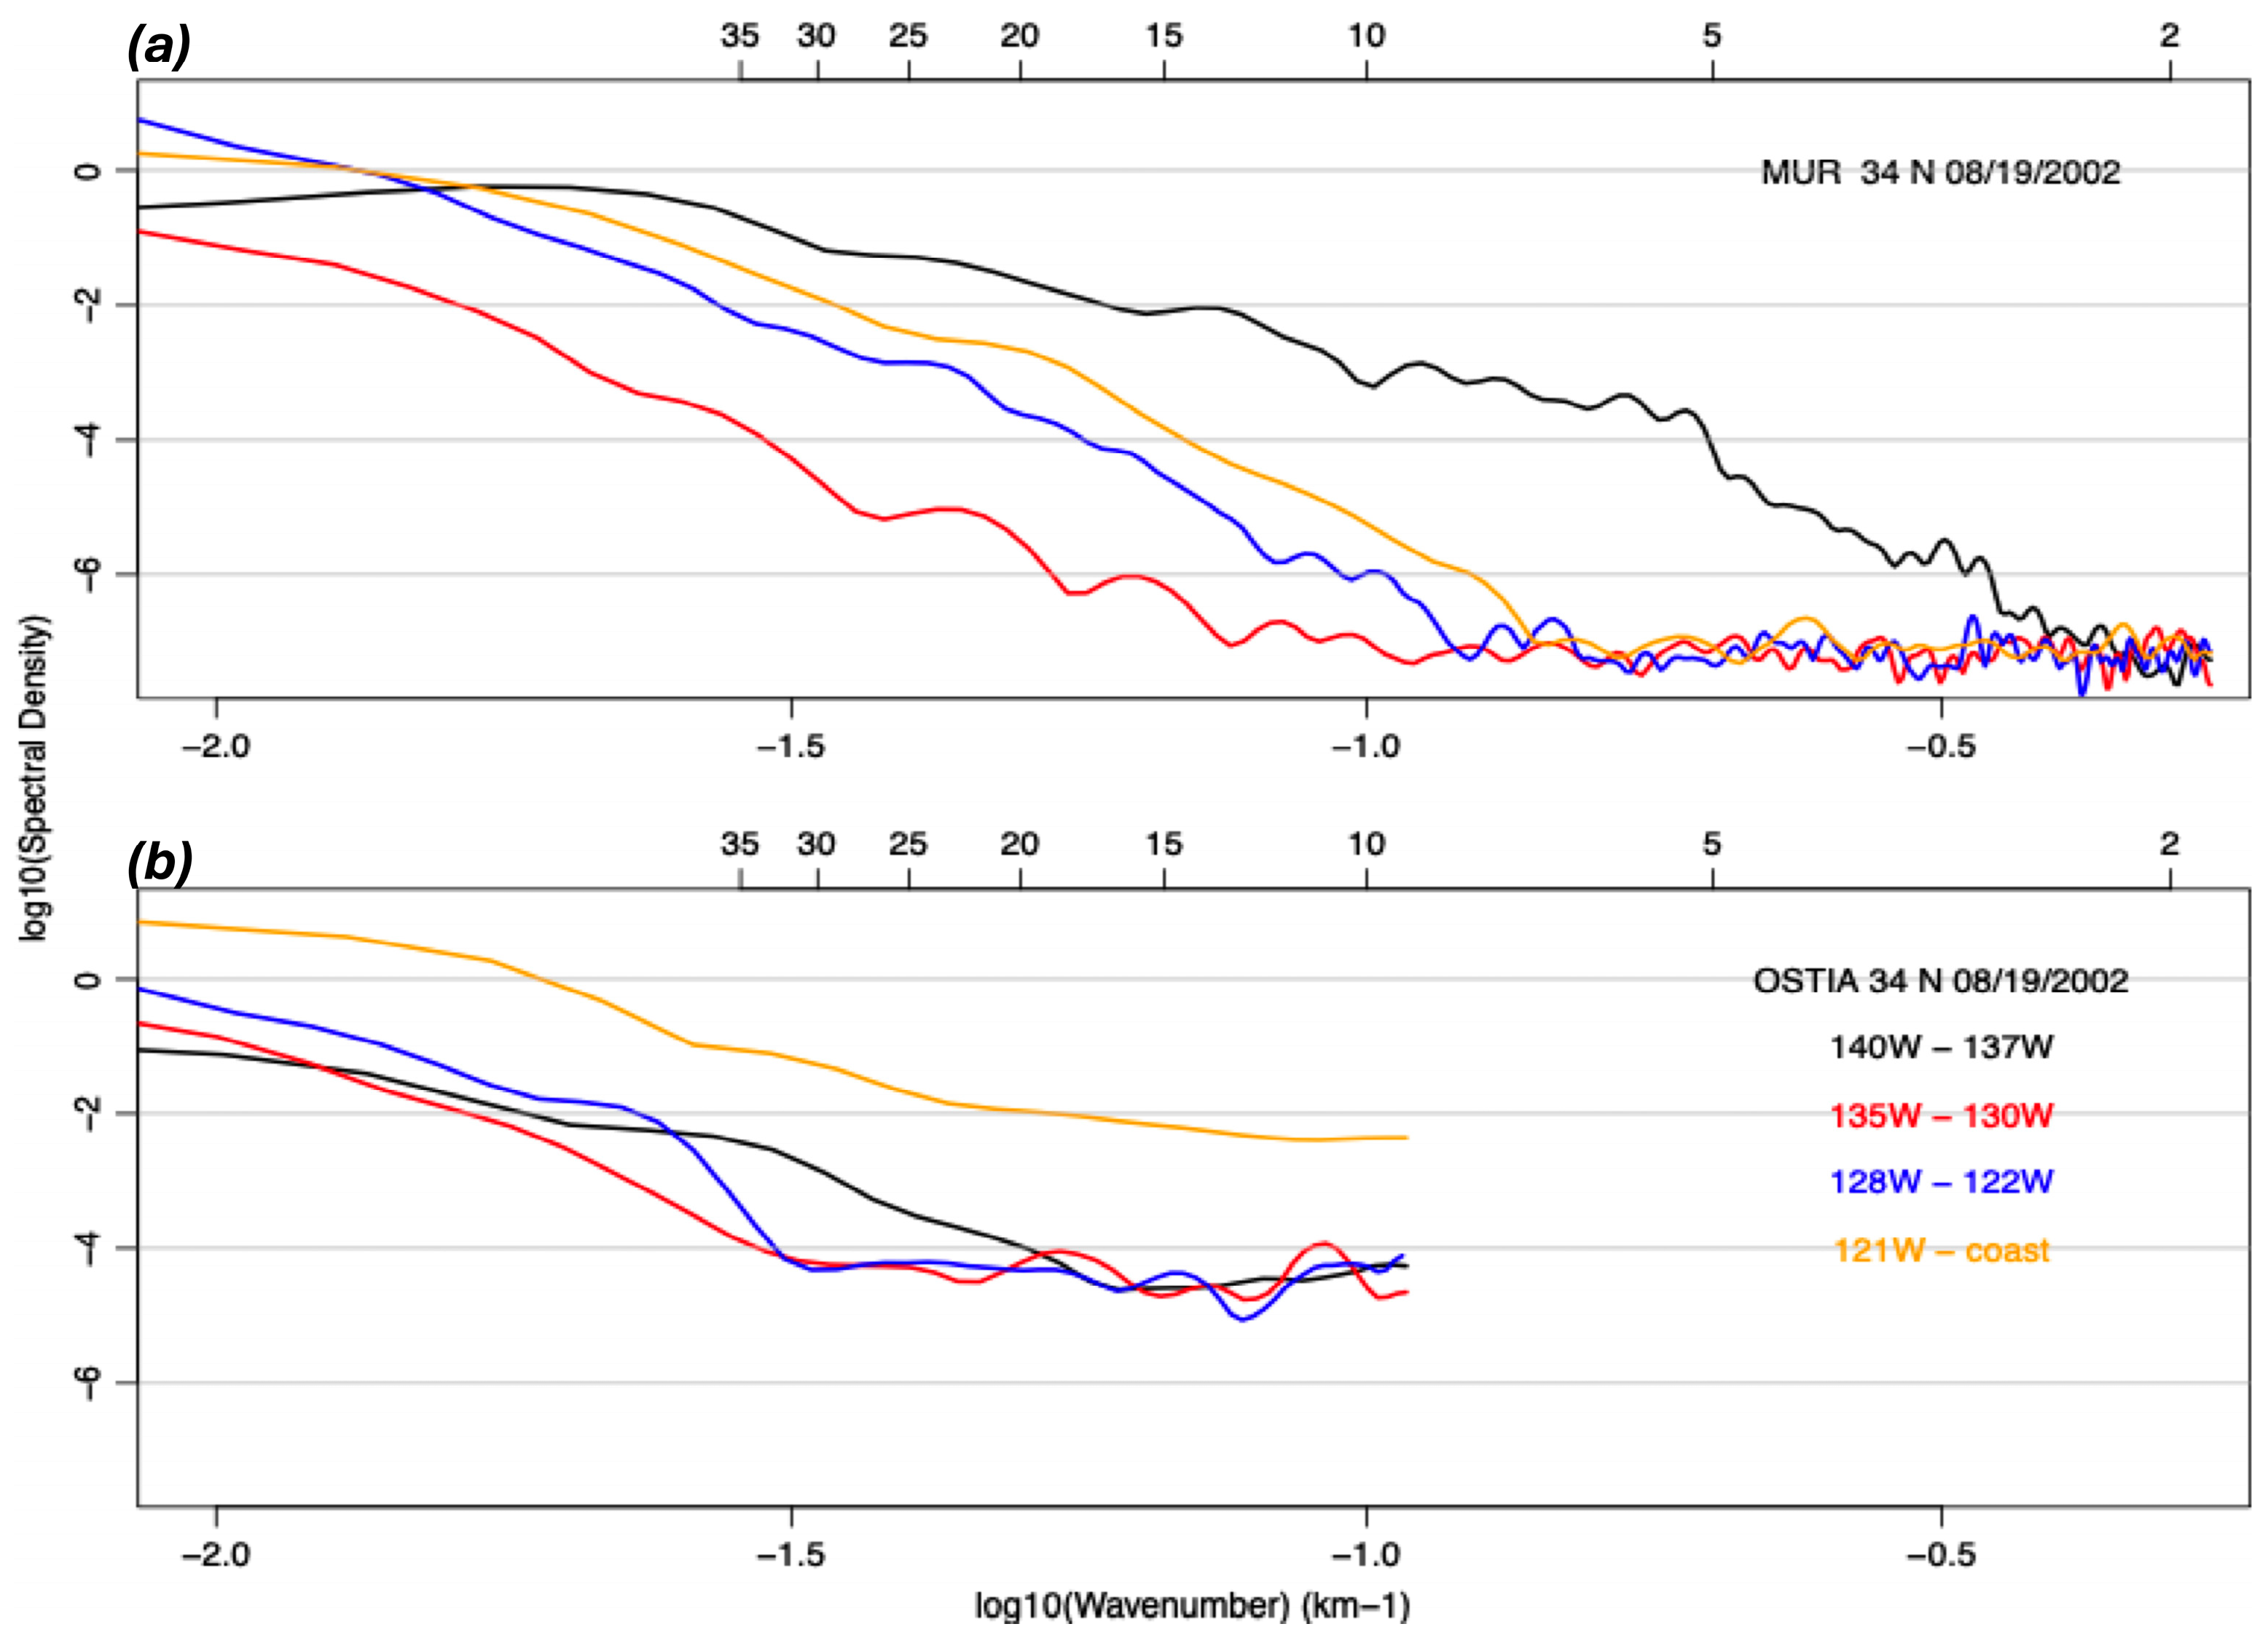
Future work needs to be focused on understanding the impact of resolution on resolving coastal dynamics. Additionally, understanding the full impact of cloud coverage is critical. Figure 19 and Figure 20 are examples of wavenumber spectra derived from OSTIA and MUR SSTs for 19 August 2002. Spectra are derived at two latitudes: 34°N and 40°N. Figure 19a shows the spectra for OSTIA for the four different longitude bands, while Figure 19b shows the spectra for the MUR SST. The spectrum for the site most offshore, that is, 140°W to 137°W, clearly has the greatest spectral density, with the site off the coast having the next highest spectral density. Offshore at spatial scales between 10 and 15 km, the spectral density flattens out indicating the dominance of noise. OSTIA shows the greatest spectral density off the coast, but the spectral density flattens out at spatial scales between 15 and 35 km. Figure 20a at 34°N shows that the greatest spectral density for MUR occurs near the coast. Additionally, the slope of the spectra near the coast indicates energy at spatial scales > 3 km. Figure 20b for OSTIA shows a flattening of the curve at approximately 17 km near the coast. Thus, at 34°N, an area of significant summer time upwelling, the MUR spectra indicate less noise at spatial resolutions < 10 km with an enhanced spatial resolution of 3 km with respect to OSTIA. Future work would focus on repeating the analysis over the entire 20-year time period. These results indicate that for coastal regions, additional work needs to focus on understanding the effective resolution of the datasets and how it is affected by cloud cover.
The goal of this work was to determine how GHRSST L4 datasets might be applied to monitor changes in coastal upwelling and fronts. A critical result is that more research and work need to be done to determine possible impacts of cloud cover on the determination of SST gradients and differences seen in the datasets. Even with differences in the MUR and OSTIA SST gradients, it was encouraging that both data products identified similar seasonal cycles and possible trends in increasing SST gradients in northern and southern California. Additionally, further quantification of the issues of spatial and temporal resolution need to be examined with respect to understanding coastal dynamics and the application of remote sensing to identify possible long-term changes in frontal features associated with submesoscale and upwelling fronts. Thus, a major component of the work was to present results that would set up future research in applying satellite-derived high-resolution SSTs to coastal areas to better understand and predict changes in coastal upwelling and fronts.
A major point in this paper is that more work needs to be done to clearly understand the differences. The authors have identified two possible differences between the datasets: (1) clouds, and (2) the interpolation of MUR to the lower-resolution OSTIA grid. Figure 5 quantifies the differences in gradients between the two datasets. Clearly, along the coast for the summer time, gradients in OSTIA show higher gradients than MUR with maxima reaching 0.015 °C/km.

Author Contributions

J.V.-C. was involved in the conceptualization, methodology, and formal analysis of the work. Additionally, J.V.-C. wrote the initial draft. M.G.-R. was involved with a major portion of the writing and intellectual contributions to the manuscript. D.S.W. was also involved with intellectual contributions to the manuscript and editing. J.G.-V. edited parts of the manuscript. D.C. supported the scientific and technical editing of the manuscript. All authors have read and agreed to the published version of the manuscript.

Funding

This research was supported by NASA support for the Multi-Sensors Improved Sea Surface Temperature Project, MISST (NASA grant #80NSSC20K0768). J.V.-C. was funded under a contract with NASA at the Jet Propulsion Laboratory/California Institute of Technology. M.G.-R. was funded through support for MISST (NASA #80NSSC20K0768). D.S.W. was funded through NASA grants supporting the ECOsystem Spaceborne Thermal Radiometer Experiment (NASA 80NSSC20K0074 and 80NSSC23K0643). D.C. was supported by Copernicus Marine Service—Sea Surface Temperature Thematic Assembly Center (contract no. 24251L04-COP-TAC-SST-2300: Provision of Sea Surface Temperature Observation Products). J.G.-V. was supported by CICESE and CONACYT, México.

Data Availability Statement

All remote sensing data used in this manuscript are available through NASA’s Physical Oceanography Distributed Active Archive Center (PO.DAAC). All the data are publicly available at no cost to the user community. The datasets used are included as products supported through the Group for High Resolution Sea Surface Temperature (GHRSST).

Acknowledgments

All products were retrieved through the Physical Oceanography Distributed Active Archive Center (PO.DAAC) (http://podaac.jpl.nasa.gov, accessed on 1 November 2024). Information for data access for the Multi-sensor Ultra-High Resolution Sea Surface Temperature dataset may be found at: https://podaac.jpl.nasa.gov/dataset/MUR-JPL-L4-GLOB-v4.1, https://doi.org/10.5067/GHGMR-4FJ04 (accessed on 1 November 2024). Information and data access for the Operational Sea Surface Temperature and Ice Analysis (OSTIA) may be found at: https://podaac.jpl.nasa.gov/dataset/OSTIA-UKMO-L4-GLOB-REP-v2.0 (accessed on 1 November 2024), https://doi.org/10.5067/GHOST-4RM02.

Conflicts of Interest

The authors declare no conflicts of interest.

References

  1. Chang, Y.; Cornillon, P. A comparison of satellite-derived sea surface temperature fronts using two edge detection algorithms. Deep Sea Res. Part II Top. Stud. Oceanogr. 2015, 119, 40–47. [Google Scholar] [CrossRef]
  2. Belkin, I.M.; Cornillon, P.C. Fronts in the world ocean’s large marine ecosystems. Ices Cm 2007, 500, 21. [Google Scholar]
  3. Vazquez-Cuervo, J.; Torres, H.S.; Menemenlis, D.; Chin, T.; Armstrong, E.M. Relationship between SST gradients and upwelling off Peru and Chile: Model/satellite data analysis. Int. J. Remote Sens. 2017, 38, 6599–6622. [Google Scholar] [CrossRef]
  4. Castro, S.L.; Emery, W.J.; Wick, G.A.; Tandy, W., Jr. Submesoscale sea surface temperature variability from UAV and satellite measurements. Remote Sens. 2017, 9, 1089. [Google Scholar] [CrossRef]
  5. Messager, C.; Swart, S. Significant atmospheric boundary layer change observed above an Agulhas Current warm cored eddy. Adv. Meteorol. 2016, 2016, 3659657. [Google Scholar] [CrossRef]
  6. Warner, T.T.; Lakhtakia, M.N.; Doyle, J.D.; Pearson, R.A. Marine atmospheric boundary layer circulations forced by Gulf Stream sea surface temperature gradients. Mon. Weather. Rev. 1990, 118, 309–323. [Google Scholar] [CrossRef]
  7. Barsugli, J.J.; Battisti, D.S. The basic effects of atmosphere–ocean thermal coupling on midlatitude variability. J. Atmos. Sci. 1998, 55, 477–493. [Google Scholar] [CrossRef]
  8. Nilsson, J. Propagation, diffusion, and decay of SST anomalies beneath an advective atmosphere. J. Phys. Oceanogr. 2000, 30, 1505–1513. [Google Scholar] [CrossRef]
  9. Woollings, T.; Hoskins, B.; Blackburn, M.; Hassell, D.; Hodges, K. Storm track sensitivity to sea surface temperature resolution in a regional atmosphere model. Clim. Dyn. 2010, 35, 341–353. [Google Scholar] [CrossRef]
  10. Zheng, Y.; Bourassa, M.A.; Hughes, P. Influences of sea surface temperature gradients and surface roughness changes on the motion of surface oil: A simple idealized study. J. Appl. Meteorol. Climatol. 2013, 52, 1561–1575. [Google Scholar] [CrossRef]
  11. Rascle, N.; Molemaker, J.; Marié, L.; Nouguier, F.; Chapron, B.; Lund, B.; Mouche, A. Intense deformation field at oceanic front inferred from directional sea surface roughness observations. Geophys. Res. Lett. 2017, 44, 5599–5608. [Google Scholar] [CrossRef]
  12. Frenger, I.; Gruber, N.; Knutti, R.; Münnich, M. Imprint of Southern Ocean eddies on winds, clouds and rainfall. Nat. Geosci. 2013, 6, 608–612. [Google Scholar] [CrossRef]
  13. Holligan, P. Biological implications of fronts on the northwest European continental shelf. Philos. Trans. R. Soc. Lond. Ser. Math. Phys. Sci. 1981, 302, 547–562. [Google Scholar] [CrossRef]
  14. Vazquez-Cuervo, J.; Gomez-Valdes, J.; Bouali, M.; Miranda, L.E.; Van der Stocken, T.; Tang, W.; Gentemann, C. Using saildrones to validate satellite-derived sea surface salinity and sea surface temperature along the California/Baja Coast. Remote Sens. 2019, 11, 1964. [Google Scholar] [CrossRef]
  15. Wick, G.A.; Jackson, D.L.; Castro, S.L. Assessing the ability of satellite sea surface temperature analyses to resolve spatial variability—The northwest tropical Atlantic ATOMIC region. Remote Sens. Environ. 2023, 284, 113377. [Google Scholar] [CrossRef]
  16. Rio, M.H.; Santoleri, R. Improved global surface currents from the merging of altimetry and sea surface temperature data. Remote Sens. Environ. 2018, 216, 770–785. [Google Scholar] [CrossRef]
  17. Ciani, D.; Rio, M.H.; Nardelli, B.B.; Etienne, H.; Santoleri, R. Improving the altimeter-derived surface currents using sea surface temperature (SST) data: A sensitivity study to SST products. Remote Sens. 2020, 12, 1601. [Google Scholar] [CrossRef]
  18. Isern-Fontanet, J.; García-Ladona, E.; González-Haro, C.; Turiel, A.; Rosell-Fieschi, M.; Company, J.B.; Padial, A. High-Resolution Ocean Currents from Sea Surface Temperature Observations: The Catalan Sea (Western Mediterranean). Remote Sens. 2021, 13, 3635. [Google Scholar] [CrossRef]
  19. Buongiorno Nardelli, B.; Cavaliere, D.; Charles, E.; Ciani, D. Super-Resolving Ocean Dynamics from Space with Computer Vision Algorithms. Remote Sens. 2022, 14, 1159. [Google Scholar] [CrossRef]
  20. Umbert, M.; Hoareau, N.; Turiel, A.; Ballabrera-Poy, J. New blending algorithm to synergize ocean variables: The case of SMOS sea surface salinity maps. Remote Sens. Environ. 2014, 146, 172–187. [Google Scholar] [CrossRef]
  21. Droghei, R.; Buongiorno Nardelli, B.; Santoleri, R. A new global sea surface salinity and density dataset from multivariate observations (1993–2016). Front. Mar. Sci. 2018, 5, 84. [Google Scholar] [CrossRef]
  22. Chelton, D.B.; Esbensen, S.K.; Schlax, M.G.; Thum, N.; Freilich, M.H.; Wentz, F.J.; Gentemann, C.L.; McPhaden, M.J.; Schopf, P.S. Observations of coupling between surface wind stress and sea surface temperature in the eastern tropical Pacific. J. Clim. 2001, 14, 1479–1498. [Google Scholar] [CrossRef]
  23. Chelton, D.B.; Schlax, M.G.; Samelson, R.M. Samelson. Summertime coupling between sea surface temperature and wind stress in the California Current System. J. Phys. Oceanogr. 2007, 37, 495–517. [Google Scholar] [CrossRef]
  24. Vazquez-Cuervo, J.; García-Reyes, M.; Gómez-Valdés, J. Identification of Sea Surface Temperature and Sea Surface Salinity Fronts along the California Coast: Application Using Saildrone and Satellite Derived Products. Remote Sens. 2023, 15, 484. [Google Scholar] [CrossRef]
  25. Huyer, A. Coastal upwelling in the California Current system. Prog. Oceanogr. 1983, 12, 259–284. [Google Scholar] [CrossRef]
  26. Checkley, D.M., Jr.; Barth, J.A. Barth. Patterns and processes in the California Current System. Prog. Oceanogr. 2009, 83, 49–64. [Google Scholar] [CrossRef]
  27. Chavez, F.P.; Messié, M. A comparison of eastern boundary upwelling ecosystems. Prog. Oceanogr. 2009, 83, 80–96. [Google Scholar] [CrossRef]
  28. Koračin, D.; Dorman, C.E.; Lewis, J.M.; Hudson, J.G.; Wilcox, E.M.; Torregrosa, A. Marine fog: A review. Atmos. Res. 2014, 143, 142–175. [Google Scholar] [CrossRef]
  29. Rykaczewski, R.R.; Checkley, D.M., Jr. Influence of ocean winds on the pelagic ecosystem in upwelling regions. Proc. Natl. Acad. Sci. USA 2008, 105, 1965–1970. [Google Scholar] [CrossRef]
  30. Bakun, A. Global climate change and intensification of coastal ocean upwelling. Science 1990, 247, 198–201. [Google Scholar] [CrossRef]
  31. Sydeman, W.J.; García-Reyes, M.; Schoeman, D.S.; Rykaczewski, R.R.; Thompson, S.A.; Black, B.A.; Bograd, S.J. Climate change and wind intensification in coastal upwelling ecosystems. Science 2014, 345, 77–80. [Google Scholar] [CrossRef]
  32. Rykaczewski, R.R.; Dunne, J.P.; Sydeman, W.J.; García-Reyes, M.; Black, B.A.; Bograd, S.J. Poleward displacement of coastal upwelling-favorable winds in the ocean’s eastern boundary currents through the 21st century. Geophys. Res. Lett. 2015, 42, 6424–6431. [Google Scholar] [CrossRef]
  33. Quilfen, Y.; Shutler, J.; Piolle, J.F.; Autret, E. Recent trends in the wind-driven California current upwelling system. Remote Sens. Environ. 2021, 261, 112486. [Google Scholar] [CrossRef]
  34. Bograd, S.J.; Jacox, M.G.; Hazen, E.L.; Lovecchio, E.; Montes, I.; Buil, M.P.; Shannon, L.J.; Sydeman, W.J.; Rykaczewski, R.R. Climate change impacts on eastern boundary upwelling systems. Annu. Rev. Mar. Sci. 2023, 15, 303–328. [Google Scholar] [CrossRef]
  35. Bustos, D.F.; Narváez, D.A.; Dewitte, B.; Oerder, V.; Vidal, M.; Tapia, F. Revisiting historical trends in the Eastern Boundary Upwelling Systems with a machine learning method. Front. Mar. Sci. 2024, 11, 1446766. [Google Scholar] [CrossRef]
  36. Bakun, A.; Black, B.A.; Bograd, S.J.; Garcia-Reyes, M.; Miller, A.J.; Rykaczewski, R.R.; Sydeman, W.J. Anticipated effects of climate change on coastal upwelling ecosystems. Curr. Clim. Change Rep. 2015, 1, 85–93. [Google Scholar] [CrossRef]
  37. García-Reyes, M.; Koval, G.; Sydeman, W.J.; Palacios, D.; Bedriñana-Romano, L.; DeForest, K.; Silva, C.M.; Sepúlveda, M.; Hines, E. Most eastern boundary upwelling regions represent thermal refugia in the age of climate change. Front. Mar. Sci. 2023, 10, 1158472. [Google Scholar] [CrossRef]
  38. Cayula, J.F.; Cornillon, P. Cloud detection from a sequence of SST images. Remote Sens. Environ. 1996, 55, 80–88. [Google Scholar] [CrossRef]
  39. Minnett, P.J.; Kilpatrick, K.A.; Podestá, G.P.; Evans, R.H.; Szczodrak, M.D.; Izaguirre, M.A.; Williams, E.J.; Walsh, S.; Reynolds, R.M.; Bailey, S.W.; et al. Skin sea-surface temperature from VIIRS on Suomi-NPP—NASA continuity retrievals. Remote Sens. 2020, 12, 3369. [Google Scholar] [CrossRef]
  40. Chin, T.M.; Vazquez-Cuervo, J.; Armstrong, E.M. A multi-scale high-resolution analysis of global sea surface temperature. Remote Sens. Environ. 2017, 200, 154–169. [Google Scholar] [CrossRef]
  41. Donlon, C.J.; Martin, M.; Stark, J.; Roberts-Jones, J.; Fiedler, E.; Wimmer, W. The operational sea surface temperature and sea ice analysis (OSTIA) system. Remote Sens. Environ. 2012, 116, 140–158. [Google Scholar] [CrossRef]
  42. García-Reyes, M.; Largier, J.L. Seasonality of coastal upwelling off central and northern California: New insights, including temporal and spatial variability. J. Geophys. Res. Ocean. 2012, 117, C03028. [Google Scholar] [CrossRef]
  43. García-Reyes, M.; Largier, J. Observations of increased wind-driven coastal upwelling off central California. J. Geophys. Res. Ocean 2010, 115, C04011. [Google Scholar] [CrossRef]
  44. Meneghesso, C.; Seabra, R.; Broitman, B.R.; Wethey, D.S.; Burrows, M.T.; Chan, B.K.; Guy-Haim, T.; Ribeiro, P.A.; Rilov, G.; Santos, A.M.; et al. Remotely-sensed L4 SST underestimates the thermal fingerprint of coastal upwelling. Remote Sens. Environ. 2020, 237, 111588. [Google Scholar] [CrossRef]
  45. Jacox, M.G.; Moore, A.M.; Edwards, C.A.; Fiechter, J. Spatially resolved upwelling in the California Current System and its connections to climate variability. Geophys. Res. Lett. 2014, 41, 3189–3196. [Google Scholar] [CrossRef]
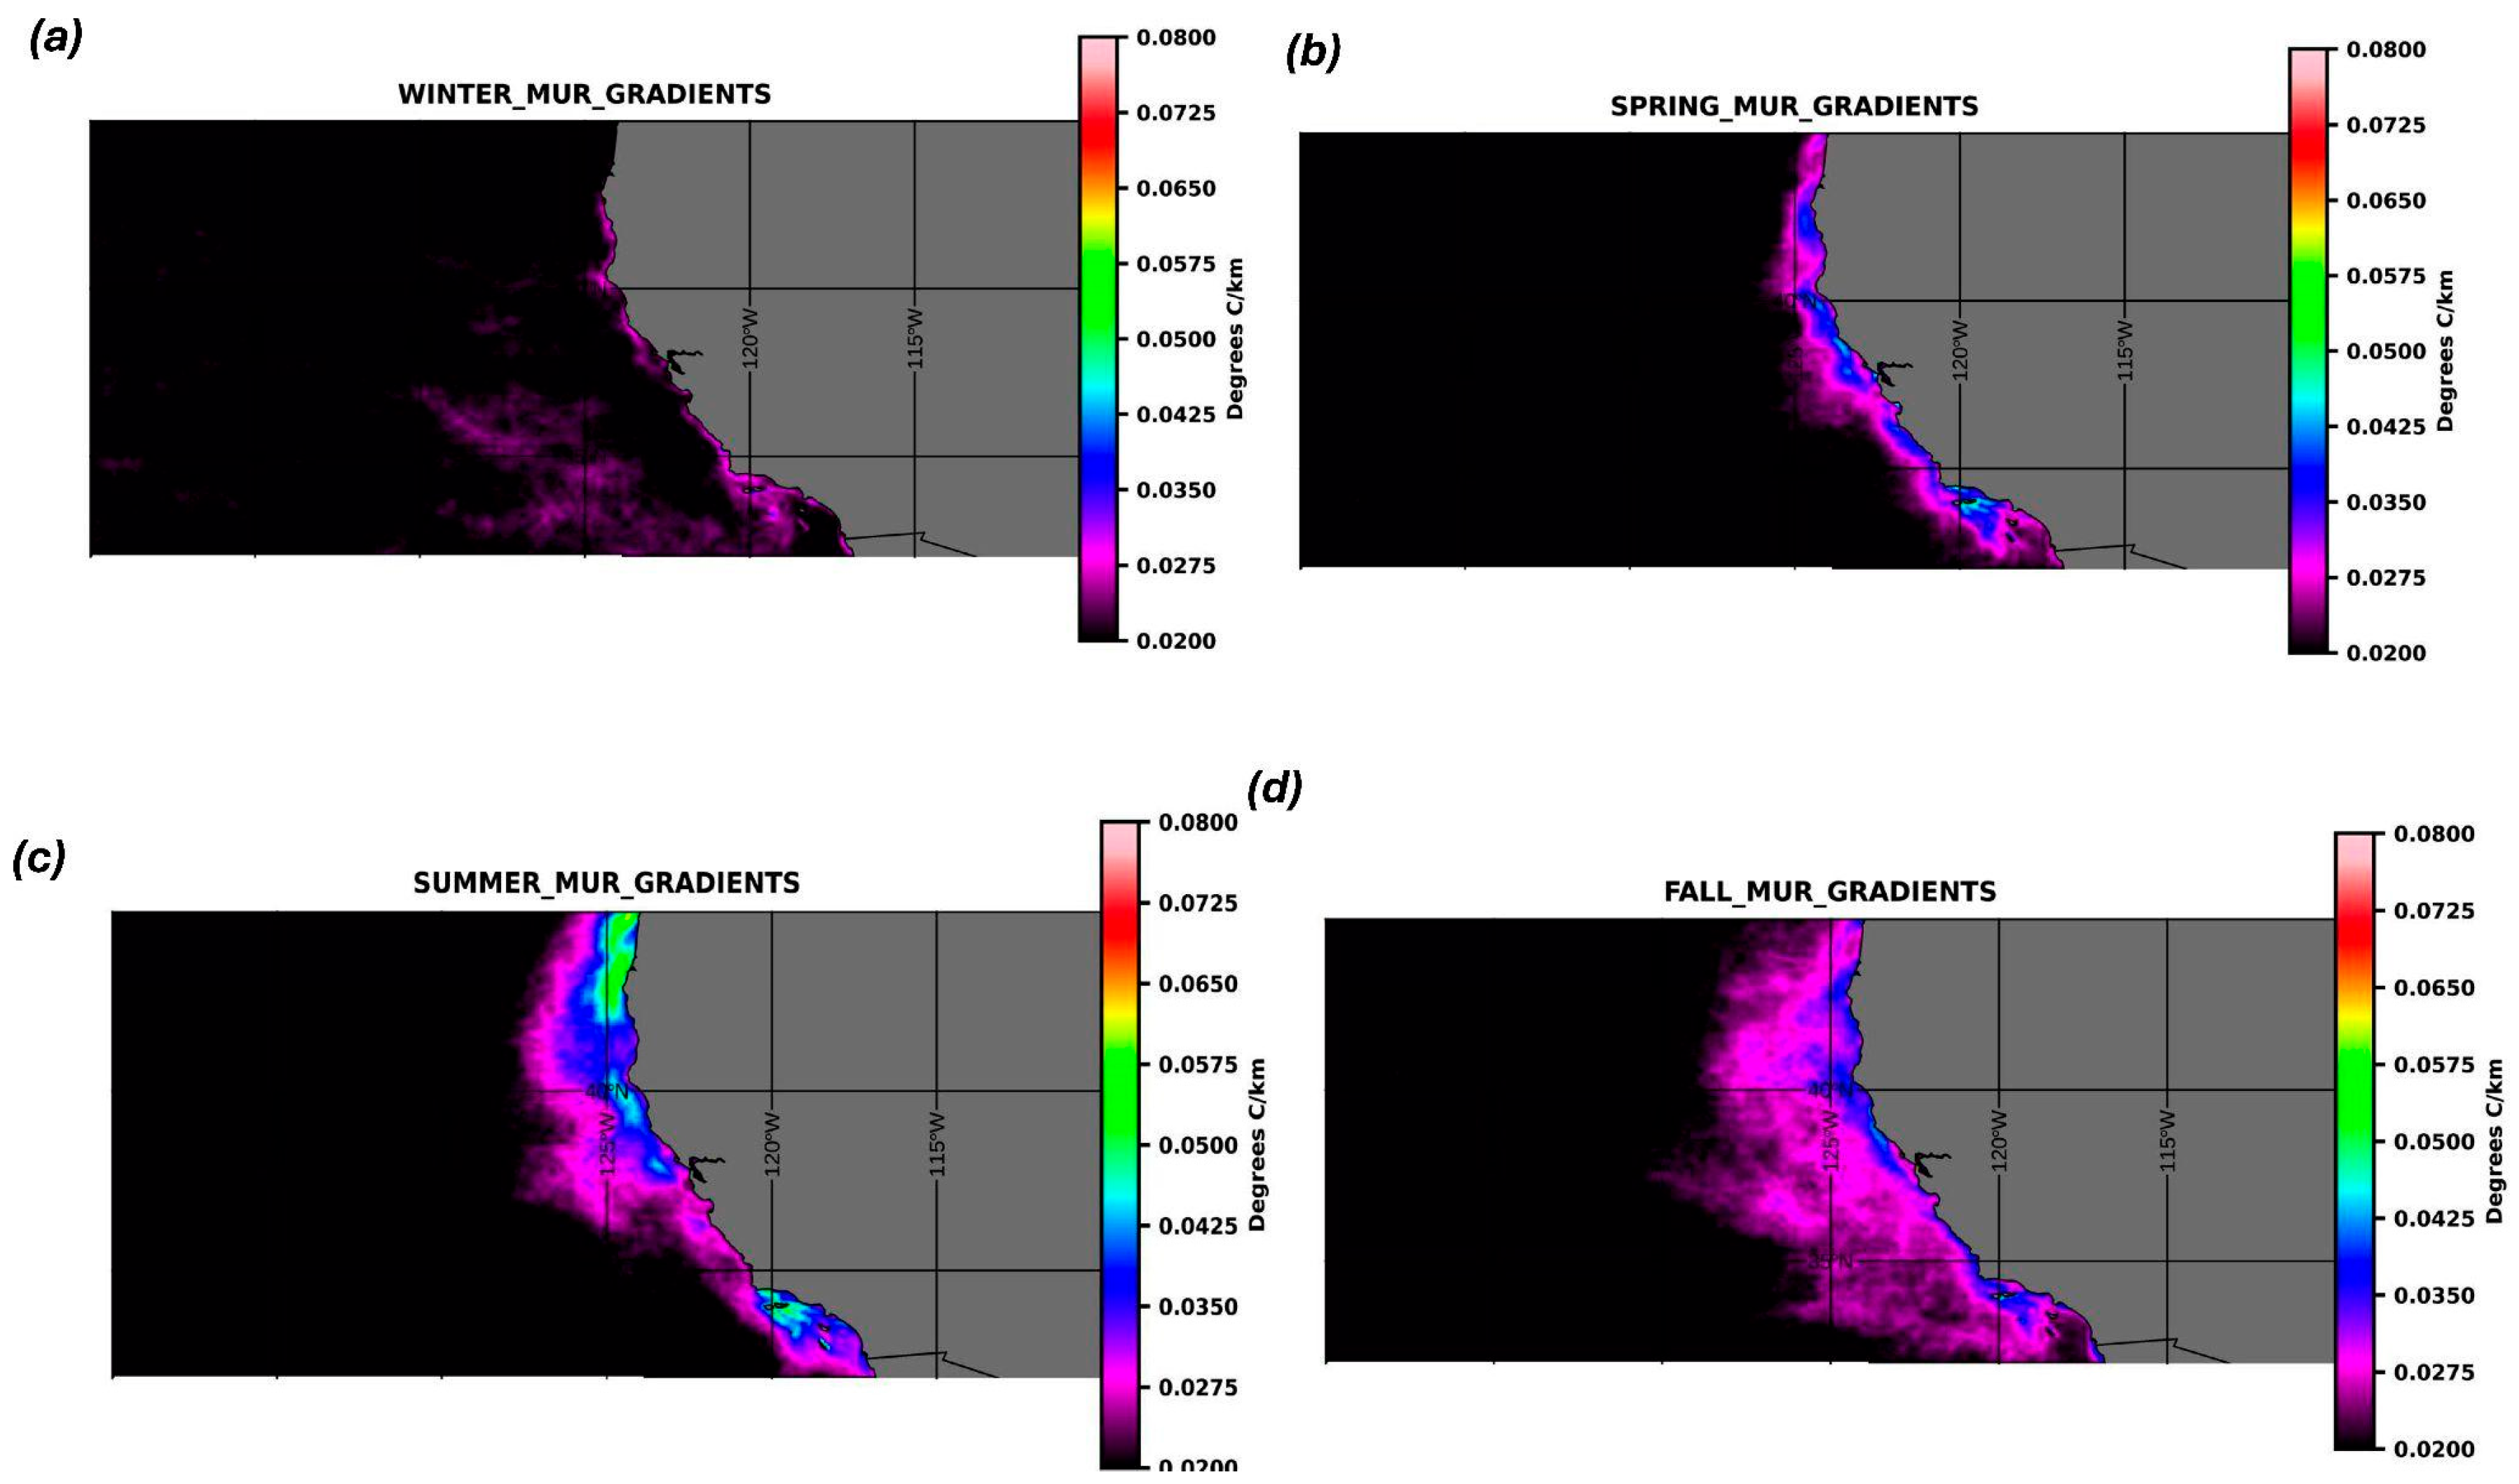
Figure 1. (ad): MUR-derived mean SST gradients for (a) winter, (b) spring, (c) summer, and (d) fall.
Remotesensing 17 02722 g001
Figure 2. (ad): MUR-derived root mean square SST gradients for (a) winter, (b) spring, (c) summer, and (d) fall.
Remotesensing 17 02722 g002
Figure 3. (ad): OSTIA-derived mean SST gradients for (a) winter, (b) spring, (c) summer, and (d) fall.
Remotesensing 17 02722 g003
Figure 4. (ad): OSTIA-derived root mean square SST gradients for (a) winter, (b) spring, (c) summer, and (d) fall.
Remotesensing 17 02722 g004
Figure 5. (ad): Mean difference in SST gradients between MUR and OSTIA for (a) winter, (b) spring, (c) summer, and (d) fall.
Remotesensing 17 02722 g005
Figure 6. (ad): Root mean square difference in SST gradients between MUR and OSTIA for (a) winter, (b) spring, (c) summer, and (d) fall.
Remotesensing 17 02722 g006
Figure 7. (ad): Correlation of SST gradients between MUR and OSTIA for (a) winter, (b) spring, (c) summer, and (d) fall.
Remotesensing 17 02722 g007
Figure 8. (a,b): (a) Linear trend of SST gradients for MUR on a 5 km grid, (b) linear trend of SST gradient for OSTIA, and (c) difference in linear trend magnitude between MUR and OSTIA datasets.
Remotesensing 17 02722 g008
Figure 9. (ad): Fraction of clear days for (a) winter, (b) spring, (c) summer, and (d) fall.
Remotesensing 17 02722 g009
Figure 10. (ad): (a) OSTIA-derived SST gradients for 19 August 2002, (b) MUR-derived SST gradients based on average over 5 km grids for 19 August 2002, (c) MUR-derived SST gradients based on nearest neighbor to OSTIA for 19 August 2002, (d) difference between MUR–OSTIA for 19 August 2002.
Remotesensing 17 02722 g010
Figure 11. (ad): (a) OSTIA- and MUR 1 km (nearest neighbor, ‘NN’)-derived SST gradients for 19 August 2002 at 34°N. Red are the MUR SST gradients, and black are OSTIA, (b) OSTIA- and MUR (mean 5 km grid)-derived SST gradients for 19 August 2002 at 34°N. Red are the MUR SST gradients, and black are OSTIA, (c) OSTIA- and MUR 1 km (nearest neighbor, ‘NN’)-derived SST gradients for 19 August 2002 at 40°N, (d) OSTIA- and MUR (mean 5 km grid)-derived SST gradients for 19 August 2002 at 40°N.
Remotesensing 17 02722 g011
Figure 12. (ac): (a) Shows the analyzed error for MUR for 19 August 2002. (b) Shows the analyzed error for MUR for 20 August 2019. (c) Shows the time series of the error analysis for a point off the coast at 40°N.
Remotesensing 17 02722 g012
Figure 13. (a,b): (a) Time series of gradients at 124°W and 40°N. (b) Time series of gradients at 128°W and 40°N.
Remotesensing 17 02722 g013
Figure 14. (a,b): (a) Shows the longitudinal dependence of the SST gradient for MUR and OSTIA at 33°N for the summer time frame. (b) Shows the longitudinal dependence of the SST gradient for MUR and OSTIA at 34°N for the summer time frame.
Remotesensing 17 02722 g014
Figure 15. (a,b): (a) Shows the longitudinal dependence of the SST gradient for MUR and OSTIA at 36°N for the summer time frame. (b) Shows the longitudinal dependence of the SST gradient for MUR and OSTIA at 37°N for the summer time frame.
Remotesensing 17 02722 g015
Figure 16. (a,b): (a) Shows the longitudinal dependence of the SST gradient for MUR and OSTIA at 38°N for the summer time frame. (b) Shows the longitudinal dependence of the SST gradient for MUR and OSTIA at 40°N for the summer time frame.
Remotesensing 17 02722 g016
Figure 17. (a,b): (a) Shows the frequency spectra for OSTIA and MUR SST gradients at −124°W, 40°N. (b) Shows the spectra for OSTIA and MUR SST gradients at −128°W, 40°N. Horizontal lines indicate the values of the 95 percent confidence intervals of the spectral density. MUR is shown in red and OSTIA in black.
Remotesensing 17 02722 g017
Figure 18. (a,b): (a) Coherence of MUR and OSTIA gradients at −124°W and 40°N. (b) Coherence of MUR and OSTIA gradients at −128°W and 40°N.
Remotesensing 17 02722 g018
Figure 19. (a,b): (a) Wavenumber spectra for MUR at 34°N for 19 August 2002 at four different longitude bands, −140°W to −137°W, −135°W to −130°W, −128°W to −122°W and −121°W to coast. (b) same as (a) for OSTIA.
Remotesensing 17 02722 g019
Figure 20. (a,b): (a) Wavenumber spectra for MUR at 40°N for 19 August 2002 at four different longitude bands, −140°W to −137°W, −135°W to −130°W, and −128°W to −122°W. (b) same as (a) for OSTIA.
Remotesensing 17 02722 g020
Table 1. Maximum gradient values (°C/km) per season for each SST product.
SeasonOSTIA (°C/km)MUR (°C/km)
Winter0.03790.0363
Spring0.09130.0512
Summer0.11150.0602
Fall0.06900.0470
Table 2. Biases, root mean squares, mean values, and correlations at 34°N for 19 August 2002 between OSTIA and MUR SST gradients.
MEANNearest Neighbor
Mean OSTIA (°C)0.0130.013
Mean MUR (°C)0.0160.016
RMS OSTIA (°C)0.0140.014
RMS MUR (°C)0.0140.014
Bias (°C)0.0020.002
Correlation0.630.61
Disclaimer/Publisher’s Note: The statements, opinions and data contained in all publications are solely those of the individual author(s) and contributor(s) and not of MDPI and/or the editor(s). MDPI and/or the editor(s) disclaim responsibility for any injury to people or property resulting from any ideas, methods, instructions or products referred to in the content.