Article

All-Weather Precipitable Water Vapor Retrieval over Land Using Integrated Near-Infrared and Microwave Satellite Observations

1
Institute of Geographic Sciences and Natural Resources Research, Chinese Academy of Sciences, Beijing 100101, China
2
University of the Chinese Academy of Sciences, Beijing 100049, China
3
Aerospace Information Research Institute, Chinese Academy of Sciences, Beijing 100101, China
*
Author to whom correspondence should be addressed.
Remote Sens. 2025, 17(15), 2730; https://doi.org/10.3390/rs17152730
Submission received: 18 June 2025 / Revised: 19 July 2025 / Accepted: 25 July 2025 / Published: 7 August 2025
(This article belongs to the Section Atmospheric Remote Sensing)

Abstract

Precipitable water vapor (PWV) is a critical component of the Earth’s atmosphere, playing a pivotal role in weather systems, climate dynamics, and hydrological cycles. Accurate estimation of PWV is essential for numerical weather prediction, climate modeling, and atmospheric correction in remote sensing. Ground-based observation stations can only provide PWV measurements at discrete points, whereas spaceborne infrared remote sensing enables spatially continuous coverage, but its retrieval algorithm is restricted to clear-sky conditions. This study proposes an innovative approach that uses ensemble learning models to integrate infrared and microwave satellite data and other geographic features to achieve all-weather PWV retrieval. The proposed product shows strong consistency with IGRA radiosonde data, with correlation coefficients (R) of 0.96 for the ascending orbit and 0.95 for the descending orbit, and corresponding RMSE values of 5.65 and 5.68, respectively. Spatiotemporal analysis revealed that the retrieved PWV product exhibits a clear latitudinal gradient and seasonal variability, consistent with physical expectations. Unlike MODIS PWV products, which suffer from cloud-induced data gaps, the proposed method provides seamless spatial coverage, particularly in regions with frequent cloud cover, such as southern China. Temporal consistency was further validated across four east Asian climate zones, with correlation coefficients exceeding 0.88 and low error metrics. This algorithm establishes a novel all-weather approach for atmospheric water vapor retrieval that does not rely on ground-based PWV measurements for model training, thereby offering a new solution for estimating water vapor in regions lacking ground observation stations.

1. Introduction

Water vapor, as one of the most important greenhouse gases in the atmosphere [1], contributes significantly to Earth’s greenhouse effect due to its strong absorption capacity for longwave radiation [2,3], and can amplify the radiative forcing effects of other greenhouse gases through positive feedback mechanisms [4,5,6]. In the global water cycle system, water vapor serves as a key link connecting oceans, continents, and the biosphere [7], achieving global water transport and redistribution through evaporation, condensation, and precipitation processes [8,9], thereby directly controlling regional precipitation patterns and the formation mechanisms of extreme weather events [10,11]. In the field of remote sensing, atmospheric water vapor is an important interference factor affecting the retrieval of other atmospheric gases [12,13,14], and is also a key input parameter for the retrieval of surface parameters such as land surface temperature and surface emissivity [15,16].
PWV refers to the total amount of atmospheric water vapor contained in a vertical column extending from the Earth’s surface to the top of the atmosphere. It is a key physical parameter for characterizing the spatiotemporal distribution of atmospheric water vapor on both global and regional scales [17,18]. The main observational techniques for PWV include radiosondes, Global Navigation Satellite Systems (GNSSs), and satellite remote sensing [19,20]. Radiosondes measure vertical profiles of atmospheric temperature and humidity by carrying sensors aloft via weather balloons, and PWV is subsequently derived by integrating these profiles [21]. GNSS-based PWV retrieval, on the other hand, exploits the tropospheric delay of satellite signals caused by atmospheric water vapor and infers PWV from the relationship between signal propagation time and the water vapor content along the signal path [22,23]. However, radiosonde stations are relatively sparse and operate at limited temporal resolution (typically twice per day). GNSSs offer high temporal resolution but suffer from uneven spatial coverage, particularly over oceans and remote continental regions. In contrast, satellite remote sensing provides broad spatial coverage, enabling continuous observations over vast areas, including oceans, mountainous terrains, and other hard-to-access regions [24,25]. This makes satellite-based PWV observations particularly valuable for comprehensively monitoring PWV patterns and their temporal evolution across diverse geographic domains, which is critical for climate studies, weather forecasting, and hydrological applications [18,26].
PWV retrieval algorithms for satellite observations can be divided into near-infrared (NIR), thermal infrared (TIR) and microwave (MW) algorithms. Near-infrared (NIR) retrieval of atmospheric water vapor is based on the absorption characteristics of water vapor within this spectral band range. The MODIS sensor retrieves the total column of PWV by quantifying the apparent reflectance difference between the water vapor strong absorption band (0.94 μm) and adjacent non-absorption spectral windows (0.865 μm), in conjunction with a precomputed atmospheric transmittance look-up table (LUT) derived from radiative transfer models (e.g., MODTRAN) [24,25]. This method exhibits high sensitivity to near-surface water vapor but is strongly dependent on clear-sky conditions [27]. Thermal infrared (TIR) methods exploit the emission and absorption features of water vapor primarily in this spectral region [28,29]. Thermal infrared (TIR) retrieval methods are typically based on radiative transfer models [30], which simulate the propagation of radiation through the atmosphere and establish the relationship between observed radiances and atmospheric state variables. By utilizing observations from high spectral resolution sensors (such as AIRS or IASI, which provide measurements across hundreds of narrow spectral channels), and applying optimal estimation or statistical inversion techniques, water vapor profiles are first retrieved [31], from which the total column of water vapor is subsequently derived. Thermal infrared (TIR) retrieval methods offer advantages such as the ability to operate during both daytime and nighttime, as well as partial penetration through thin clouds [32].
Infrared radiation cannot penetrate thick clouds, which limits the effectiveness of satellite infrared remote sensing for measuring PWV in all weather conditions [33,34]. Compared to near-infrared and thermal infrared methods, the microwave band takes advantage of its penetrating ability, which gives it great potential for the development of all-weather atmospheric water vapor detection. In the microwave band (1–300 GHz), water vapor has rotational absorption spectra at 22.235 and 183.31 GHz [35,36]; therefore, the inversion of atmospheric water vapor using microwave bands is mostly carried out around these two bands. The retrieval of PWV based on microwave bands primarily falls into two categories: physical retrieval methods based on the radiative transfer model and statistical retrieval methods based on machine learning. The radiative transfer method utilizes radiative transfer modeling to simulate microwave brightness temperatures under diverse atmospheric and surface conditions, establishing a quantitative relationship between brightness temperature and water vapor content [37]. This methodology subsequently combines satellite-observed brightness temperature measurements with ancillary datasets to retrieve atmospheric PWV through physical iterative inversion algorithms [38,39]. The radiative transfer model method demonstrates distinct advantages through its well-defined physical mechanisms and strong interpretability [40], while exhibiting limitations including computational intensity, time-consuming iterative processes, and the necessity for high-precision land surface emissivity data to ensure retrieval accuracy.
Machine learning methods have been widely used in the atmospheric remote sensing field because of their computational efficiency and robustness to surface heterogeneity. A typical machine learning-based PWV retrieval workflow comprises four key stages: (1) Feature selection: satellite brightness temperatures, reanalysis data, and land surface variables are extracted as input features, which critically determine the model’s capacity to capture nonlinear relationships in PWV retrieval [26]. (2) Sample preparation: training targets primarily originate from ground-based stations, which provide long term and high-accuracy PWV measurements. (3) Model training: regression algorithms ranging from tree-based models [41,42] to neural networks [43,44,45] are employed to establish relationships between extracted features and PWV. (4) Spatial prediction: the trained model takes gridded feature inputs as predictors to generate PWV distribution maps.
The number of GNSS stations remains relatively limited, and their spatial distribution is uneven, with notably sparse coverage in plateau and desert regions. These characteristics may influence the spatial representativeness of machine learning models trained solely on ground-based PWV observations. To help mitigate these challenges, this study introduces an alternative strategy that utilizes satellite-derived MODIS infrared PWV as training targets. By establishing a statistical relationship between multi-source features—such as microwave brightness temperatures and surface characteristics—and near-infrared PWV, the proposed approach enhances the model’s potential applicability in areas with limited ground-based observations. Such multi-source data synergy not only enhances the model’s applicability in regions lacking ground stations but also provides a novel technical pathway for high-accuracy PWV retrieval at global scales and for extreme weather processes.

2. Datasets

The dataset utilized in this study comprises AMSR-2 microwave band data, MODIS infrared PWV data, surface elevation data, land use data, and IGRA radiosonde data. Table 1 summarizes the product names, corresponding spatiotemporal resolutions, and download sources used in this study. For spatial matching, all datasets were resampled to a consistent 10 km spatial resolution aligned with the AMSR-2 microwave band data. Specifically, the MODIS infrared PWV data and surface elevation data were resampled using the bilinear interpolation method. Due to its categorical attributes, the land use data underwent a majority resampling approach, whereby the most frequently occurring land use type within each 10 km grid cell at the original 500 m resolution was assigned as the representative category for that grid. Regarding temporal matching, to characterize daily water vapor conditions, the near-infrared PWV retrievals from MODIS satellites (Terra and Aqua) and the twice-daily PWV observations from IGRA radiosonde data were averaged to derive daily mean values.

2.1. Microwave Brightness Temperature Datasets

The microwave brightness temperature data used in this study were obtained from the Advanced Microwave Scanning Radiometer 2 (AMSR-2) sensor onboard the GCOM-W satellite. The passive microwave data used in this study were sourced from the NASA Earthdata platform “https://search.earthdata.nasa.gov/search (accessed on 12 June 2025)” under the dataset name GPM_1CGCOMW1AMSR2. This dataset provides Level 1C (L1C) calibrated microwave brightness temperature observations across multiple frequency channels, specifically 10.65, 18.7, 23.8, 36.5, and 89 GHz, with each channel including both vertical (V) and horizontal (H) polarizations. These passive microwave observations have a temporal resolution of 1.5 h and a spatial resolution of 10 km. Each L1C swath contains key parameters such as scan time, latitude and longitude, scan status, quality flags, incidence angle, Sun glint angle, and the intercalibrated brightness temperature. Detailed calibration methods and accuracy evaluations can be found in Berg et al. [46,47]. The AMSR-2 microwave band data was utilized in the proposed algorithm due to its ability to detect microwave signals beneath cloud cover, providing valuable observational data for our inversion process and playing a crucial role in water vapor retrieval.

2.2. Atmosphere Datasets

2.2.1. MODIS MCD19A2 Water Vapor

The MODIS sensors were launched onboard NASA’s Earth Observing System (EOS) Terra and Aqua satellites. As part of the MODIS Level-2 data products, the MCD19A2 Version 6.1 product is derived from the MAIAC algorithm [48]. This product includes multiple scientific datasets (SDSs), such as aerosol optical depth at 0.470 μm and 0.550 μm, column water vapor (CWV), and a cloud mask, at a 1 km resolution.
The MAIAC CWV algorithm is based on the heritage of the MOD05 product [25]. This approach calculates total water vapor transmittance using two dual-channel ratios in the 0.940 μm region and then retrieves columnar water vapor through look-up table (LUT) methods. The spectral channels utilized in this algorithm include MODIS B17 (0.890–0.920 μm), B18 (0.931–0.941 μm), and B19 (0.915–0.965 μm). In this study, MCD19A2 data were obtained from the Google Earth Engine platform “https://earthengine.google.com/platform/ (accessed on 12 June 2025)”. The MODIS NIR PWV was used for training samples due to its high observational accuracy and extensive spatial coverage. During data preprocessing, only pixels with the highest quality assurance (QA) flags were retained, while all pixels flagged as cloud-contaminated, cloud-shadowed, or having low-quality retrievals were excluded.

2.2.2. IGRA Radiosonde

The IGRA dataset, released by the National Centers for Environmental Information (NCEI), is a collection of radiosonde observations from over 2700 sounding stations worldwide. These stations typically launch radiosondes at 00:00 and 12:00 UTC daily. Radiosondes are equipped with sensors to measure atmospheric vertical profiles, including parameters such as temperature, humidity, pressure, and wind speed [49]. The raw data undergo multi-level automated processing and manual quality control procedures to eliminate erroneous or inconsistent records (Durre et al., 2008 [50]). In this study, atmospheric humidity profiles were integrated layer by layer to calculate PWV, which was used to validate the accuracy of satellite-derived PWV products. Figure 1 shows the spatial distribution of IGRA observation stations used in this study. The IGRA data was used to validate the correlation and error level of the inversion results from our model.

2.3. Land Surface Datasets

2.3.1. MODIS Land Use

The MODIS Land Cover Type (MCD12Q1) Version 6.1 dataset offers information on global land cover types at yearly intervals (2001–2022). This version of the MCD12Q1 dataset is created by using supervised classification techniques on MODIS Terra and Aqua reflectance data. The land cover categories are based on several classification systems. After the initial classifications, the data undergoes additional processing that uses existing knowledge and supplementary data to improve the accuracy of specific land cover classes. The MODIS land use data was used to differentiate between various surface types, as microwave transmission mechanisms vary across different land surface types.

2.3.2. NOAA DEM

The Global Land One-Kilometer Base Elevation (GLOBE) digital elevation model (DEM), developed and distributed by the National Oceanic and Atmospheric Administration (NOAA), provides a globally consistent representation of terrestrial elevation at a spatial resolution of 1 km (30 arc-seconds). Compiled from diverse data sources, including satellite altimetry, topographic maps, and ground-based surveys, the GLOBE DEM integrates elevation data across all landmasses except Antarctica. It resolves elevation values with a vertical accuracy of approximately ±30 m globally, though regional variations exist depending on data source quality and terrain complexity. The dataset employs a geographic latitude/longitude coordinate system (WGS84 datum) and is formatted as a gridded raster for compatibility with geospatial analysis tools. The DEM data was used as it is essential for accounting for elevation-related variations in microwave signal propagation.

3. Methods

The overall framework of the methodology developed in this study is shown in Figure 2. First, multi-source remote sensing and geographic data were collected, including Digital Elevation Model (DEM), land use type, NIR PWV, and AMSR-2 Microwave Brightness Temperature (MW BT). These datasets were preprocessed to achieve uniform spatial resolution to meet the study requirements. Subsequently, sampling points were generated within the study area, and the feature values of various factors were extracted using each sampling point. Temporal and spatial features derived from the above features were incorporated to construct an integrated dataset. Based on the constructed dataset, the SHapley Additive exPlanations (SHAP) method was applied to analyze feature importance and identify the key variables most relevant to PWV distribution. Next, the selected features were input into three ensemble learning models: Extremely Randomized Trees (ERT), eXtreme Gradient Boosting (XGBoost), and Gradient Boosting Regression Trees (GBRT). The dataset was modeled and trained using these algorithms. Ten-fold cross-validation was employed to evaluate the performance of each model, and the optimal model was selected based on the evaluation results. Finally, the selected optimal model was used to retrieve all-weather PWV products. These retrieved products were validated against IGRA radiosonde observations to assess their accuracy and reliability. This workflow provides a robust and efficient methodology for modeling and validating the spatial distribution of atmospheric PWV.

3.1. Training Sample Balance

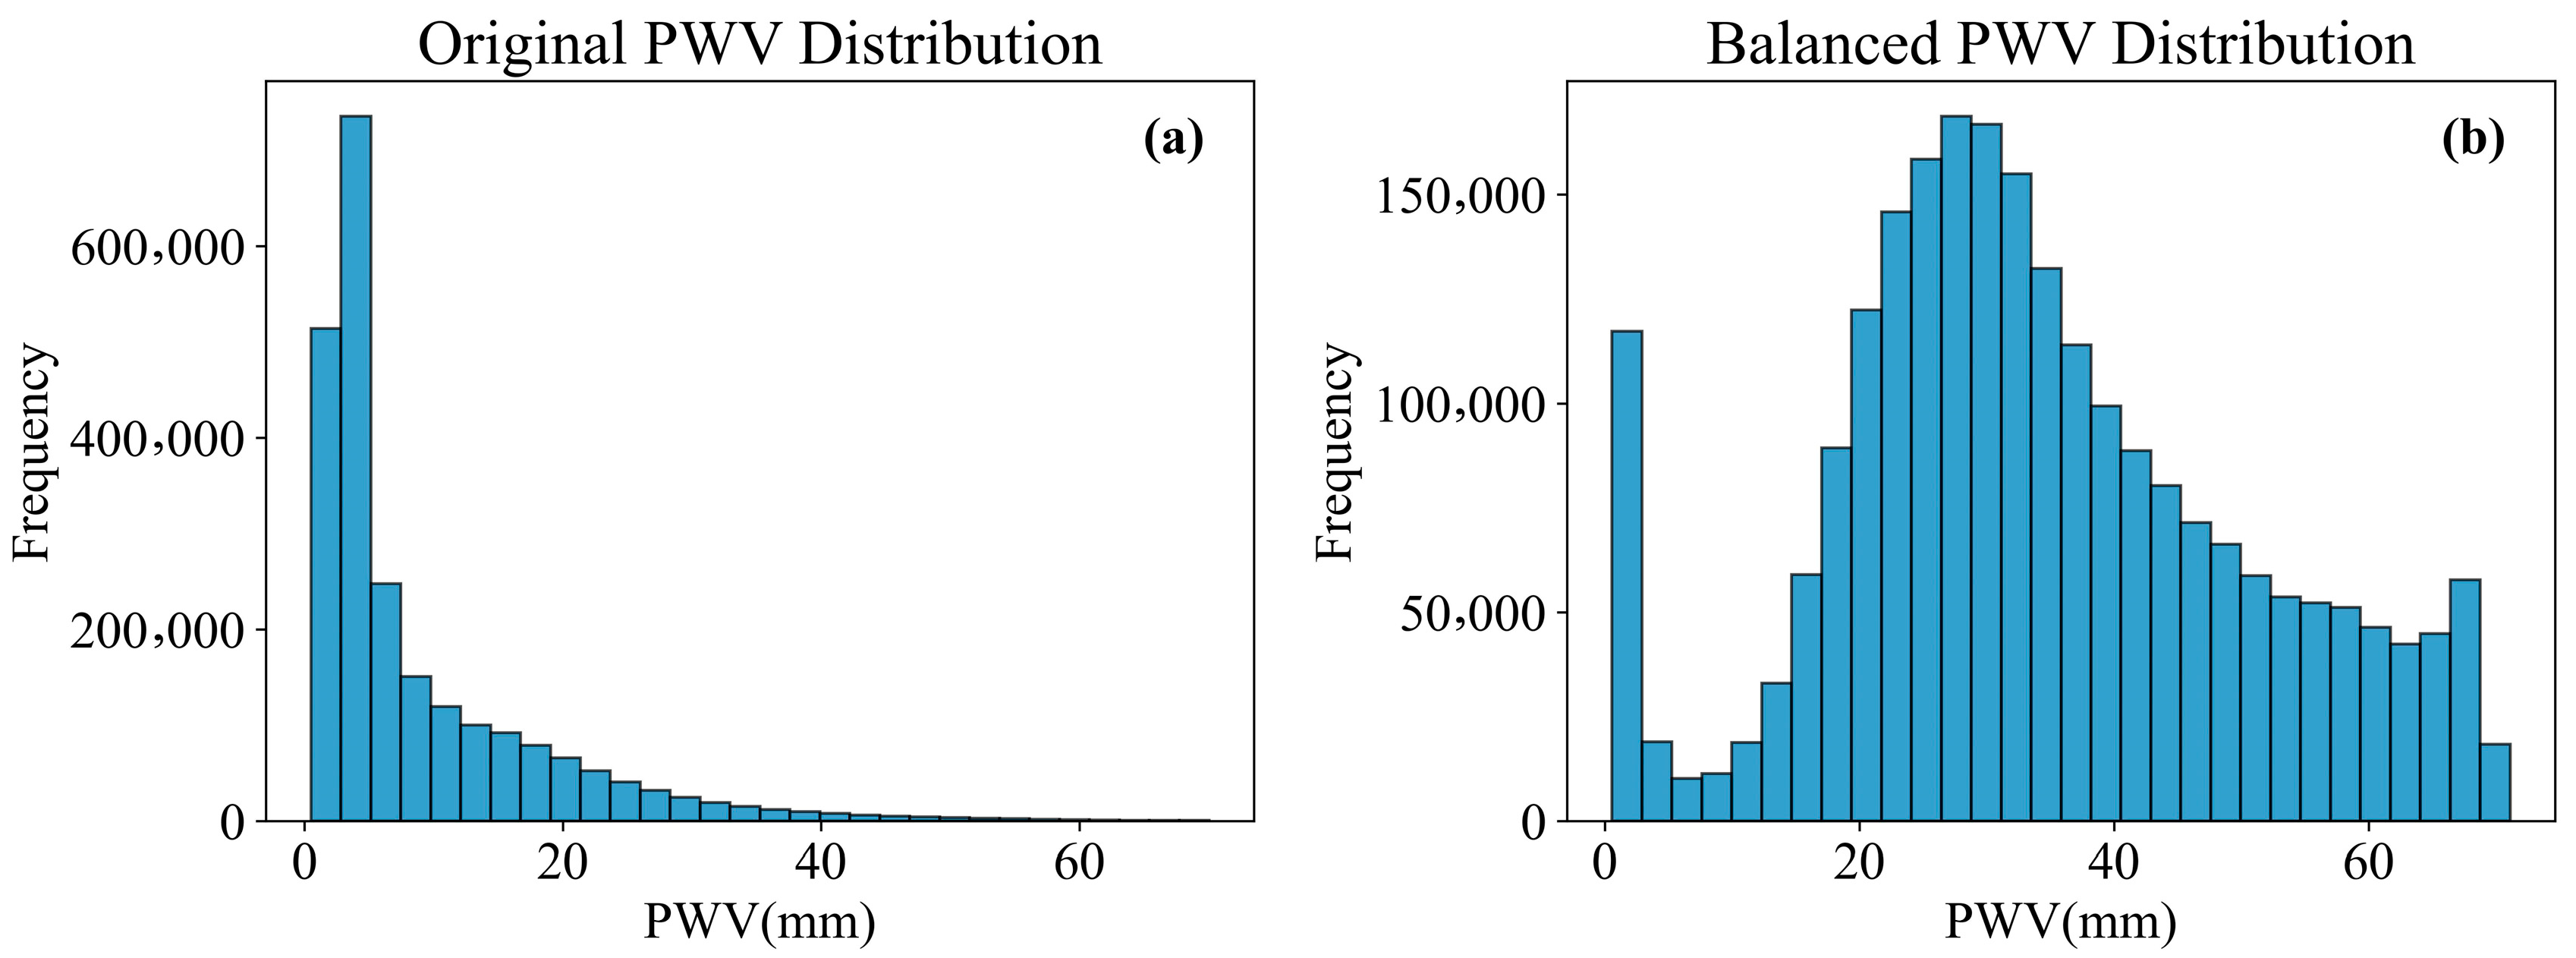
In the analysis of the extracted PWV data, it was found that the label values exhibit a significant long-tail distribution. Specifically, values between 0 and 20 mm account for 91.33% of the data, values between 20 and 40 mm account for 7.22%, and values between 40 and 60 mm account for 1.26%, as shown in Figure 3a. However, the long-tail distribution of PWV values can negatively impact the training of machine learning models. On one hand, the model tends to focus more on the high-frequency region of the dataset, leading to a reduced ability to predict the low-frequency, long-tail region. On the other hand, the long-tail distribution may cause overfitting or instability during training, which could affect the model’s generalization performance.
To address these issues, a log-normal function fitting was applied to the PWV data, and the reciprocal of the fitted function was used as the data sampling probability distribution function. Using this sampling function, the entire training dataset was re-sampled. This method reduces the sampling probability of low-value data and increases the sampling probability of high-value data. The final data histogram is shown in Figure 3b, with the resulting data distribution approaching a normal distribution. Specifically, values between 0 and 20 mm account for 17.91% of the data, values between 20 and 40 mm account for 51.52%, and values between 40 and 60 mm account for 24.33%. This strategy effectively improved the data balance and enhanced the model’s ability to learn from high-value data.

3.2. Ensemble Algorithm

Ensemble learning is a machine learning technique that enhances model performance by combining the predictions of multiple base learners. The core idea of ensemble learning is to train multiple models and aggregate their results in a specific manner to reduce the bias and variance of individual models, thereby achieving more robust and efficient predictive performance. Common ensemble learning methods are generally categorized into two main approaches: Bagging (e.g., Random Forest) and Boosting (e.g., Gradient Boosting Trees). Bagging reduces variance by training multiple models in parallel, while Boosting minimizes bias by training models sequentially. ERT introduces randomness by selecting features and split points randomly during tree construction, improving generalization and computational efficiency.
Extremely Randomized Trees (ERT) is an ensemble learning method based on the Bagging principle, whose core concept involves introducing greater randomness during training to enhance model generalization [51]. Unlike conventional random forests, ERT not only randomly selects feature subsets for each tree but also randomly chooses split points during node division. This strategy helps reduce model variance and mitigate overfitting risks, particularly suitable for datasets with large sample sizes and high feature dimensionality.
Gradient Boosted Regression Trees (GBRT) is a Boosting algorithm based on residual fitting [52], where each newly added regression tree fits the prediction errors from the previous iteration, progressively optimizing overall predictive performance. Due to its additive model structure with iterative optimization, GBRT demonstrates significant advantages in capturing complex nonlinear relationships.
XGBoost is a widely used boosting algorithm representing an efficient implementation of traditional Gradient Boosted Decision Trees (GBDT) [53]. Its primary advantages include (1) incorporating regularization terms to control model complexity and prevent overfitting; (2) employing loss-guided splitting and second-order gradient information for more precise tree structure optimization; and (3) supporting parallel computing, missing value handling, and sparse data optimization, significantly improving training efficiency and generalization on large-scale datasets.

3.3. Model Training

Most studies typically use station observations as the ground truth for machine learning model regression. However, these site observations are spatially sparse and highly unevenly distributed. (e.g., Qinghai–Tibet Plateau). Therefore, this study employs the widely validated MCD19A2 satellite product as ground truth for model training. Since AMSR2 satellite data are divided into ascending and descending orbit datasets, we developed separate models for each, establishing an ascending orbit model and a descending orbit model, respectively. The preliminary features selected for water vapor retrieval in this study include longitude, latitude, day of year (DOY), several AMSR-2 band combinations, land use, and digital elevation model (DEM) (Table 2).
The performance of ensemble learning models is typically influenced by the adjustment of several key parameters, each playing a critical role in the construction and optimization of the model. For instance, the parameter n_estimators determines the number of base learners, thereby affecting the complexity and generalization ability of the ensemble. The learning_rate controls the contribution of each base learner to the overall model, influencing the convergence speed and prediction accuracy. The max_depth or max_features (for decision tree-based models) determines the complexity of the weak learners, affecting their capacity to fit the underlying data distribution. The subsample parameter specifies the fraction of samples used for training each base learner, promoting diversity and robustness in the model. Additionally, alpha, lambda, or min_samples_split are regularization-related parameters that help reduce overfitting and enhance the model’s generalization performance. Careful tuning of these parameters is critical for achieving optimal results in ensemble learning tasks.
Given that the target data in this study is derived from MODIS infrared PWV data, which provides a large training dataset, the search range for the n_estimators parameter in the three ensemble learning models was set between 300 and 800, with an interval of 10. The max_depth and min_samples_split parameters were explored within a range of 5 to 20, with an interval of 1. For the XGBoost model, the gamma parameter was tuned between 0.1 and 1 with an increment of 0.1. During the search process, we observed that for the three models (ERT, XGBoost, and GBRT), the improvement in the R2 metric became marginal beyond n_estimators values of 540, 610, and 570, respectively. Therefore, considering computational efficiency, these values were selected as the optimal choices. For the remaining parameters, the highest model accuracy (e.g., R2) was achieved at their respective optimal values. All optimal parameters are summarized in Table 3.

3.4. SHAP (SHapley Additive exPlanations)

SHAP (SHapley Additive exPlanations) is an explanation method based on the Shapley value from cooperative game theory, used to quantify the contributions of each feature in machine learning models to the prediction outcomes [58]. This method achieves a fair decomposition of the model outputs by computing the marginal contributions of each feature across all possible subsets of features. SHAP values not only provide local explanations (i.e., explanations for individual predictions) but can also be aggregated into global explanations, revealing the importance of features across the entire dataset.
Since Shapley values fundamentally originate from cooperative game theory’s feature contribution allocation problem, their computational complexity grows exponentially with feature dimensionality, making direct Shapley value computation nearly infeasible for high-dimensional data. To address this, the SHAP framework introduces efficient approximation algorithms, primarily including Kernel SHAP and Tree SHAP. Kernel SHAP is a model-agnostic interpretation method based on weighted linear regression approximation, applicable to any black-box model. Although versatile, it still incurs substantial computational overhead with high-dimensional data. In contrast, Tree SHAP is specifically designed for tree-based models [59] (e.g., random forests, XGBoost, GBRT), with its core innovation leveraging the hierarchical structure and additivity properties of tree models to transform the exponential combinatorial space into a dynamic programming problem on tree structures, effectively reducing computational complexity to polynomial time. This characteristic enables Tree SHAP to provide feasible feature attribution results for large-scale datasets and complex models, balancing efficiency and interpretability.
In this study, we employ Tree SHAP to interpret our ensemble learning models, aiming to evaluate the causal relationships and contribution patterns between the prediction target (PWV) and input features. Through SHAP value computation and visualization for each prediction instance, we can not only identify the most influential features but also understand how feature value variations affect output directions (positive/negative). This significantly enhances model interpretability and trustworthiness, particularly crucial in physically-consistent research domains like remote sensing inversion.

3.5. Evaluation Methods

To evaluate the performance of the three ensemble learning models, we conducted a 10-fold cross-validation. Specifically, the dataset was randomly partitioned into 10 equally sized subsets (folds). In each iteration, one subset was used as the validation set, while the remaining nine subsets were used as the training set. This process was repeated 10 times, ensuring that each subset was used as the validation set exactly once. The final evaluation metrics were obtained by averaging the results across all 10 folds, providing a robust assessment of the models’ performance and their ability to generalize to unseen data.
In addition, the PWV data from IGRA profile observations were calculated using a layer-by-layer integration approach, with the calculation formula presented below. The derived PWV data were then spatiotemporally matched with the daily products estimated by the optimal model to validate the accuracy of the model’s retrievals. Importantly, the IGRA data were not used during the model training process, ensuring an independent and objective evaluation of the model’s predictive performance.

4. Results

4.1. Model Training and Validation

Figure 4 presents the modeling and testing results using three ensemble learning models ((a) ERT, (b) XGBoost, and (c) GBRT) on the 2020 dataset. All three models exhibit high R2 values, indicating their strong ability to explain the variance in the data. Among them, the ERT model has the highest R2 value (0.9911), followed by XGBoost (0.9867) and GBRT (0.9866), demonstrating excellent predictive performance across all models. The fit lines for each model show a high degree of agreement with the actual values, with small error terms, further validating the effectiveness of these models. Specifically, the ERT model has the lowest RMSE and MAE, at 1.4077 and 0.4409, respectively, outperforming XGBoost (RMSE = 1.7301, MAE = 0.5823) and GBRT (RMSE = 1.7257, MAE = 0.5803). This indicates that ERT provides slightly higher prediction accuracy among the three models. Additionally, the scatter plots in the figure are color-coded according to the Gaussian probability density, with the color gradient ranging from purple to yellow, reflecting the density of the predicted values. Most data points are concentrated around the fit line, indicating that the predicted values are close to the actual values. Therefore, although all three models perform similarly, ERT exhibits slightly higher accuracy, and as a result, we chose the ERT model as the final atmospheric water vapor inversion model.

4.2. Features Contribution Analysis with SHAP

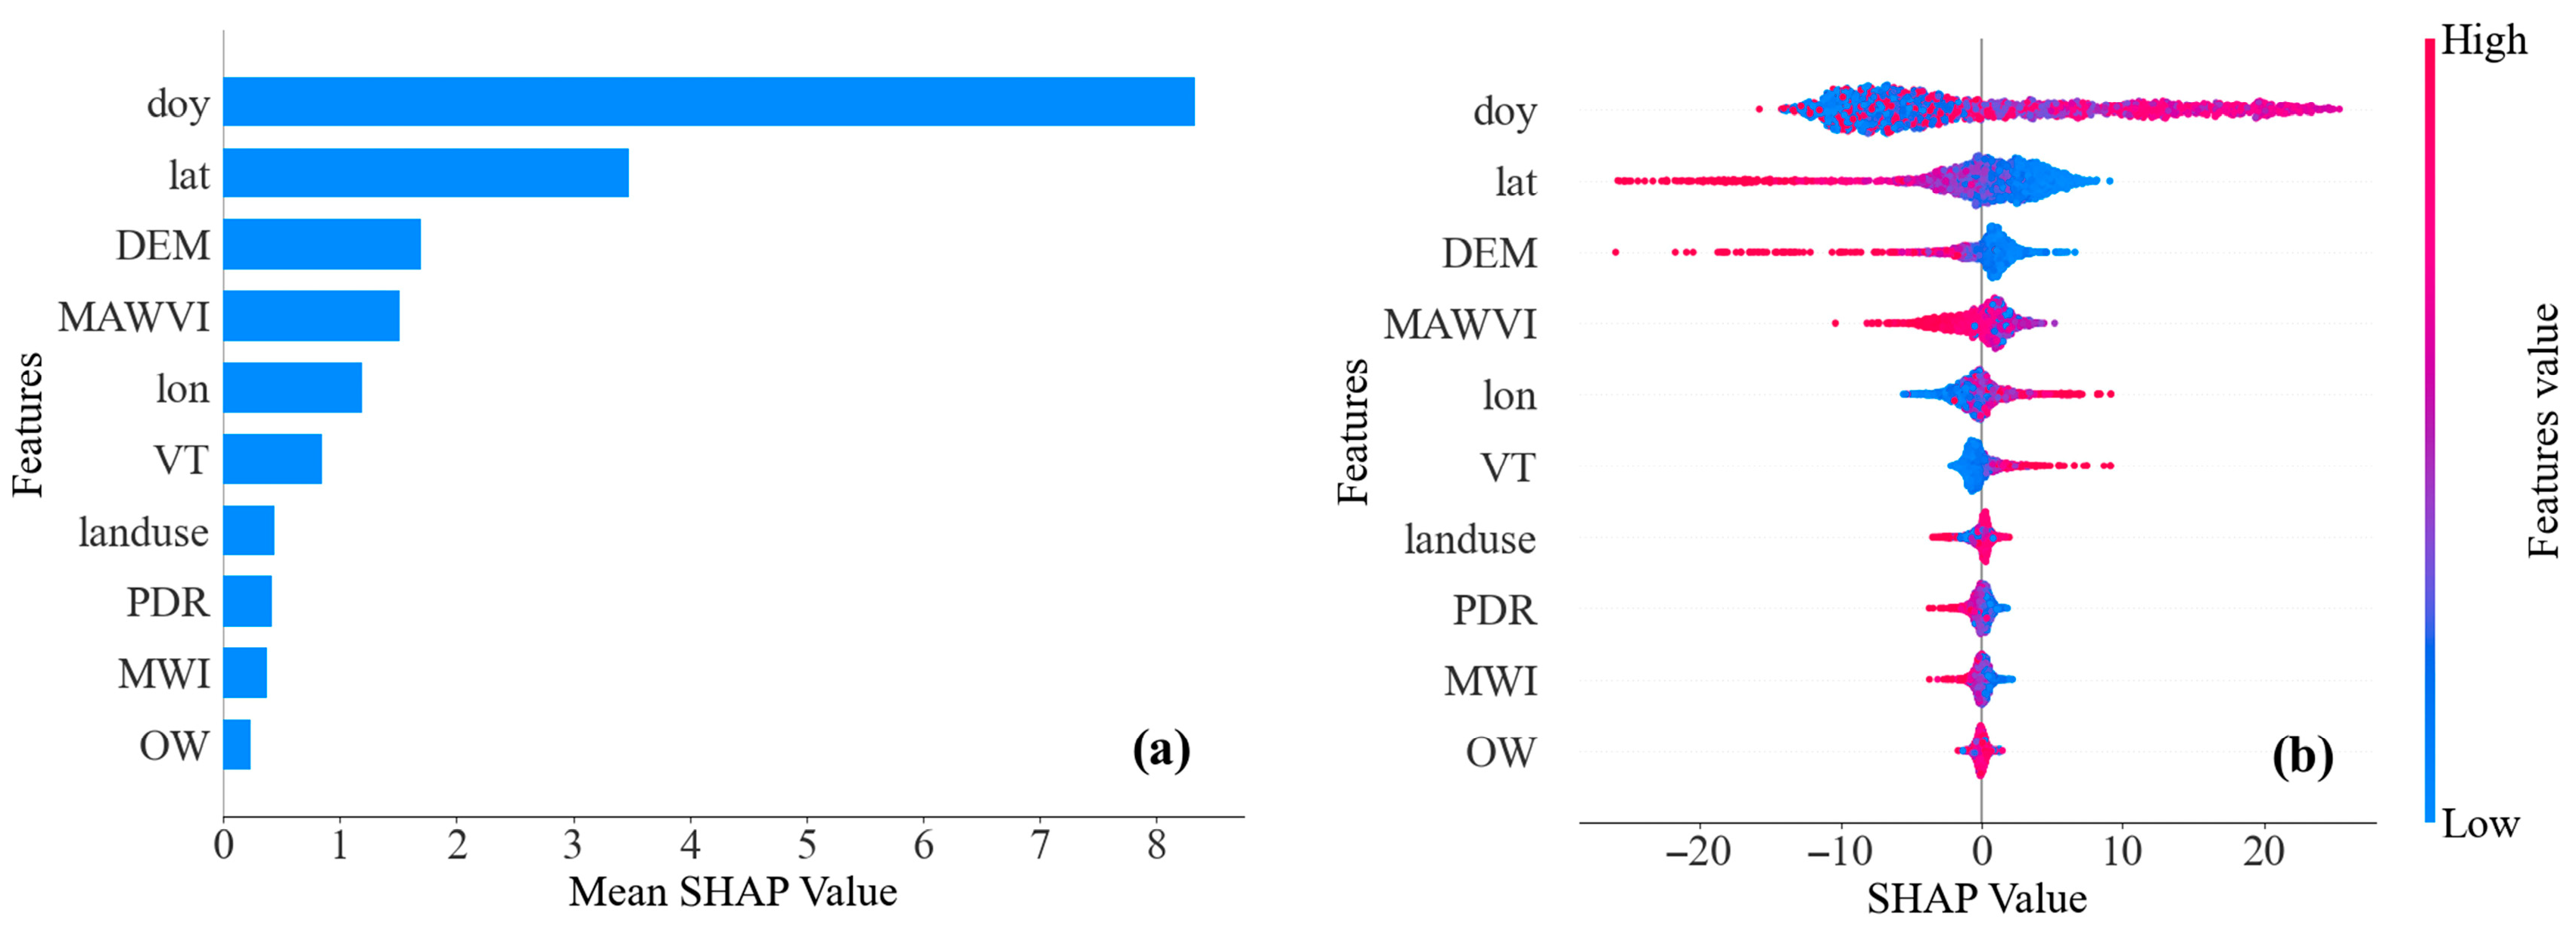
The analysis presented focuses on evaluating feature importance in predicting precipitable water vapor using several variables. Specifically, the features assessed in this study are Longitude (lon), Latitude (lat), Day of Year (doy), Vegetation Transmissivity (VT), Open Water Fraction (OW), Microwave Vegetation Index (MVI), Microwave Water Vapor Index (MAWVI), Polarization Difference Ratio89/36.5 (PDR), Digital Elevation Model (DEM), and Land Use.
Firstly, the global influence of each feature on the model output was evaluated based on the average SHAP values, as shown in Figure 5a. Among all the features, the doy feature ranked first, with a SHAP value of 8.33, accounting for 40.62% of the total SHAP value across all features. This indicates a strong correlation between the variation in water vapor and time [60]. Specifically, the concentration or distribution of water vapor exhibits significant seasonal fluctuations, closely related to changes in the seasons. The second-ranked feature is lat, with a SHAP value of 3.48, accounting for 18.79%, suggesting that the distribution of water vapor is closely related to latitude. This highlights the relationship between the macro distribution of water vapor and the distribution of climate zones [61]. Among the microwave indices derived from microwave bands, the MAWVI feature has the highest SHAP value of 1.15, accounting for 8.18%. This indicates that the microwave water vapor index can partially reflect the variation trend in water vapor concentration [26].
The SHAP scatter plot, as shown in Figure 5b, illustrates the influence of various features on the model’s output. Higher SHAP values (to the right) indicate a positive impact on the model’s prediction, while negative SHAP values (to the left) reflect a negative influence. The main negative suppressive factors are lat and DEM (with SHAP values as low as −20). This suggests that the water vapor concentration decreases with increasing latitude [62], primarily due to lower temperatures in high-latitude regions, which reduce evaporation rates [63]. Additionally, the reduced ocean coverage and changes in atmospheric circulation may also play a contributing role [64]. Water vapor decreases with increasing altitude due to lower temperatures and reduced air pressure, which limit the capacity of the air to hold moisture [65].

4.3. Validation of PWV Retrieval Products with IGRA

To further test the model’s estimated results, we performed spatiotemporal matching between the model-inverted water vapor concentration and the observed water vapor concentration from IGRA stations. The results are shown in Figure 6. The ascending and descending orbit models both achieved a correlation coefficient of 0.96 when validated against IGRA station data, indicating that both models effectively capture the all-weather distribution of atmospheric water vapor. The regression equation for the ascending orbit model is Y = 0.86X + 1.37, with a root mean square error (RMSE) of 5.65 and a mean absolute error (MAE) of 3.91, whereas the regression equation for the descending orbit model is Y = 0.87X + 1.33, with an RMSE of 5.68 and an MAE of 3.95. The slightly lower RMSE and MAE of the ascending orbit model may be attributed to the fact that the AMSR-2 satellite’s overpass time during the ascending orbit is closer to the MODIS imaging time. The Gaussian probability density of the data points is represented by a color gradient, ranging from purple (low density) to yellow (high density). Most data points are concentrated near the fitted line, indicating high consistency between the inversion results and the observed values. The deviation in the slope of the retrieved results’ regression line may originate from sensor signal saturation under extreme humidity conditions [66,67] and the inherent extrapolation limitations of tree-based models beyond the training data distribution [68]. Overall, this comparison demonstrates that the AMS2-inverted PWV results closely align with IGRA data, providing reliable estimates of atmospheric water vapor.
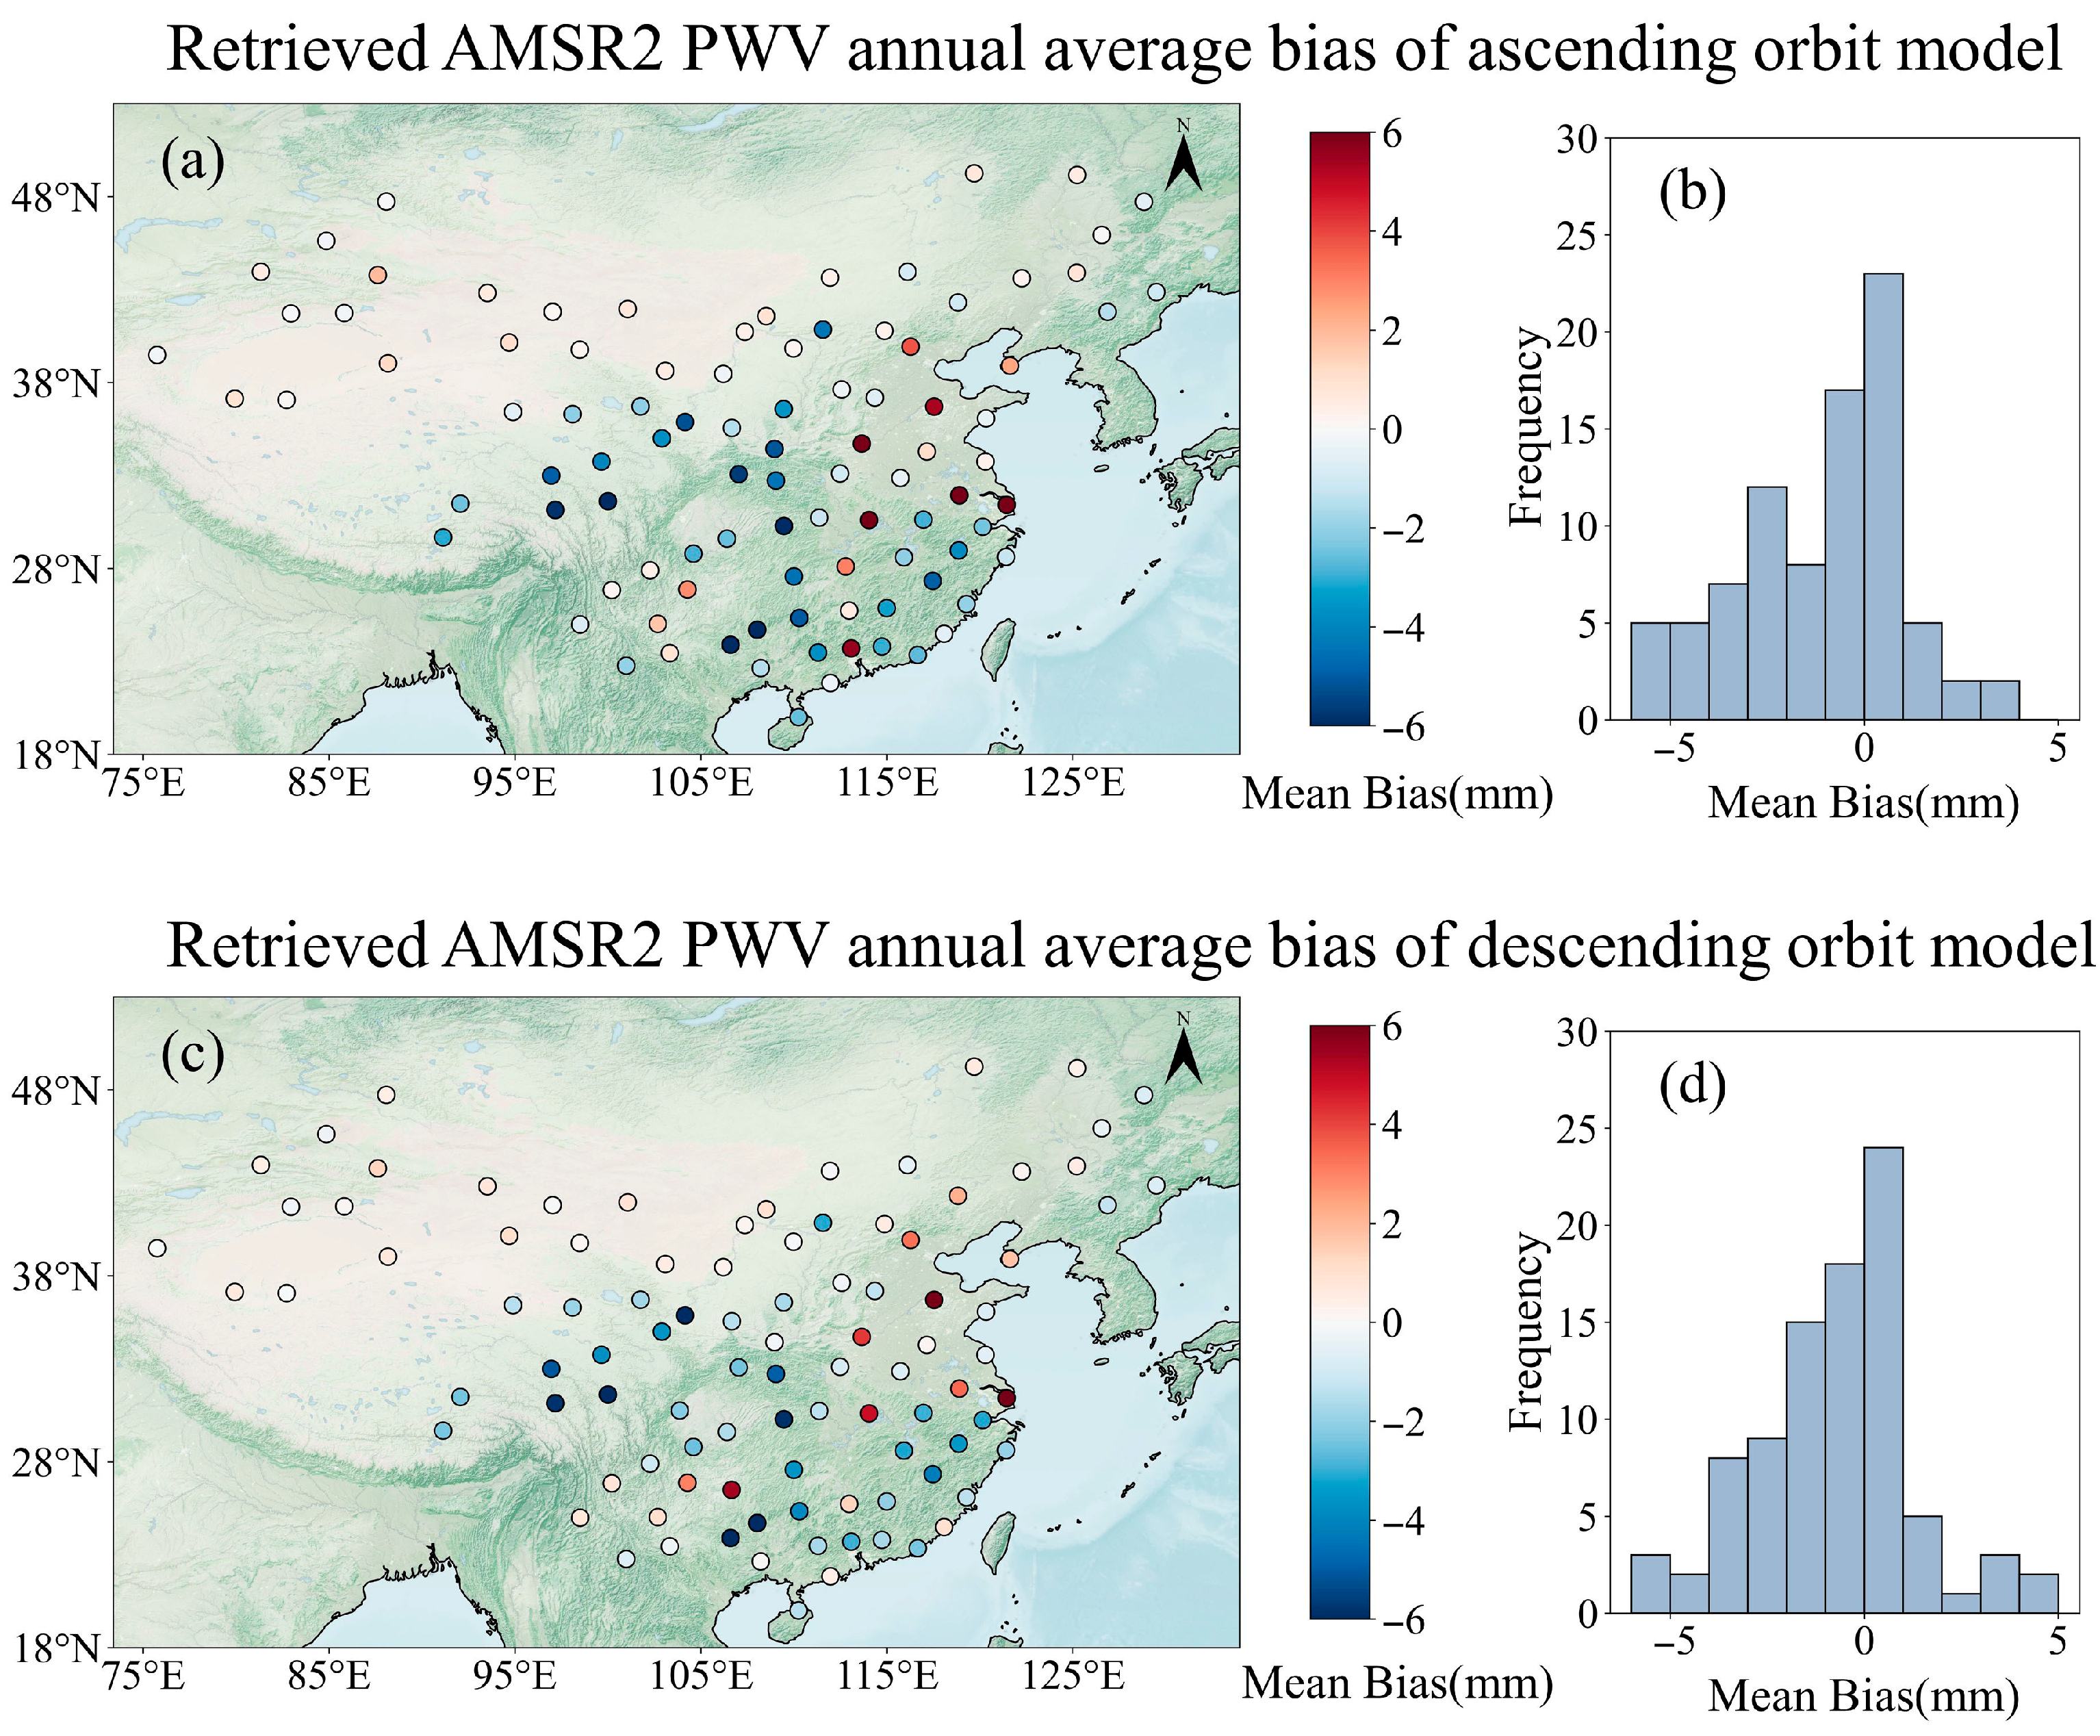
Figure 7 reveals that the mean bias of the ascending model for all stations over one year is −0.72, while the mean bias of the descending model is higher at −0.74. In terms of the spatial distribution of errors, there is a general overestimation trend in northern China, including North China, Northeast China, and Northwest China, while a general underestimation trend is observed in southern China. This phenomenon may be attributed to the higher cloud coverage in the southern regions of China [66], while cloud liquid water exerts non-negligible impacts on water vapor retrieval. Regarding the error distribution histogram of the ascending model, among the 97 stations, 23 stations have biases concentrated between 0 and 1, followed by 17 stations with errors between −1 and 0. In terms of the error distribution histogram of the descending model, 24 stations have biases concentrated between 0 and 1, followed by 18 stations with biases between −1 and 0.

4.4. PWV Retrieval Products Spatial Pattern Analysis

The first days of April, July, October, and December were selected for visualization to show the variation of water vapor across the four seasons. As shown in Figure 8, it is evident that the original MODIS water vapor data displays areas with missing values due to varying degrees of cloud contamination (Figure 8a–d), while the estimated water vapor presents spatially continuous results (Figure 8e–h). Additionally, a comparison with IGRA station data reveals that our retrieved water vapor product is in good agreement with it. Under clear-sky conditions, both products show similar spatial patterns on the same day. The spatial distribution of PWV vapor exhibits a latitudinal gradient, with lower values in high-latitude regions [67]. This is primarily attributed to (i) the temperature-dependent reduction in saturation vapor pressure, which limits the maximum moisture capacity of cold air, and (ii) suppressed surface evaporation due to limited open water and vegetation cover in these regions. In the summer and autumn seasons, the southern regions of China show high values of water vapor, primarily due to the high-temperature, high-humidity thermodynamic conditions in the region and the monsoon-driven oceanic water vapor transport [68].
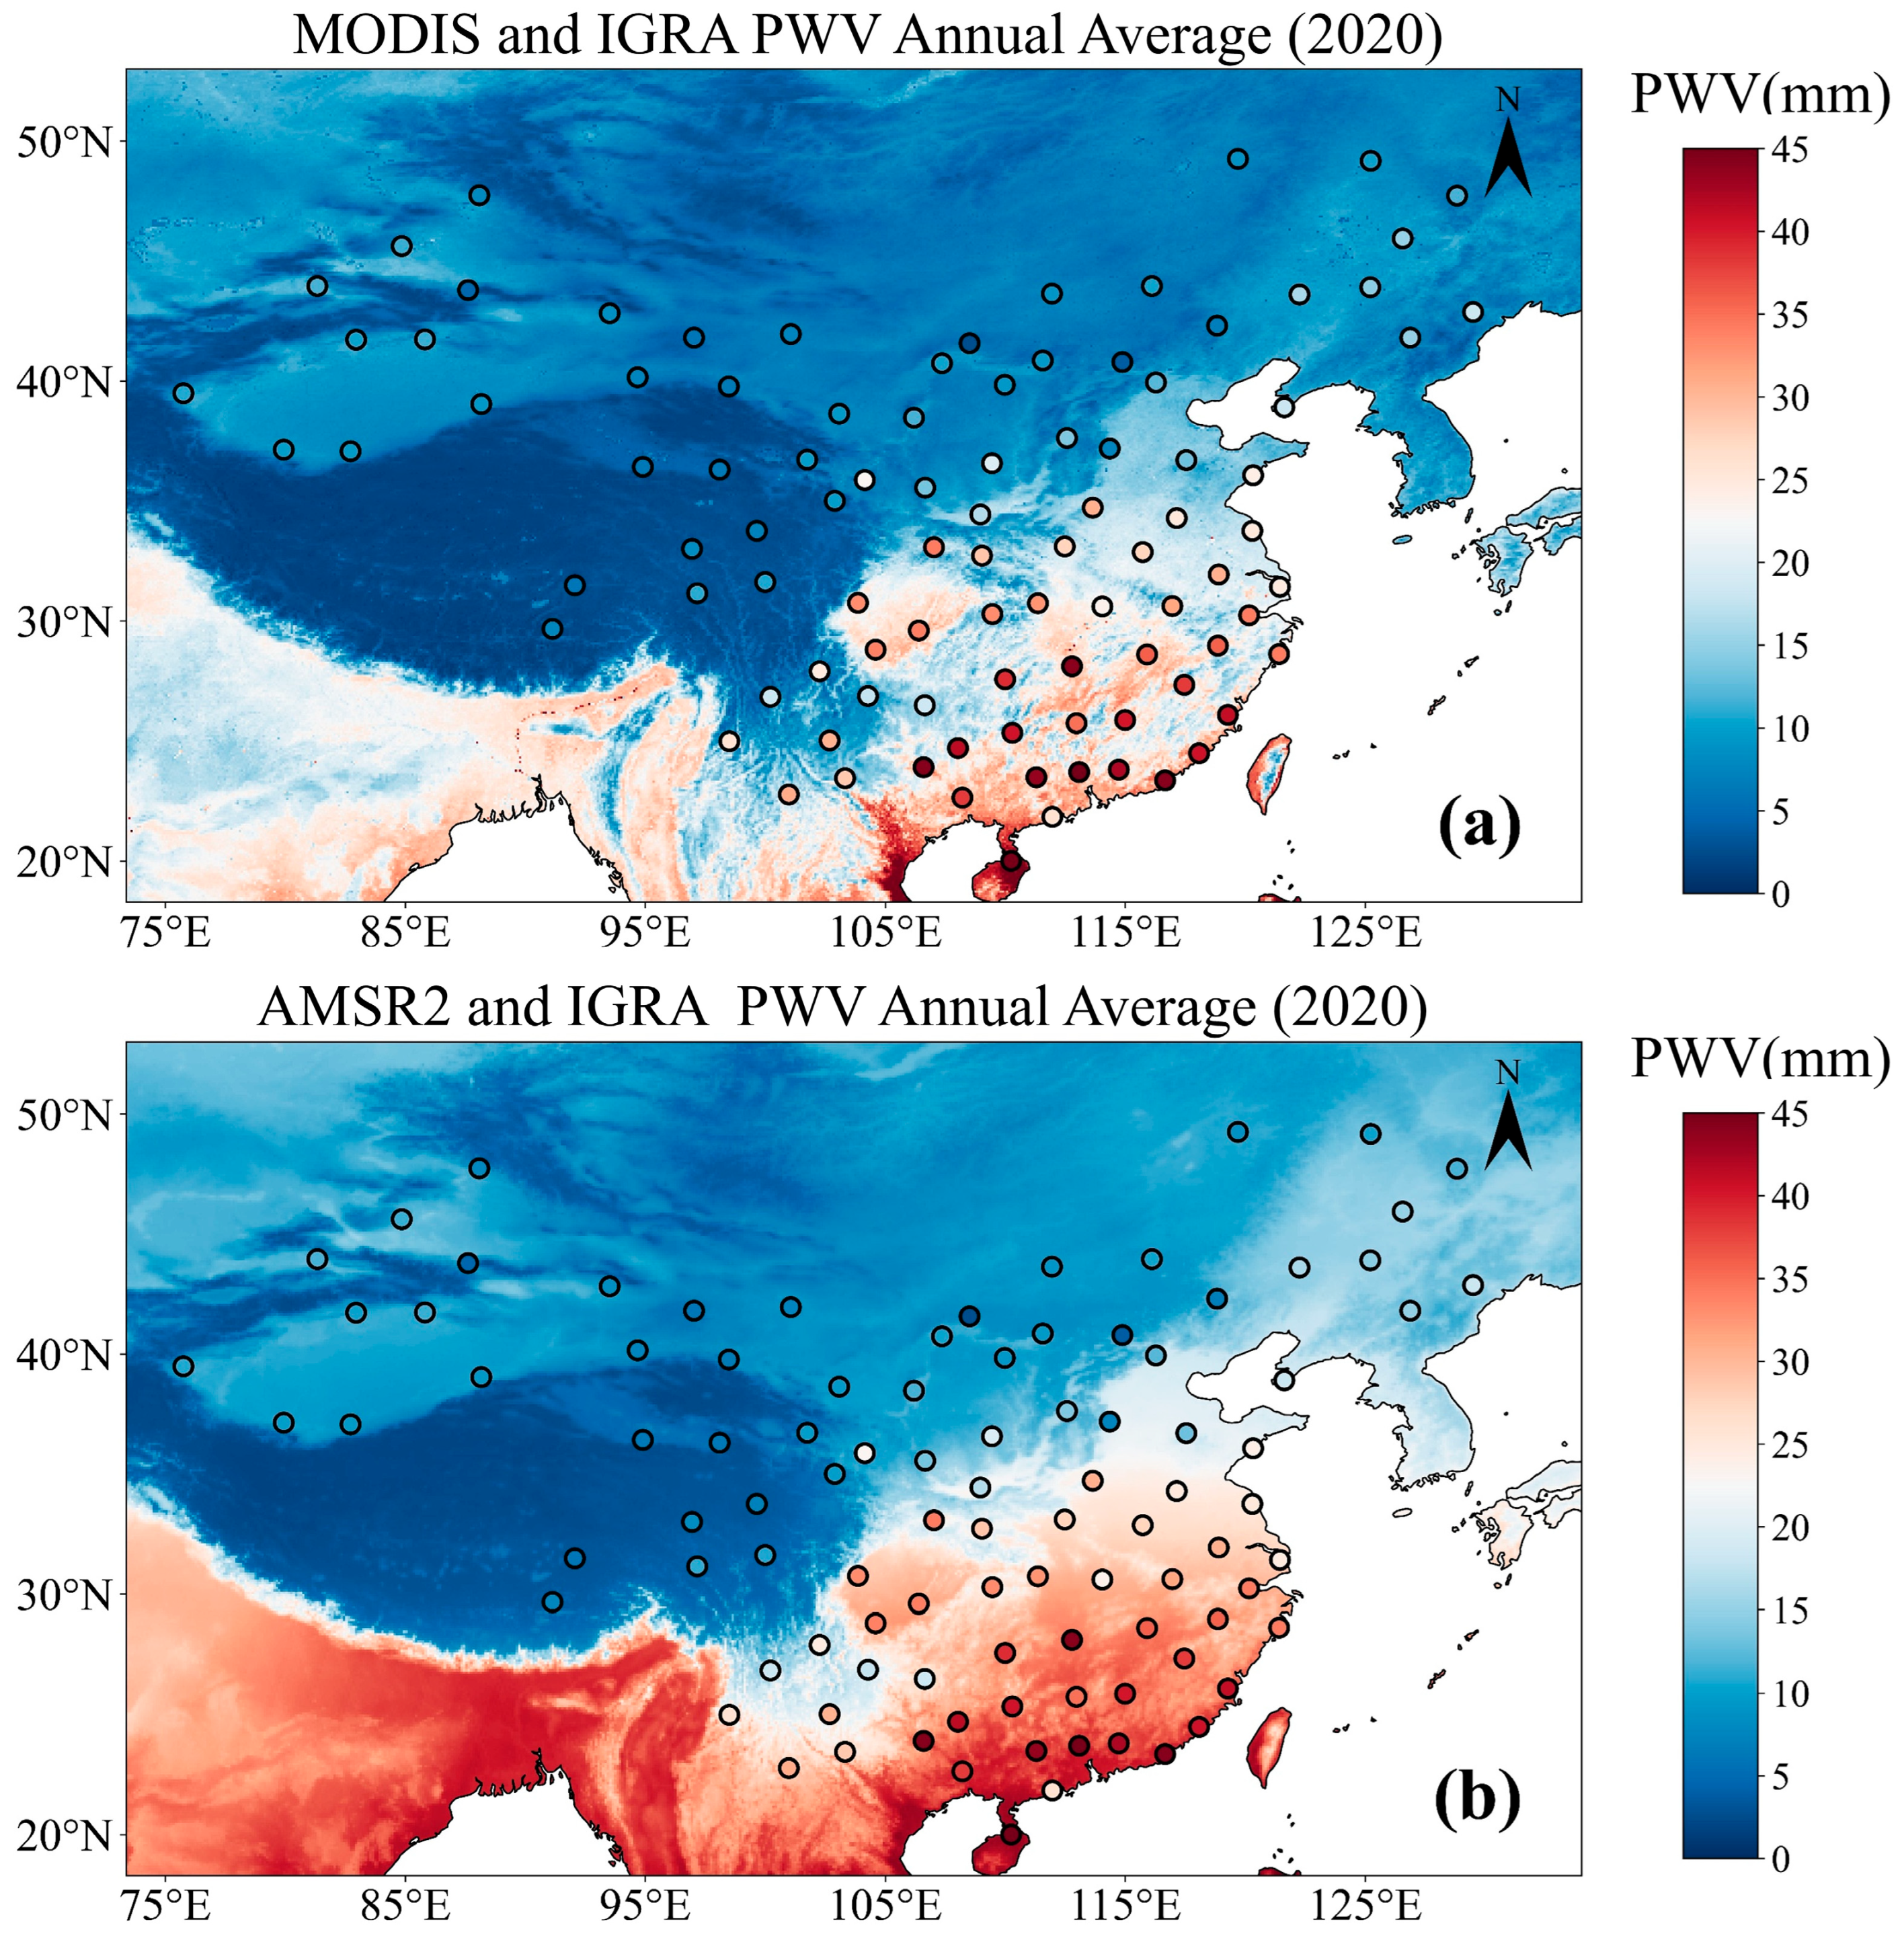
The comparison of the annual mean values of the MODIS product, the AMSR2 product derived in this study, and the IGRA station data (Figure 9) shows that both the retrieved product and IGRA data exhibit a clear latitudinal zonal distribution of water vapor, with water vapor decreasing as latitude increases. However, due to cloud contamination issues, MODIS data does not display a distinct latitudinal zonal pattern. As shown in the figure, the high-value region for water vapor in China appears in Hainan Island and the southern parts of Guangdong and Guangxi provinces. Additionally, the Sichuan Basin, due to its unique topographical features, exhibits significantly higher water vapor values compared to surrounding areas.

4.5. PWV Retrieval Products Temporal Variability Analysis

Four stations were selected from four climate zones in East Asia (subtropical monsoon climate, temperate monsoon climate, temperate continental climate, and plateau mountain climate) based on the criterion of being far from the edges of the climate zones and having sufficient IGRA observation records. Annual variation line charts of the three datasets were created, as shown in Figure 10. It can be observed that the AMSR2 product we retrieved shows a high correlation and low error levels with the data from the four stations in different climate zones. The correlation coefficients (R) for the four climate zones are as follows: subtropical monsoon climate (0.93), temperate monsoon climate (0.94), temperate continental climate (0.93), and plateau mountain climate (0.88). The two monsoon climates, due to their inherently higher water vapor concentrations, exhibit slightly larger errors compared to the other two climate zones. Specifically, for the subtropical monsoon climate station, the RMSE and MAE are 6.05 and 4.68, respectively, while for the temperate monsoon climate station, the RMSE and MAE are 5.45 and 4.11, respectively. The errors for the temperate continental climate and plateau mountain climate stations are relatively smaller, with RMSE and MAE values of 2.89 and 2.11 for the temperate continental climate, and 3.35 and 2.03 for the plateau mountain climate. Additionally, the temporal variation trend of our retrieved product is consistent with that of the IGRA station data, showing an overall increasing and then decreasing trend over time. Notably, during the summer and autumn seasons, when MODIS data is generally missing, our product still maintains good consistency with the IGRA data, demonstrating the accuracy and robustness of our algorithm.

5. Discussions

In this study, a nonlinear relationship between passive microwave band data, land surface characteristics, and MODIS products, the optimal model (ERT model) was selected from three ensemble learning models to estimate all-weather water vapor. The accuracy of the estimated all-weather water vapor is acceptable. Compared to IGRA radiosonde data, there is no significant difference between the validation results of the ascending orbit model (RMSE = 5.65 mm) and the descending orbit model (RMSE = 5.68 mm). Moreover, the cloud-free estimations are comparable to the corresponding MODIS water vapor products on both temporal and spatial scales, demonstrating high consistency. The data used in this retrieval model are all derived from publicly available satellite data, atmosphere datasets, and land surface variables, which provide a foundation for extending the proposed method to other regions. Additionally, the method exhibits high efficiency. The optimal model in this study, the ERT model, requires a training time of 359.46 s, while the full-swath inversion of AMSR-2 tile data achieves an average processing time of 16.37 s per tile. The resulting products can be utilized for short-term weather forecasting and climate change analysis.
In previous work, several algorithms have been presented to retrieve TCWV over land from satellite-sensed MW observations. These water vapor retrieval algorithms are generally categorized into radiative transfer equation-based methods [37,39] and machine learning-based methods [41,69]. The previously reported microwave-derived TCWV estimates over land exhibit overall root-mean-square errors (RMSEs) ranging from 4 mm to 6 mm when compared to ground-based reference data, with correlation coefficient (R) values between 0.85 and 0.95. Our machine learning-based retrieval model achieves comparable performance to previous methods, as indicated by similar root-mean-square error (RMSE) and correlation coefficient metrics.
However, this approach has several limitations. Firstly, MODIS water vapor products also exhibit inherent errors, which are generally larger than those obtained from ground-based station measurements [25,34,70]. This discrepancy may lead to error propagation during the processes of model construction and retrieval. Additionally, our study did not consider the effects of land surface emissivity and cloud liquid water on water vapor retrieval. In atmospheric water vapor retrieval, the characterization of land surface emissivity is crucial for distinguishing between atmospheric and terrestrial microwave signals [71]. Existing research indicates that land surface emissivity values are subject to temporal and spatial variations, and the use of fixed emissivity values introduces systematic errors in the retrieval process [72,73]. Furthermore, the presence of cloud liquid water leads to reduced accuracy in water vapor content retrieval because liquid water droplets absorb and scatter microwave radiation, potentially masking atmospheric water vapor signatures and causing overestimation of water vapor content [74]. Future work should focus on enhancing the temporal and spatial resolution of land surface emissivity data and developing improved cloud liquid water correction algorithms to improve the accuracy of retrieval algorithms.
To assess the propagation effect of target value errors during model training, we designed and conducted a series of sensitivity experiments. The MODIS infrared-derived PWV product carries a documented uncertainty of 5–10% [6]. Using the original MODIS PWV data for training and validation (Figure 11a, ascending orbit model) as our reference baseline, we systematically introduced random perturbations of +10%, +20%, and +50% to the MODIS PWV values to simulate varying levels of target value errors, subsequently retraining the model under each perturbed condition.
The validation results demonstrate relative RMSE increases of 0.71%, 1.77%, and 14.51% for the +10% (Figure 11b), +20% (Figure 11c), and +50% (Figure 11d) noise scenarios, respectively, compared to the reference case. These findings reveal two key characteristics: (1) The model’s retrieval accuracy remains virtually unaffected (with marginal error variations) when target errors fluctuate within the 10–20% range. (2) Even under substantially elevated noise levels (50%), the model maintains notable stability. This systematic evaluation confirms that our proposed remote sensing retrieval model exhibits low sensitivity to infrared PWV target value errors, demonstrating robust error tolerance capabilities.

6. Conclusions

This study developed a robust framework for estimating all-weather PWV by integrating near-infrared (NIR) and microwave (MW) satellite data with ensemble learning models. The key findings and contributions are summarized as follows:
(1)
By leveraging the complementary strengths of IR and MW data, the proposed approach addresses the limitations of traditional methods. While IR-based MODIS products suffer from cloud contamination, MW data enable cloud-penetrating capabilities, albeit at lower spatial resolution. The integration of spatiotemporal features and multi-source datasets (e.g., AMSR-2 brightness temperature, MODIS land surface variables, and ERA5 reanalysis) through ensemble learning models effectively bridges these gaps, achieving spatially continuous PWV estimates under all weather conditions.
(2)
Among the three evaluated ensemble models—Enhanced Random Trees (ERT), XGBoost, and Gradient Boosting Regression Trees (GBRT)—ERT demonstrated superior performance, achieving an R2 of 0.99, RMSE of 1.41 mm, and MAE of 0.44 mm during training. Validation against IGRA radiosonde observations confirmed high accuracy, with the ascending orbit model achieving R = 0.96 and RMSE/MAE values of 5.65/3.91, while the descending orbit model showed R = 0.95 with RMSE/MAE values of 5.68/3.95.
(3)
The retrieved PWV product exhibits a distinct latitudinal gradient and seasonal variability, aligning with physical expectations. Compared to MODIS, which suffers from cloud-induced data gaps, the proposed method provides seamless coverage, particularly in regions like southern China, where cloud cover is frequent. Temporal analysis across four East Asian climate zones further validated the model’s robustness, with correlation coefficients exceeding 0.88 and consistent seasonal trends.
In conclusion, this study advances the capability of all-weather PWV estimation by harmonizing multi-sensor data with machine learning. The framework provides a scalable solution for global atmospheric monitoring, with potential extensions to other regions and climate variables.

Author Contributions

Conceptualization, S.S.; Methodology, S.S., M.Z., and Z.T.; Validation, W.Y. and G.Z.; Visualization, H.W.; Writing—original draft, S.S. and S.J.; Writing—review and editing, D.X. All authors have read and agreed to the published version of the manuscript.

Funding

This research was funded by the Institute of Geographic Sciences and Natural Resources Research, Chinese Academy of Sciences, research grant for 2025.

Data Availability Statement

The original contributions presented in this study are included in the article. Further inquiries can be directed to the corresponding author.

Acknowledgments

This research did not receive any specific grant from funding agencies in the public, commercial, or not-for-profit sectors. We would like to express our sincere gratitude for the data support provided by the National Aeronautics and Space Administration (NASA), Google Earth Engine, and the National Oceanic and Atmospheric Administration (NOAA), whose shared data has been invaluable for our work.

Conflicts of Interest

The authors declare no conflicts of interest.

References

  1. Manabe, S.; Wetherald, R.T. Thermal Equilibrium of the Atmosphere with a Given Distribution of Relative Humidity. J. Atmos. Sci. 1967, 24, 241–259. [Google Scholar] [CrossRef]
  2. Shine, K.P.; Byrom, R.E.; Checa-Garcia, R. Separating the Shortwave and Longwave Components of Greenhouse Gas Radiative Forcing. Atmos. Sci. Lett. 2022, 23, e1116. [Google Scholar] [CrossRef]
  3. Koll, D.D.B.; Cronin, T.W. Earth’s Outgoing Longwave Radiation Linear Due to H2O Greenhouse Effect. Proc. Natl. Acad. Sci. USA 2018, 115, 10293–10298. [Google Scholar] [CrossRef]
  4. Soden, B.J.; Held, I.M. An Assessment of Climate Feedbacks in Coupled Ocean–Atmosphere Models. J. Clim. 2006, 19, 3354–3360. [Google Scholar] [CrossRef]
  5. Dessler, A.E.; Schoeberl, M.R.; Wang, T.; Davis, S.M.; Rosenlof, K.H. Stratospheric Water Vapor Feedback. Proc. Natl. Acad. Sci. USA 2013, 110, 18087–18091. [Google Scholar] [CrossRef]
  6. Hodnebrog, Ø.; Myhre, G.; Samset, B.H.; Alterskjær, K.; Andrews, T.; Boucher, O.; Faluvegi, G.; Fläschner, D.; Forster, P.M.; Kasoar, M.; et al. Water Vapour Adjustments and Responses Differ between Climate Drivers. Atmos. Chem. Phys. 2019, 19, 12887–12899. [Google Scholar] [CrossRef]
  7. Trenberth, K.E.; Fasullo, J.T.; Mackaro, J. Atmospheric Moisture Transports from Ocean to Land and Global Energy Flows in Reanalyses. J. Clim. 2011, 24, 4907–4924. [Google Scholar] [CrossRef]
  8. Huntington, T.G. Evidence for Intensification of the Global Water Cycle: Review and Synthesis. J. Hydrol. 2006, 319, 83–95. [Google Scholar] [CrossRef]
  9. Allan, R.P.; Barlow, M.; Byrne, M.P.; Cherchi, A.; Douville, H.; Fowler, H.J.; Gan, T.Y.; Pendergrass, A.G.; Rosenfeld, D.; Swann, A.L.S.; et al. Advances in Understanding Large-Scale Responses of the Water Cycle to Climate Change. Ann. N. Y. Acad. Sci. 2020, 1472, 49–75. [Google Scholar] [CrossRef]
  10. Fowler, H.J.; Lenderink, G.; Prein, A.F.; Westra, S.; Allan, R.P.; Ban, N.; Barbero, R.; Berg, P.; Blenkinsop, S.; Do, H.X.; et al. Anthropogenic Intensification of Short-Duration Rainfall Extremes. Nat. Rev. Earth Environ. 2021, 2, 107–122. [Google Scholar] [CrossRef]
  11. Papalexiou, S.M.; Montanari, A. Global and Regional Increase of Precipitation Extremes Under Global Warming. Water Resour. Res. 2019, 55, 4901–4914. [Google Scholar] [CrossRef]
  12. Dong, X.; Xi, B.; Crosby, K.; Long, C.N.; Stone, R.S.; Shupe, M.D. A 10 Year Climatology of Arctic Cloud Fraction and Radiative Forcing at Barrow, Alaska. J. Geophys. Res. Atmos. 2010, 115, D17. [Google Scholar] [CrossRef]
  13. Seemann, S.W.; Li, J.; Menzel, W.P.; Gumley, L.E. Operational Retrieval of Atmospheric Temperature, Moisture, and Ozone from MODIS Infrared Radiances. J. Appl. Meteorol. Climatol. 2003, 42, 1072–1091. [Google Scholar] [CrossRef]
  14. Hu, H.; Hasekamp, O.; Butz, A.; Galli, A.; Landgraf, J.; Aan de Brugh, J.; Borsdorff, T.; Scheepmaker, R.; Aben, I. The Operational Methane Retrieval Algorithm for TROPOMI. Atmos. Meas. Tech. 2016, 9, 5423–5440. [Google Scholar] [CrossRef]
  15. Li, Z.-L.; Tang, B.-H.; Wu, H.; Ren, H.; Yan, G.; Wan, Z.; Trigo, I.F.; Sobrino, J.A. Satellite-Derived Land Surface Temperature: Current Status and Perspectives. Remote Sens. Environ. 2013, 131, 14–37. [Google Scholar] [CrossRef]
  16. Julien, Y.; Sobrino, J.A.; Mattar, C.; Jiménez-Muñoz, J.C. Near-Real-Time Estimation of Water Vapor Column from MSG-SEVIRI Thermal Infrared Bands: Implications for Land Surface Temperature Retrieval. IEEE Trans. Geosci. Remote Sens. 2015, 53, 4231–4237. [Google Scholar] [CrossRef]
  17. King, M.D.; Kaufman, Y.J.; Menzel, W.P.; Tanre, D. Remote Sensing of Cloud, Aerosol, and Water Vapor Properties from the Moderate Resolution Imaging Spectrometer (MODIS). IEEE Trans. Geosci. Remote Sens. 1992, 30, 2–27. [Google Scholar] [CrossRef]
  18. Wang, M.; Lv, Z.; Wu, W.; Li, D.; Zhang, R.; Sun, C. Multiscale Spatiotemporal Variations of GNSS-Derived Precipitable Water Vapor over Yunnan. Remote Sens. 2024, 16, 412. [Google Scholar] [CrossRef]
  19. Zhang, Q.; Ye, J.; Zhang, S.; Han, F. Precipitable Water Vapor Retrieval and Analysis by Multiple Data Sources: Ground-Based GNSS, Radio Occultation, Radiosonde, Microwave Satellite, and NWP Reanalysis Data. J. Sens. 2018, 2018, 3428303. [Google Scholar] [CrossRef]
  20. Ding, J.; Chen, J.; Tang, W.; Song, Z. Spatial–Temporal Variability of Global GNSS-Derived Precipitable Water Vapor (1994–2020) and Climate Implications. Remote Sens. 2022, 14, 3493. [Google Scholar] [CrossRef]
  21. Vömel, H.; David, D.E.; Smith, K. Accuracy of Tropospheric and Stratospheric Water Vapor Measurements by the Cryogenic Frost Point Hygrometer: Instrumental Details and Observations. J. Geophys. Res. Atmos. 2007, 112, D8. [Google Scholar] [CrossRef]
  22. Bevis, M.; Businger, S.; Herring, T.A.; Rocken, C.; Anthes, R.A.; Ware, R.H. GPS Meteorology: Remote Sensing of Atmospheric Water Vapor Using the Global Positioning System. J. Geophys. Res. Atmos. 1992, 97, 15787–15801. [Google Scholar] [CrossRef]
  23. Bevis, M.; Businger, S.; Chiswell, S.; Herring, T.A.; Anthes, R.A.; Rocken, C.; Ware, R.H. GPS Meteorology: Mapping Zenith Wet Delays onto Precipitable Water. J. Appl. Meteorol. Climatol. 1994, 33, 379–386. [Google Scholar] [CrossRef]
  24. Kaufman, Y.J.; Gao, B.-C. Remote Sensing of Water Vapor in the near IR from EOS/MODIS. IEEE Trans. Geosci. Remote Sens. 1992, 30, 871–884. [Google Scholar] [CrossRef]
  25. Gao, B.-C.; Kaufman, Y.J. Water Vapor Retrievals Using Moderate Resolution Imaging Spectroradiometer (MODIS) near-Infrared Channels. J. Geophys. Res. Atmos. 2003, 108, D13. [Google Scholar] [CrossRef]
  26. Xia, X.; Fu, D.; Shao, W.; Jiang, R.; Wu, S.; Zhang, P.; Yang, D.; Xia, X. Retrieving Precipitable Water Vapor Over Land from Satellite Passive Microwave Radiometer Measurements Using Automated Machine Learning. Geophys. Res. Lett. 2023, 50, e2023GL105197. [Google Scholar] [CrossRef]
  27. He, J.; Liu, Z. Water Vapor Retrieval from MODIS NIR Channels Using Ground-Based GPS Data. IEEE Trans. Geosci. Remote Sens. 2020, 58, 3726–3737. [Google Scholar] [CrossRef]
  28. Susskind, J.; Blaisdell, J.M.; Iredell, L. Improved Methodology for Surface and Atmospheric Soundings, Error Estimates, and Quality Control Procedures: The Atmospheric Infrared Sounder Science Team Version-6 Retrieval Algorithm. J. Appl. Remote Sens. 2014, 8, 084994. [Google Scholar] [CrossRef]
  29. Irion, F.W.; Kahn, B.H.; Schreier, M.M.; Fetzer, E.J.; Fishbein, E.; Fu, D.; Kalmus, P.; Wilson, R.C.; Wong, S.; Yue, Q. Single-Footprint Retrievals of Temperature, Water Vapor and Cloud Properties from AIRS. Atmos. Meas. Tech. 2018, 11, 971–995. [Google Scholar] [CrossRef]
  30. Alvarado, M.J.; Payne, V.H.; Mlawer, E.J.; Uymin, G.; Shephard, M.W.; Cady-Pereira, K.E.; Delamere, J.S.; Moncet, J.-L. Performance of the Line-By-Line Radiative Transfer Model (LBLRTM) for Temperature, Water Vapor, and Trace Gas Retrievals: Recent Updates Evaluated with IASI Case Studies. Atmos. Chem. Phys. 2013, 13, 6687–6711. [Google Scholar] [CrossRef]
  31. Divakarla, M.; Gambacorta, A.; Barnet, C.; Goldberg, M.; Maddy, E.; King, T.; Wolf, W.; Nalli, N.; Zhang, K.; Xie, H. Validation of IASI Temperature and Water Vapor Retrievals with Global Radiosonde Measurements and Model Forecasts. In Proceedings of the Imaging and Applied Optics, Toronto, ON, Canada, 10–14 July 2011; Optica Publishing Group: Washington, DC, USA, 2011; p. JWA25. [Google Scholar]
  32. Feng, J.; Huang, Y. Cloud-Assisted Retrieval of Lower-Stratospheric Water Vapor from Nadir-View Satellite Measurements. J. Atmos. Ocean. Technol. 2018, 35, 541–553. [Google Scholar] [CrossRef]
  33. Wang, Y.; Shi, J.; Wang, H.; Feng, W.; Wang, Y. Physical Statistical Algorithm for Precipitable Water Vapor Inversion on Land Surface Based on Multi-Source Remotely Sensed Data. Sci. China Earth Sci. 2015, 58, 2340–2352. [Google Scholar] [CrossRef]
  34. Bai, J.; Lou, Y.; Zhang, W.; Zhou, Y.; Zhang, Z.; Shi, C. Assessment and Calibration of MODIS Precipitable Water Vapor Products Based on GPS Network over China. Atmos. Res. 2021, 254, 105504. [Google Scholar] [CrossRef]
  35. Liu, H.; Li, H.; Tang, S.; Duan, M.; Zhang, S.; Deng, X.; Hu, J. A Physical Algorithm for Precipitable Water Vapour Retrieval over Land Using Passive Microwave Observations. Int. J. Remote Sens. 2020, 41, 6288–6306. [Google Scholar] [CrossRef]
  36. Liu, Q.; Cao, C.; Grassotti, C.; Lee, Y.-K. How Can Microwave Observations at 23.8 GHz Help in Acquiring Water Vapor in the Atmosphere over Land? Remote Sens. 2021, 13, 489. [Google Scholar] [CrossRef]
  37. Du, B.; Ji, D.; Shi, J.; Wang, Y.; Lei, T.; Zhang, P.; Letu, H. The Retrieval of Total Precipitable Water over Global Land Based on FY-3D/MWRI Data. Remote Sens. 2020, 12, 1508. [Google Scholar] [CrossRef]
  38. Matzler, C.; Morland, J. Refined Physical Retrieval of Integrated Water Vapor and Cloud Liquid for Microwave Radiometer Data. IEEE Trans. Geosci. Remote Sens. 2009, 47, 1585–1594. [Google Scholar] [CrossRef]
  39. Ji, D.; Shi, J.; Xiong, C.; Wang, T.; Zhang, Y. A Total Precipitable Water Retrieval Method over Land Using the Combination of Passive Microwave and Optical Remote Sensing. Remote Sens. Environ. 2017, 191, 313–327. [Google Scholar] [CrossRef]
  40. Ji, D.; Shi, J.; Letu, H.; Li, W.; Zhang, H.; Shang, H. A Total Precipitable Water Product and Its Trend Analysis in Recent Years Based on Passive Microwave Radiometers. IEEE J. Sel. Top. Appl. Earth Obs. Remote Sens. 2021, 14, 7324–7335. [Google Scholar] [CrossRef]
  41. Xu, J.; Liu, Z. Machine Learning-Based Retrieval of Total Column Water Vapor over Land Using GMI-Sensed Passive Microwave Measurements. GIScience Remote Sens. 2024, 61, 2385180. [Google Scholar] [CrossRef]
  42. Liu, Y.; Wang, X.; Zhou, Y.; Rahman, A.U. Precipitable Water Vapor Retrieved from Fy-3g/Mwri-Rm Observations Using Machine Learning Models. Adv. Space Res. 2024, 76, 1955–1969. [Google Scholar] [CrossRef]
  43. Gao, Z.; Jiang, N.; Xu, Y.; Xu, T.; Liu, Y. Precipitable Water Vapor Retrieval Over Land from GCOM-W/AMSR2 Based on a New Integrated Method. IEEE Trans. Geosci. Remote Sens. 2022, 60, 5302912. [Google Scholar] [CrossRef]
  44. Jiang, N.; Xu, Y.; Xu, T.; Li, S.; Gao, Z. Land Water Vapor Retrieval for AMSR2 Using a Deep Learning Method. IEEE Trans. Geosci. Remote Sens. 2022, 60, 5803011. [Google Scholar] [CrossRef]
  45. Gao, Z.; Jiang, N.; Xu, Y.; Xu, T.; Zeng, R.; Guo, A.; Wu, Y. A Spatial PWV Retrieval Model Over Land for GCOM-W/AMSR2 Using Neural Network Method: A Case in the Western United States. IEEE J. Sel. Top. Appl. Earth Obs. Remote Sens. 2023, 16, 2954–2962. [Google Scholar] [CrossRef]
  46. Berg, W.; Kroodsma, R.; Kummerow, C.D.; McKague, D.S. Fundamental Climate Data Records of Microwave Brightness Temperatures. Remote Sens. 2018, 10, 1306. [Google Scholar] [CrossRef]
  47. Berg, W.; Bilanow, S.; Chen, R.; Datta, S.; Draper, D.; Ebrahimi, H.; Farrar, S.; Jones, W.L.; Kroodsma, R.; McKague, D.; et al. Intercalibration of the GPM Microwave Radiometer Constellation. J. Atmos. Ocean. Technol. 2016, 33, 2639–2654. [Google Scholar] [CrossRef]
  48. Lyapustin, A.; Wang, Y.; Korkin, S.; Huang, D. MODIS Collection 6 MAIAC Algorithm. Atmos. Meas. Tech. 2018, 11, 5741–5765. [Google Scholar] [CrossRef]
  49. Durre, I.; Vose, R.S.; Wuertz, D.B. Overview of the Integrated Global Radiosonde Archive. J. Clim. 2006, 19, 53–68. [Google Scholar] [CrossRef]
  50. Durre, I.; Vose, R.S.; Wuertz, D.B. Robust Automated Quality Assurance of Radiosonde Temperatures. J. Appl. Meteorol. Climatol. 2008, 47, 2081–2095. [Google Scholar] [CrossRef]
  51. Geurts, P.; Ernst, D.; Wehenkel, L. Extremely Randomized Trees. Mach. Learn. 2006, 63, 3–42. [Google Scholar] [CrossRef]
  52. Friedman, J.H. Greedy Function Approximation: A Gradient Boosting Machine. Ann. Stat. 2001, 29, 1189–1232. [Google Scholar] [CrossRef]
  53. Chen, T.; Guestrin, C. XGBoost: A Scalable Tree Boosting System. In Proceedings of the 22nd ACM SIGKDD International Conference on Knowledge Discovery and Data Mining, San Francisco, CA, USA, 13–17 August 2016; Association for Computing Machinery: New York, NY, USA, 2016; pp. 785–794. [Google Scholar]
  54. Jones, L.A.; Ferguson, C.R.; Kimball, J.S.; Zhang, K.; Chan, S.T.K.; McDonald, K.C.; Njoku, E.G.; Wood, E.F. Satellite Microwave Remote Sensing of Daily Land Surface Air Temperature Minima and Maxima from AMSR-E. IEEE J. Sel. Top. Appl. Earth Obs. Remote Sens. 2010, 3, 111–123. [Google Scholar] [CrossRef]
  55. Shi, J.; Jackson, T.; Tao, J.; Du, J.; Bindlish, R.; Lu, L.; Chen, K.S. Microwave Vegetation Indices for Short Vegetation Covers from Satellite Passive Microwave Sensor AMSR-E. Remote Sens. Environ. 2008, 112, 4285–4300. [Google Scholar] [CrossRef]
  56. Deeter, M.N. A New Satellite Retrieval Method for Precipitable Water Vapor over Land and Ocean. Geophys. Res. Lett. 2007, 34, 2. [Google Scholar] [CrossRef]
  57. Sun, Q.; Ji, D.; Letu, H.; Ni, X.; Zhang, H.; Wang, Y.; Li, B.; Shi, J. A Method for Estimating High Spatial Resolution Total Precipitable Water in All-Weather Condition by Fusing Satellite near-Infrared and Microwave Observations. Remote Sens. Environ. 2024, 302, 113952. [Google Scholar] [CrossRef]
  58. Lundberg, S.M.; Lee, S.-I. A Unified Approach to Interpreting Model Predictions. In Proceedings of the Proceedings of the 31st International Conference on Neural Information Processing Systems, Long Beach, CA, USA, 4–9 December 2017; Curran Associates Inc.: Red Hook, NY, USA, 2017; pp. 4768–4777. [Google Scholar]
  59. Lundberg, S.M.; Erion, G.G.; Lee, S.-I. Consistent Individualized Feature Attribution for Tree Ensembles. arXiv 2019, arXiv:1802.03888. [Google Scholar]
  60. Tu, J.; Lu, E. Relative Importance of Water Vapor and Air Temperature in the Interannual Variation of the Seasonal Precipitation: A Comparison of the Physical and Statistical Methods. Clim. Dyn. 2020, 54, 3655–3670. [Google Scholar] [CrossRef]
  61. Kelsey, V.; Riley, S.; Minschwaner, K. Atmospheric Precipitable Water Vapor and Its Correlation with Clear-Sky Infrared Temperature Observations. Atmos. Meas. Tech. 2022, 15, 1563–1576. [Google Scholar] [CrossRef]
  62. Allan, R.P.; Willett, K.M.; John, V.O.; Trent, T. Global Changes in Water Vapor 1979–2020. J. Geophys. Res. Atmos. 2022, 127, e2022JD036728. [Google Scholar] [CrossRef]
  63. Zhang, Y.; Ma, N.; Park, H.; Walsh, J.E.; Zhang, K. Evaporation Processes and Changes Over the Northern Regions. In Arctic Hydrology, Permafrost and Ecosystems; Yang, D., Kane, D.L., Eds.; Springer International Publishing: Cham, Switzerland, 2021; pp. 101–131. ISBN 978-3-030-50930-9. [Google Scholar]
  64. Piao, J.; Chen, W.; Chen, S.; Gong, H.; Zhang, Q. Summer Water Vapor Sources in Northeast Asia and East Siberia Revealed by a Moisture-Tracing Atmospheric Model. J. Clim. 2020, 33, 3883–3899. [Google Scholar] [CrossRef]
  65. Lou, H.; Zhang, J.; Yang, S.; Cai, M.; Ren, X.; Luo, Y.; Li, C. Exploring the Relationships of Atmospheric Water Vapor Contents and Different Land Surfaces in a Complex Terrain Area by Using Doppler Radar. Atmosphere 2021, 12, 528. [Google Scholar] [CrossRef]
  66. Yang, Y.; Zhao, C.; Fan, H. Spatiotemporal Distributions of Cloud Properties over China Based on Himawari-8 Advanced Himawari Imager Data. Atmos. Res. 2020, 240, 104927. [Google Scholar] [CrossRef]
  67. Meza, A.; Mendoza, L.; Natali, M.P.; Bianchi, C.; Fernández, L. Diurnal Variation of Precipitable Water Vapor over Central and South America. Geod. Geodyn. 2020, 11, 426–441. [Google Scholar] [CrossRef]
  68. Chu, Q.; Wang, Q.; Feng, G.; Jia, Z.; Liu, G. Roles of Water Vapor Sources and Transport in the Intraseasonal and Interannual Variation in the Peak Monsoon Rainfall over East China. Clim. Dyn. 2021, 57, 2153–2170. [Google Scholar] [CrossRef]
  69. Du, J.; Kimball, J.S.; Jones, L.A. Satellite Microwave Retrieval of Total Precipitable Water Vapor and Surface Air Temperature Over Land from AMSR2. IEEE Trans. Geosci. Remote Sens. 2015, 53, 2520–2531. [Google Scholar] [CrossRef]
  70. Martins, V.S.; Lyapustin, A.; Wang, Y.; Giles, D.M.; Smirnov, A.; Slutsker, I.; Korkin, S. Global Validation of Columnar Water Vapor Derived from EOS MODIS-MAIAC Algorithm against the Ground-Based AERONET Observations. Atmos. Res. 2019, 225, 181–192. [Google Scholar] [CrossRef]
  71. Aires, F.; Prigent, C.; Rossow, W.B.; Rothstein, M. A New Neural Network Approach Including First Guess for Retrieval of Atmospheric Water Vapor, Cloud Liquid Water Path, Surface Temperature, and Emissivities over Land from Satellite Microwave Observations. J. Geophys. Res. Atmos. 2001, 106, 14887–14907. [Google Scholar] [CrossRef]
  72. Prakash, S.; Norouzi, H.; Azarderakhsh, M.; Blake, R.; Prigent, C.; Khanbilvardi, R. Estimation of Consistent Global Microwave Land Surface Emissivity from AMSR-E and AMSR2 Observations. J. Appl. Meteorol. Climatol. 2018, 57, 907–919. [Google Scholar] [CrossRef]
  73. Xu, R.; Pan, Z.; Han, Y.; Zheng, W.; Wu, S. Surface Properties of Global Land Surface Microwave Emissivity Derived from FY-3D/MWRI Measurements. Sensors 2023, 23, 5534. [Google Scholar] [CrossRef] [PubMed]
  74. Turner, D.D.; Clough, S.A.; Liljegren, J.C.; Clothiaux, E.E.; Cady-Pereira, K.E.; Gaustad, K.L. Retrieving Liquid Wat0er Path and Precipitable Water Vapor from the Atmospheric Radiation Measurement (ARM) Microwave Radiometers. IEEE Trans. Geosci. Remote Sens. 2007, 45, 3680–3690. [Google Scholar] [CrossRef]
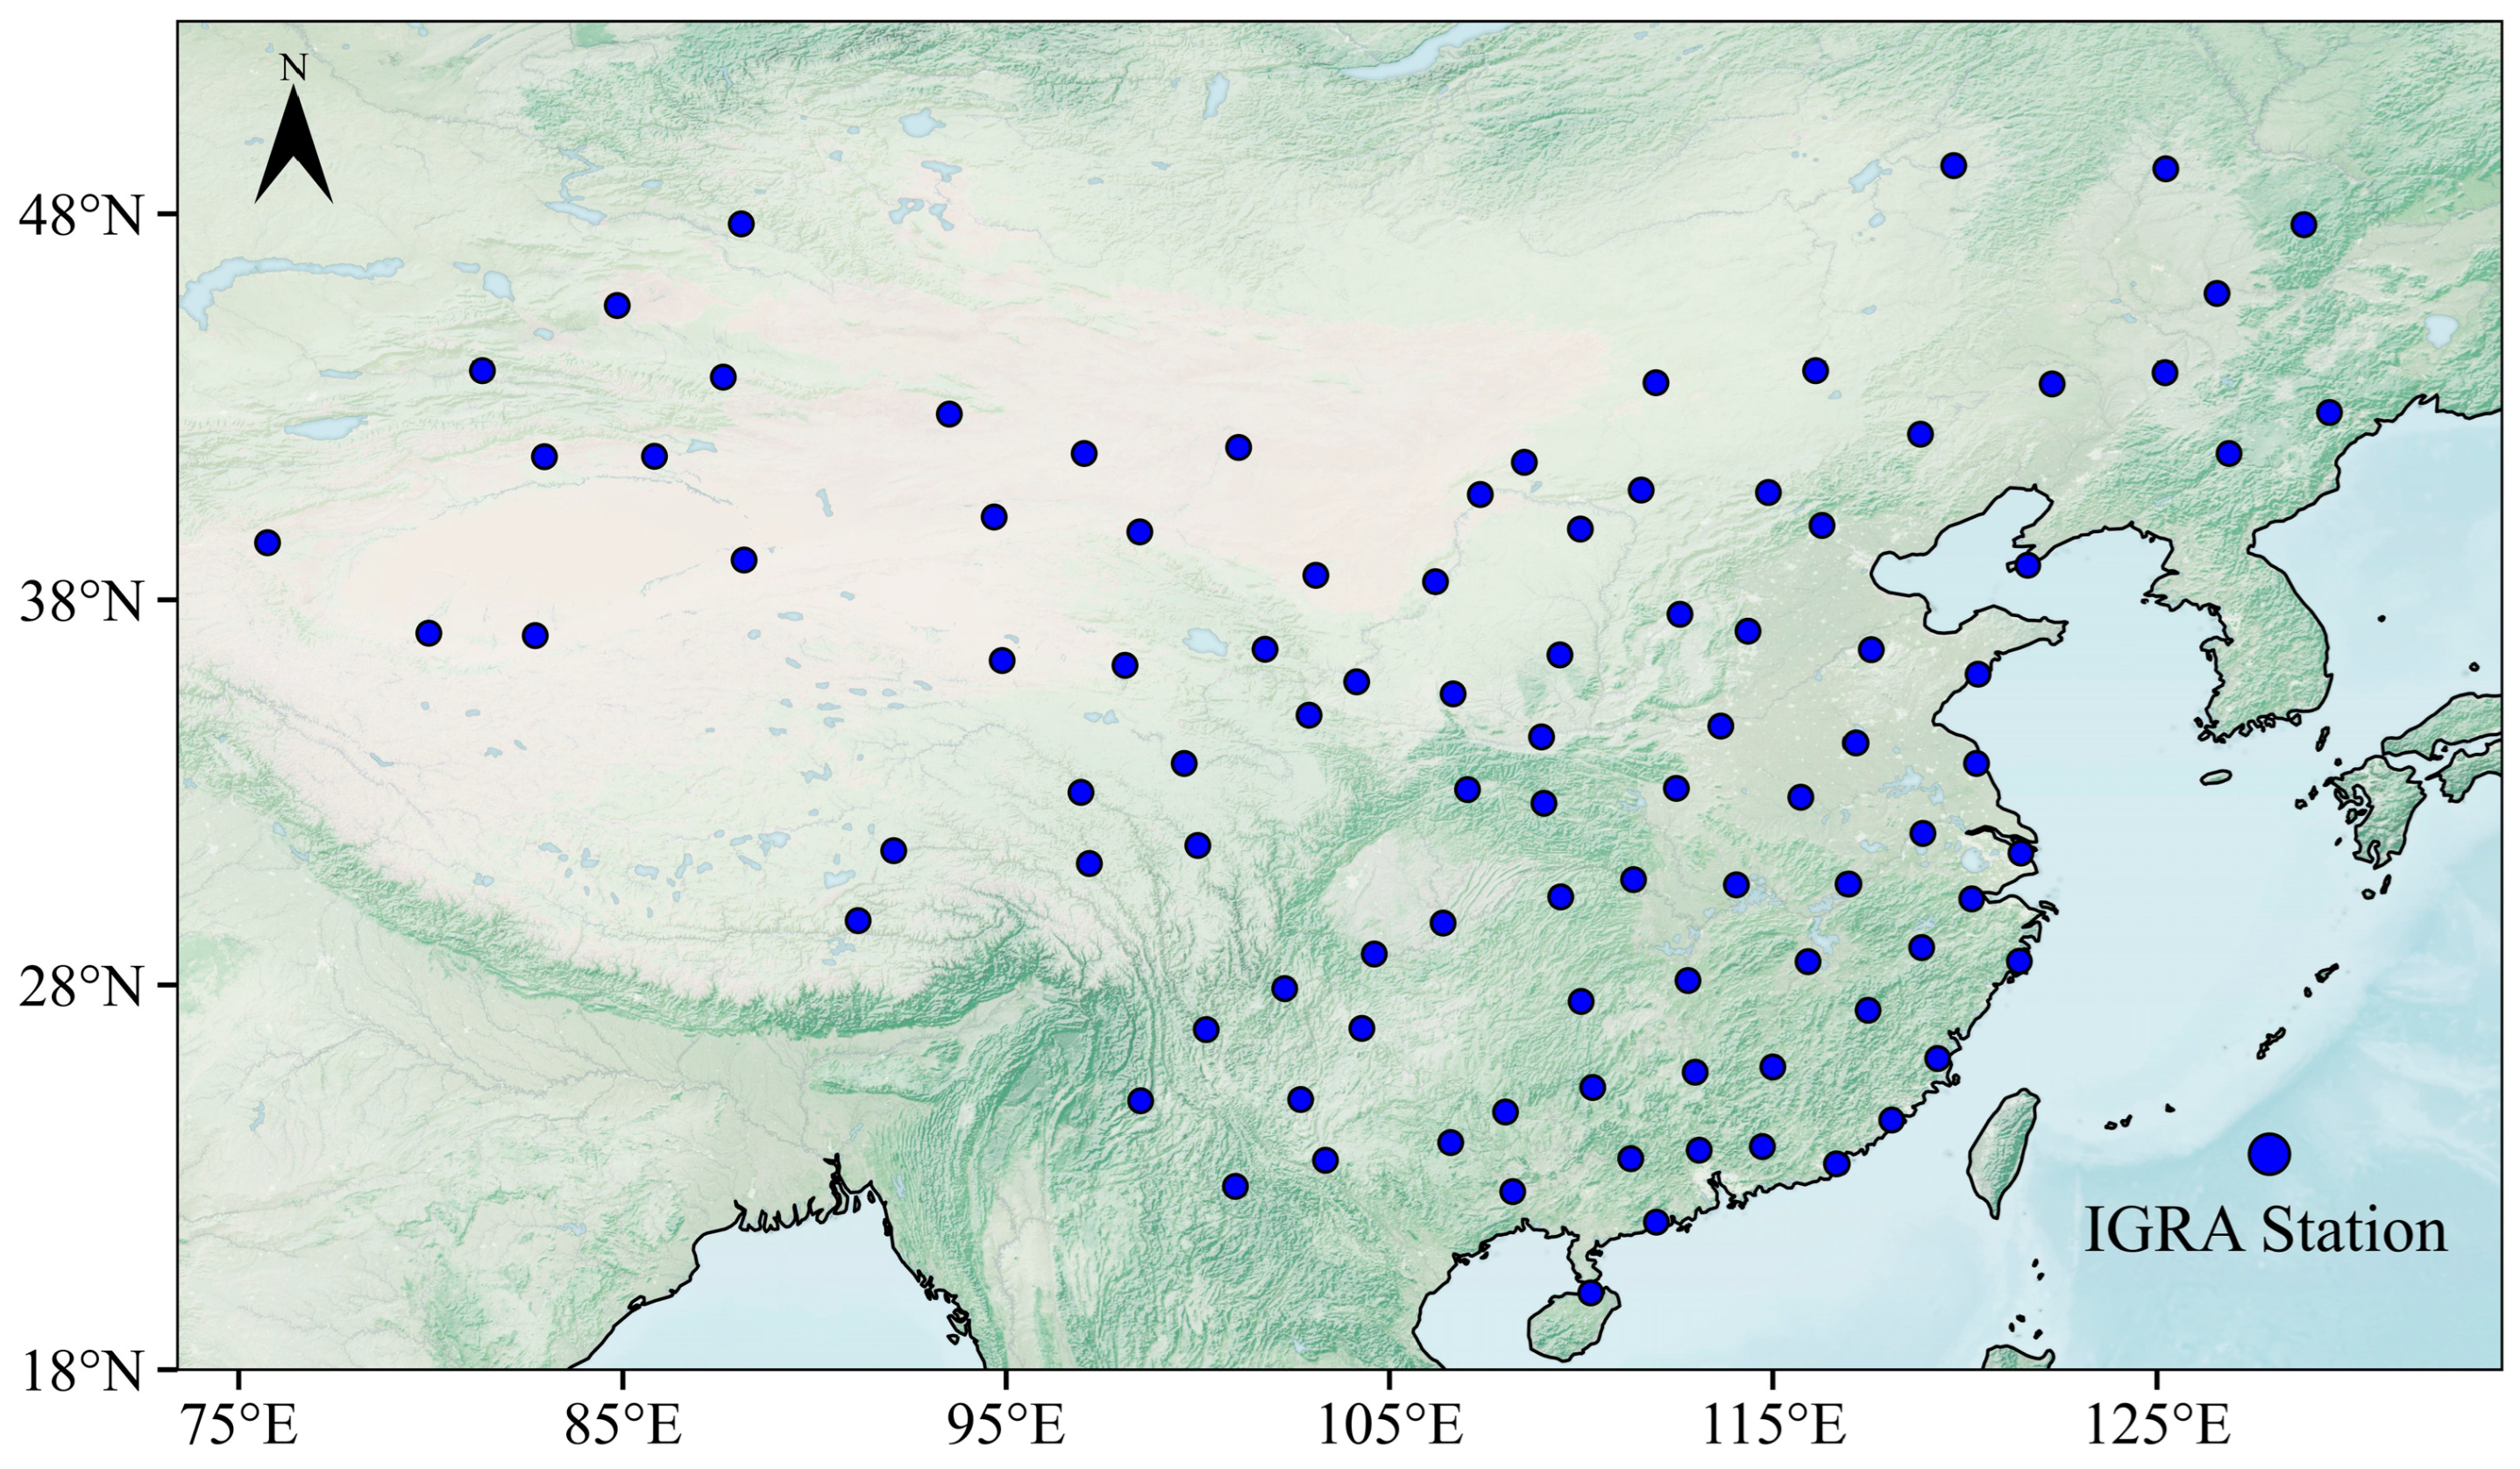
Figure 1. Spatial distribution of IGRA stations in the study area.
Remotesensing 17 02730 g001
Figure 2. Flowchart of the process to estimate all-weather PWV.
Remotesensing 17 02730 g002
Figure 3. Histogram of PWV value distribution: (a) before data balancing and (b) after data balancing.
Remotesensing 17 02730 g003
Figure 4. Evaluation metrics of three ensemble learning models: (a) ERT, (b) XGBoost, (c) GBRT.
Remotesensing 17 02730 g004
Figure 5. SHAP values of all features: (a) mean SHAP value across all samples, (b) SHAP values for individual samples.
Remotesensing 17 02730 g005
Figure 6. Validation of estimated PWV over IGRA PWV: (a) ascending orbit model, (b) descending orbit model.
Remotesensing 17 02730 g006
Figure 7. Annual average bias spatial distribution and frequency histogram: (a) ascending orbit model bias spatial distribution, (b) frequency histogram of ascending orbit bias, (c) descending orbit model bias spatial distribution, (d) frequency histogram of descending orbit bias.
Remotesensing 17 02730 g007
Figure 8. Spatial distribution of precipitable water vapor from MODIS (ad) and AMSR-2 (eh) on 20200401, 20200701, 20201001, and 20201201.
Remotesensing 17 02730 g008
Figure 9. Spatial distribution of PWV annual average: (a) MODIS and IGRA PWV, (b) AMSR2 and IGRA PWV.
Remotesensing 17 02730 g009
Figure 10. Time series for IGRA (red line), AMSR-2 (blue line), and MODIS (green line) PWV in different climate zones. The latitude and longitude of the stations are (a) 25.87°N, 105.0°E; (b) 33.1°N, 112.48°E; (c) 45.62°N, 84.85°E; and (d) 36.42°N, 94.9°E.
Remotesensing 17 02730 g010
Figure 11. Sensitivity analysis of PWV retrieval to target value errors: (a) reference model performance using original MODIS PWV data (ascending orbit), (bd) retrieval results with +10%, +20%, and +50% artificial noise perturbations, respectively.
Remotesensing 17 02730 g011
Table 1. Datasets used in this study.
DatasetsTemporal ResolutionSpatial ResolutionData Sources
Band datasetsAMSR2 Microwave Brightness Temperature1.5 h10 kmNational Aeronautics and Space Administration Earth Data
Atmosphere datasetsMODIS MCD19A2 PWV1 day1 kmGoogle Earth Engine
IGRA Radiosondeday-National Oceanic and Atmospheric Administration National Centers for Environmental Information
Land surface datasetsMODIS Land use1 year500 mGoogle Earth Engine
NOAA DEM-1 kmSame as IGRA Radiosonde
Table 2. Features used in this study.
Feature ClassFeature NameFormulaTemporal
Resolution
Spatial
Resolution
Explanation
Spatiotemporal featuresLonLongitude//Longitude of each location
LatLatitude//Latitude of each location
Doy (Day of the year) N o w D a t e F i r s t D a t e + 1 //Doy of each location
Microwave band featuresVT (Vegetation Transmissivity) T B 23.8 H T B 18.7 H 1.5 h10 kmDetermining vegetable transmissivity [54]
OW (Open Water Fraction) T B 18.7 H T B 18.7 V Sensitive to open water [54]
MVI (Microwave Vegetable Index) T B 18.7 V T B 18.7 H T B 10.7 V T B 10.7 H Sensitive to surface vegetable [55]
MAWVI (Microwave Water Vapor Index) T B 23.8 V T B 23.8 H T B 18.7 V T B 18.7 H Sensitive to water vapor in atmosphere [56]
PDR89/36.5 B 89 V B 89 H B 36.5 V B 36.5 H Sensitive to water vapor in atmosphere [57]
Other featuresDEM//1 kmAffecting the path of the microwave signal
Land use/year500 mDistinguish different surface types
Table 3. Parameters of three models.
Parametersn_estimatorsmax_depthmin_samples_splitmin_samples_leaf Gamma
Models
ERT54011159/
XGBoost6101317/0.2
GBRT57014127/
Disclaimer/Publisher’s Note: The statements, opinions and data contained in all publications are solely those of the individual author(s) and contributor(s) and not of MDPI and/or the editor(s). MDPI and/or the editor(s) disclaim responsibility for any injury to people or property resulting from any ideas, methods, instructions or products referred to in the content.