Abstract
Computer vision techniques such as three-dimensional digital image correlation (3D-DIC) and three-dimensional point tracking (3D-PT) have demonstrated broad applicability for monitoring the conditions of large-scale engineering systems by reconstructing and tracking dynamic point clouds corresponding to the surface of a structure. Accurate stereophotogrammetry measurements require the stereo cameras to be calibrated to determine their intrinsic and extrinsic parameters by capturing multiple images of a calibration object. This image-based approach becomes cumbersome and time-consuming as the size of the tested object increases. To streamline the calibration and make it scale-insensitive, a multi-sensor system embedding inertial measurement units and a laser sensor is developed to compute the extrinsic parameters of the stereo cameras. In this research, the accuracy of the proposed sensor-based calibration method in performing stereophotogrammetry is validated experimentally and compared with traditional approaches. Tests conducted at various scales reveal that the proposed sensor-based calibration enables reconstructing both static and dynamic point clouds, measuring displacements with an accuracy higher than 95% compared to image-based traditional calibration, while being up to an order of magnitude faster and easier to deploy. The novel approach has broad applications for making static, dynamic, and deformation measurements to transform how large-scale structural health monitoring can be performed.
1. Introduction
Computer vision has gained significant traction in the structural health monitoring (SHM) community due to its inherent advantages over traditional contact-based methods [1,2,3]. Stereophotogrammetry techniques, such as three-dimensional digital image correlation (3D-DIC) and three-dimensional point tracking (3D-PT), offer measurement accuracy comparable to conventional sensors, like accelerometers and strain gauges, while providing full-field, line-of-sight displacement and strain data [4,5]. These techniques have been successfully applied across a range of engineering applications, including monitoring of bridge components [6,7,8], railways [9], and wind turbine blades [10,11,12]. In addition, they have proven valuable for system identification [13,14] and structural dynamics measurements [15]. Notably, 3D-DIC has also been used for damage detection in both small-scale laboratory settings [16] and large-scale structural tests [17], highlighting its versatility as a tool for both SHM and nondestructive testing (NDT).
Three-dimensional-DIC and 3D-PT measure the three-dimensional positions and displacements of points on a structure’s surface by analyzing their two-dimensional projections on the image planes of two synchronized stereo cameras [18]. Through triangulation, these projections are used to reconstruct dynamic 3D point clouds that capture the motion and deformation of the targeted structure. Traditionally, accurate reconstruction requires stereo camera calibration to determine both intrinsic parameters (e.g., image center, focal length, and distortion coefficients) and extrinsic parameters (i.e., relative position and orientation between the cameras). Calibration is typically performed by capturing multiple images of a calibration object with known spatial arrangements of optical targets [19]. For the calibration to be meaningful, the dimensions of the calibration object must be comparable to the size of the structure under observation.
This requirement poses minimal challenges for small fields of view (FOVs), typically less than 2 m × 2 m, where calibration can be completed in approximately 30 min using commercially available targets. However, for larger-scale applications, such as the 7 m × 7 m FOV described in [10], calibration demands custom-built targets and can require several hours of labor. Furthermore, because the calibration is highly sensitive to any change in the stereo cameras’ positions, the cameras must remain fixed post-calibration, typically mounted on rigid bars or fixed tripods to prevent shifts. These limitations, particularly the scale-dependent nature of the calibration process and the reliance on bulky, rigid mounting setups, significantly reduce the practicality of using 3D-DIC and 3D-PT for structural health monitoring of large-scale infrastructure, such as utility-scale wind turbines, bridges, buildings, and dams [20].
To address the challenges associated with traditional stereo camera calibration, researchers have developed alternative methods that are more efficient and user-friendly. These approaches include using a single image of multi-planar [21] or cylindrical [22] calibration objects, capturing multiple images of a rigid scale bar [23], measuring phase shifts from active-phase targets [24,25], and relying on the detection of single feature points [26]. Recent advancements in camera calibration have explored both hardware- and software-based innovations. On the hardware side, collimator systems have been increasingly used in calibration for both conventional cameras [27] and event-based cameras [28]. Another hardware-oriented approach involves the use of carefully positioned mirrors to split a single camera’s perspective into two distinct views [29]. In parallel, several alternative calibration strategies have focused on software improvements. These include methods such as multivariate quadratic regression [30], imposing planar constraints on the calibration target [31], and enhancing the optimization algorithms used to solve the calibration problem [32,33]. With the growing adoption of neural networks and deep learning, learning-based methods have also been employed for camera calibration. For instance, graph neural networks were explored for computing homography in [34], while multi-scale transformers were used to reconstruct camera parameters in [35]. In the context of stereo vision systems, both deep learning-based methods [36] and end-to-end convolutional neural network architectures [37] have been investigated.
However, these alternative methods still inherit key limitations of traditional image-based calibration, such as the need to capture new calibration images whenever the cameras are repositioned. One strategy to address this issue involves decoupling the intrinsic and extrinsic calibration processes. This allows for intrinsic parameters to be determined using smaller, more manageable calibration objects, while extrinsic parameters can be computed separately using onboard sensors, such as inertial measurement units (IMUs). This decoupling significantly accelerates the recalibration process when cameras are moved. When applied to stereophotogrammetry, IMU-based methods typically require either (1) an additional calibration object to establish a scale factor [38,39] or (2) a planar camera configuration [40]. A more advanced approach integrates multiple sensors, such as IMUs and radar to estimate extrinsic parameters [41,42]. However, the use of radar introduces limitations in accurately localizing the second camera. To overcome this, an enhanced system was proposed that replaces radar with an additional IMU-laser assembly [43]. Yet, this system’s accuracy and performance were only demonstrated analytically and within the context of a small-scale, two-dimensional field of view (FOV) [44].
It is important to note that while the work presented in [44] makes a valuable contribution by establishing a mathematical framework and demonstrating, through analytical simulations, that the method can achieve subpixel accuracy even in the presence of sensor noise, the current research significantly advances this foundation. Specifically, this study provides comprehensive experimental validation of the sensor-based calibration method across a range of structural health monitoring (SHM) scenarios. This work demonstrates not only the scalability and practical feasibility of the method but also quantifies its accuracy as a robust and efficient alternative to traditional calibration techniques for real-world SHM applications. Experimental results show that the proposed method achieves displacement and dynamic response measurements within 5% of traditional techniques, regardless of the size of the tested fields of view (FOVs). Moreover, this is the first study to experimentally evaluate the accuracy of the proposed sensor-based calibration for both in-plane and out-of-plane displacements, as well as for the full 3D dynamic response of a target structure. The results indicate a measurement accuracy exceeding 95% compared to those obtained using conventional calibration methods, while offering several distinct advantages:
- (1)
- Elimination of the requirements for calibration targets of comparable size with the considered FOV (thanks to the separation between intrinsic and extrinsic parameters);
- (2)
- Insensitivity to the size of the FOV, resulting in the calibration procedure taking a fixed amount of time regardless of the camera baseline; and
- (3)
- Elimination of the requirement to use a camera bar (thanks to the possibility of a fast recalibration when cameras are moved around).
2. Principles of Stereo Camera Calibration
This section summarizes the mathematical framework underlying stereo camera calibration and discusses its application within the proposed sensor-based calibration method.
2.1. The Pinhole Camera Model
Photogrammetry is based on the pinhole camera model [45], where the 3D coordinates of a point, P = (Px, Py, Pz), in the global frame of reference, W, are converted into the 2D coordinates of a point, p = (pu, pv), in the camera’s retinal plane using the following:
where θ is the cameras’ skew factor; fx and fy are the scaled focal lengths in pixels in X; Y, cx, and cy are the coordinates of the image center; Rij is the components of the rotation matrix R; and Ti is the components of the translation vector T [46]. These parameters can be combined into a 3 × 3 intrinsic parameter matrix, A, and a 3 × 4 extrinsic parameter matrix, R|T.
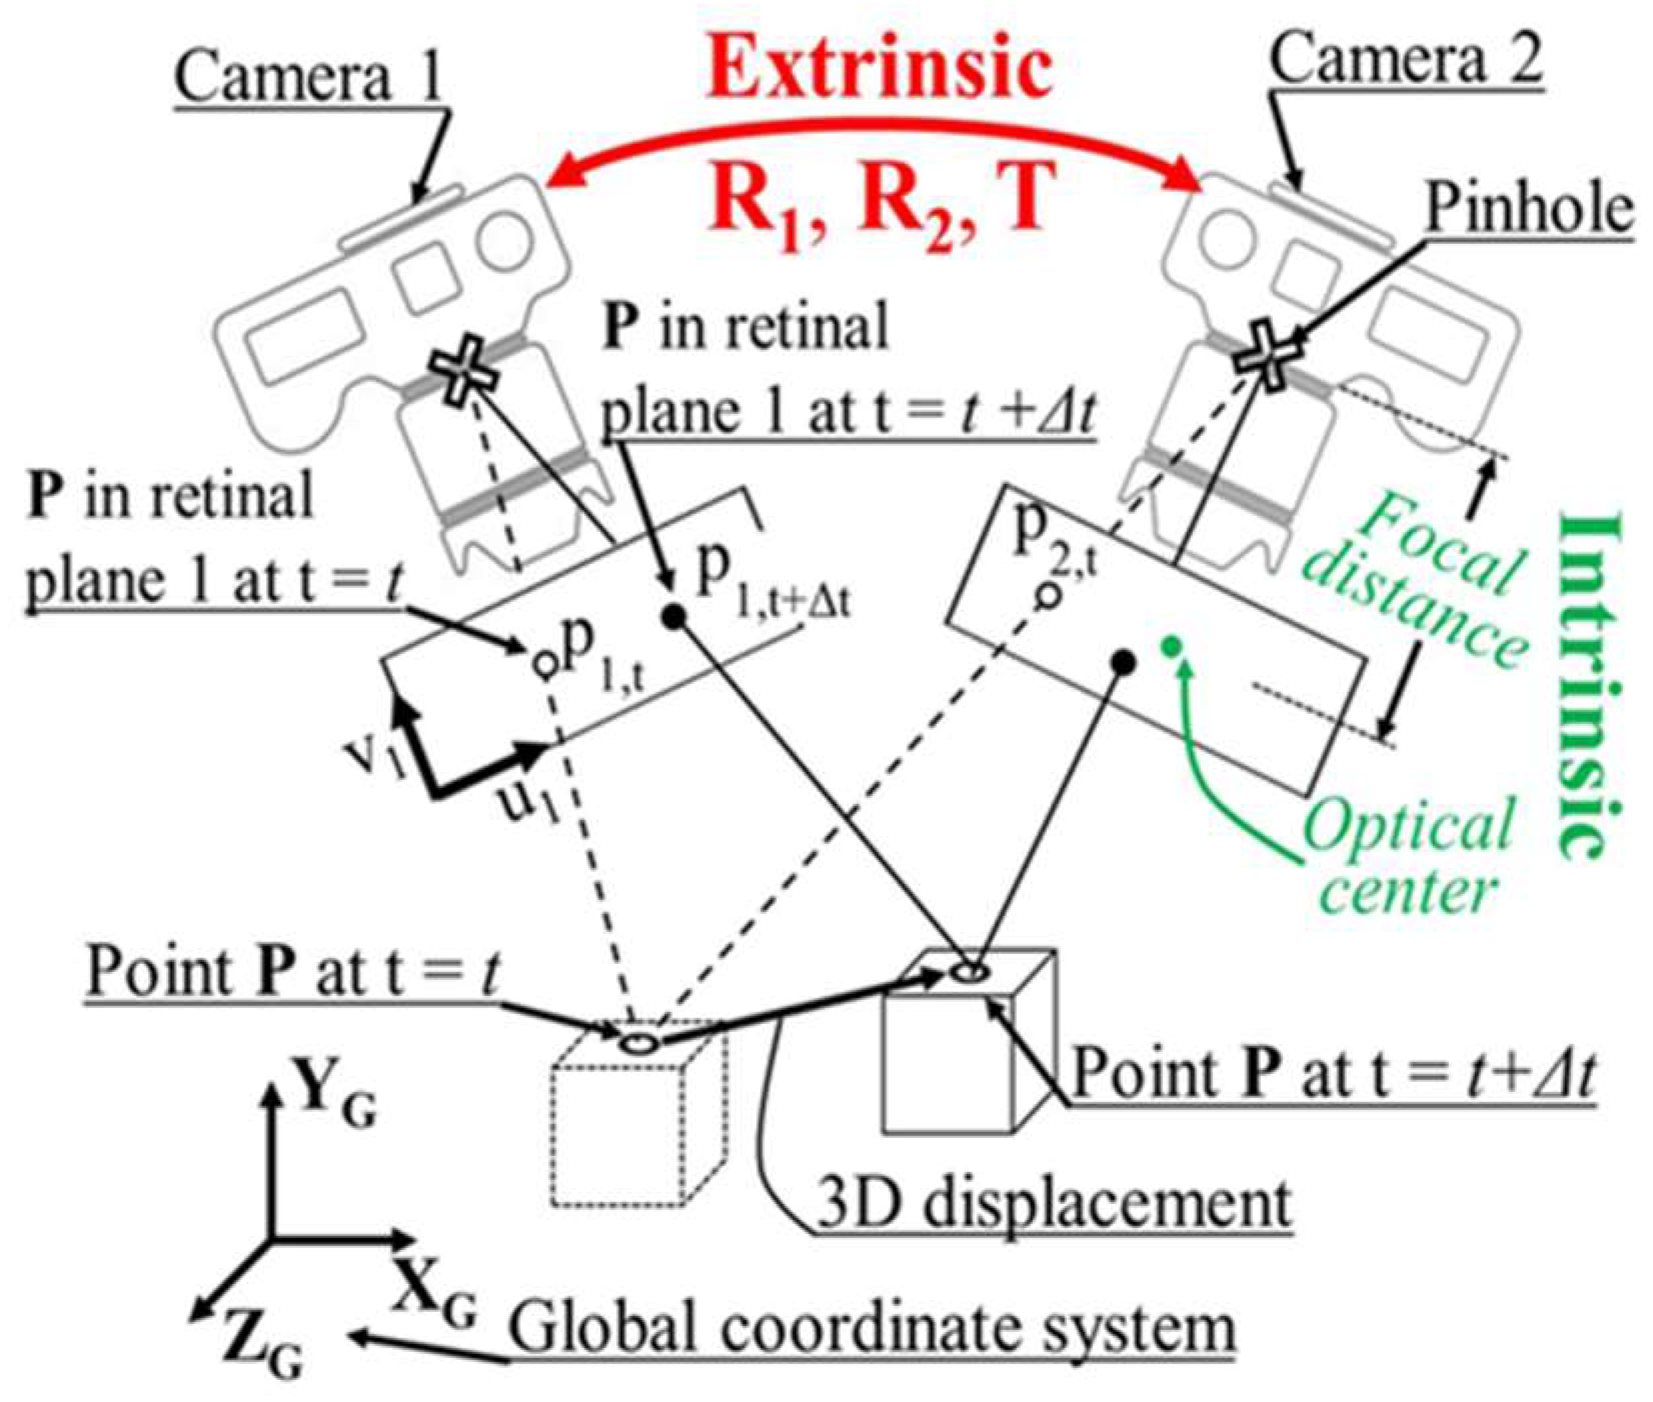
When a stereo camera system is used, point P will project two points, p1 and p2, in the retinal planes of the two cameras. A triangulation equation can be derived by combining and inverting the two projections, Equation (1). This creates an overdetermined problem (i.e., four equations for three unknowns) whose solution is a vector containing the three coordinates of point P [47]. Both cameras’ intrinsic (i.e., A1 and A2) and extrinsic (i.e., R1, R2, and T) parameters must be known to perform the triangulation. A schematic representation of the parameters can be found in Figure 1. Traditional calibration methods utilize epipolar geometry to estimate these parameters. Epipolar geometry imposes a geometric constraint on the coordinates of corresponding points in multiple images [48].
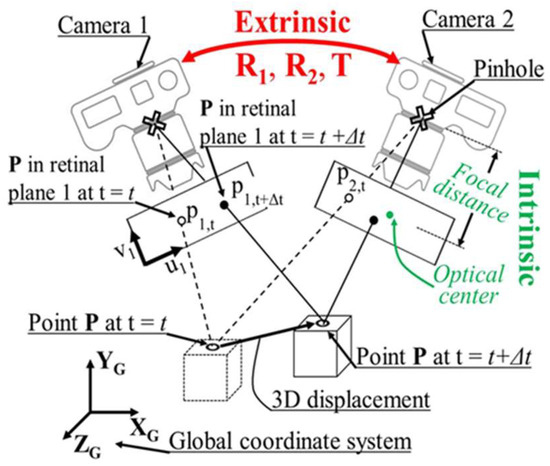
Figure 1.
Schematic representation of a stereophotogrammetry analysis, with an indication of the intrinsic and extrinsic parameters.
Specifically, point p1 on the retinal plane of Camera #1 has a unique corresponding point, p2, on the retinal plane of Camera #2, which can be expressed as follows:
where F is a 3 × 3 matrix of rank two, referred to as the fundamental matrix [49], which contains information about intrinsic and extrinsic parameters, as shown below:
Here, is the inverse of the intrinsic parameter matrix of Camera #1, the transposed inverse of the intrinsic parameter matrix of Camera #2, the Camera #1-to-Camera #2 relative rotation matrix, and the cross-product representation of the translation vector . Both and are expressed in Camera #1’s frame of reference. From (2), by identifying multiple pairs of corresponding points (p1, p2)i in the stereo images, F can be computed and the cameras calibrated. This method is the basis for image-based procedures that use calibration objects. Conversely, it is also possible to obtain F by separately computing the intrinsic parameters (i.e., A1 and A2) and the extrinsic parameters (i.e., and ) then combining them using Equation (3). The latter is the foundation of the proposed sensor-based calibration method.
2.2. Extraction of the Fundamental Matrix Using Sensor Data
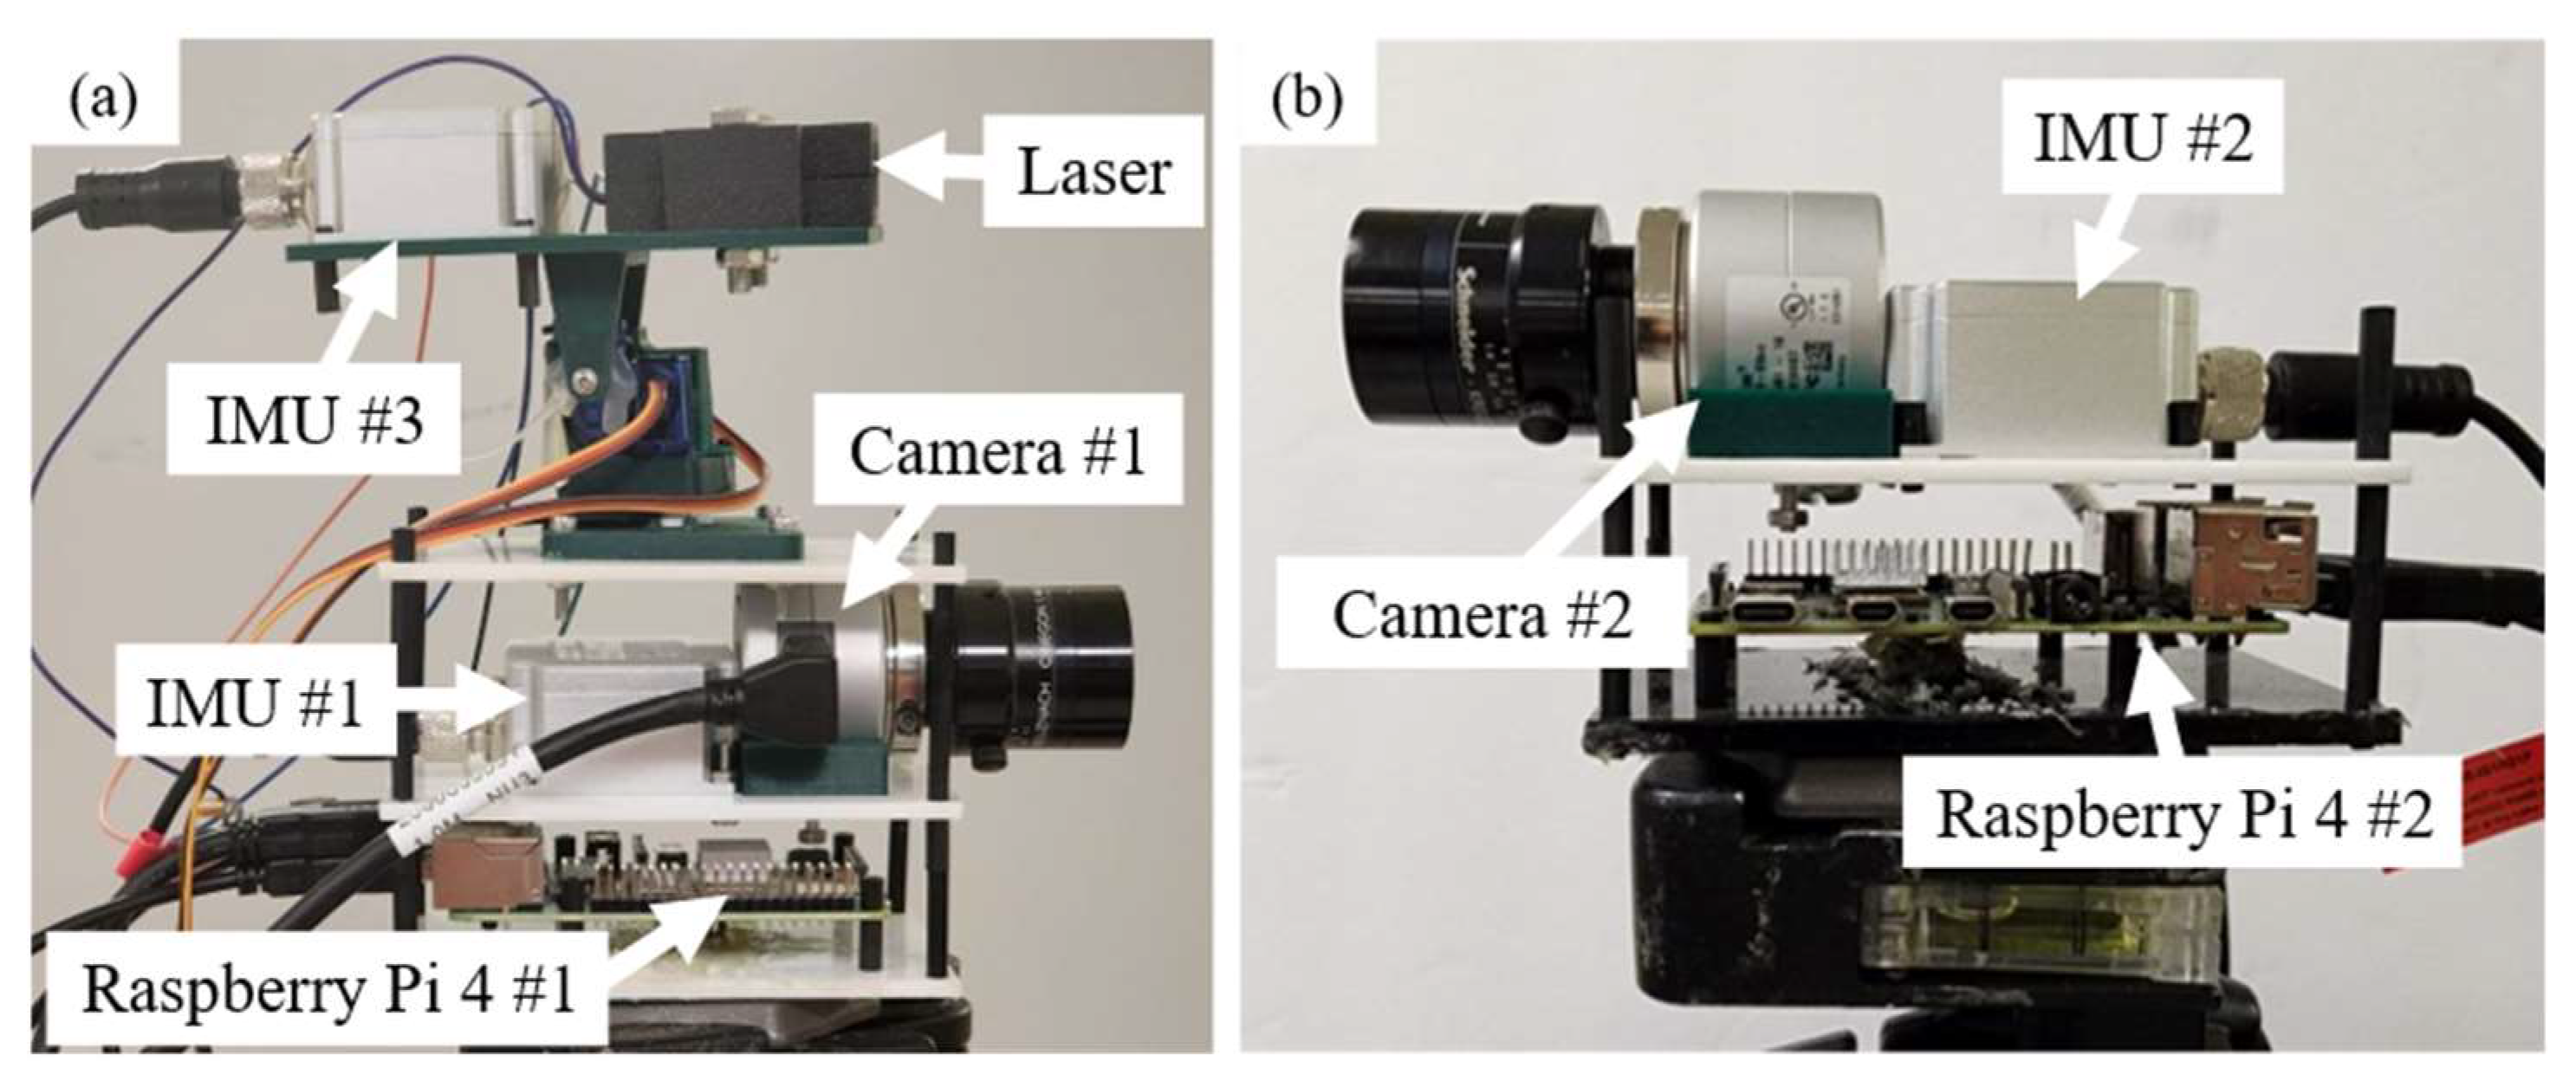
The proposed sensor-based method leverages the ability to compute the fundamental matrix, F, using Equation (3). During stereophotogrammetry measurements, it is assumed that the focus and aperture settings of the camera lenses remain fixed, allowing the intrinsic matrices, A1 and A2, to be treated as constants. As a result, the primary objective becomes the estimation of the extrinsic parameters. To achieve this, the proposed solution incorporates a sensor suite consisting of three inertial measurement units (IMUs) and a laser distance sensor integrated into the hardware prototypes shown in Figure 2 and based on the schematic framework described in [44]. In particular, the prototype of the multi-sensor board used in this study embeds the following components:
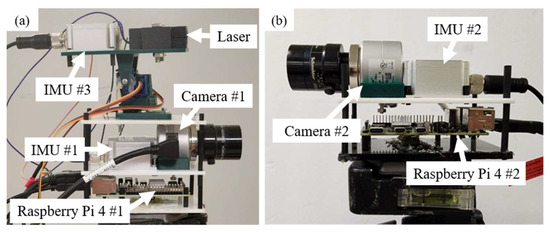
Figure 2.
Overview of a prototype of the multi-sensor system, with the components labelled accordingly: (a) Board #1 and (b) Board #2.
- -
- Three LPMS-IG1 IMUs (LP-Research), each acquiring data at 100 Hz and offering angular accuracies of 0.0043°, 0.0038°, and 0.00075° in roll, pitch, and yaw estimation, respectively; and
- -
- One M88B USB laser module (JRT Meter Technology), acquiring data at 1 Hz with a linear measurement accuracy of ±0.5 mm.
By using the output of the sensors in the prototypes, the and needed to determine F are computed without the need for images of a calibration object. The intrinsic parameters (i.e., the matrices A1 and A2 and each lens’s distortion parameters) are independently computed for each camera using a small calibration object prior to estimating the extrinsic parameters. Therefore, these intrinsic parameters are treated as known inputs throughout the calibration procedure.
Because IMU #1 and IMU #2 are rigidly attached to Camera #1 and Camera #2, respectively, they provide the rotation matrix, , of the ith camera in the global frame of reference, W, using the following:
where αi, βi, and γi are the roll, pitch, and yaw angles of the ith camera, respectively.
The global reference frame, W, is established by ensuring that all three IMUs measure their orientation relative to a common frame. To achieve this, the two sensor boards shown in Figure 2 must be placed on a dedicated zeroing station before any analysis. This station aligns the boards side by side in a fixed configuration, ensuring that the optical axes of Camera #1, Camera #2, and the laser are all parallel. This procedure guarantees consistent orientation across the system and allows all measurements to be referenced within the same global frame. The Camera #1-to-Camera #2 relative rotation matrix in Camera #1’s frame of reference, , can be calculated from the following:
The translation vector in the global frame of reference, TW, is obtained using data from IMU #3 and the laser sensor as follows:
Here, Π denotes the repeated matrix multiplication operator, ρ represents the distance measured by the laser, and is a 4 × 4 homogeneous transformation matrix that encodes the relative position and orientation between successive coordinate frames using Denavit–Hartenberg (DH) parameters [50]. These parameters define the lengths and orientations of the n = 3 rigid links that make up the pan–tilt mechanism on which the laser is mounted (see Figure 2a). The sequence of these transformations collectively describes the laser’s pose relative to the optical center of Camera #1. Then, the Camera #1-to-Camera #2 relative translation vector expressed in Camera #1’s frame of reference, , can be obtained as follows:
It is important to note that the translation vector, TW, as computed using Equation (6), accurately represents the camera-to-laser displacement only if the laser is directed precisely at the optical center of Camera #2. According to the pinhole camera model, the optical center corresponds to the focal point of the camera and is located along the optical axis at a distance equal to the focal length in front of the image plane. To ensure proper alignment, the first step involves identifying the projection of the image sensor’s center onto the physical body of Camera #2, as illustrated in the schematic in Figure 3a. This projected point serves as the target for the laser during the alignment procedure, thereby enabling a correct estimation of TW.

Figure 3.
Localization of the optical center by using the image sensor center’s projection on the camera body: (a) CAD model of Camera #2 showing the location of ex and (b) location of the laser beam on Camera #2’s body during an experiment.
This allows for the computation of a correction factor, Tbody, expressed as follows:
Here, ex represents the distance between the center of the image sensor and its horizontal projection on the camera body, as illustrated in Figure 3a. The focal length, f2, refers to the lens mounted on Camera #2 and was pre-calibrated using a small checkerboard. denotes the rotation matrix of Camera #2, expressed in the reference frame of Camera #1. Since the focal lengths remain fixed throughout the measurements and the cameras are focused to infinity, these parameters can be considered constant for the entire duration of the experiment. The estimation of ex requires detailed knowledge of the camera’s internal geometry, specifically, the position and dimensions of the imaging sensor relative to the camera body. In the experiments presented in this study, CAD models of the cameras were available and served as a reference to accurately determine the location of the imaging sensor within each device.
The correction factor, Tbody, represents a key advancement of the model proposed in this research compared to the initial formulation of the sensor-based calibration method presented in [44]. In an earlier study, the stereo cameras were modeled as idealized points with no physical volume. However, for real-world applications involving physical cameras, the inclusion of Tbody is essential to accurately estimate the translation vector between the cameras. While the impact of neglecting the lateral offset, ex, may be minimal for small-form-factor cameras (see Figure 3b), this simplification becomes increasingly inaccurate for larger camera systems. As discussed in Section 3.2, in such cases, ex can represent a significant portion of the total inter-camera distance and must be accounted for to ensure precise calibration. Finally, Equations (7) and (8) can be combined to yield the corrected translation vector, , expressed as follows:
Equation (9) ensures that by directing the laser toward the projection of the image center (see Figure 3b), the corrected position of the optical center is accurately measured. This approach mitigates the influence of the camera body on the estimation of the extrinsic parameters, thereby improving the overall calibration accuracy. To ensure accurate alignment of the laser with the projection of the image center onto the camera body, the authors manually marked the correct location on each camera using small pieces of retro-reflective tape. This aiming procedure was carried out manually for the prototypes presented in this study, serving as a proof of concept. Future iterations and refinements of the system should incorporate automated aiming mechanisms to minimize the potential for human-induced errors and improve overall measurement reliability.
Once the outputs of Equations (5) and (9) are computed using the sensor data, F can be entirely determined using Equation (3), and the cameras are considered fully calibrated.
3. Experimental Results
While the mathematical model described in Section 2.2 was previously validated analytically and applied to a simple in-plane translation scenario on a small-scale setup in [44], its performance has not yet been assessed for three-dimensional point cloud displacements involving both in-plane and out-of-plane components, particularly in fields of view (FOVs) larger than 2 m × 2 m. Evaluating accuracy in the out-of-plane direction is especially important, as stereophotogrammetry is traditionally known to be approximately three times less accurate for out-of-plane measurements compared to in-plane ones. Moreover, critical information about the structural behavior of real-world systems often involves complex deformations combining in-plane and out-of-plane components, such as the mixed bending modes observed in vibrating structures. These cannot be captured adequately using single-camera setups or a limited array of contact-based sensors.
To evaluate the proposed sensor-based calibration method, two experimental tests were performed on the following: (i) a planar target moving within a 4 m × 4 m × 3.5 m FOV to assess reconstruction of point clouds undergoing combined in-plane and out-of-plane displacements and (ii) a mock three-story building subjected to excitations designed to induce both planar and torsional deflections. In both experiments, the stereo cameras were calibrated using two approaches, the traditional image-based method and the proposed sensor-based method, allowing for a direct comparison of their accuracy. For the image-based calibration, intrinsic and extrinsic parameters were estimated simultaneously by capturing multiple images of a fixed-dimension checkerboard calibration target placed at various locations throughout the measurement volume. This procedure scales with the size of the FOV, requiring increasing effort to ensure adequate coverage. For instance, under optimal conditions, image-based calibration required approximately 60 min for Test #1 (see Section 3.1) and around 15 min for Test #2 (see Section 3.2) and can take several hours when applied to large-scale FOVs, such as those involved in stereophotogrammetry of utility-scale wind turbine blades [10]. For Test #1, the vision system included two Basler puA1600-60uc cameras (Basler AG), each capturing 1600 × 1200-pixel images at 6 Hz. These cameras were software-synchronized using two independent Raspberry Pi 4B units and a master control station. Each was equipped with a 12 mm fixed-focal-length lens. For Test #2, the setup employed two Photron Fastcam SA-2 high-speed cameras (Photron), each acquiring 1024 × 2048-pixel images at 500 Hz, fitted with 24 mm fixed-focal-length lenses.
For the sensor-based calibration, the intrinsic parameters were calibrated independently for each camera using a small planar checkerboard in less than 5 min. The extrinsic parameters were extracted by collecting 20 s of data from the IMUs and the laser, making the sensor-based method independent of the size of the FOV. The calibration files produced with the two methods were then used to reconstruct the 3D displacements of the tested systems.
It should be noted that at the time of the experimental campaign described in this paper, access to real-world engineering structures was not available. As a result, the calibration method was validated exclusively through a series of controlled laboratory experiments. The results obtained from tests, conducted at varying scales, suggest that the proposed approach is both robust and generalizable. These experiments, serving as a proof of concept, indicate that the system is likely to perform effectively, even when applied to larger structures, with increased fields of view and wider baseline distances between cameras. Test #1, in particular, represents the largest and most complex scenario that could be feasibly executed, given the practical constraints and the current complexity of the image-based calibration procedure.
3.1. Test #1: Reconstruction of the Motion of a Planar Target’s Point Cloud in a 3D Space
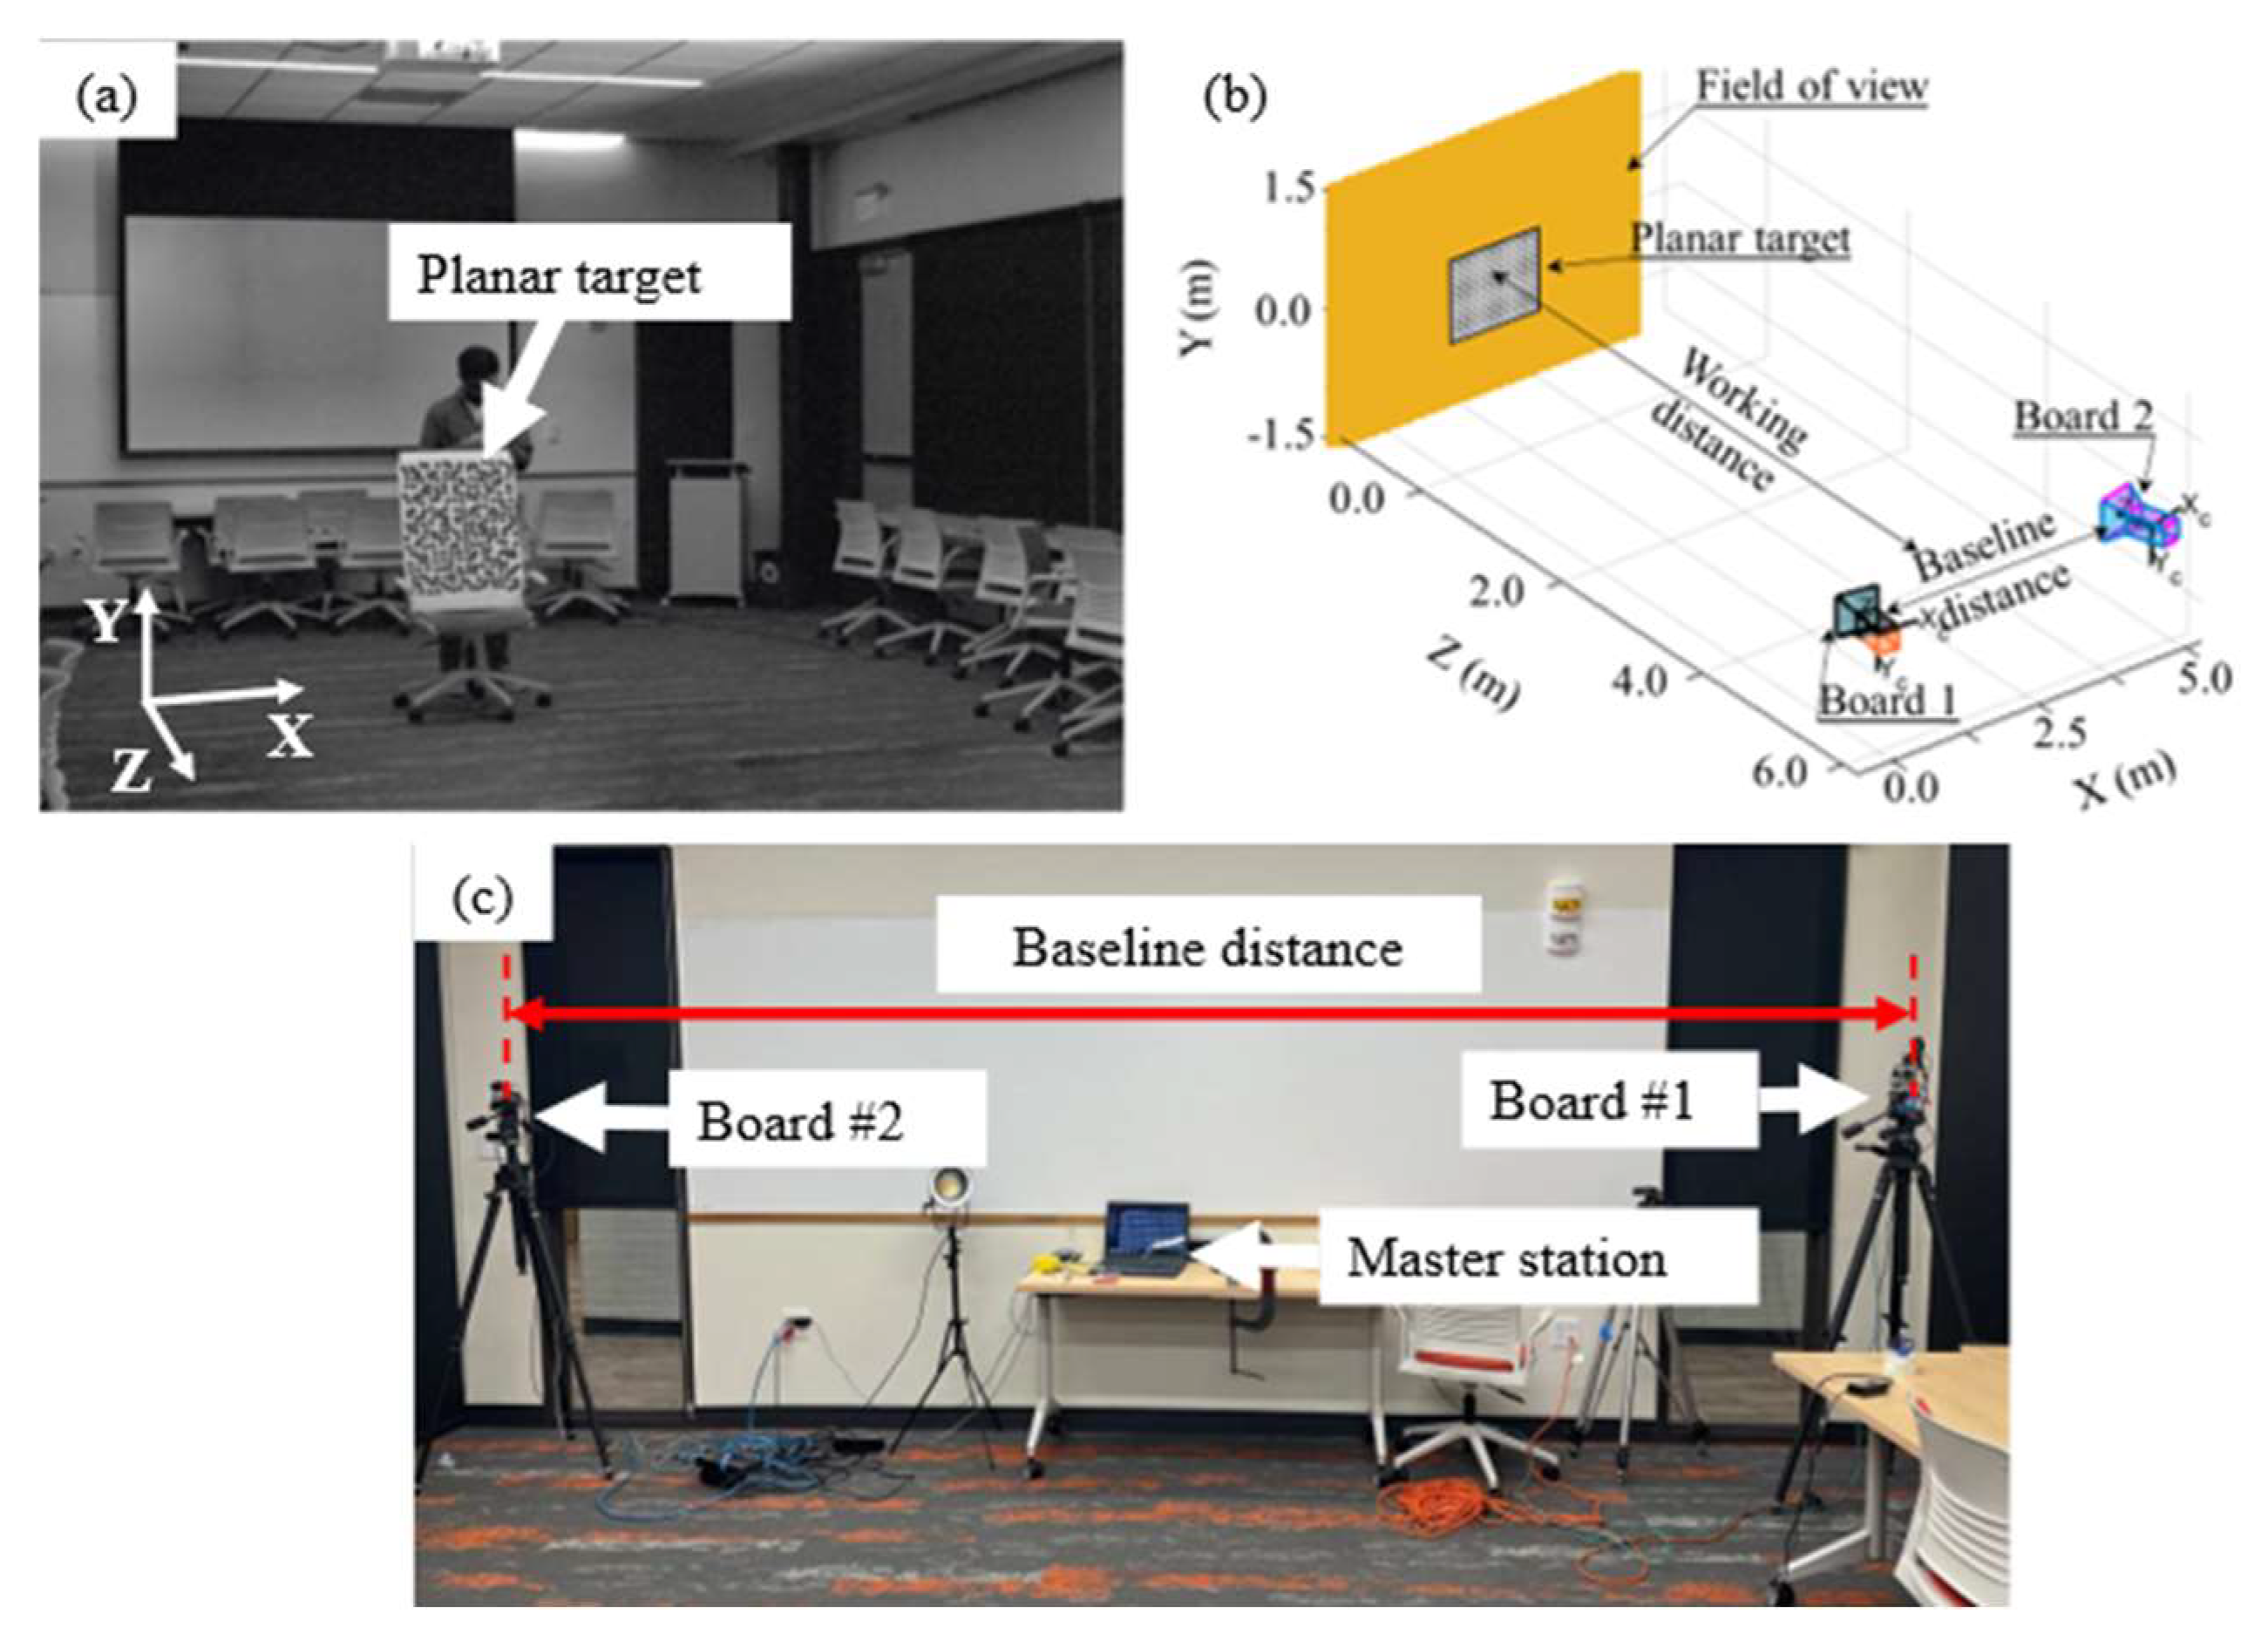
In Test #1, the stereo camera system, calibrated using both the traditional image-based method and the proposed sensor-based method, was employed to track the three-dimensional motion of a 0.8 m × 0.6 m point cloud generated from the speckled planar target shown in Figure 4. The target underwent combined in-plane and out-of-plane displacements within a test volume measuring 4 m × 4 m × 3.5 m. As illustrated in Figure 4b,c, the stereo cameras were positioned at a working distance of 6.5 m and configured with a 4.4 m baseline to generate a 4 m × 3 m × 3.5 m calibration volume. The corresponding calibration parameters used in the analysis are summarized in Table 1.
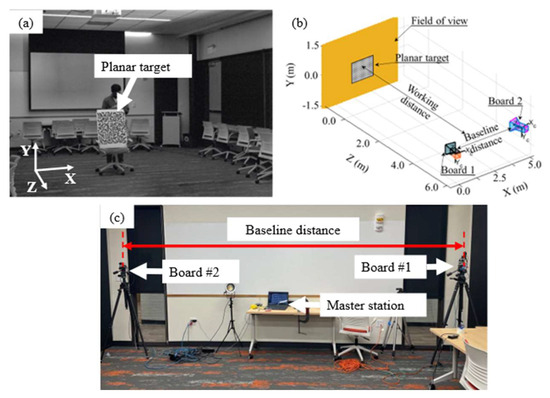
Figure 4.
Experimental setup to measure the 3D displacement of a speckled target moving in medium-scale space: (a) view from Camera #1 showing the planar target and the global frame of reference, (b) overview of the stereo camera setup (not to scale), and (c) stereo cameras and master station used to acquire the images.

Table 1.
List of the calibration parameters obtained for Test #1 using both the image-based and sensor-based calibration methods.
Table 1 indicates that the extrinsic parameters obtained from the two calibration methods differ by a maximum of approximately 1.5° in the Euler angles, with the most significant discrepancy observed in the yaw angle γ. Additionally, the translation vectors differ by about 3% in magnitude when the Euclidean norm of the translation vector derived from the image-based calibration is used as the reference. It should be noted that the intrinsic parameters differ between the two calibration methods due to the nature of their respective procedures. The image-based method relies on stereo images of a large calibration checkerboard, which results in the joint estimation of both intrinsic and extrinsic parameters. In contrast, the sensor-based method requires the intrinsic parameters to be pre-calibrated independently for each camera using separate image sets, after which the extrinsic parameters are measured using the multi-sensor board. Additionally, while distortion parameters are always computed as part of the intrinsic calibration, they have been omitted from the manuscript for brevity. Unless otherwise specified, any mention of intrinsic parameters in this work implicitly includes the distortion parameters.
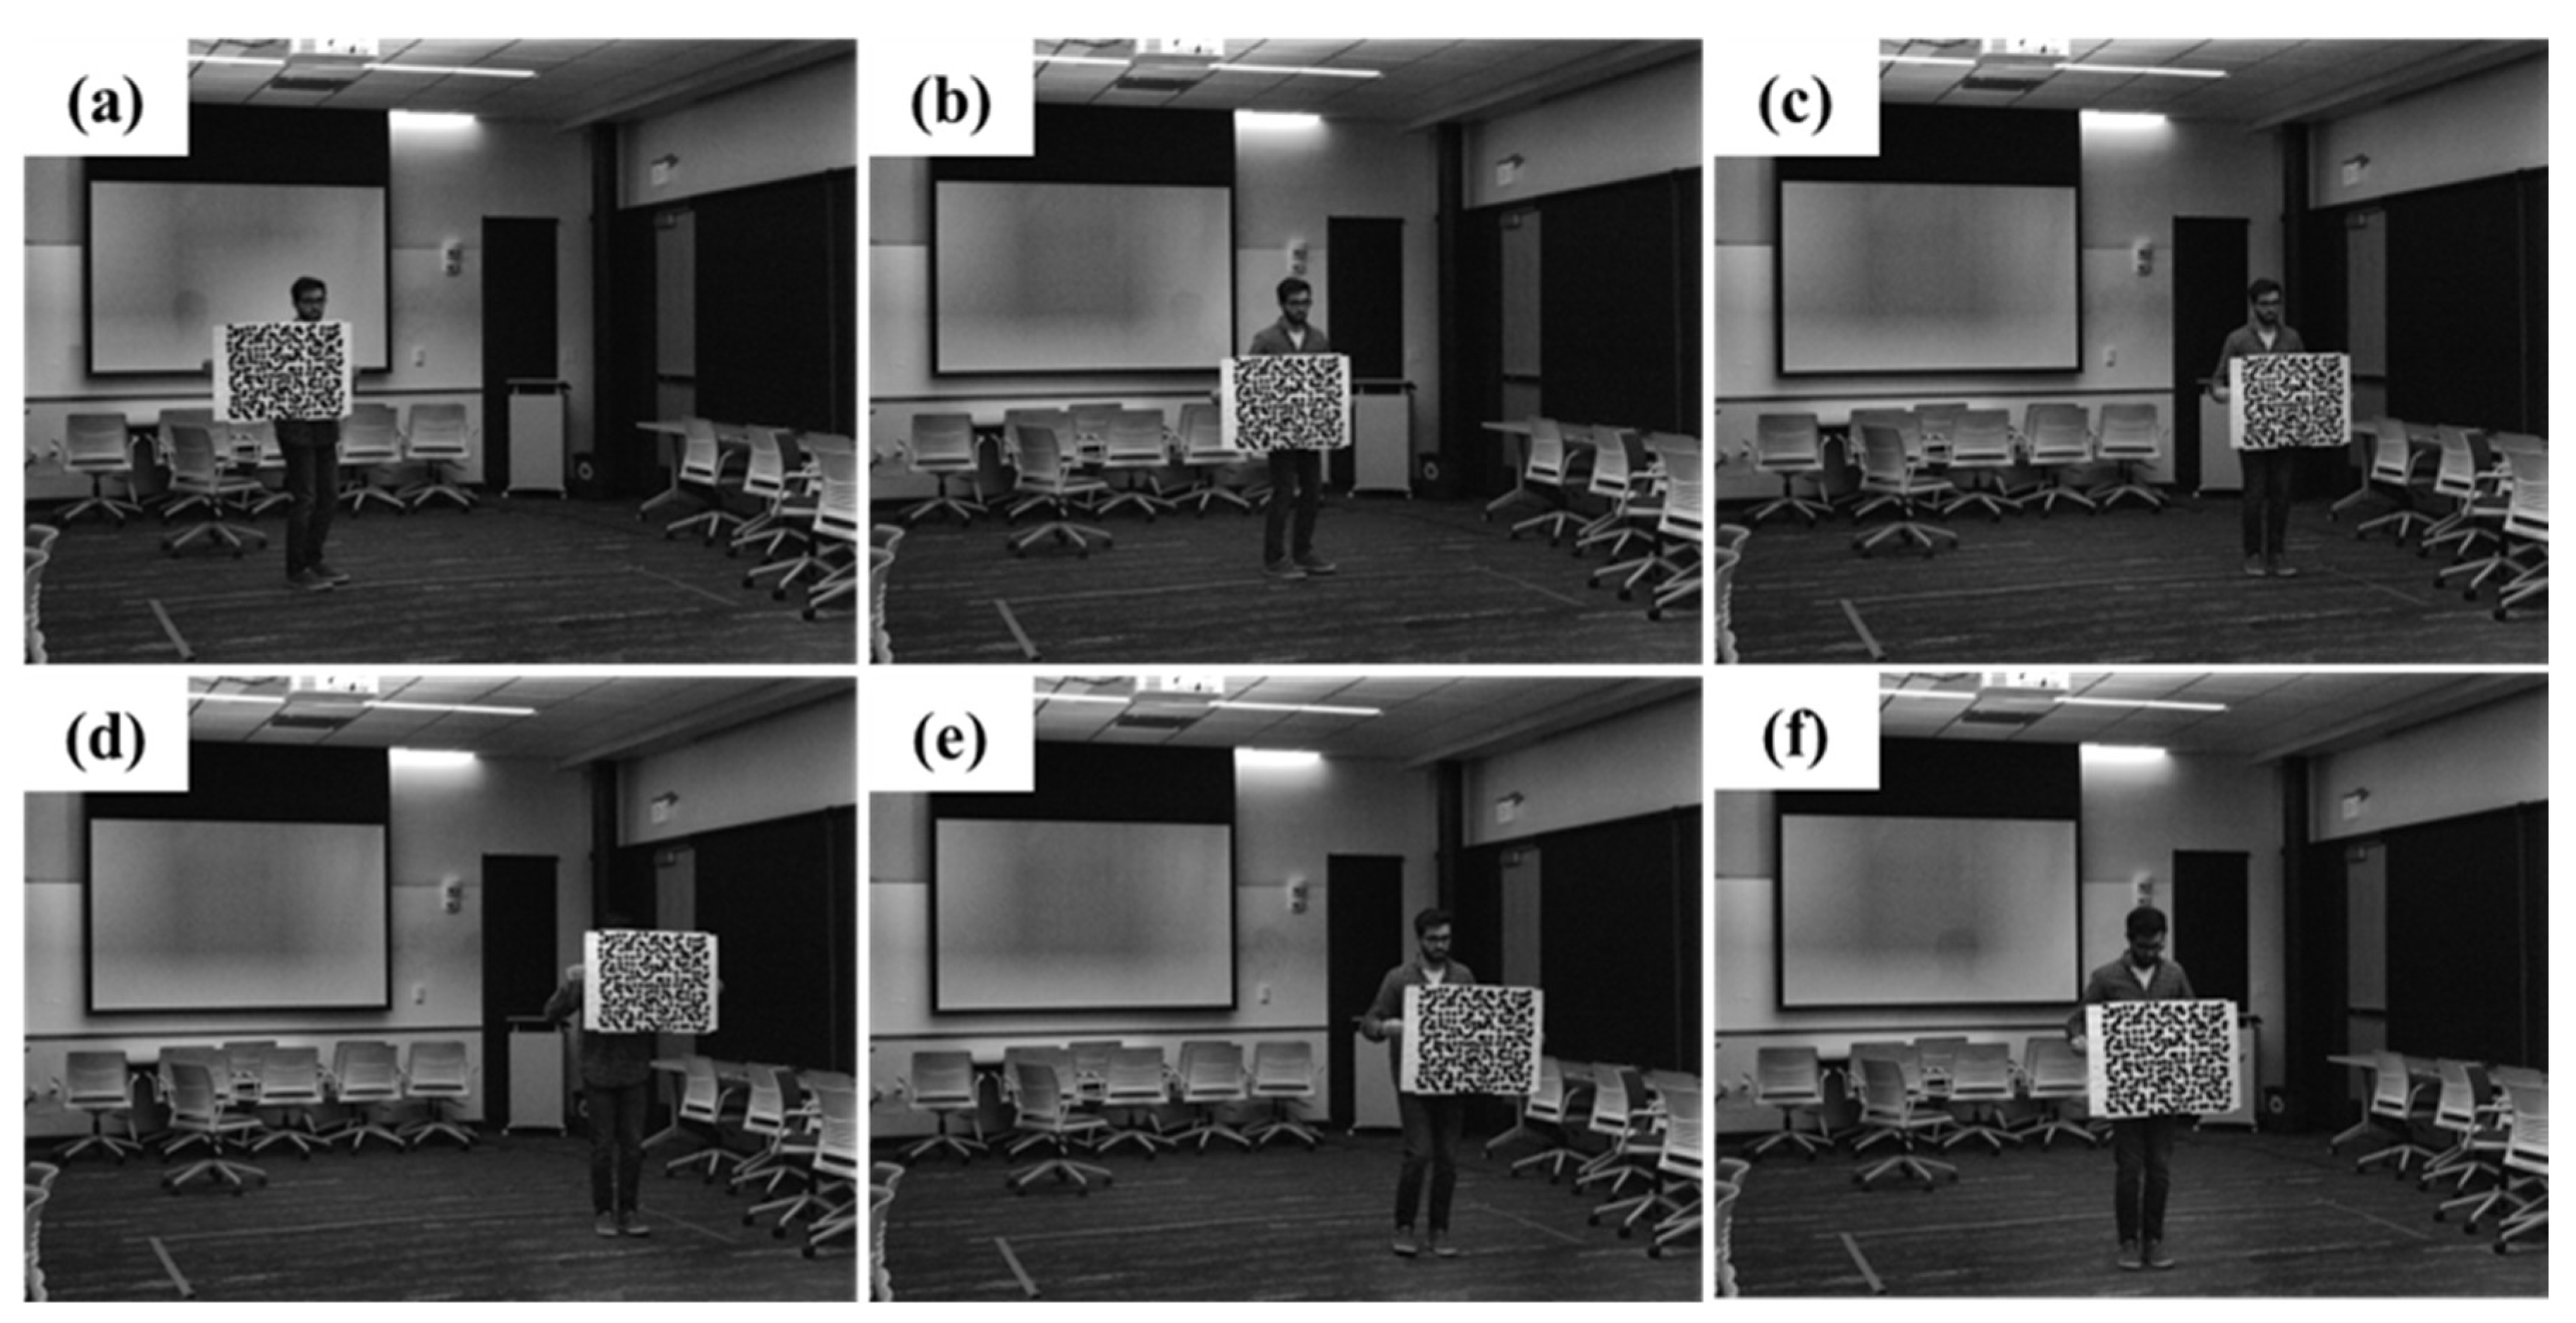
Before initiating motion, five images of the planar target were captured while the target remained stationary to assess the noise floor (NF) of the 3D-DIC measurement system. Following this, the target was displaced throughout the entire calibration volume using a complex motion pattern composed of a cycloidal trajectory in the X–Y plane and a “U-shaped” trajectory in the X–Z plane. During the experiment, a total of 150 stereo image pairs were acquired by the synchronized stereo cameras operating at 6 frames per second (fps). These images were subsequently used to conduct the 3D-DIC analysis. A representative subset of frames from the 150-image sequence is shown in Figure 5.
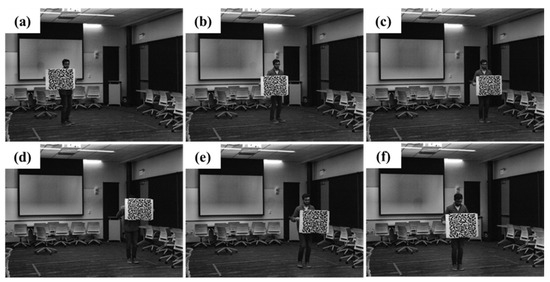
Figure 5.
Samples of frames extracted from the sequence of images collected for Test #1 from the perspective of Camera #1: (a) Frame #25, (b) Frame #50, (c) Frame #75, (d) Frame #100, (e) Frame #125, and (f) Frame #150.
3.2. Test #2: Impact Test on a Mock Building to Extract 3D Deflections
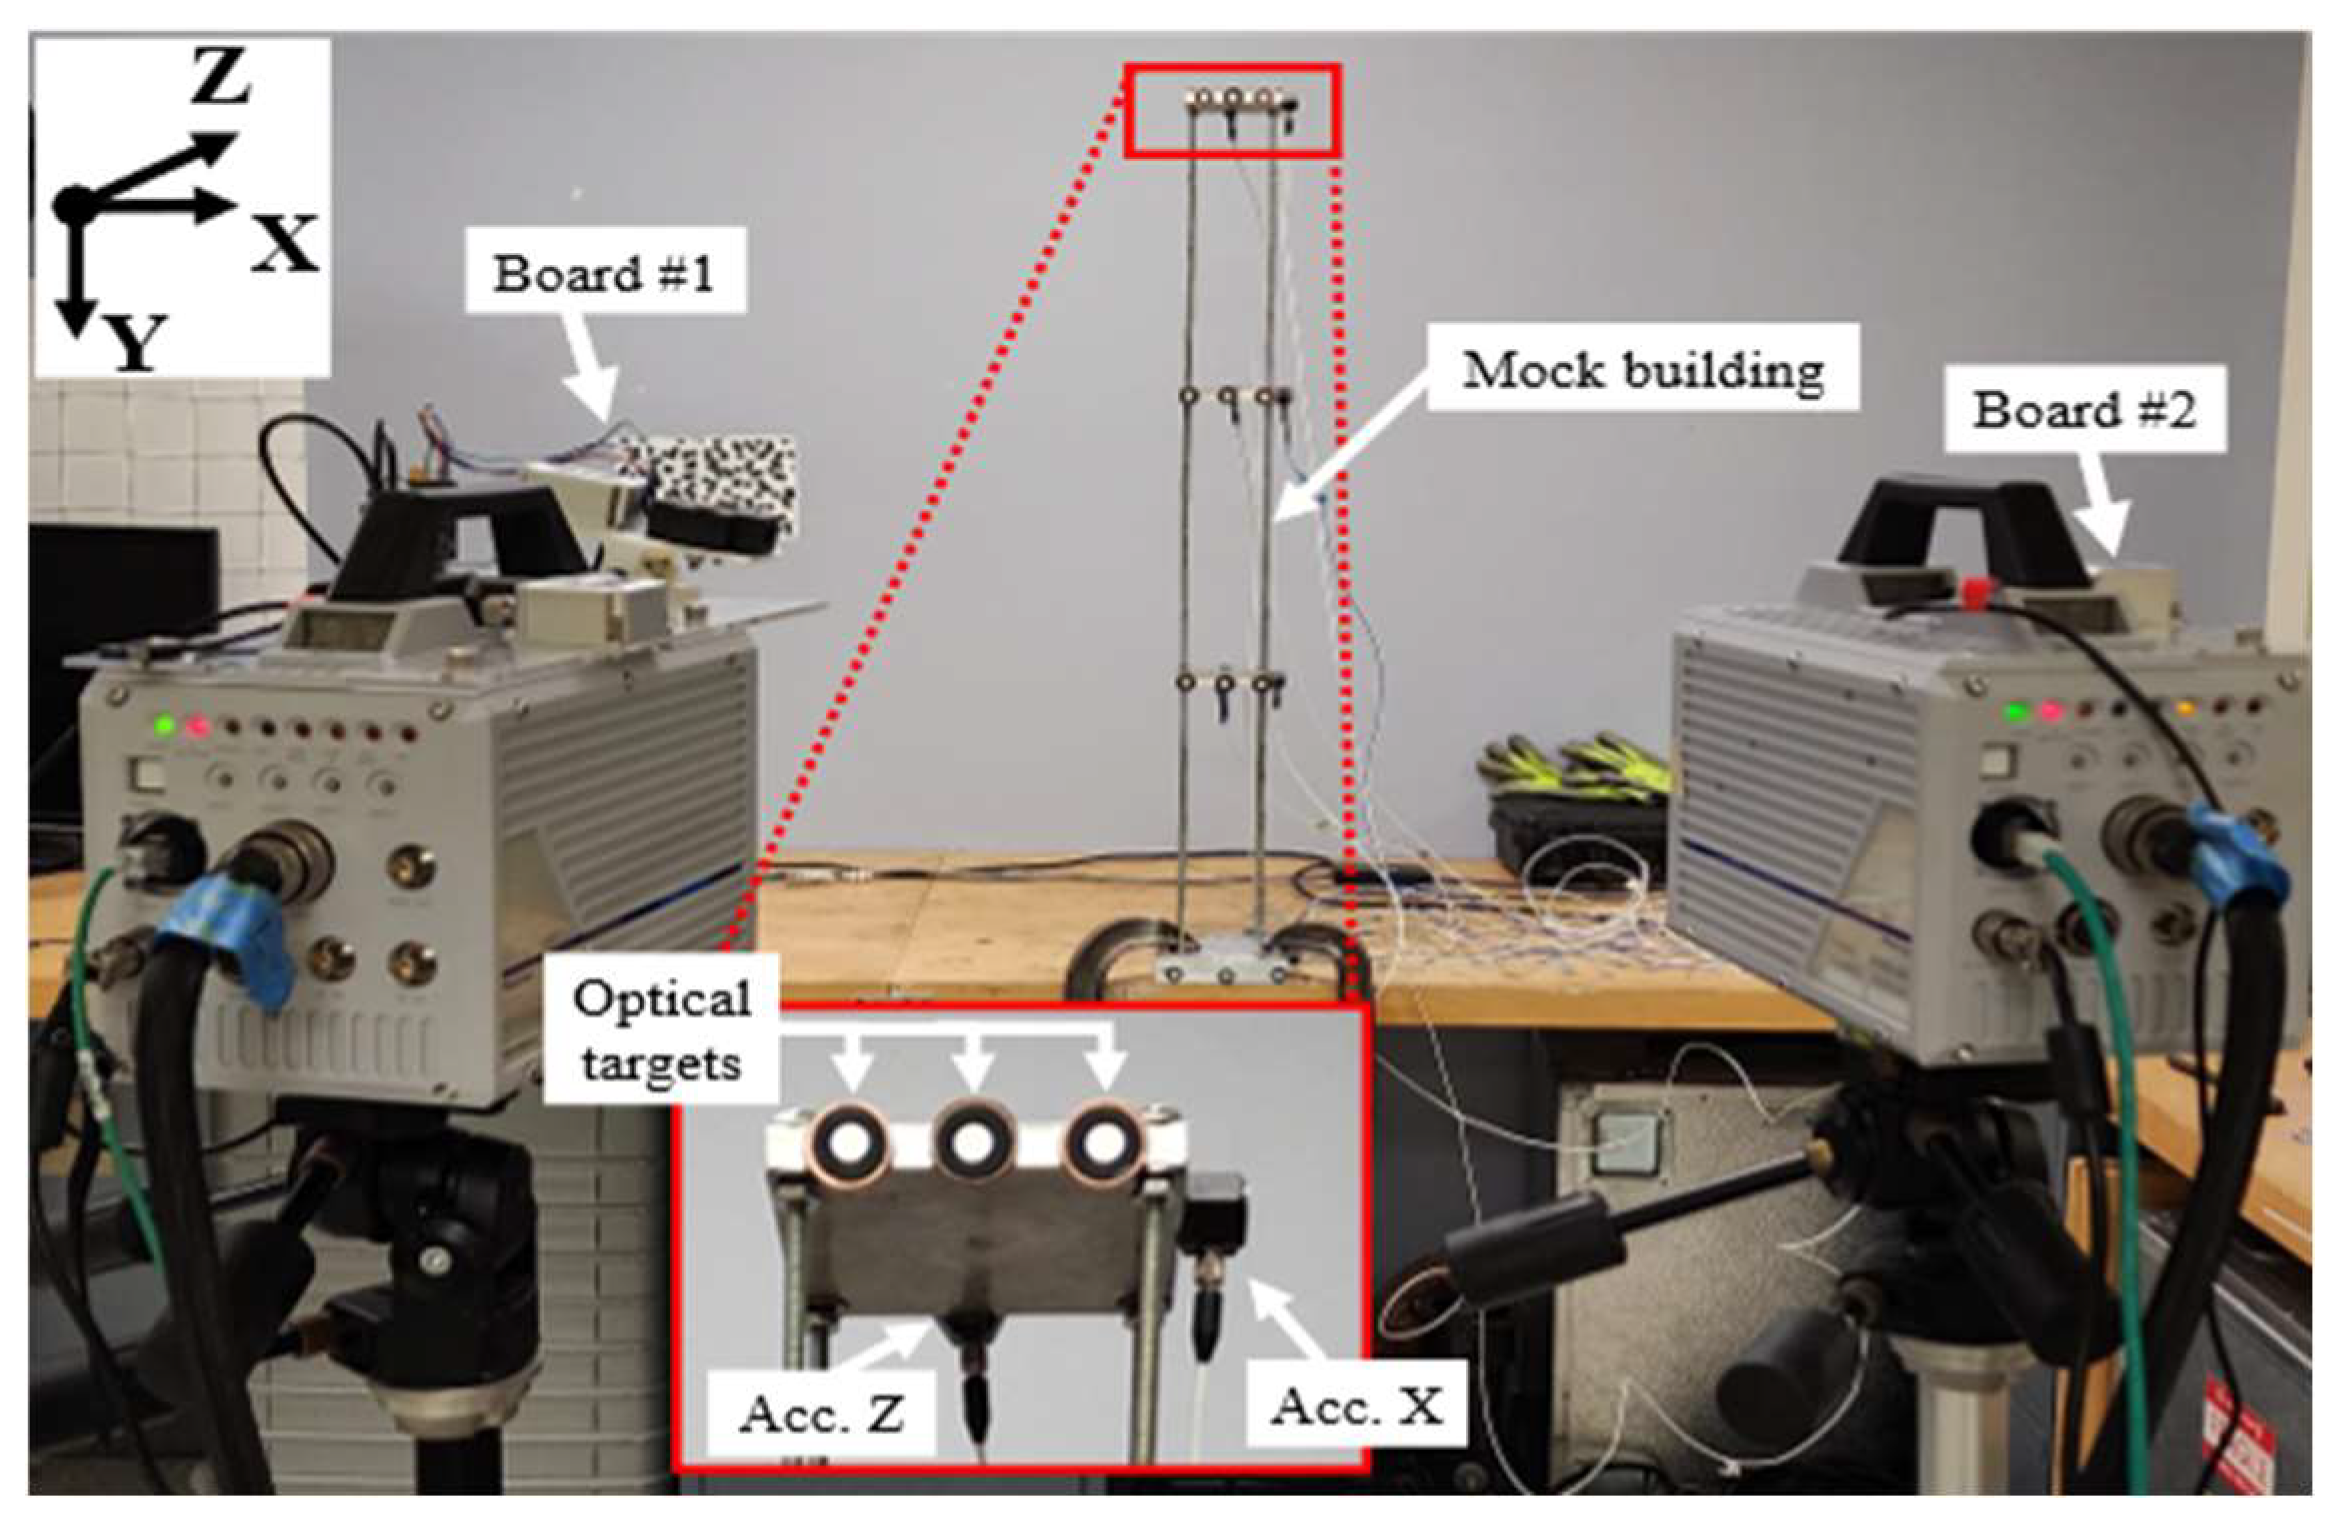
In Test #2, the stereo camera system was employed to measure the frequency response of a 0.9 m-tall mock building subjected to an impact excitation, as shown in Figure 6. Each floor of the mock structure was instrumented with three optical targets (for 3D-PT) and two single-axis accelerometers oriented along the +X and +Z directions, which served as reference measurements. For this test, a second prototype of the multi-sensor board (depicted in Figure 2) was used to determine the extrinsic parameters of a pair of Photron SA2 high-speed cameras, positioned at a working distance of 1.3 m with a baseline of 0.5 m. This configuration defines a calibration volume of 0.5 m × 1.5 m × 0.5 m, with the resulting calibration parameters summarized in Table 2.
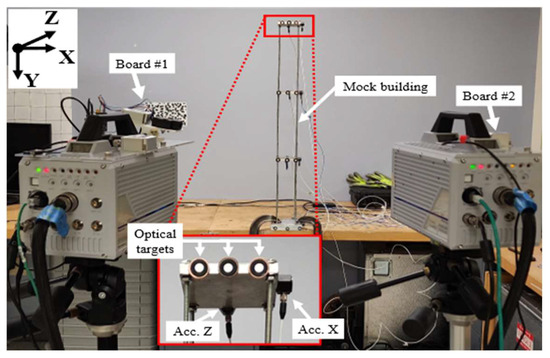
Figure 6.
Experimental setup of the modal test on a mock building to extract the 3D displacement of the structure with stereo cameras and accelerometers.

Table 2.
List of the calibration parameters obtained for Test #2 using both the image-based and sensor-based calibration methods.
At this smaller FOV, the extrinsic parameters obtained from the two calibration methods differ by less than 0.5° in the Euler angles, while the translation vectors differ by approximately 1% in magnitude, using the Euclidean norm of the translation vector from the image-based calibration as the reference. Notably, in this test, all images acquired for the image-based calibration were successfully processed by the calibration software, facilitated by the shorter working distance, which improved image quality and feature detection. The intrinsic parameters differ between the two calibration methods for the same reason previously explained in Section 3.1. Specifically, the image-based method computes intrinsic and extrinsic parameters jointly using stereo images of a calibration checkerboard, whereas the sensor-based method relies on separately pre-calibrated intrinsic parameters for each camera, followed by independent extrinsic parameter estimation using the multi-sensor board.
It is important to recognize that since the sensor-based calibration method relies entirely on data acquired from auxiliary sensors, several potential sources of error must be considered. While the noise characteristics of the IMU and laser distance sensor are the most readily identifiable and have been previously quantified by the authors, their impact on calibration accuracy is relatively minor compared to other, more significant sources of error identified in this study.
A comparative analysis of the extrinsic parameters reported in Table 1 and Table 2 reveals a notably higher degree of similarity in Table 2, which corresponds to the smaller FOV and shorter working distance in Test #2. In contrast, Test #1 shows more pronounced discrepancies. These variations can be primarily attributed to the following three sources.
- Laser aiming inaccuracies at larger distances: At longer working distances, even small angular misalignments in the laser-aiming system result in larger positional errors. This geometric sensitivity amplifies the effect of minor deviations and reduces the precision of the laser-to-camera alignment.
- Manufacturing inaccuracies affecting the Denavit–Hartenberg (DH) parameters: Although the DH parameters were derived with micron-level precision from 3D CAD models of the multi-sensor board, all physical components (i.e., enclosures, supports, and mounts) were 3D-printed with a layer height of 0.1 mm. The resulting discrepancies between the digital design and the manufactured hardware introduce systematic errors that can compound, especially in the multi-link transformation chain used in the pan–tilt model.
- Differences in sensor board configurations: Test #1 employed an earlier version of the multi-sensor board, which utilized servomotors in the pan–tilt mechanism to enhance rigidity and control. In contrast, Test #2 used a simplified version in which the servomotors were replaced with locking nuts for mechanical simplicity. These differences in mechanical design affect the precision and repeatability of the transformations used to compute extrinsic parameters.
After performing the two calibrations, the test consisted of performing an impact test on the first floor of the mock building, producing a displacement in the +X direction defined in Figure 6 and measuring the response with both the stereo cameras and the accelerometers. The impact was performed by a human operator with a 0.5 lb modal hammer. During the test, the high-speed cameras collected stereo images at a frame rate of 500 fps, while the accelerometers collected data at 1000 Hz. The goal of Test #2 was to perform a three-way comparison between the frequency spectra and operating deflection shapes obtained with the accelerometers and those extracted with a 3D-PT analysis when the cameras were calibrated with the image-based and the sensor-based methods.
4. Discussion
The images collected for the two tests were processed using the open-source software Digital Image Correlation Engine (DICe) [51] to compute the targeted systems’ X-, Y-, and Z- displacements. Parameters such as region of interest, subset step size, initial seed point, and correlation threshold were kept constant throughout all the analyses. The only distinction between the two processing methods was the values of the intrinsic and extrinsic parameters used to calibrate the stereo cameras (see Table 1 and Table 2) obtained from two different calibration methods. This section summarizes the results of the two tests described above.
4.1. Results of Test #1: Planar Target’s Point Cloud Moving in 3D Space
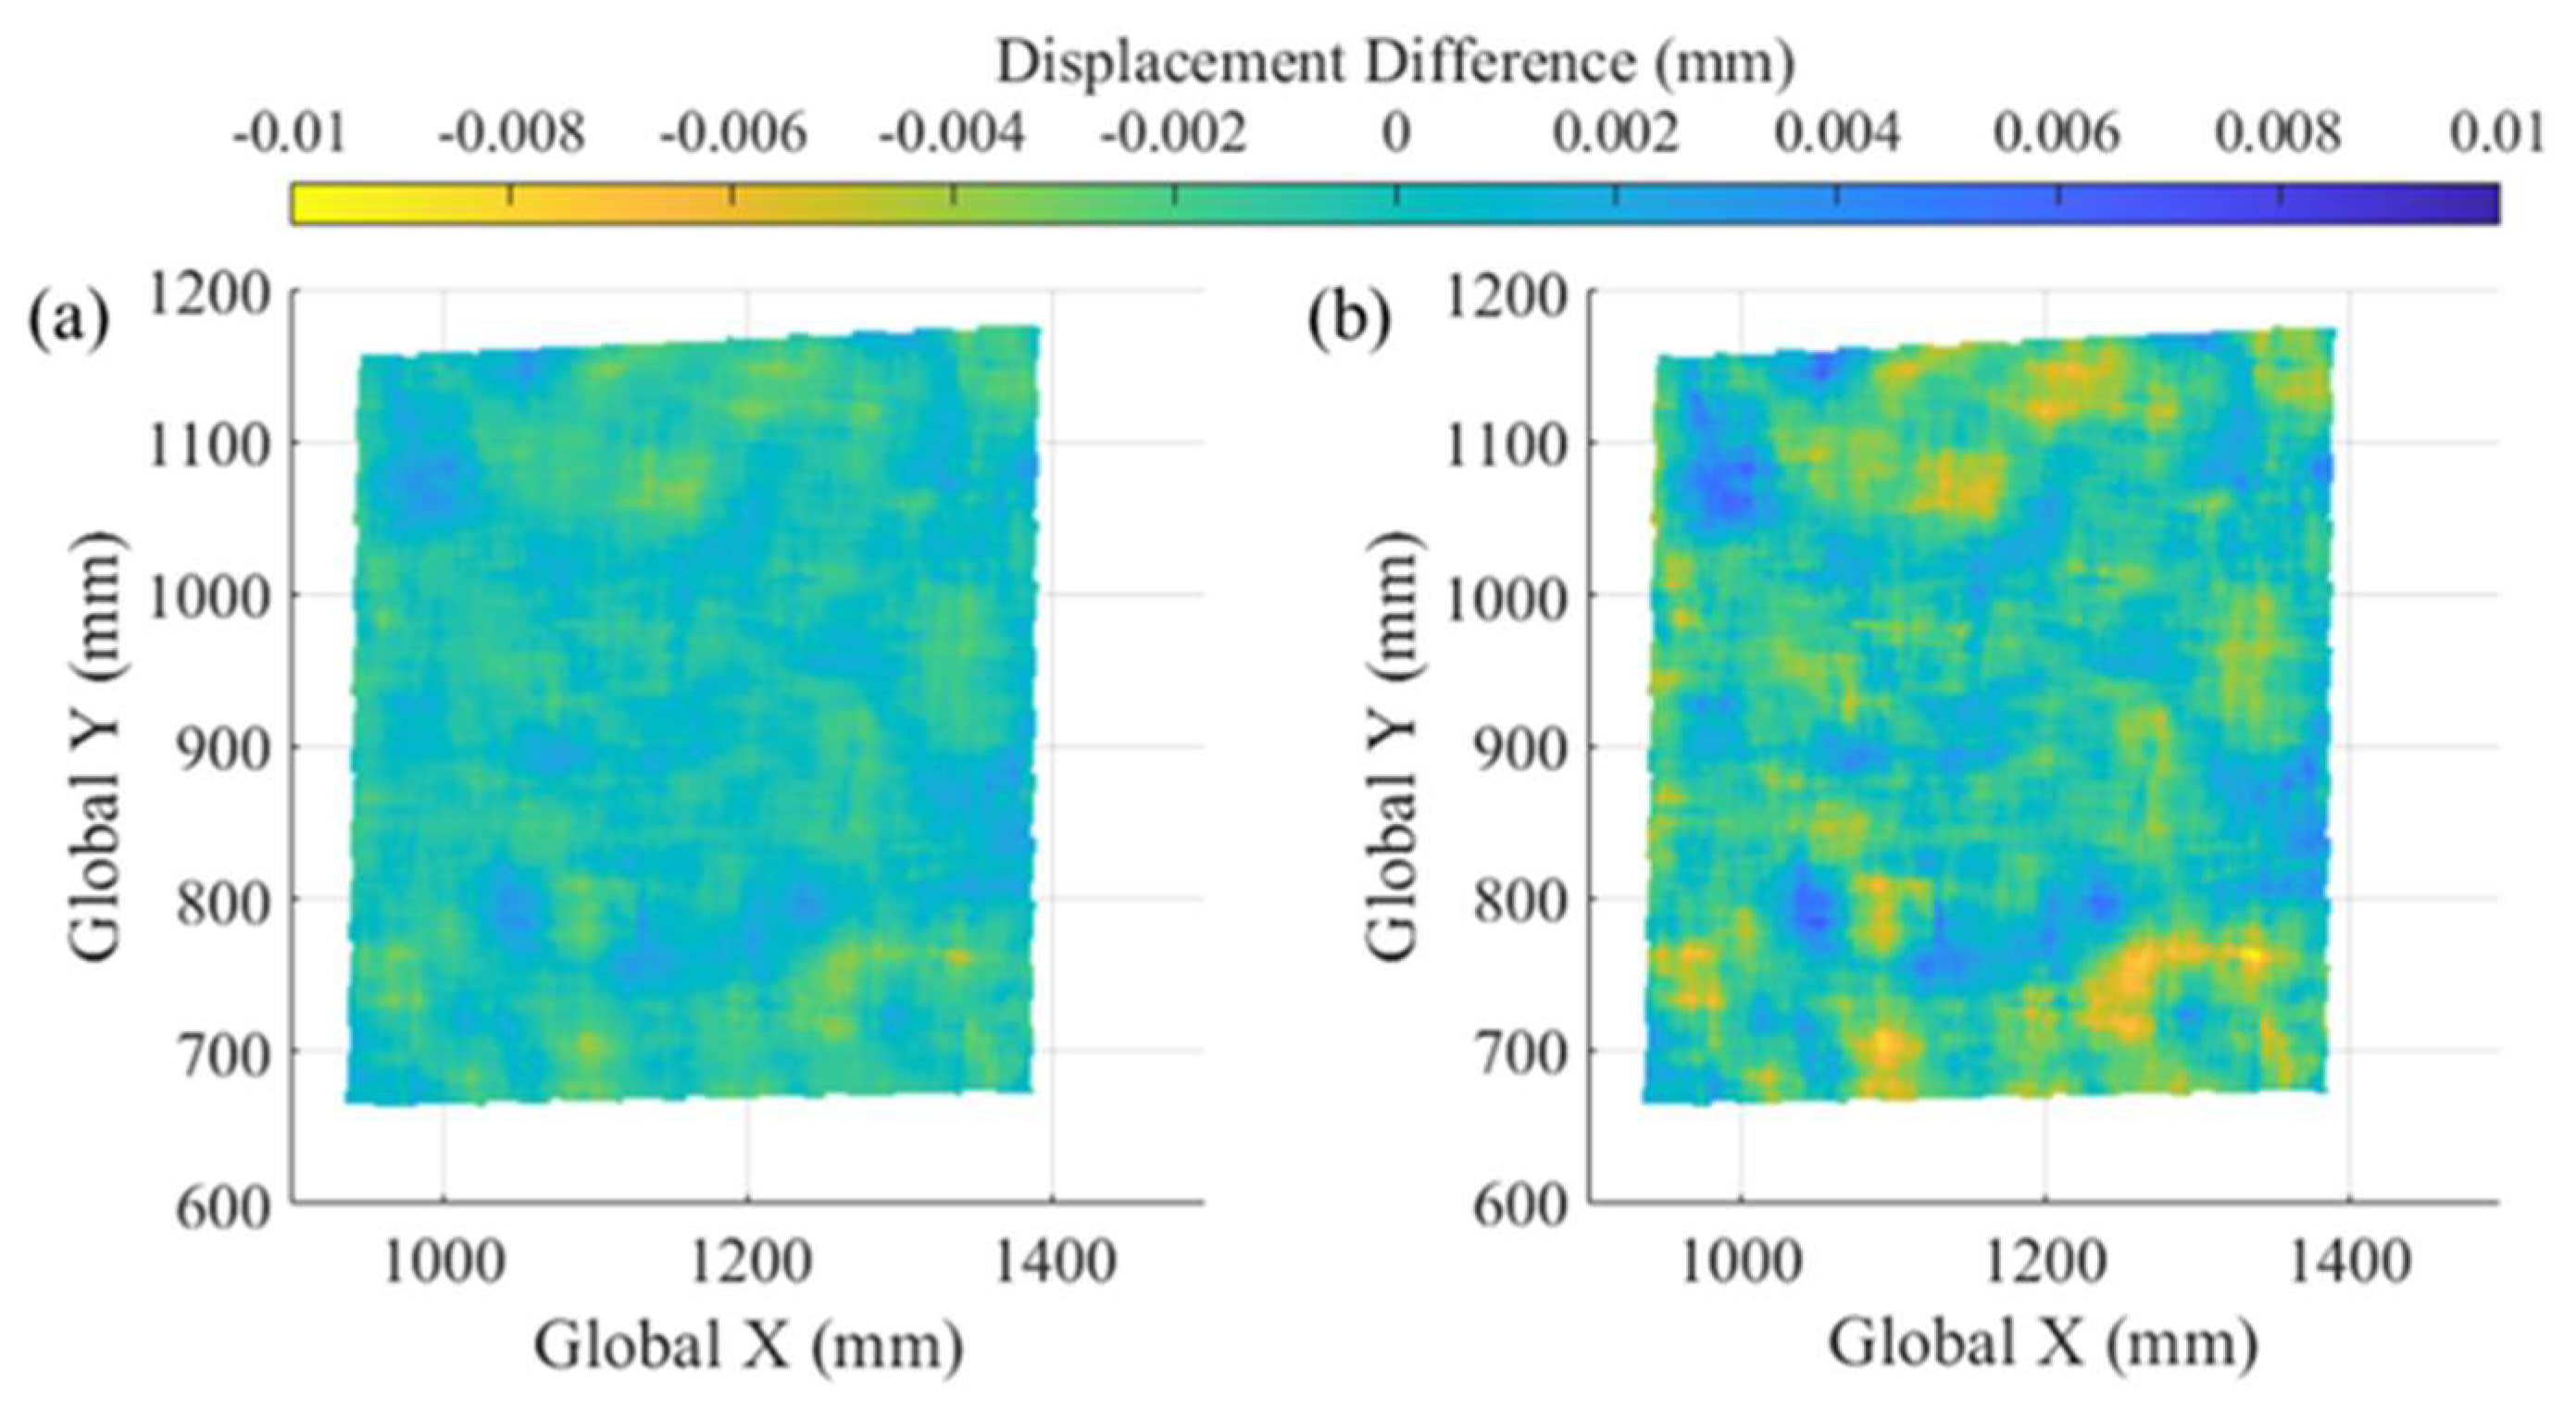
Using DICe in 3D-DIC mode, the 3D point cloud corresponding to the speckled planar target was reconstructed for Test #1, with the results of the estimation of the noise floor (NF) shown in Figure 7. As the target can move in 3D space, the NF is divided into the in-plane and out-of-plane directions. The values of the NF of the measurements extracted with the cameras calibrated with the traditional image-based method lie in the [−0.10; 0.10] and [−0.40; 0.30] mm ranges for the in-plane and out-of-plane displacement, respectively. Since the surface of the target was reconstructed using identical sets of DIC parameters except for the calibration parameters, it is possible to perform a direct cloud-to-cloud comparison.
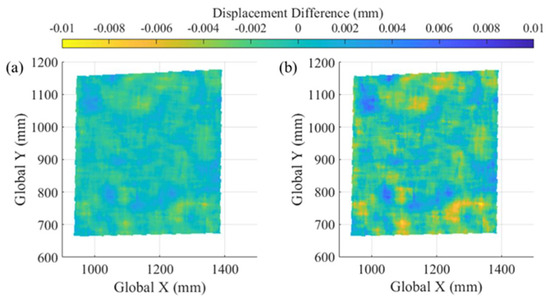
Figure 7.
Evaluation of the noise floors of the displacement of the planar target extracted using the two calibrations showing the following: (a) the in-plane difference and (b) the out-of-plane difference.
As such, Figure 7 shows the direct point-by-point difference between the cloud reconstructed with the image-based calibration and the one reconstructed with the sensor-based calibration. The values of the in-plane difference are overlayed on the cloud in Figure 7a, while the values of the out-of-plane difference are overlayed on the cloud in Figure 7b. As shown in Figure 7, the correspondence in NF between the two calibration methods is evident, with a measurement difference in the ±0.01 mm range. However, to further quantify the statistical differences between the two calibrations, the two point clouds obtained with each calibration were converted into probability distributions and compared using the Kullback–Leibler Divergence (KLD), defined as follows:
In (10), P(i) and Q(i) are the probability density functions of the distributions representing the NF measured using the image-based and the sensor-based calibrations, respectively. The formulation in (10) yields the KLD in natural units of information (nats), with values ranging from zero to positive infinity. Distributions with very high similarity are characterized by values of the KLD that are very close to zero, while values increase rapidly as the similarity between the two distributions decreases.
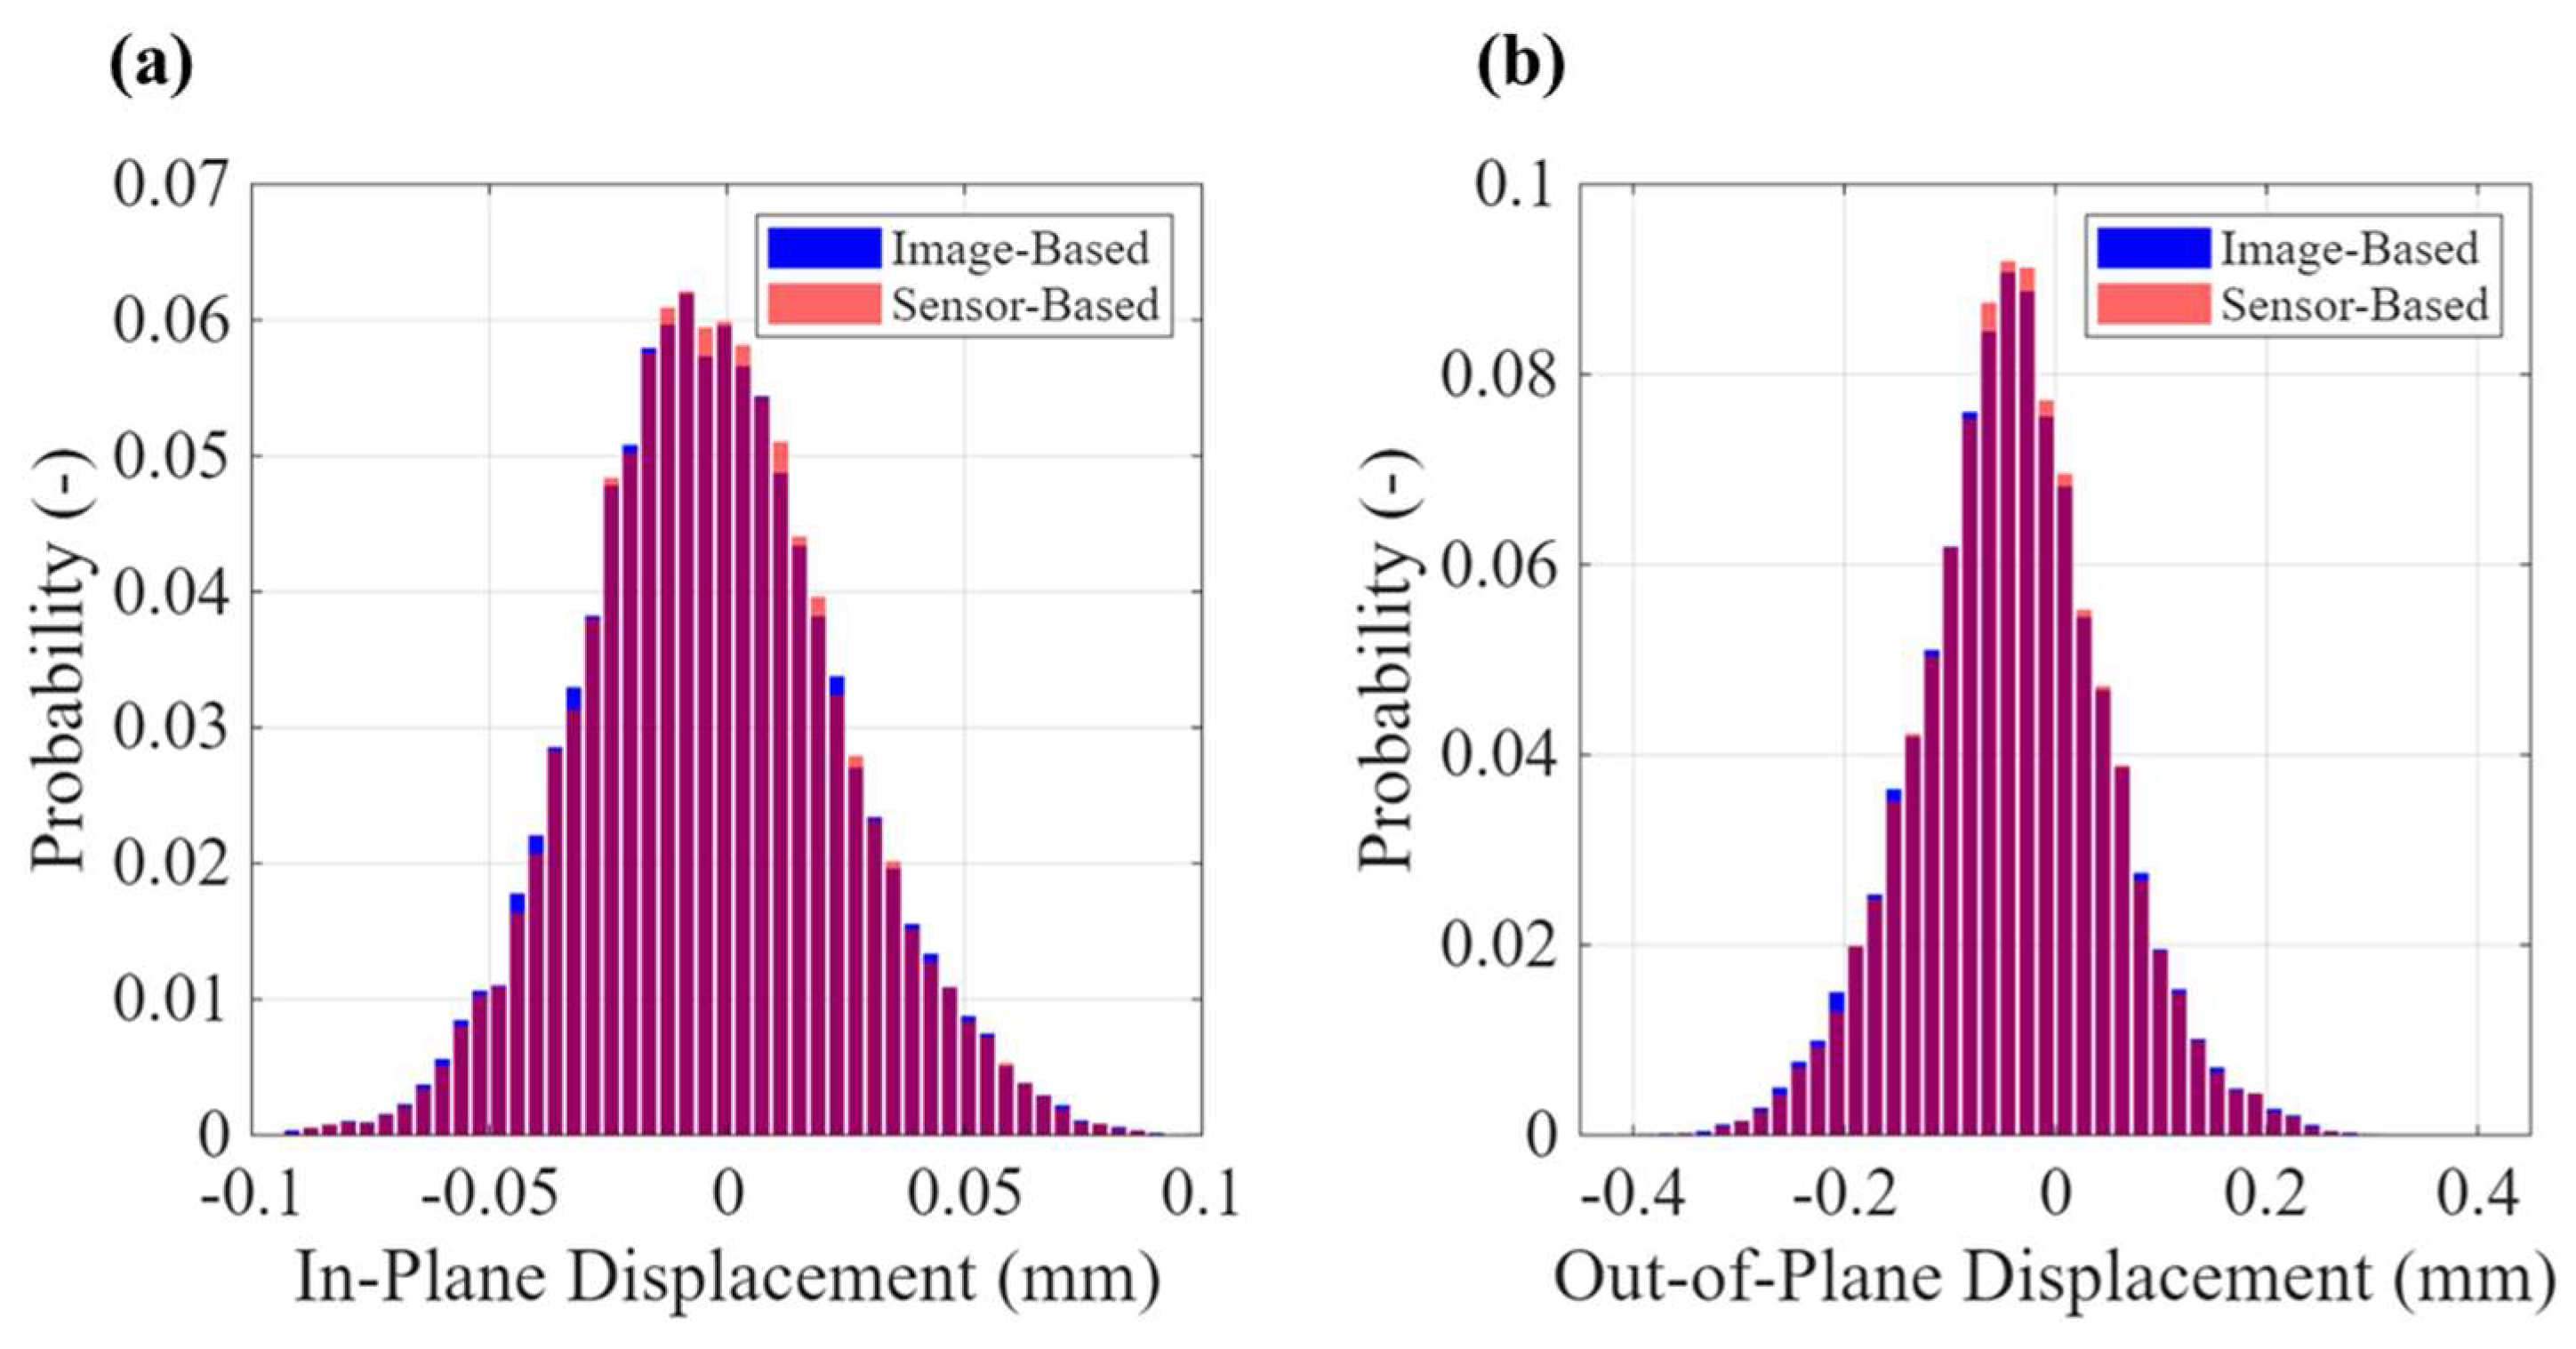
In Figure 8, the similarity between the NF computed with the two methods is apparent in the overlap between the histograms of the distributions. Computing the KLD for the distributions shown in Figure 8 yielded values of 0.00067 nats for the in-plane displacement and 0.00108 nats for the out-of-plane displacement, indicating a very high similarity between the noise distributions obtained with different calibrations.
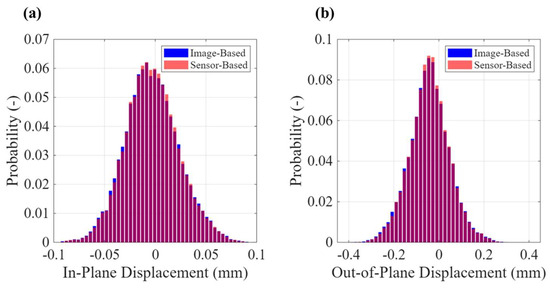
Figure 8.
Histograms of the noise floors of the displacement of the planar target extracted using the two calibrations showing the following: (a) in-plane displacements and (b) out-of-plane displacements.
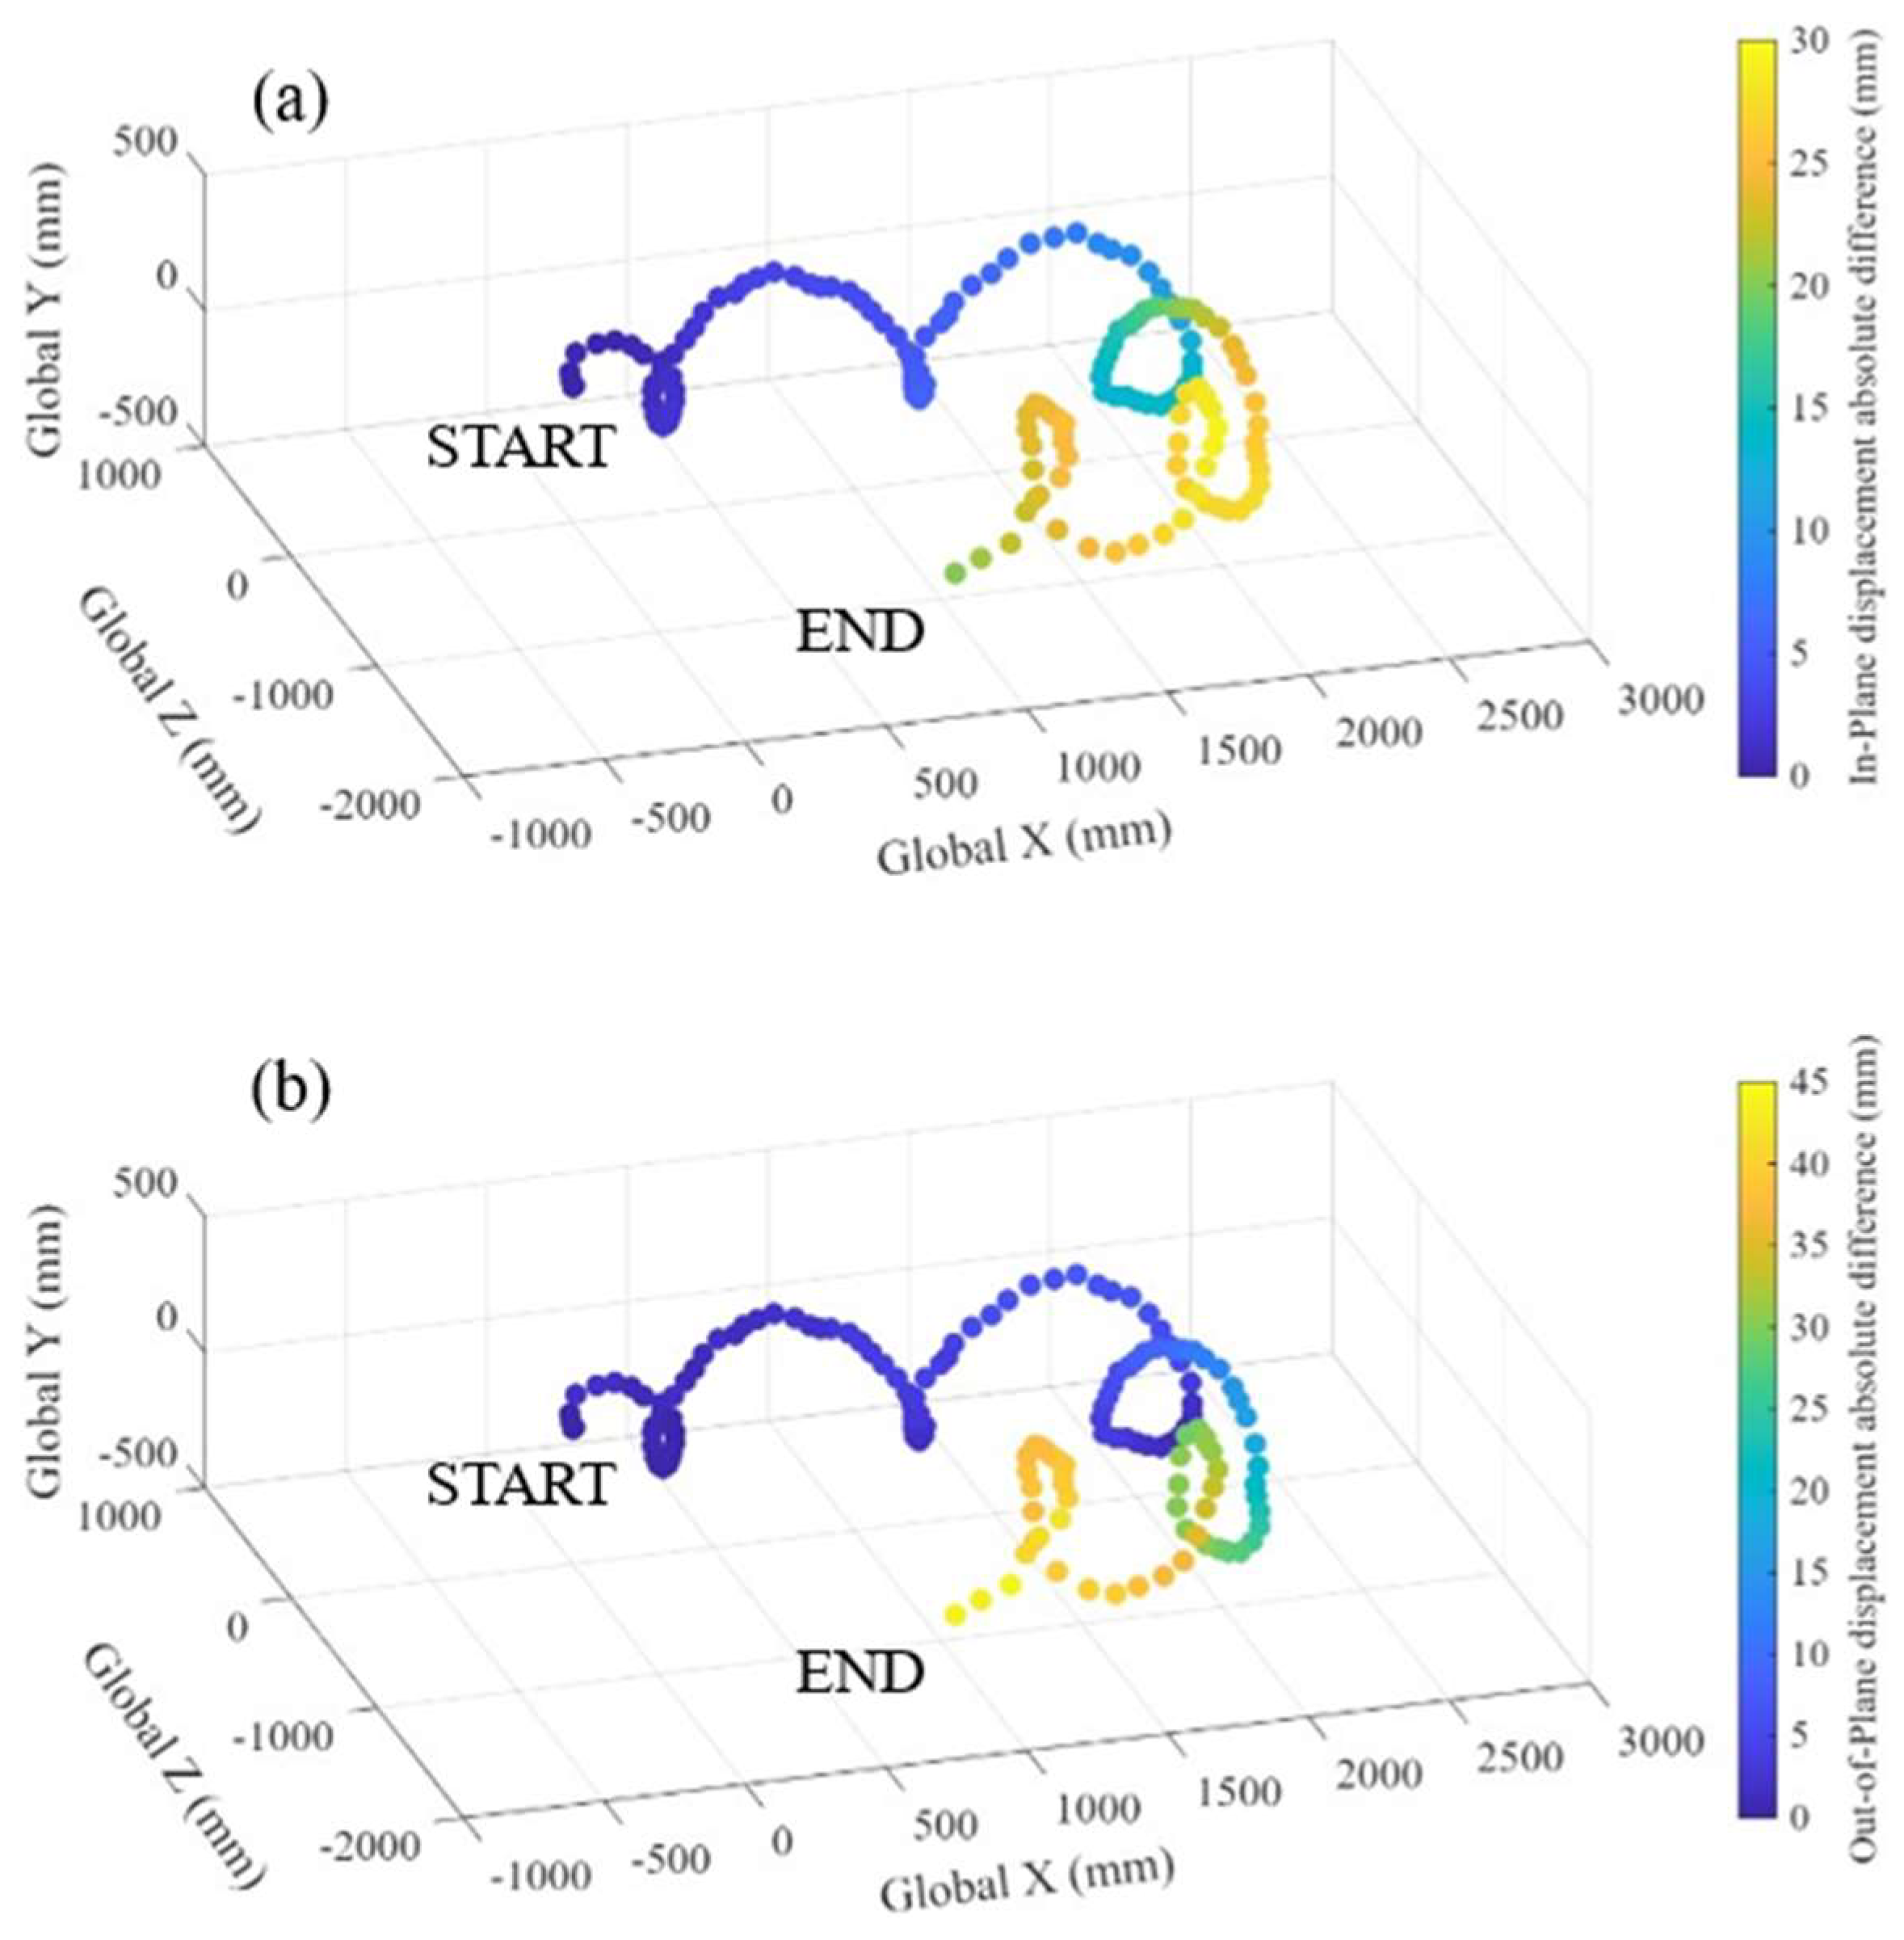
After completing the NF analysis, the 150 stereo images collected were processed with DICe to extract the 3D displacement of the planar target. For visualization purposes, the complete set of coordinates of the point cloud reconstructed at each stereo frame was averaged to extract the coordinates of the centroid of the target, and its 3D trajectory is shown in Figure 9. The averaging is justified thanks to the imparted 3D displacement being a purely rigid motion.
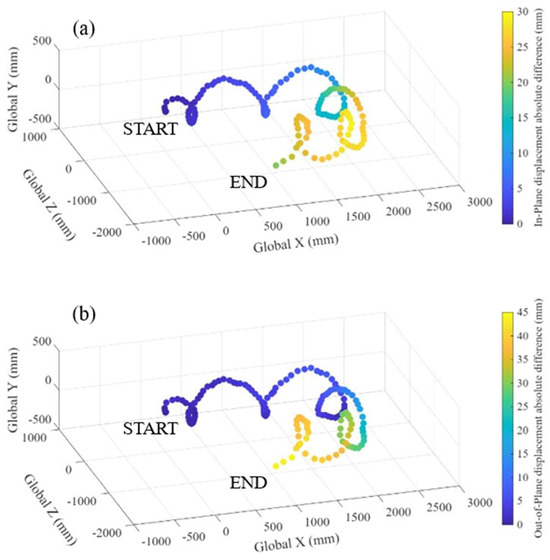
Figure 9.
Comparison of the rigid 3D displacements of the planar target obtained when the stereo cameras were calibrated using the two methods: (a) absolute difference in the measured in-plane displacements, showing a relative difference up to 1.5%, and (b) absolute difference in the measured out-of-plane displacements, showing a relative difference up to 3.2%.
In Figure 9, the differences between the in-plane and out-of-plane measurements obtained with the two calibration methods are superimposed onto the trajectory of the planar target, similarly to the approach shown in Figure 7. An animation showing the 3D motion of the point clouds computed using the two calibration methods can be found in Video S1 in the Supplementary Material of this manuscript.
From a quantitative perspective, at the maximum in-plane displacement of approximately 2 m, the two methods yield in-plane displacements that differ by 30 mm, corresponding to a relative difference of approximately 1.5% over the entire displacement range. At the out-of-plane displacement of 1.4 m, the two methods differ by 45 mm, resulting in a relative difference of approximately 3.2%. Once again, these results demonstrate excellent agreement between the two calibration methods, thus demonstrating the accuracy of the proposed approach for the 4 m × 3 m × 3.5 m FOV.
4.2. Results of Test #2: Impact Test on Mock Three-Story Building
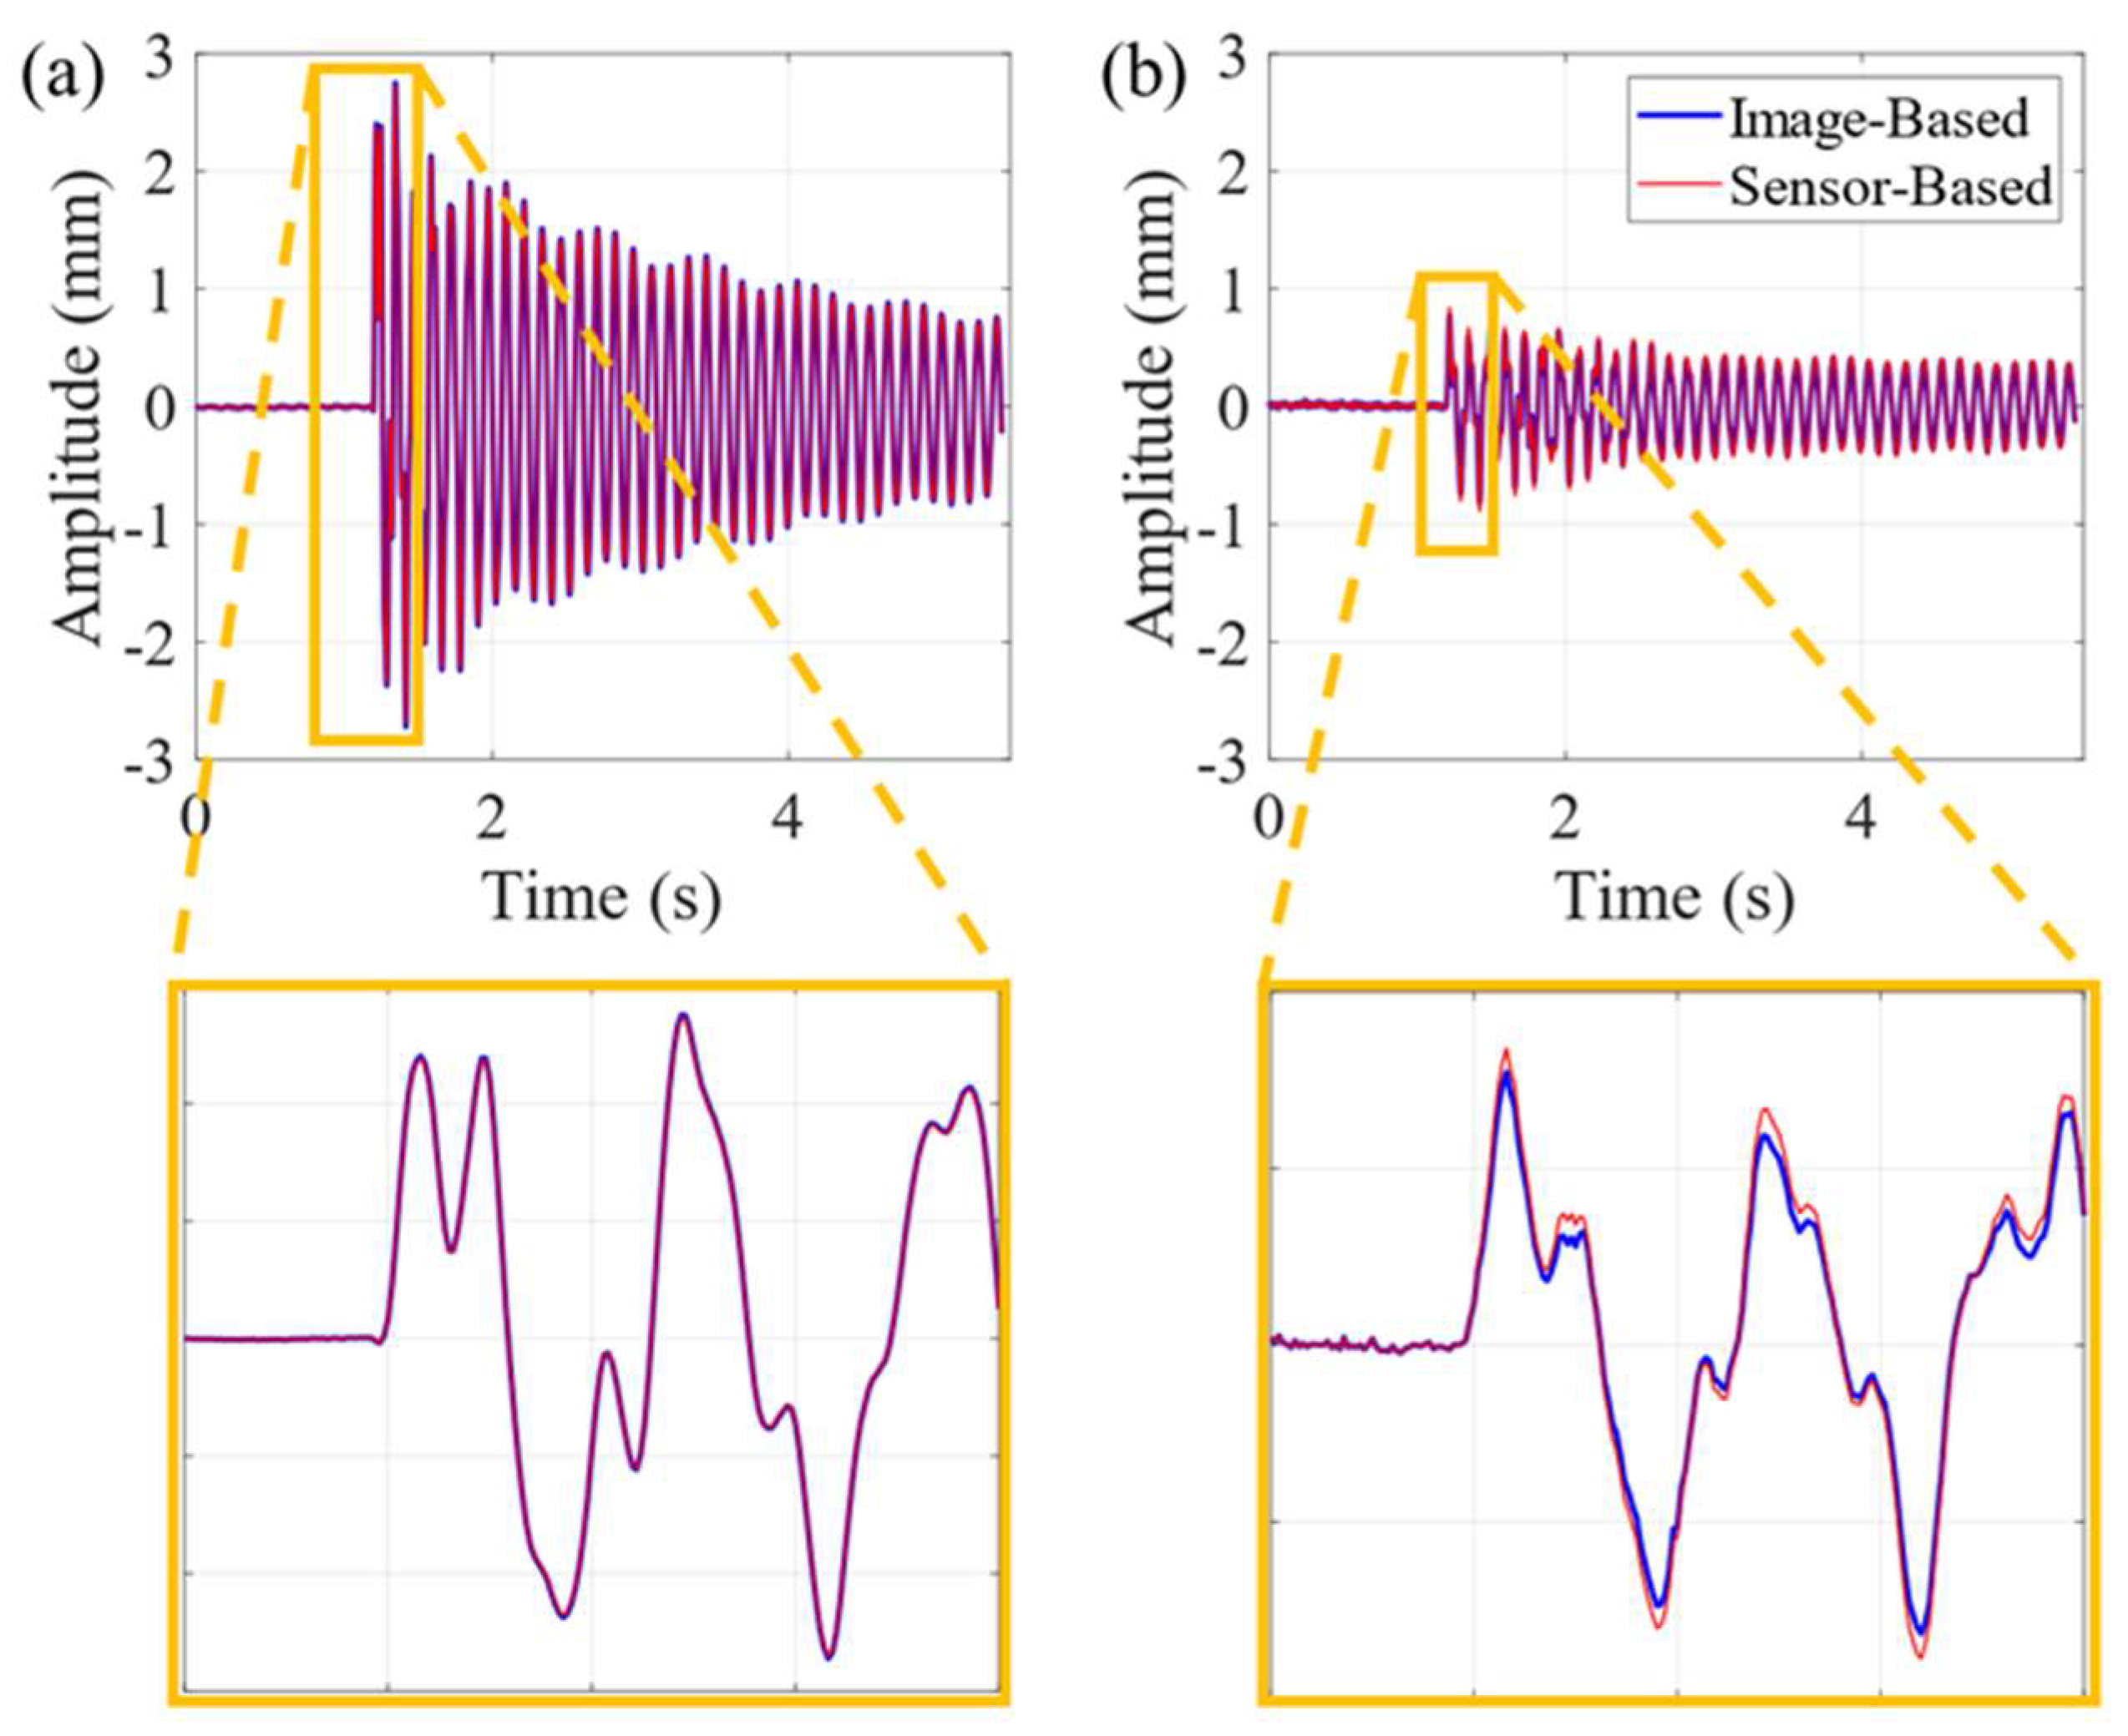
For Test #2, the displacements measured with the stereo cameras from the optical targets visible in Figure 6 were extracted using 3D-PT and used to compute the frequency response of the mock building. In particular, Figure 10 shows the in-plane and out-of-plane time histories measured using the stereo camera calibrated with the image-based and the sensor-based approach from one of the optical targets on the second floor. The correlation between the time histories, expressed in terms of time response assurance criterion (TRAC), equals 100% and 99.88% for the in-plane and out-of-plane cases, respectively. It should also be noted that the time histories of only one optical target are reported for the sake of brevity, with the remaining eleven targets all having similar correlation. The results calculated on the twelve measurement points show TRAC values equal to 1.0000 and 0.9981 ± 0.0012 for the in-plane and out-of-plane cases, respectively.
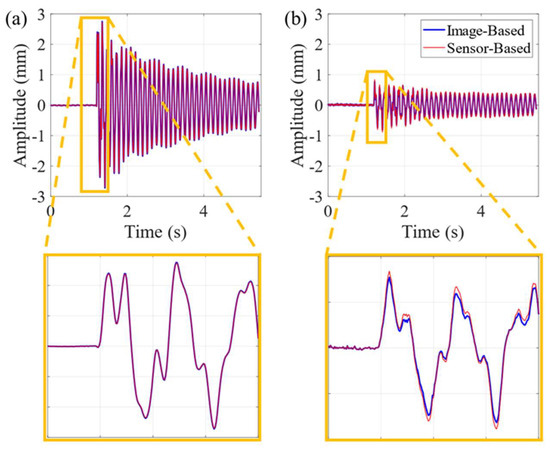
Figure 10.
Time domain results for Test #2, measured with both calibration methods: (a) in-plane displacement measured with the stereo cameras, (b) out-of-plane displacement measured with the stereo cameras. In both cases, a zoomed-in section is highlighted to show the difference between the two measurement methods.
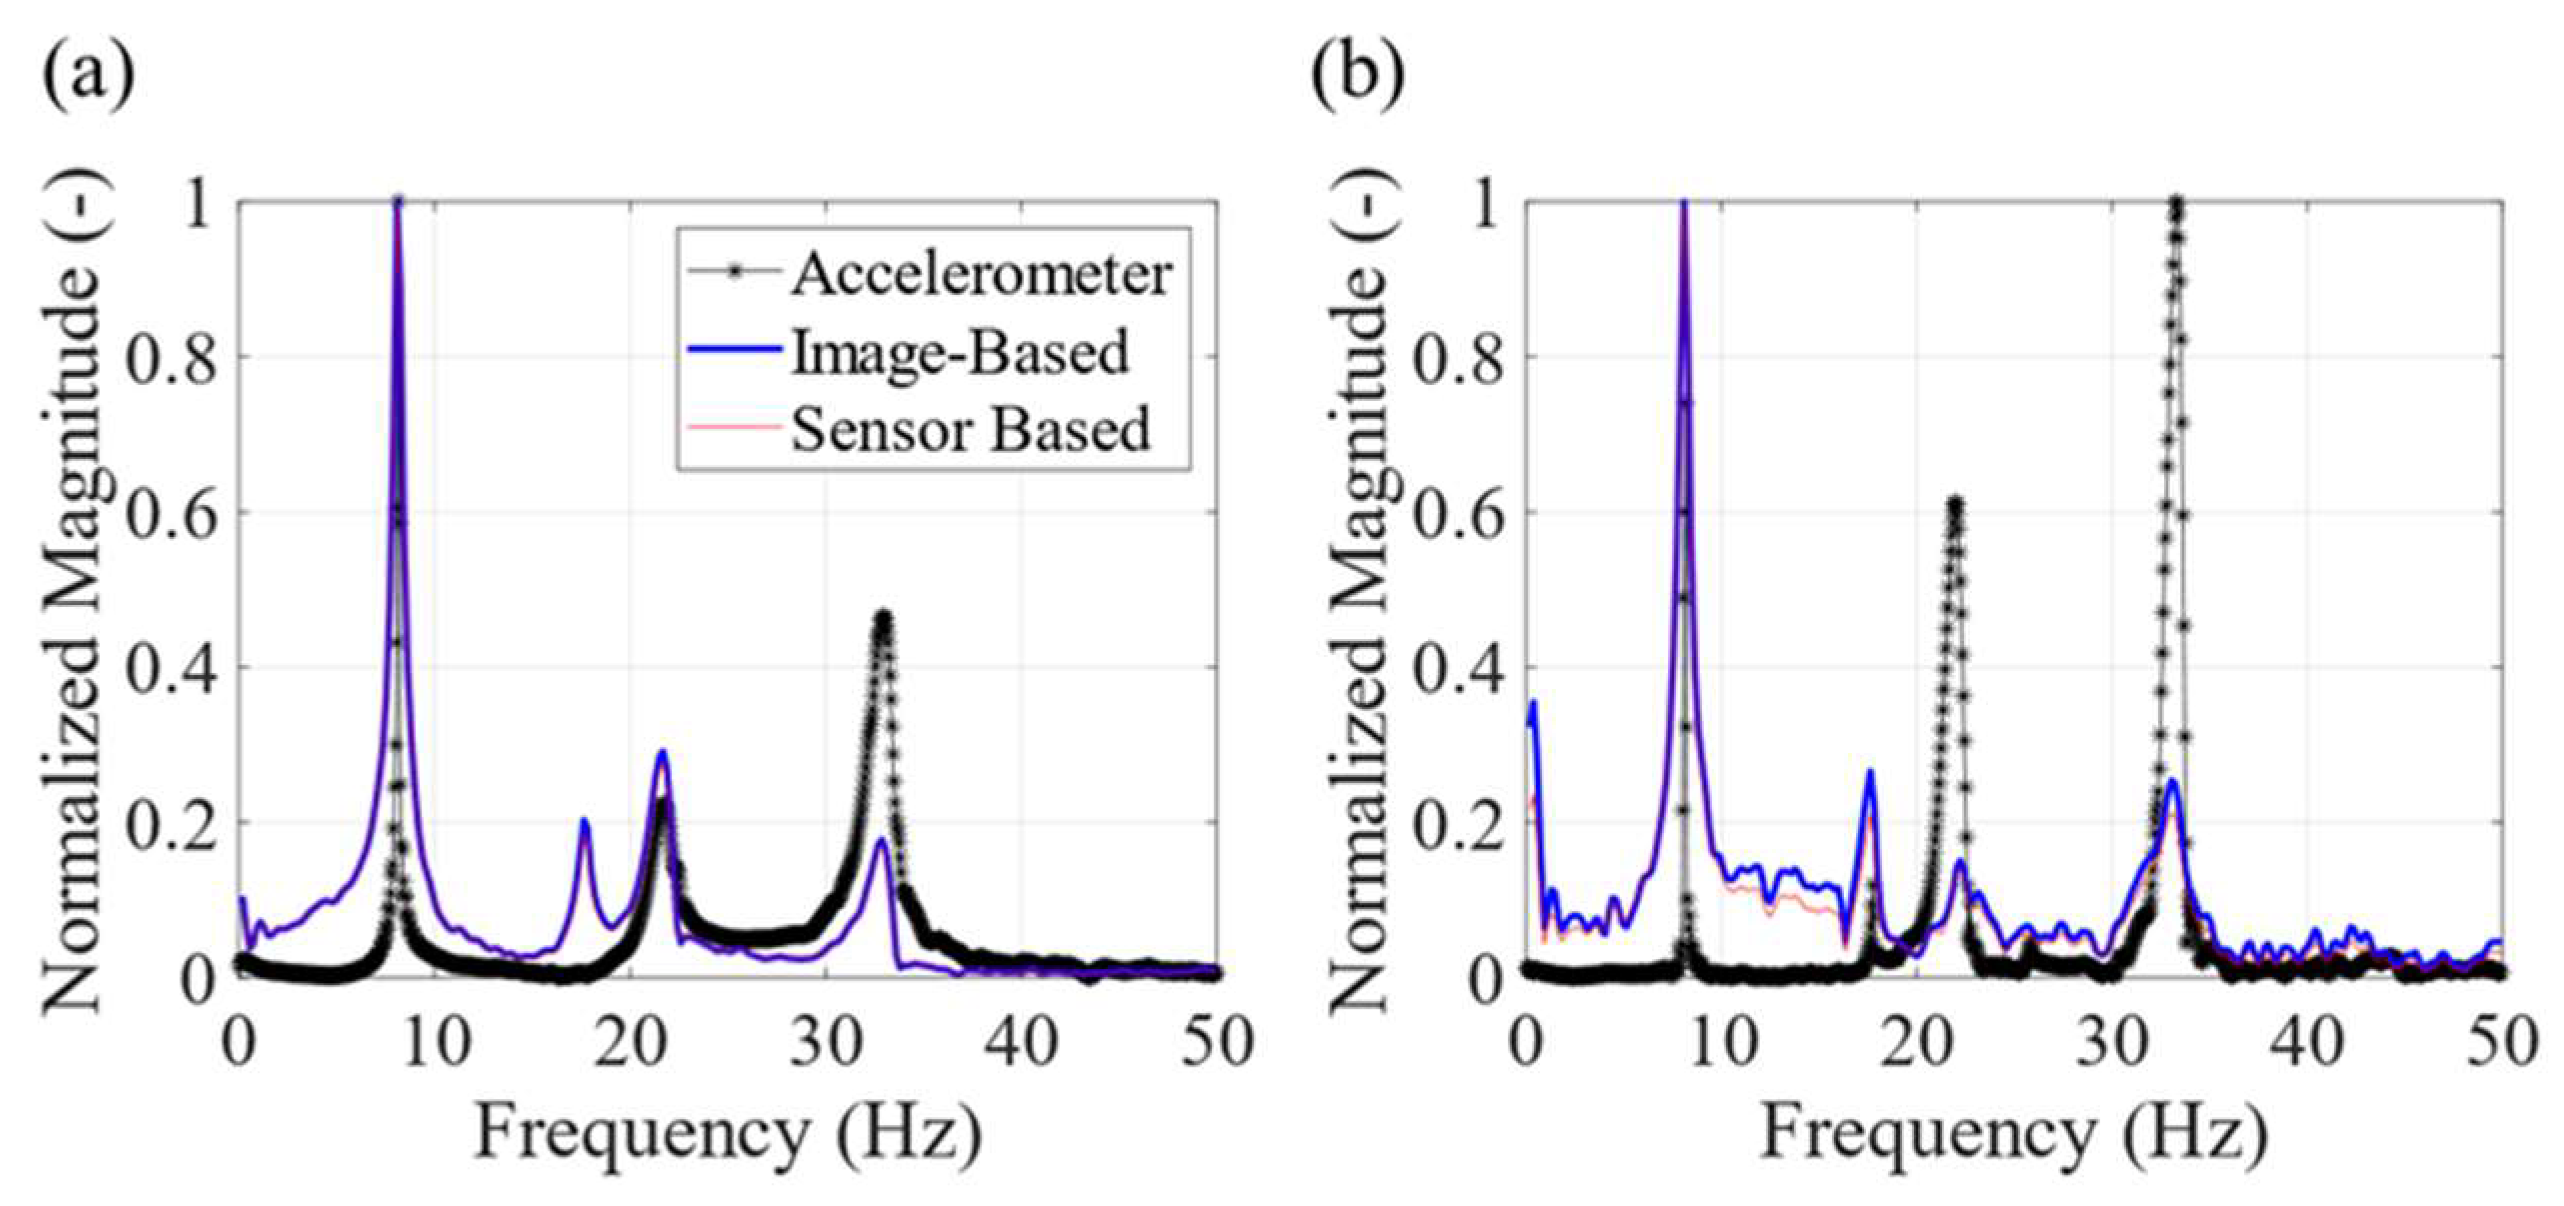
Figure 11 shows the spectra of the in-plane and out-of-plane displacements measured from the data recorded on the second floor of the mock building with the accelerometers and stereo camera calibrated using the two methods. The resonant frequencies extracted are summarized in Table 3. Because the input data for the Fourier Transform are acceleration in g from the accelerometers and displacement in mm from the cameras, the frequency spectra shown in Figure 11 were normalized to the maximum magnitude for easier visualization.
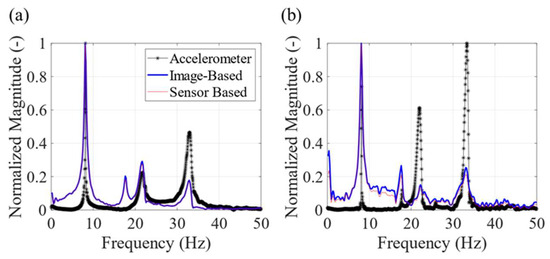
Figure 11.
Frequency domain results for Test #2, measured with both calibration methods and the accelerometers: (a) in-plane normalized frequency spectra obtained with the stereo cameras and the accelerometers and (b) out-of-plane normalized frequency spectra obtained with the stereo cameras and the accelerometers.

Table 3.
Resonant frequencies of the mock building from Test #2, computed with the three different methods.
As shown in Table 3, the optical and accelerometer spectra agree within fractions of a Hz for relative differences well below 1% at higher frequencies. In comparison, the sensor-based spectrum shows 100% agreement with the image-based spectrum, further validating the use of the proposed sensor-based method to obtain the calibration parameters.
In addition, it is possible to observe that the data extracted with the stereo cameras can identify a resonant frequency of ~17.63 Hz, corresponding to the first mixed bending mode of the mock building. In the accelerometer spectra, this resonant frequency is only visible when data extracted from the accelerometer pointing in the +Z direction are used (see Figure 11b). When the correlation of the frequency spectra extracted from the stereo cameras calibrated using the two approaches is assessed in terms of the frequency response assurance criterion (FRAC), values of 99.89% and 98.08% are obtained for the in-plane and out-of-plane cases. When the response of all the twelve optical targets is considered, the average FRAC is 0.9983 ± 0.0010 for the in-plane and 0.9580 ± 0.0449 for the out-of-plane spectra, respectively. This confirms the excellent agreement when considering that the accuracy of stereophotogrammetry for out-of-plane displacements is between 1/3 and 1/10 the accuracy of the in-plane counterparts.
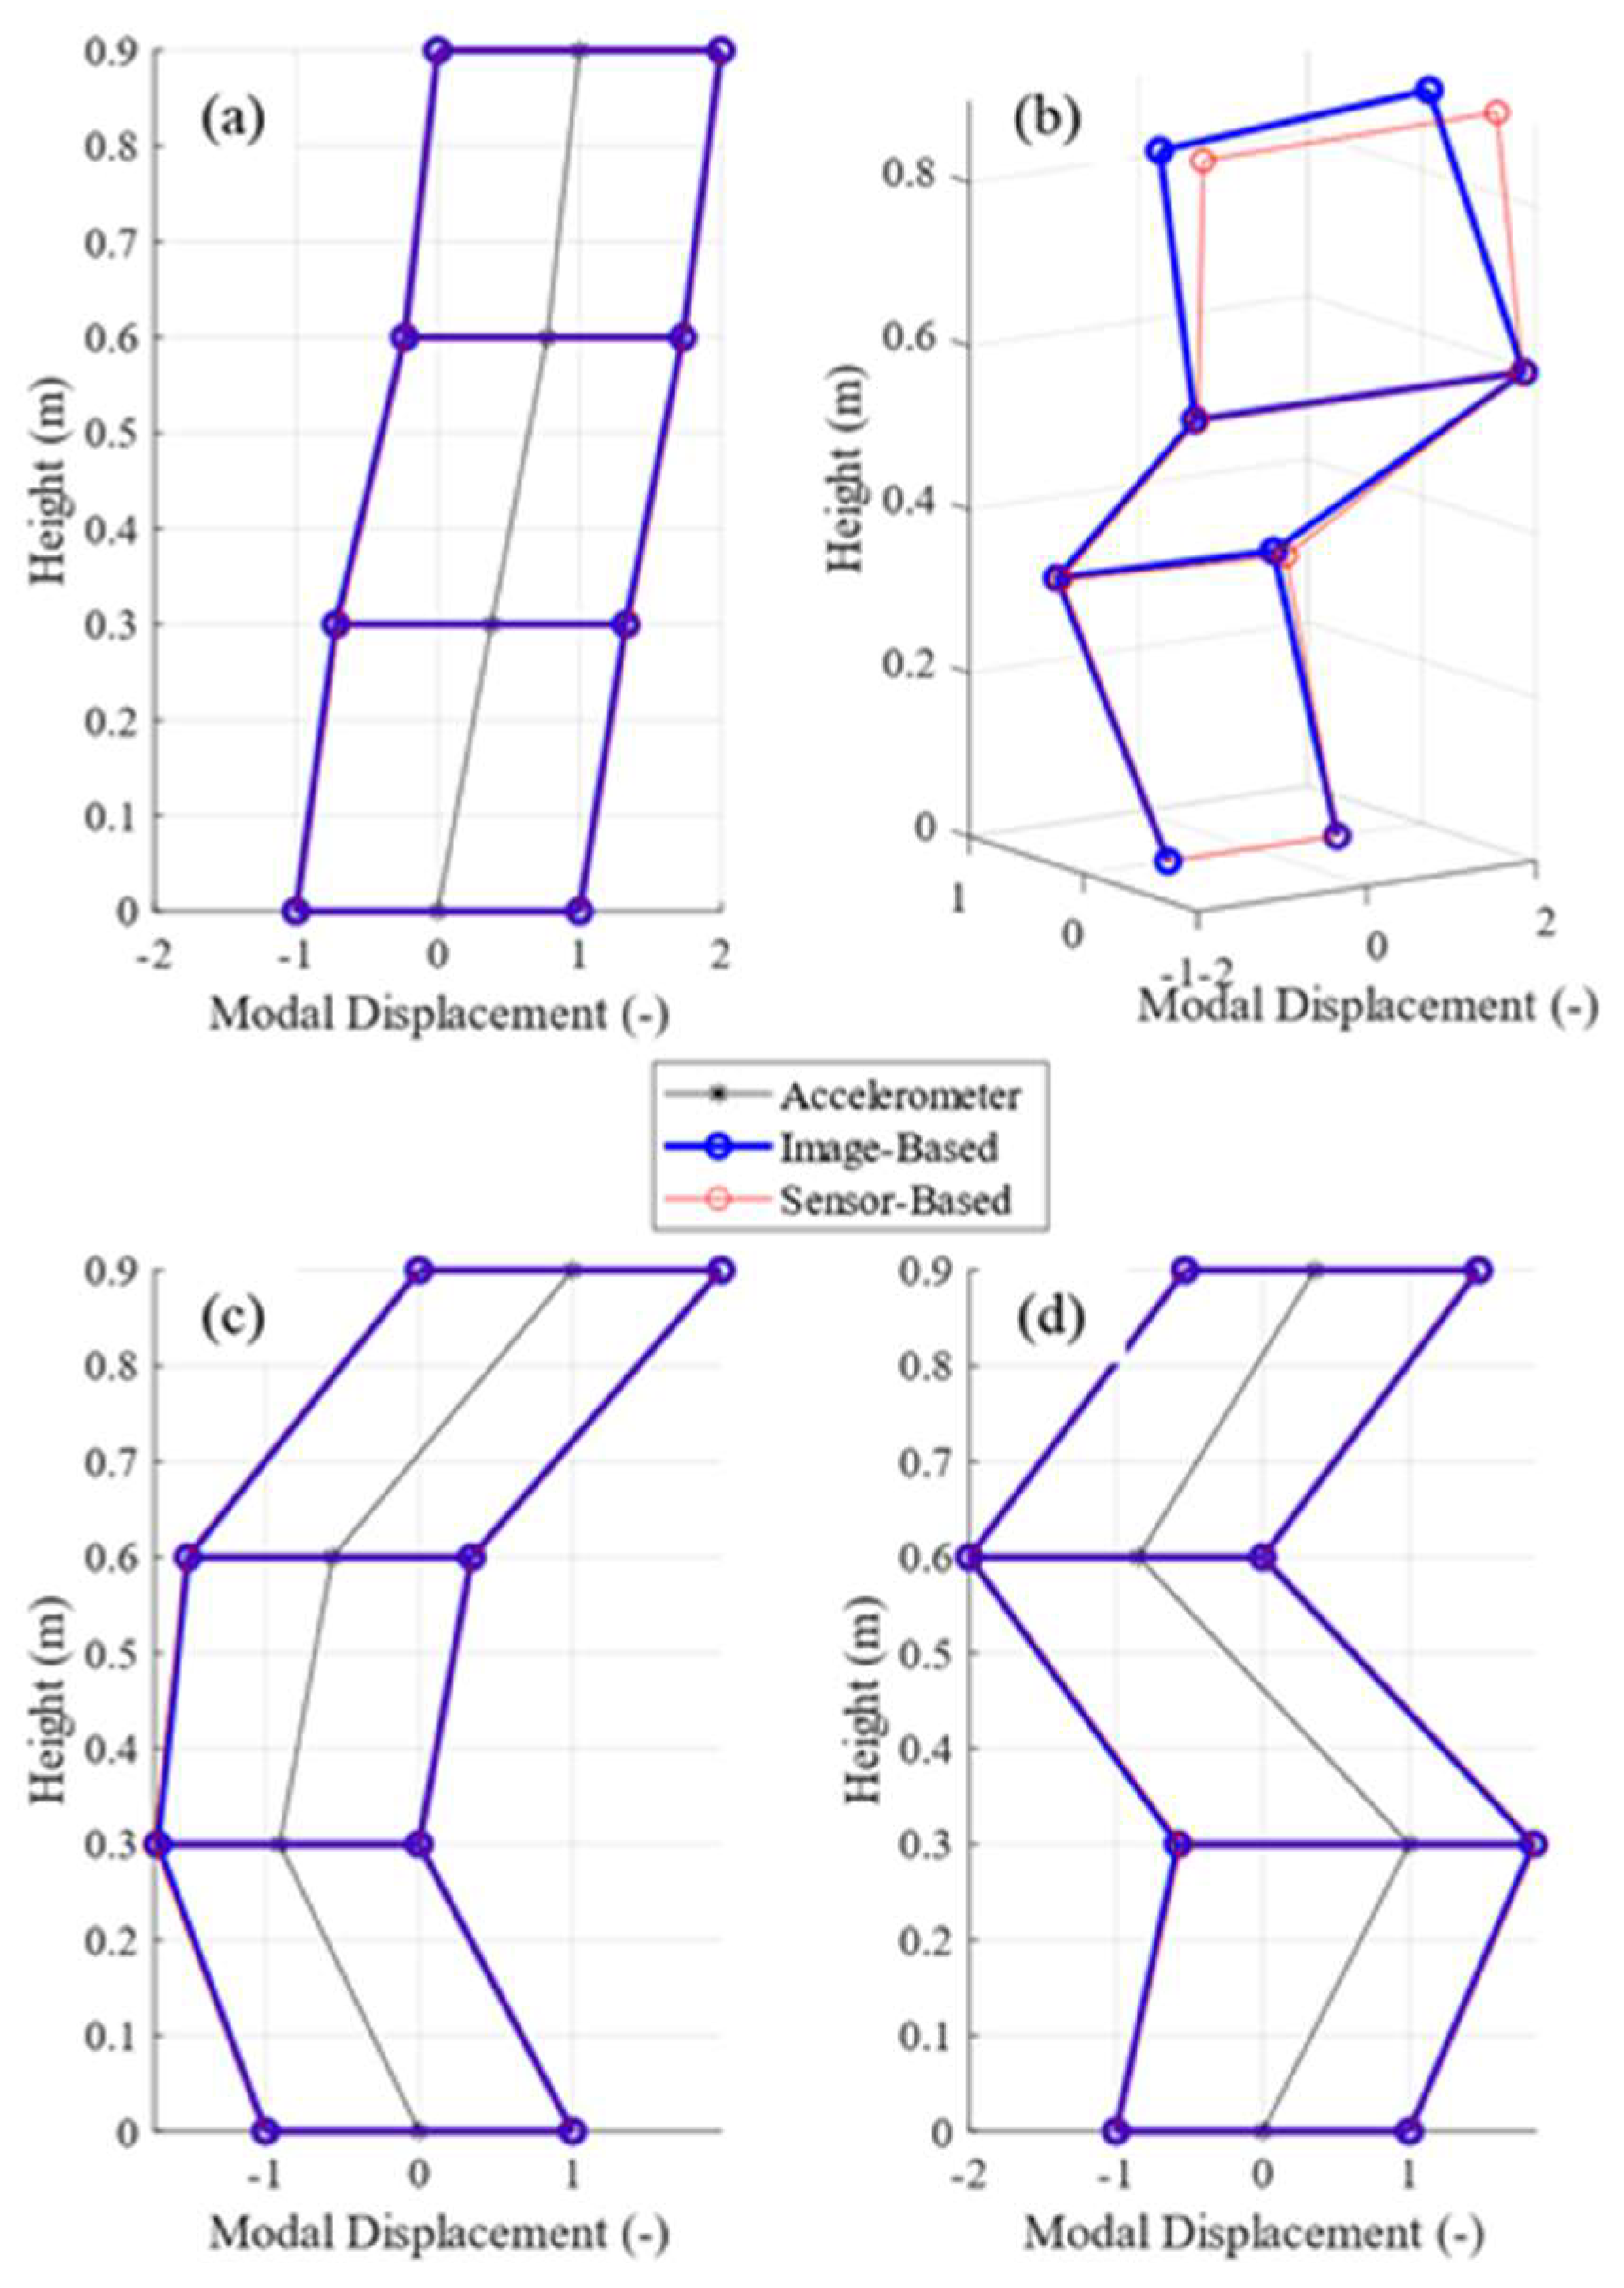
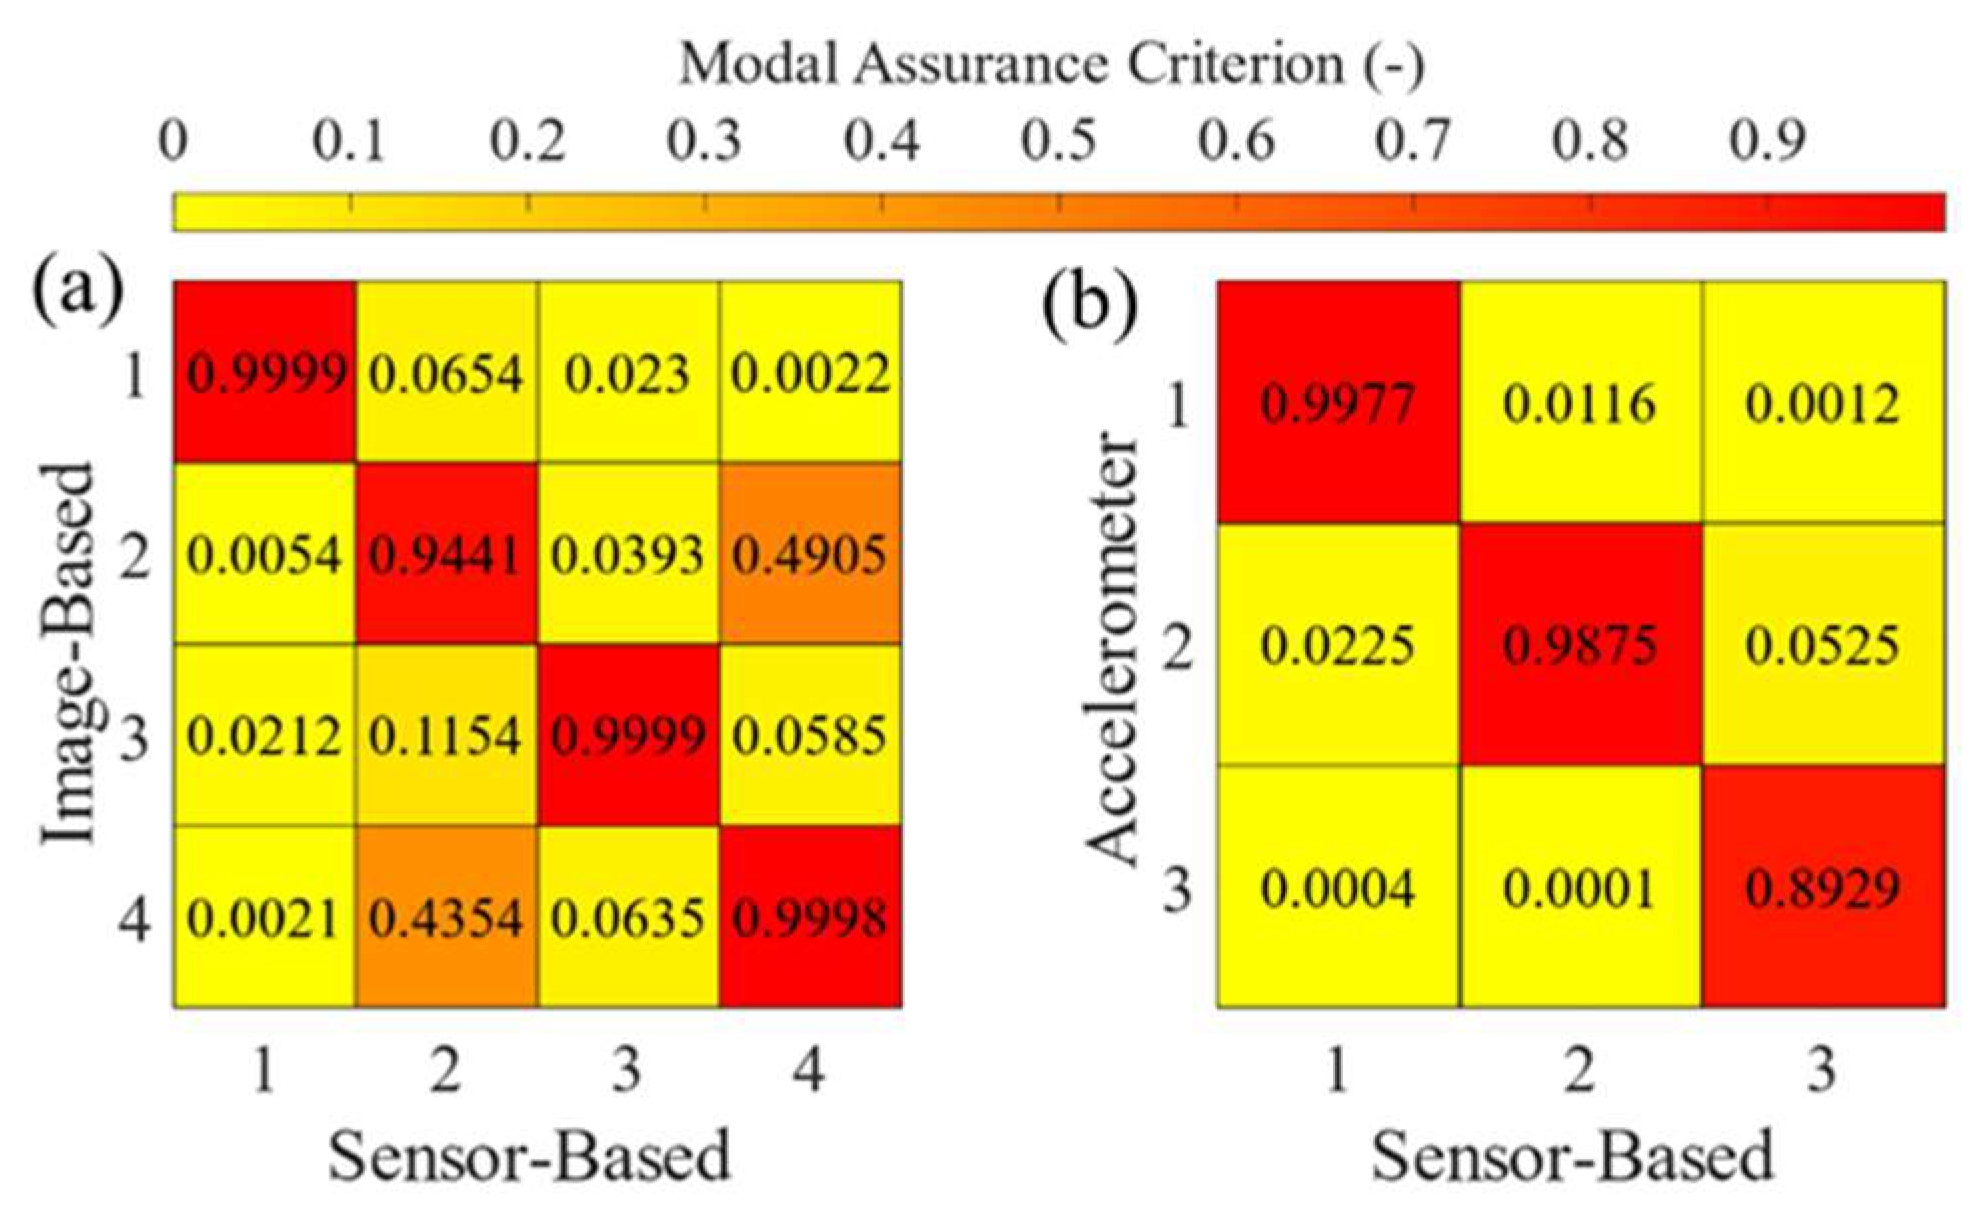
To complete the analysis, the normalized operating deflection shapes (ODSs) of the mock building were extracted (see Figure 12), and the modal assurance criterion (MAC) was used to quantify their accuracy (see Figure 13). A comparison of the ODSs allows for a visually intuitive, qualitative assessment of the structural dynamic responses captured by the proposed sensor-based calibration method and those obtained from established reference techniques. By analyzing the correlation between ODSs, it is possible to determine whether the different methods consistently reflect the same modal behavior under operational conditions. This serves as a strong validation tool, demonstrating that the proposed method accurately captures the vibrational characteristics of the structure. Complementing this, the MAC provides a quantitative metric to evaluate the degree of correlation between two sets of ODS measurements, offering an objective measure of consistency across methods. In this analysis, the MAC was computed using the following equation:
where φi is the mode shape vector extracted from the data of the reference sensors (i.e., image-based calibration or accelerometers) and the sensor-based (SB) calibration. All φi terms are column vectors of length n, corresponding to the number of modes, and the output of the equation listed above is a single MAC value for the specific pair of mode shapes. Repeating the computation for all possible combinations of mode shapes can collect the results into the n × n MAC matrices shown in Figure 13.
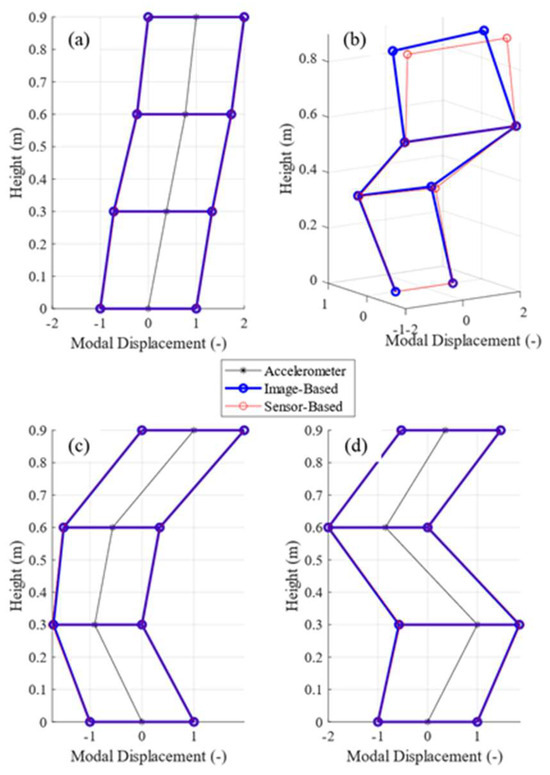
Figure 12.
Normalized operating deflection shapes (ODSs) of the mock building: (a) first bending ODS, (b) first mixed ODS, (c) second bending ODS, and (d) third bending ODS.
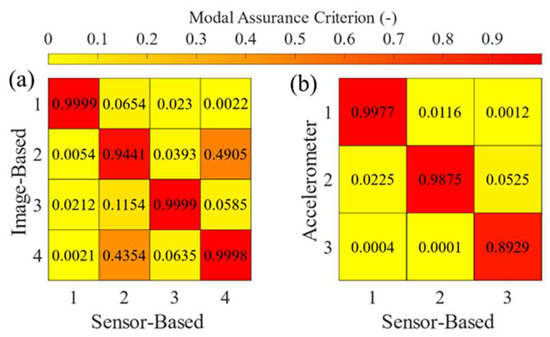
Figure 13.
MAC matrices of the ODSs extracted using the three processing methods: (a) image-based vs. sensor-based and (b) accelerometer vs. sensor-based.
As shown in Figure 12a–d, the ODSs extracted from the data processed using the sensor-based calibration correlate very well with the ODSs extracted with the other two methods. Similar consideration can be drawn when the MAC matrices shown in Figure 13 are analyzed. The matrices show excellent agreement in all ODSs between the sensor-based calibration and the other two methods used as a reference, showing a MAC above 94% when comparing the sensor-based calibration to the image-based calibration and a MAC constantly above 89% when comparing the sensor-based calibration to the accelerometers.
It should be noted that due to the placement of the accelerometers (see Figure 6), it was not possible to extract the first mixed ODS using the accelerometers’ data. As such, Figure 12b only displays the first mixed ODS extracted using optical data, and Figure 13b shows an MAC matrix containing only the data from the three bending ODSs. Overall, the results show strong agreement between the displacements obtained with the 3D-PT analyses performed using the sensor-based calibration and the data collected with the accelerometers and the image-based calibration.
5. Conclusions
The requirement of collecting images of a calibration object with the same size as the tested object and the time needed for performing the calibration (e.g., ~60 min for an FOV of 4 m × 3 m × 3.5 m and up to 180 min for a 7 m × 7 m FOV) limit the use of stereophotogrammetry for condition monitoring of large-scale structures. This research paper describes the effort to validate the accuracy of a multi-sensor system to extract the extrinsic parameters of a stereo camera system in a more user-friendly way and performs stereophotogrammetry measurements. Two laboratory tests were performed to compare the accuracy of 3D-DIC measurements obtained using the developed sensor-based calibration with a traditional image-based calibration on FOVs at different scales. In the first test on a planar object moving in a 4 m × 3 m × 3.5 m FOV, the sensor-based calibration method showed differences of approximately 1.5% and 3% for in-plane and out-of-plane displacements compared to the image-based calibration. The sensor-based calibration also showed comparable accuracy to accelerometers when used to extract dynamic characteristics of a vibrating object, showing an accuracy above 99% for time domain analysis and above 98% for frequency domain analysis of the targeted system. In all tests performed, the time needed to perform the calibration was approximately 5 min, independent of the calibration volume size. While additional tests are required to validate the robustness of the proposed method for FOVs above 10 m, the analyses presented in this paper demonstrate that sensor-based calibration can be a valid alternative to traditional image-based calibration, yielding comparable accuracy while requiring a fraction of the time and with a much simpler setup that did not need the use of calibration targets with a size comparable to the inspected FOV or cameras secured to a rigid metal bar to prevent calibration loss. It should be noted that the current iteration of the proposed method does not yet allow for real-time recalibration during image acquisition. This is mainly due to the laser measuring the distance data at ~1 Hz, which is too slow to allow the pan–tilt mechanism to follow any motion of the cameras during a test. It does, however, significantly streamline the initial setup and allows for any arbitrary change in camera position between two consecutive tests, thanks to the ability to recompute the extrinsic parameters in seconds. The cameras should still be mounted on two rigid tripods and not allowed to move (at least during image acquisition), but bulky bars and extra-large calibration targets are no longer necessary for large-scale measurements. Future improvements to the proposed method should aim to overcome current hardware limitations, particularly in sensor update rates and synchronization. As previously noted, the primary constraint in the current prototype is the low sampling frequency of the laser (i.e., 1 Hz). Increasing this rate, achieving sub-millisecond synchronization across sensors, and implementing feedback control on the servomotors driving the laser’s pan–tilt mechanism would significantly enhance system responsiveness and enable support for more dynamic and real-time applications. If further developed, the proposed sensor-based calibration method can change how SHM is performed for large structures. This includes certification tests of utility-scale wind turbine blades and a 3D analysis of operational wind turbines without having to shut down the turbine, thus saving significant time and money. In addition, the proposed sensor-based calibration could even be used to improve how bridges are monitored with stereo cameras that can stand on different parts of the bridge, move without needing to be connected to a rigid camera bar, and be calibrated “on the go” without the need for ad hoc calibration panels. The approach presented offers the ability to make static or dynamic measurements of large-scale structures (e.g., >10 m) over an entire region of interest without the need for physically attaching, powering, and communicating with numerous sensors.
6. Patents
The sensor-based calibration validated in this article is made possible thanks to the invention patented, U.S. Patent No. US20210006725A1: “Image capturing system, method, and analysis of objects of interest,” by C. Niezrecki and A. Sabato.
Supplementary Materials
The following supporting information can be downloaded at: https://www.mdpi.com/article/10.3390/rs17152720/s1, Video S1: Comparison and visualization of the point cloud’s 3D motion extracted using the two calibration methods.
Author Contributions
Conceptualization, F.B., N.A.V., K.J., Y.L., C.N. and A.S.; methodology, F.B., N.A.V., C.N. and A.S.; software, F.B.; validation, F.B.; formal analysis, F.B. and A.S.; investigation, F.B.; resources, N.A.V. and A.S.; data curation, F.B., N.A.V., K.J., Y.L., C.N. and A.S.; writing—original draft preparation, F.B. and N.A.V.; writing—review and editing, K.J., Y.L., C.N. and A.S.; visualization, F.B.; supervision, C.N. and A.S.; project administration, A.S.; funding acquisition, K.J., Y.L., C.N. and A.S. All authors have read and agreed to the published version of the manuscript.
Funding
This material is based upon work supported by the National Science Foundation (NSF) under Award No. 2018992, “MRI: Development of a Calibration System for Stereophotogrammetry to Enable Large-Scale Measurement and Monitoring.” Any opinions, findings, conclusions, or recommendations expressed in this material are those of the authors and do not necessarily reflect the views of the National Science Foundation.
Data Availability Statement
Data will be made available upon reasonable request to the authors.
Conflicts of Interest
The authors declare no conflicts of interest.
Abbreviations
The following abbreviations are used in this manuscript:
| DIC | Digital image correlation |
| DICe | Digital Image Correlation Engine |
| FOV | Field of view |
| FRAC | Frequency response assurance criterion |
| IMU | Inertial measurement unit |
| MAC | Modal assurance criterion |
| ODS | Operational deflection shape |
| PT | Point tracking |
| SHM | Structural health monitoring |
| TRAC | Time response assurance criterion |
References
- Feng, D.; Feng, M.Q. Computer vision for SHM of civil infrastructure: From dynamic response measurement to damage detection—A review. Eng. Struct. 2018, 156, 105–117. [Google Scholar] [CrossRef]
- Dong, C.-Z.; Catbas, F.N. A review of computer vision-based structural health monitoring at local and global levels. Struct. Health Monit. 2021, 20, 692–743. [Google Scholar] [CrossRef]
- Sabato, A.; Dabetwar, S.; Kulkarni, N.N.; Fortino, G. Noncontact Sensing Techniques for AI-Aided Structural Health Monitoring: A Systematic Review. IEEE Sens. J. 2023, 23, 4672–4684. [Google Scholar] [CrossRef]
- Luo, P.F.; Chao, Y.J.; Sutton, M.A.; Peters, W.H. Accurate measurement of three-dimensional deformations in deformable and rigid bodies using computer vision. Exp. Mech. 1993, 33, 123–132. [Google Scholar] [CrossRef]
- Schmidt, T.; Tyson, J.; Galanulis, K. Full-field dynamic displacement and strain measurement using advanced 3D image correlation photogrammetry: Part I. Exp. Tech. 2006, 27, 47–50. [Google Scholar] [CrossRef]
- Reagan, D.; Sabato, A.; Niezrecki, C. Feasibility of using digital image correlation for unmanned aerial vehicle structural health monitoring of bridges. Struct. Health Monit. 2018, 17, 1056–1072. [Google Scholar] [CrossRef]
- Ngeljaratan, L.; Moustafa, M.A. Structural health monitoring and seismic response assessment of bridge structures using target-tracking digital image correlation. Eng. Struct. 2020, 213, 110551. [Google Scholar] [CrossRef]
- Kalaitzakis, M.; Vitzilaios, N.; Rizos, D.C.; Sutton, M.A. Drone-Based StereoDIC: System Development, Experimental Validation and Infrastructure Application. Exp. Mech. 2021, 61, 981–996. [Google Scholar] [CrossRef]
- Sabato, A.; Niezrecki, C. Feasibility of Digital Image Correlation for railroad tie inspection and ballast support assessment. Measurement 2017, 103, 93–105. [Google Scholar] [CrossRef]
- Poozesh, P.; Sabato, A.; Sarrafi, A.; Niezrecki, C.; Avitabile, P.; Yarala, R. Multicamera measurement system to evaluate the dynamic response of utility–scale wind turbine blades. Wind Energy 2020, 23, 1619–1639. [Google Scholar] [CrossRef]
- Khadka, A.; Fick, B.; Afshar, A.; Tavakoli, M.; Baqersad, J. Non-contact vibration monitoring of rotating wind turbines using a semi-autonomous UAV. Mech. Syst. Signal Process. 2020, 138, 106446. [Google Scholar] [CrossRef]
- Guan, B.; Su, Z.; Yu, Q.; Li, Z.; Feng, W.; Yang, D.; Zhang, D. Monitoring the blades of a wind turbine by using videogrammetry. Opt. Lasers Eng. 2022, 152, 106901. [Google Scholar] [CrossRef]
- Dizaji, M.S.; Alipour, M.; Harris, D.K. Leveraging Full-Field Measurement from 3D Digital Image Correlation for Structural Identification. Exp. Mech. 2018, 58, 1049–1066. [Google Scholar] [CrossRef]
- Dizaji, M.S.; Harris, D.K.; Alipour, M. Integrating visual sensing and structural identification using 3D-digital image correlation and topology optimization to detect and reconstruct the 3D geometry of structural damage. Struct. Health Monit. 2022, 21, 2804–2833. [Google Scholar] [CrossRef]
- Gorjup, D.; Slavič, J.; Boltežar, M. Frequency domain triangulation for full-field 3D operating-deflection-shape identification. Mech. Syst. Signal Process. 2019, 133, 106287. [Google Scholar] [CrossRef]
- Curt, J.; Capaldo, M.; Hild, F.; Roux, S. An algorithm for structural health monitoring by digital image correlation: Proof of concept and case study. Opt. Lasers Eng. 2022, 151, 106842. [Google Scholar] [CrossRef]
- LeBlanc, B.; Niezrecki, C.; Avitabile, P.; Chen, J.; Sherwood, J. Damage detection and full surface characterization of a wind turbine blade using three-dimensional digital image correlation. Struct. Health Monit. 2013, 12, 430–439. [Google Scholar] [CrossRef]
- Sutton, M.A.; Orteu, J.-J.; Schreier, H.W. Error Estimation in Stereo-Vision. In Image Correlation for Shape, Motion and Deformation Measurements: Basic Concepts, Theory and Applications; Schreier, H., Orteu, J.-J., Sutton, M.A., Eds.; Springer: Boston, MA, USA, 2009; pp. 225–226. [Google Scholar]
- Zhang, Z. A flexible new technique for camera calibration. IEEE Trans. Pattern Anal. Mach. Intell. 2000, 22, 1330–1334. [Google Scholar] [CrossRef]
- Pan, B. Digital image correlation for surface deformation measurement: Historical developments, recent advances and future goals. Meas. Sci. Technol. 2018, 29, 082001. [Google Scholar] [CrossRef]
- Zhang, J.; Zhu, J.; Deng, H.; Chai, Z.; Ma, M.; Zhong, X. Multi-camera calibration method based on a multi-plane stereo target. Appl. Opt. 2019, 58, 9353–9359. [Google Scholar] [CrossRef]
- Solav, D.; Moerman, K.M.; Jaeger, A.M.; Genovese, K.; Herr, H.M. MultiDIC: An open-source toolbox for multi-view 3D digital image correlation. IEEE Access 2018, 6, 30520–30535. [Google Scholar] [CrossRef]
- Sun, P.; Lu, N.-G.; Dong, M.-L.; Yan, B.-X.; Wang, J. Simultaneous All-Parameters Calibration and Assessment of a Stereo Camera Pair Using a Scale Bar. Sensors 2018, 18, 3964. [Google Scholar] [CrossRef]
- Genovese, K.; Chi, Y.; Pan, B. Stereo-camera calibration for large-scale DIC measurements with active phase targets and planar mirrors. Opt. Express 2019, 27, 9040–9053. [Google Scholar] [CrossRef] [PubMed]
- Chen, B.; Genovese, K.; Pan, B. Calibrating large-FOV stereo digital image correlation system using phase targets and epipolar geometry. Opt. Lasers Eng. 2022, 150, 106854. [Google Scholar] [CrossRef]
- Wang, Y.; Wang, X.; Wan, Z.; Zhang, J. A Method for Extrinsic Parameter Calibration of Rotating Binocular Stereo Vision Using a Single Feature Point. Sensors 2018, 18, 3666. [Google Scholar] [CrossRef]
- Liang, S.; Guan, B.; Yu, Z.; Sun, P.; Shang, Y. Camera Calibration Using a Collimator System. In Computer Vision—ECCV 2024; Springer Nature: Cham, Switzerland, 2025; pp. 374–390. [Google Scholar]
- Liu, Z.; Liang, S.; Guan, B.; Tan, D.; Shang, Y.; Yu, Q. Collimator-assisted high-precision calibration method for event cameras. Opt. Lett. 2025, 50, 4254–4257. [Google Scholar] [CrossRef]
- Qian, S.; Liang, J.; Liang, J.; Ren, M. Hybrid calibration method for a single camera stereo digital image correlation system. Appl. Opt. 2024, 63, 5099–5106. [Google Scholar] [CrossRef]
- Real-Moreno, O.; Rodríguez-Quiñonez, J.C.; Flores-Fuentes, W.; Sergiyenko, O.; Miranda-Vega, J.E.; Trujillo-Hernández, G.; Hernández-Balbuena, D. Camera calibration method through multivariate quadratic regression for depth estimation on a stereo vision system. Opt. Lasers Eng. 2024, 174, 107932. [Google Scholar] [CrossRef]
- Huang, W.; Miao, H.; Jiao, S.; Miao, W.; Xiao, C.; Wang, Y. A planar constraint optimization method to improve camera calibration for imperfect planar targets. Opt. Lasers Eng. 2024, 180, 108273. [Google Scholar] [CrossRef]
- He, Z.; Tan, J.; Lin, Z.; Fu, G.; Liu, Y.; Zheng, Z.; Li, E. Online extrinsic parameters calibration of on-board stereo cameras based on certifiable optimization. Measurement 2025, 242, 115911. [Google Scholar] [CrossRef]
- Huang, J.; Liu, S.; Liu, J.; Jian, Z. Camera calibration optimization algorithm that uses a step function. Opt. Express 2024, 32, 18453–18471. [Google Scholar] [CrossRef]
- D’Amicantonio, G.; Bondarev, E. Automated camera calibration via homography estimation with gnns. In Proceedings of the IEEE/CVF Winter Conference on Applications of Computer Vision, Waikoloa, HI, USA, 3–8 January 2024; pp. 5876–5883. [Google Scholar]
- Song, X.; Kang, H.; Moteki, A.; Suzuki, G.; Kobayashi, Y.; Tan, Z. MSCC: Multi-Scale Transformers for Camera Calibration. In Proceedings of the 2024 IEEE/CVF Winter Conference on Applications of Computer Vision (WACV), Waikoloa, HI, USA, 3–8 January 2024; pp. 3250–3259. [Google Scholar] [CrossRef]
- Duan, Q.; Wang, Z.; Huang, J.; Xing, C.; Li, Z.; Qi, M.; Gao, J.; Ai, S. A deep-learning based high-accuracy camera calibration method for large-scale scene. Precis. Eng. 2024, 88, 464–474. [Google Scholar] [CrossRef]
- Satouri, B.; Abderrahmani, A.E.; Satori, K. End-to-End Artificial Intelligence-Based System for Automatic Stereo Camera Self-Calibration. IEEE Access 2024, 12, 160927–160945. [Google Scholar] [CrossRef]
- Feng, W.; Su, Z.; Han, Y.; Liu, H.; Yu, Q.; Liu, S.; Zhang, D. Inertial measurement unit aided extrinsic parameters calibration for stereo vision systems. Opt. Lasers Eng. 2020, 134, 106252. [Google Scholar] [CrossRef]
- Wang, J.; Guan, B.; Han, Y.; Su, Z.; Yu, Q.; Zhang, D. Sensor-Aided Calibration of Relative Extrinsic Parameters for Outdoor Stereo Vision Systems. Remote Sens. 2023, 15, 1300. Available online: https://www.mdpi.com/2072-4292/15/5/1300 (accessed on 31 July 2025). [CrossRef]
- Kumar, D.; Chiang, C.-H.; Lin, Y.-C. Experimental vibration analysis of large structures using 3D DIC technique with a novel calibration method. J. Civ. Struct. Health Monit. 2022, 12, 391–409. [Google Scholar] [CrossRef]
- Sabato, A.; Reddy, N.; Khan, S.; Niezrecki, C. A novel camera localization system for extending three-dimensional digital image correlation. Proc. SPIE 2018, 10599, 105990Y. [Google Scholar] [CrossRef]
- Sabato, A.; Valente, N.A.; Niezrecki, C. Development of a Camera Localization System for Three-Dimensional Digital Image Correlation Camera Triangulation. IEEE Sens. J. 2020, 20, 11518–11526. [Google Scholar] [CrossRef]
- Bottalico, F.; Valente, N.A.; Dabetwar, S.; Jerath, K.; Luo, Y.; Niezrecki, C.; Sabato, A. A sensor-based calibration system for three-dimensional digital image correlation. Proc. SPIE 2022, 12048, 309–316. [Google Scholar] [CrossRef]
- Bottalico, F.; Niezrecki, C.; Jerath, K.; Luo, Y.; Sabato, A. Sensor-Based Calibration of Camera’s Extrinsic Parameters for Stereophotogrammetry. IEEE Sens. J. 2023, 23, 7776–7785. [Google Scholar] [CrossRef]
- Sturm, P. Pinhole Camera Model. In Computer Vision: A Reference Guide; Ikeuchi, K., Ed.; Springer: Boston, MA, USA, 2014; pp. 610–613. [Google Scholar]
- Zhang, Z. Camera Parameters (Intrinsic, Extrinsic). In Computer Vision: A Reference Guide; Ikeuchi, K., Ed.; Springer: Boston, MA, USA, 2014; pp. 81–85. [Google Scholar]
- Turner, D.Z. An Overview of the Stereo Correlation and Triangulation Formulations Used in DICe; Sandia Report; SAND2017-1875 R; Sandia National Laboratories: Albuquerque, NM, USA, 2017; Available online: https://dicengine.github.io/dice/ (accessed on 31 July 2025).
- Harley, R.; Zisserman, A. Epipolar geometry and the fundamental matrix. In Multiple View Geometry in Computer Vision, 2nd ed.; Hartley, R., Zissermann, A., Eds.; Cambridge University Press: Cambridge, UK, 2004; pp. 239–259. [Google Scholar]
- Yan, K.; Zhao, R.; Liu, E.; Ma, Y. A Robust Fundamental Matrix Estimation Method Based on Epipolar Geometric Error Criterion. IEEE Access 2019, 7, 147523–147533. [Google Scholar] [CrossRef]
- Corke, P.I. A Simple and Systematic Approach to Assigning Denavit–Hartenberg Parameters. IEEE Trans. Robot. 2007, 23, 590–594. [Google Scholar] [CrossRef]
- Turner, D.Z. Digital Image Correlation Engine (DICe) Reference Manual; Sandia Report; SAND2015-10606 O; Sandia National Laboratories: Albuquerque, NM, USA, 2015. [Google Scholar]
Disclaimer/Publisher’s Note: The statements, opinions and data contained in all publications are solely those of the individual author(s) and contributor(s) and not of MDPI and/or the editor(s). MDPI and/or the editor(s) disclaim responsibility for any injury to people or property resulting from any ideas, methods, instructions or products referred to in the content. |
© 2025 by the authors. Licensee MDPI, Basel, Switzerland. This article is an open access article distributed under the terms and conditions of the Creative Commons Attribution (CC BY) license (https://creativecommons.org/licenses/by/4.0/).

