Article

Spatiotemporal Variability of Cloud Parameters and Their Climatic Impacts over Central Asia Based on Multi-Source Satellite and ERA5 Data

1
Institute of Desert Meteorology, China Meteorological Administration, Urumqi 830002, China
2
Field Scientific Experiment Base of Akdala Atmospheric Background, China Meteorological Administration, Ili 835614, China
3
Xinjiang Key Laboratory of Tree-Ring Ecology, Urumqi 830002, China
4
Xinjiang Key Laboratory of Desert Meteorology and Sandstorm, Urumqi 830002, China
*
Author to whom correspondence should be addressed.
Remote Sens. 2025, 17(15), 2724; https://doi.org/10.3390/rs17152724
Submission received: 7 July 2025 / Revised: 4 August 2025 / Accepted: 4 August 2025 / Published: 6 August 2025
(This article belongs to the Section Atmospheric Remote Sensing)

Abstract

As key components of the climate system, clouds exert a significant influence on the Earth’s radiation budget and hydrological cycle. However, studies focusing on cloud properties over Central Asia are still limited, and the impacts of cloud variability on regional temperature and precipitation remain poorly understood. This study uses reanalysis and multi-source remote sensing datasets to investigate the spatiotemporal characteristics of clouds and their influence on regional climate. The cloud cover increases from the southwest to the northeast, with mid and low-level clouds predominating in high-altitude regions. All clouds have shown a declining trend during 1981–2020. According to satellite data, the sharpest decline in total cloud cover occurs in summer, while reanalysis data show a more significant reduction in spring. In addition, cloud cover changes influence the local climate through radiative forcing mechanisms. Specifically, the weakening of shortwave reflective cooling and the enhancement of longwave heating of clouds collectively exacerbate surface warming. Meanwhile, precipitation is positively correlated with cloud cover, and its spatial distribution aligns with the cloud water path. The cloud phase composition in Central Asia is dominated by liquid water, accounting for over 40%, a microphysical characteristic that further impacts the regional hydrological cycle.

1. Introduction

Clouds are a crucial component of the Earth’s climate system, significantly influencing the radiation balance, hydrological cycle, and regional climate change through their spatiotemporal distribution [1,2,3,4]. Cloud properties are categorized into macro-physical and microphysical characteristics. Macro-physical properties encompass cloud cover, cloud top height, and cloud base height (CBH), whereas microphysical features include total column cloud ice water (TCIW), total column cloud liquid water (TCLW), and cloud particle radius. Clouds can be classified into different types based on these macro- and microphysical characteristics [5,6].
Cloud formation and evolution are influenced by factors such as topography, atmospheric circulation, and seasonal variability [7,8]. In Asia, the diverse geographical landscape—including high mountain ranges, extensive plateaus, and low-lying plains—results in significant spatial heterogeneity in cloud cover patterns [9,10,11]. For instance, cloud cover in China shows clear regional differences among the southern plains, northeastern provinces, and the Tibetan Plateau [12]. Atmospheric circulation regulates cloud development by modulating the humidity and vertical motion [13]. In East Asia, the summer monsoon delivers abundant moisture, fostering extensive cloud development associated with intense and prolonged precipitation [14]. Moreover, seasonal variability exerts a marked influence on cloud vertical structure. In the Indian monsoon zone, high-level clouds dominate during summer, whereas low- to mid-level clouds prevail in eastern China, with peak cloudiness occurring in winter [15]. In arid and semi-arid regions such as Xinjiang, cloud cover is also subject to pronounced seasonal and spatial variation. Zeng et al. [8] indicated that spring exhibits the highest TCC, with a spatial pattern of high values in the southwest and low in the northeast; in contrast, autumn cloud cover is lowest and displays a northwest-to-southeast decreasing gradient.
Central Asia, home to around 65 million people, features complex topography that contributes to marked hydrological variability and a fragile ecological environment [16,17,18]. Since the early 20th century, surface temperature in Central Asia has increased significantly at a rate of 0.18 °C per decade, surpassing the global average and doubling the rate of warming in the Northern Hemisphere [19]. The rising temperatures profoundly impact the hydrological cycle [20]. Notably, observational data indicate that 97.52% of glaciers in the northern and eastern Tianshan Mountains are retreating [21]. Such glacial changes not only alter the spatiotemporal distribution of regional water resources but also significantly elevate the risk of glacier-related geohazards such as landslides and glacial lake outburst floods [22,23]. Furthermore, water resources in Central Asia exhibit distinct geopolitical characteristics. Upstream countries including Tajikistan and Kyrgyzstan control the flow of transboundary rivers, while downstream nations like Kazakhstan and Uzbekistan heavily rely on these water supplies [24]. The misalignment between hydrological boundaries and political borders creates a complex coupling between climate-driven hydrological changes and regional water security.
Advancements in remote sensing technology have enabled the deployment of cloud radar on aircraft and satellites, facilitating cloud studies. Cloud characteristics can be analyzed using satellite observations, ground-based measurements, and reanalysis datasets. Satellite data sources include the International Satellite Cloud Climatology Project (ISCCP), which integrated observations from multiple geostationary and polar-orbiting satellites, the Clouds and Earth’s Radiant Energy System (CERES), and China’s Fengyun satellites [6,15,25,26]. Among these, ISCCP data stand out for their extensive temporal coverage and global spatial scope. Utilizing imaging radiometers, the ISCCP provides data in visible and infrared channels, making it a valuable resource for studying cloud variation and evaluating model accuracy [27]. Reanalysis datasets relevant to cloud features include the ERA-Interim, the Japanese 55-year reanalysis, and ERA5. The ERA5 dataset, produced by the European Centre for Medium-Range Weather Forecasts (ECMWF), employs the 4D-Var data assimilation system and model forecasts from the Integrate Forecasting System (IFS) CY41R2. Compared to ERA-Interim, ERA5 incorporates improvements in data assimilation, physical parameterizations, and dynamical processes, resulting in enhanced accuracy and resolution [28,29,30]. In Central Asia, the availability of ground-based observations has been limited since the 1980s due to the region’s complex geographical conditions and the discontinuation of numerous meteorological stations. Therefore, this study primarily relies on reanalysis data and satellite remote sensing observations to investigate the cloud characteristics in the region.
Previous studies on cloud features primarily focused on the Tibetan Plateau [6,7,12,27,28,31,32]. In contrast, systematic research on the cloud water resources and cloud characteristics in the arid and semi-arid regions of Central Asia remains scarce. In this context, we utilize the ERA5 reanalysis data and ISCCP satellite observations to analyze the macro and micro-physical characteristics of clouds across different seasons in Central Asia as well as their long-term trends. To further explore cloud and climate interactions, ERA5 skin temperature data and Global Precipitation Climatology Centre (GPCC) precipitation data are incorporated to examine the influence of cloud cover on regional temperature and precipitation. The remainder of this article is structured as follows: Section 2 describes the study area, data, and methodology. Section 3 presents the seasonal and temporal variations in cloud cover over Central Asia and explores its associations with skin temperature and precipitation. Section 4 provides a discussion of the results. Section 5 concludes the study with a summary of the key findings and implications.

2. Materials and Methods

2.1. Data Sources

In this study, we employ the high-resolution (31km) ERA5 reanalysis data [29], covering the period from 1981 to 2020 “https://cds.climate.copernicus.eu/datasets/ (accessed on 7 July 2025)”. The variables include monthly 2 m temperature (T2m), skin temperature, TCC, high cloud cover (HCC), middle cloud cover (MCC), low cloud cover (LCC), CBH, TCIW, and TCLW, with a spatial resolution of 0.25° × 0.25°. The cloud classification in ERA5 is based on the vertical distribution of pressure levels in the model: high clouds are defined as those with pressures below 450 hPa (approximately 6 km), middle clouds are located between 800 and 450 hPa (2–6 km), and low clouds occur within 1000–800 hPa (below 2 km). Previous studies have shown that ERA5 reanalysis data align well with ground-based observations in terms of cloud property parameters [22,33]. The period of 2001–2020, representing the most recent 20-year interval with comprehensive data coverage from all sources, serves as the primary analysis period for this study. Additionally, an extended analysis spanning 1981–2020 (40 years) is conducted to better capture long-term trends in cloud amount.
The ISCCP dataset provides monthly TCC from 1984 to 2016 “http://isccp.giss.nasa.gov/ (accessed on 7 July 2025)” at a spatial resolution of 1° × 1°. The period 1984–2016 for ISCCP was selected as it captures complete seasonal cycles across the entire record. The ISCCP-H product represents a substantial advancement over earlier versions like ISCCP-D, offering finer spatial and temporal resolution, enhanced data quality, and an extended time series [34]. Cloud types in ISCCP are classified based on cloud top pressure and optical thickness, which differs from the classification scheme used in ERA5. To ensure consistency in cloud cover analysis, this study exclusively utilizes the TCC data from ISCCP.
The CERES instruments are mounted on the Terra, Aqua, and NOAA-20 satellites [35]. CERES provides long-term, stable observations for research on clouds, aerosols, and climate. The CERES Energy Balanced and Filled (EBAF) Edition 4.2 product “https://ceres.larc.nasa.gov/documents/DQ_summaries/CERES_EBAF_Ed4.2_DQS.pdf (accessed on 7 July 2025)” is a level 3 dataset with a spatial resolution of 1° × 1°. Surface fluxes are calculated using a radiative transfer model, combining CERES observations, MODIS/VIIRS cloud properties, and MERRA-2 profiles. This dataset is suitable for analyzing variability on intraseasonal and interannual scales. In this study, we focus on surface upward and downward shortwave and longwave radiation fluxes under both clear-sky and all-sky conditions, covering the period from 2001 to 2020.
This research also utilizes the monthly 0.25° × 0.25° precipitation dataset (2001–2020) provided by the GPCC, which is available on the German Weather Service (DWD) website “http://gpcc.dwd.de (accessed on 7 July 2025)”. The GPCC dataset is derived from a global network of ground-based observation stations and has undergone rigorous quality control and homogenization procedures. In Central Asia, the GPCC incorporates a substantial number of local ground observations, resulting in higher data accuracy than other reanalysis or satellite-derived precipitation products [36,37]. All data are shown in Table 1.

2.2. Study Area

Central Asia comprises Kazakhstan, Kyrgyzstan, Uzbekistan, Tajikistan, Turkmenistan, and China’s Xinjiang region, which is characterized by diverse and complex topography, including plateaus, basins, and deserts (Figure 1a). Xinjiang’s geomorphology is defined by the “three mountains and two basins” configuration, with the Altai Mountains in the north, the Tianshan Mountains in the center, and the Kunlun Mountains in the south.
The Köppen Climate Classification is currently the most widely used method for climate zoning. It divides global climate types based on precipitation, temperature, and their seasonal distribution characteristics [37,38]. Central Asia is categorized into 27 climate types (excluding equatorial types) using ERA5 T2m and GPCC precipitation data (Figure 1b). For analytical clarity, Central Asia is divided into five subregions: Northern Central Asia (NCA), Southern Central Asia (SCA), Pamir Plateau (PMP), Northern Xinjiang (NXJ), and Southern Xinjiang (SXJ). The dominant climate types for each subregion are as follows: NCA is characterized by Dry–desert–cold and Snow–steppe–hot; SCA by Dry–desert–cold and Dry–steppe–cold; PMP by Polar–tundra and Dry–desert–cold; NXJ by Dry–desert–cold and Snow–humid–hot; SXJ by Dry–desert–cold and Polar–tundra (Table 2).

2.3. Methods

The linear trends of TCC, HCC, MCC, LCC, and skin temperature are analyzed using the least squares regression method, and their statistical significance was assessed using the Mann–Kendall test. The Pearson correlation coefficient is then employed to examine the relationships between different cloud types and skin temperature and precipitation in Central Asia, with statistical significance assessed using the Student’s t-test. To investigate the seasonal variations in cloud characteristics, this study defines spring as March to May (MAM), summer as June to August (JJA), autumn as September to November (SON), and winter as December to February (DJF) of the following year.
This study quantifies the influence of clouds on skin temperature by calculating cloud radiative forcing effects [39]. We define the longwave cloud radiative forcing (LWCF), shortwave cloud radiative forcing (SWCF), and net cloud radiative forcing (CRF) using the following equations:
L W C F   = L D s c + L D s a + L U s c L U s a ,
S W C F = S D s c + S D s a + S U s c S U s a ,
C R F = L W C F + S W C F ,
where L D s c ( L D s a ) and S D s c ( S D s a ) represent the downward surface longwave and shortwave radiation under clear-sky (all-sky) conditions, respectively. Similarly, L U s c ( L U s a ) and S U s c ( S U s a ) indicate the upward surface longwave and shortwave radiation under clear-sky (all-sky) conditions, respectively.

3. Results

3.1. Seasonal Variation in Cloud Properties over Central Asia

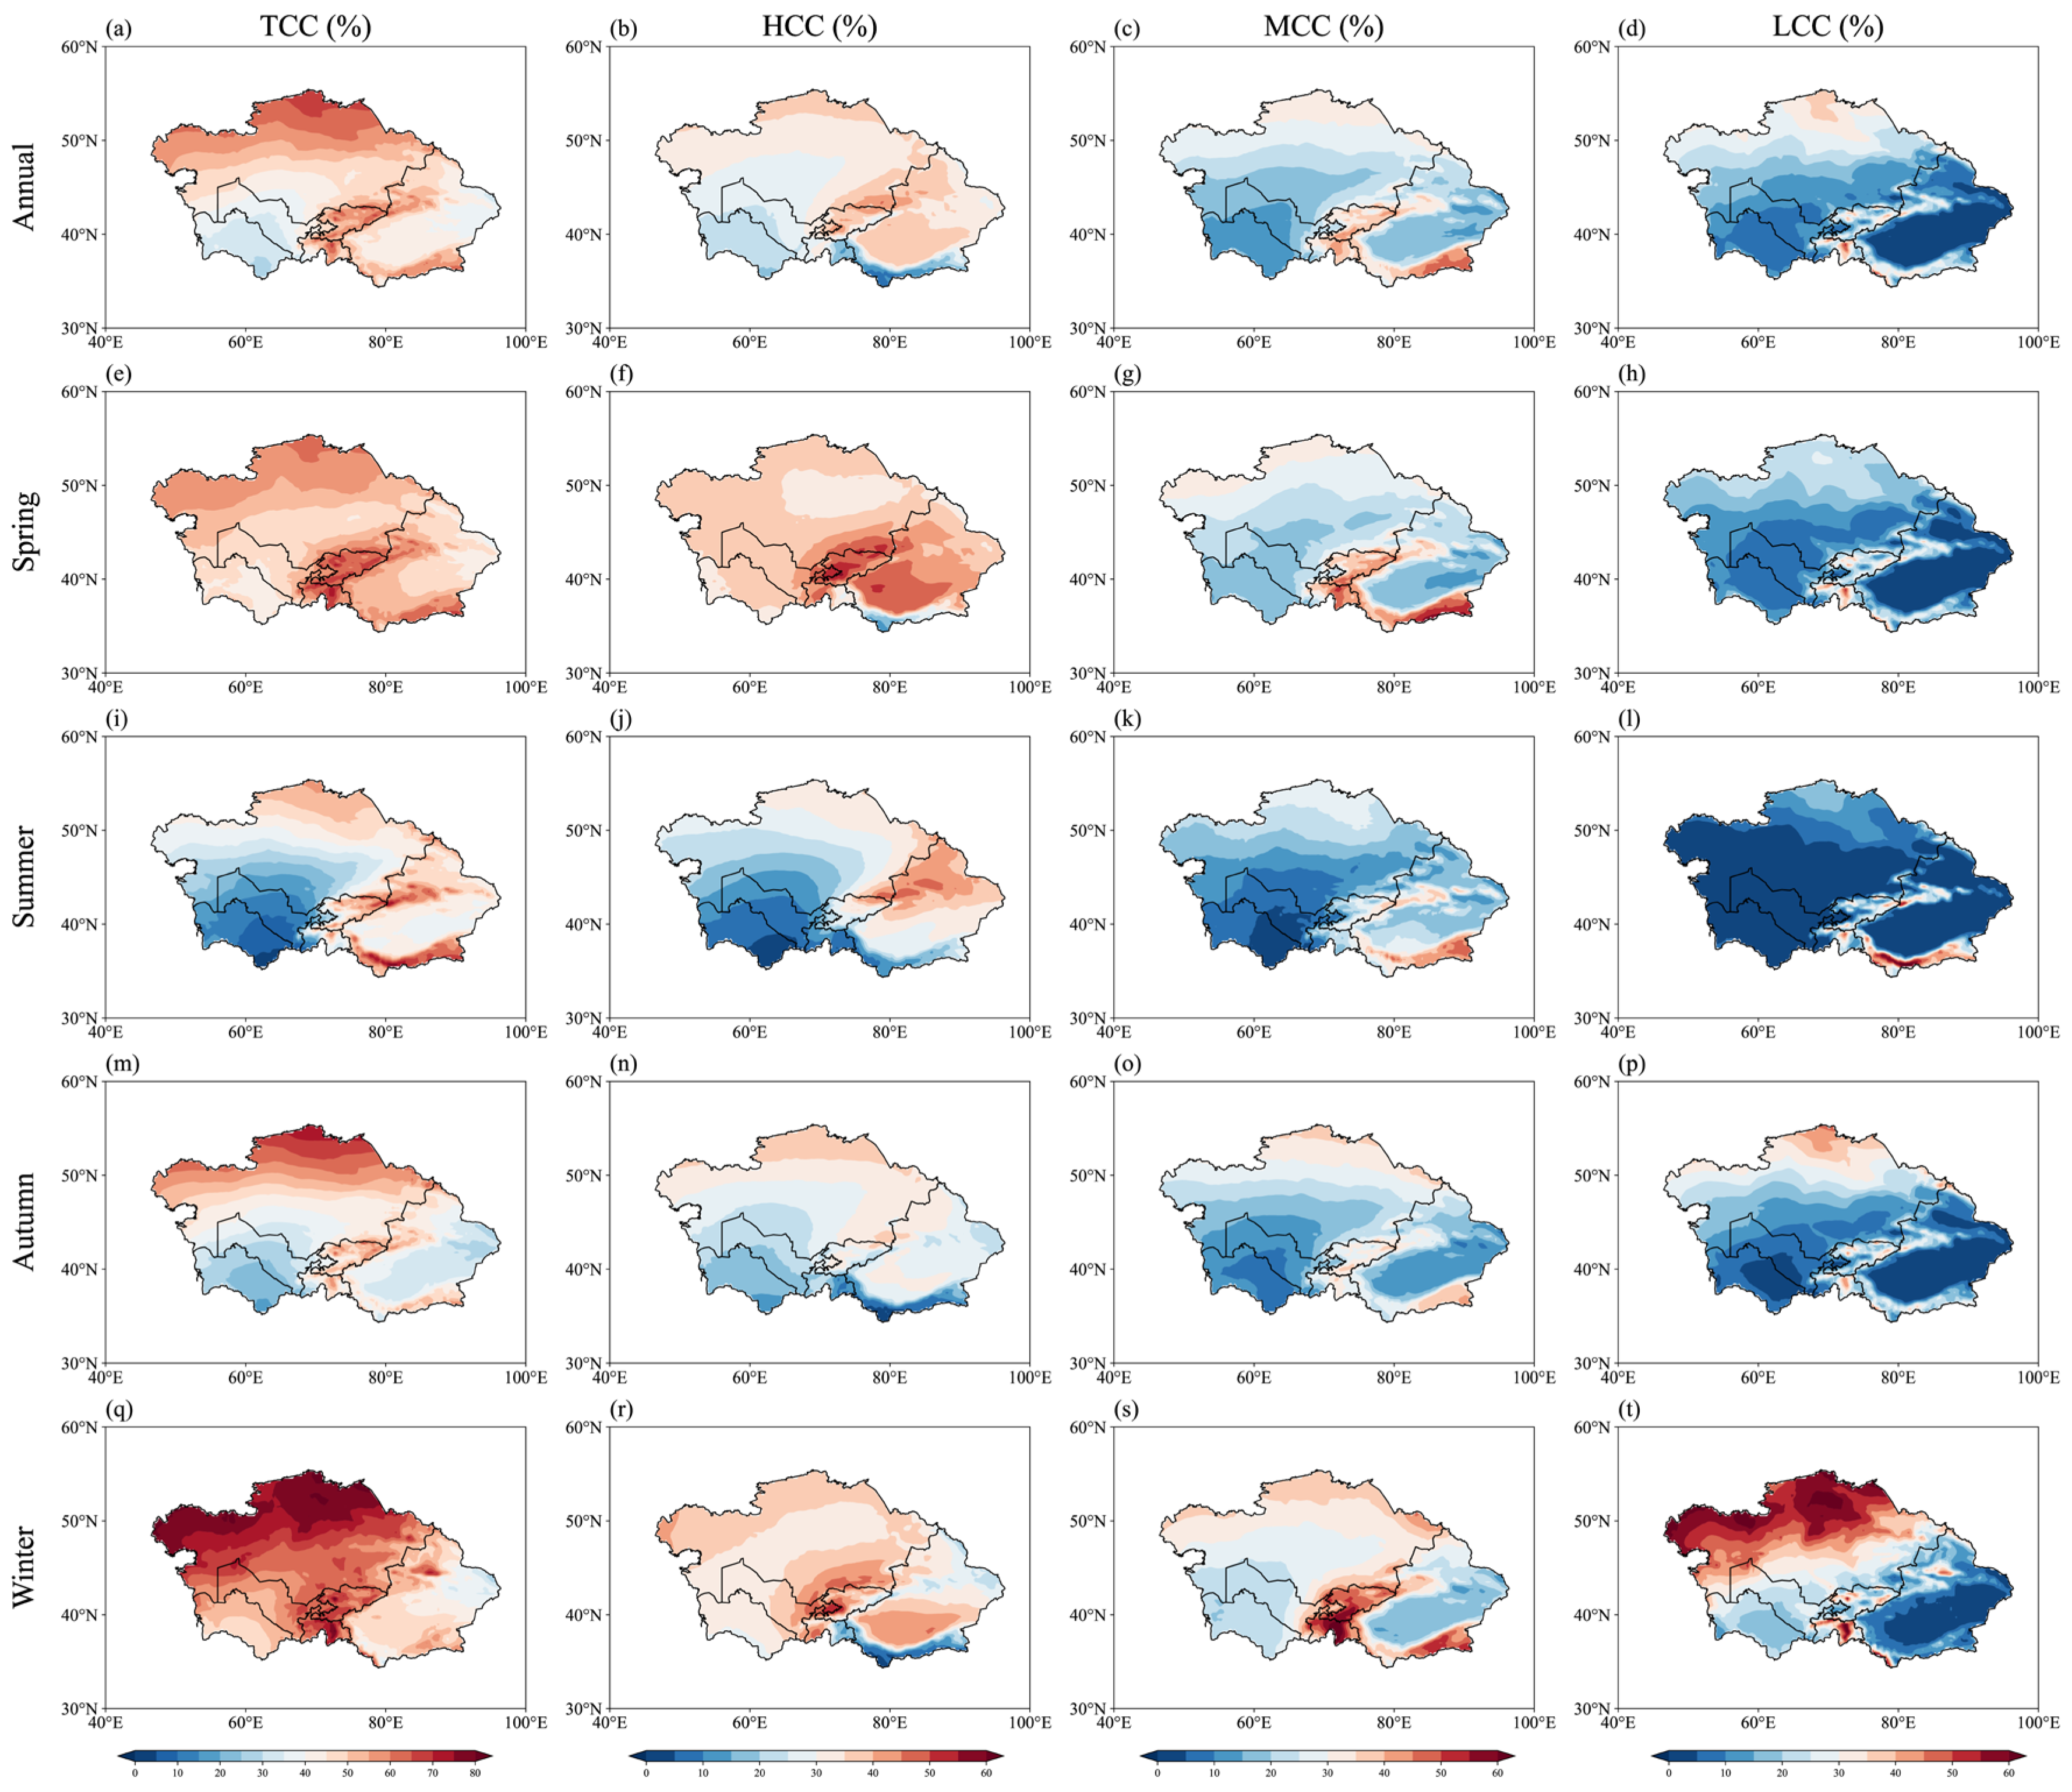
Understanding the macro- and micro-physical properties of clouds is critical for predicting weather patterns and climate change. As a key indicator of regional weather and climate, cloud cover is utilized to study regional climate variability [40]. Figure 2 illustrates the annual and seasonal distribution characteristics of TCC (Figure 2a,e,i,m,q), HCC (Figure 2b,f,j,n,r), MCC (Figure 2c,g,k,o,s), and LCC (Figure 2d,h,l,p,t) in Central Asia from 2001 to 2020. The spatial distribution of TCC exhibits an increasing pattern from the southwest to the northeast. The annual TCC distribution reveals that clouds are predominantly concentrated in high-latitude regions such as NCA and high-altitude areas, including the PMP and Tianshan and Kunlun Mountains, in contrast, lower TCC is observed in SCA. The highest TCC is recorded in winter and is primarily concentrated in NCA. Meanwhile, SCA experiences the lowest TCC in summer. In autumn, both SCA and SXJ show reduced cloud cover. The HCC contributes significantly to TCC over the Tarim Basin in spring and winter, and over the Junggar Basin in summer. The annual distributions of MCC and LCC resemble that of TCC, with concentrations in high-altitude areas and northern NCA. Seasonal analysis of LCC reveals higher coverage in high-latitude regions, especially over NCA during winter, where LCC exceeds 60% in some areas.
The CBH serves as a critical parameter for cloud classification and is an indicator of convective activity intensity. The cloud water path (CWP), representing the total content of liquid (TCLW) and solid water (TCIW) per unit area in the atmospheric column, is linked to latent heat release processes and is an important metric for assessing the potential for artificial precipitation enhancement [41,42]. Figure 3 shows the annual and seasonal distribution characteristics of CBH (Figure 3a,d,g,j,m), TCIW (Figure 3b,e,h,k,n), and TCLW (Figure 3c,f,i,l,o) in Central Asia during 2001–2020. Spatially, CBH exhibits a pronounced dependence on topography. Higher CBH values (>4 km) are observed in Tarim Basin, Bayanbulak Grassland, and Junggar Basin. In contrast, lower CBH values are found in high-altitude regions such as the PMP, Tianshan, and Kunlun Mountain ranges. The lowest CBH values occur in NCA during winter, aligning closely with the distribution patterns of HCC, MCC, and LCC shown in Figure 2.
The distribution of TCIW exhibits distinct seasonal dynamics, peaking in the PMP during winter and reaching a maximum in the Tianshan Mountains and Bayanbulak region during summer. SCA consistently maintains lower TCIW content across the region. The TCLW is primarily concentrated in three areas: the high-latitude zone of NCA, the western PMP, and the Tianshan and Kunlun Mountain ranges. Seasonally, TCLW contributes most to the annual in summer, particularly in the Kunlun Mountains. In autumn, high TCLW values shift to western and northern NCA, and in winter, they are predominantly distributed in western NCA. These spatiotemporal distribution patterns are associated with topographic forcing and seasonal variations in atmospheric circulation in Central Asia [43,44].
This study further investigates the temporal variation characteristics of the different cloud types. As shown in Figure 4a, the analysis based on monthly data from 2001 to 2020 reveals an annual cycle in the TCC, HCC, MCC, and LCC over Central Asia. The TCC increases from 55% in January, reaches a peak of 62% in February, declines steadily to a minimum of 32% in August, and then subsequently rises again to 59% in December. The HCC, MCC, and LCC exhibit similar annual cycles to TCC, but with some differences. The HCC peaks in March (39%), and the LCC reaches its maximum in January (32%) and minimum in June (6%). High clouds consistently dominated, followed by middle and low clouds. The seasonal averages in Figure 4b reveal that TCC exceeds 60% in winter, the highest among all seasons. The HCC is most pronounced in spring (38%), and both the MCC and LCC reach their seasonal maximum in winter (>30%). Notably, the TCC and LCC show the greatest seasonal variability, with winter and summer differences reaching 24%, whereas the HCC demonstrates the least variation (approximately 10%). Overall, the cloud cover in Central Asia follows a typical seasonal pattern of winter > spring > autumn > summer.

3.2. Trends in Different Cloud Covers over Central Asia

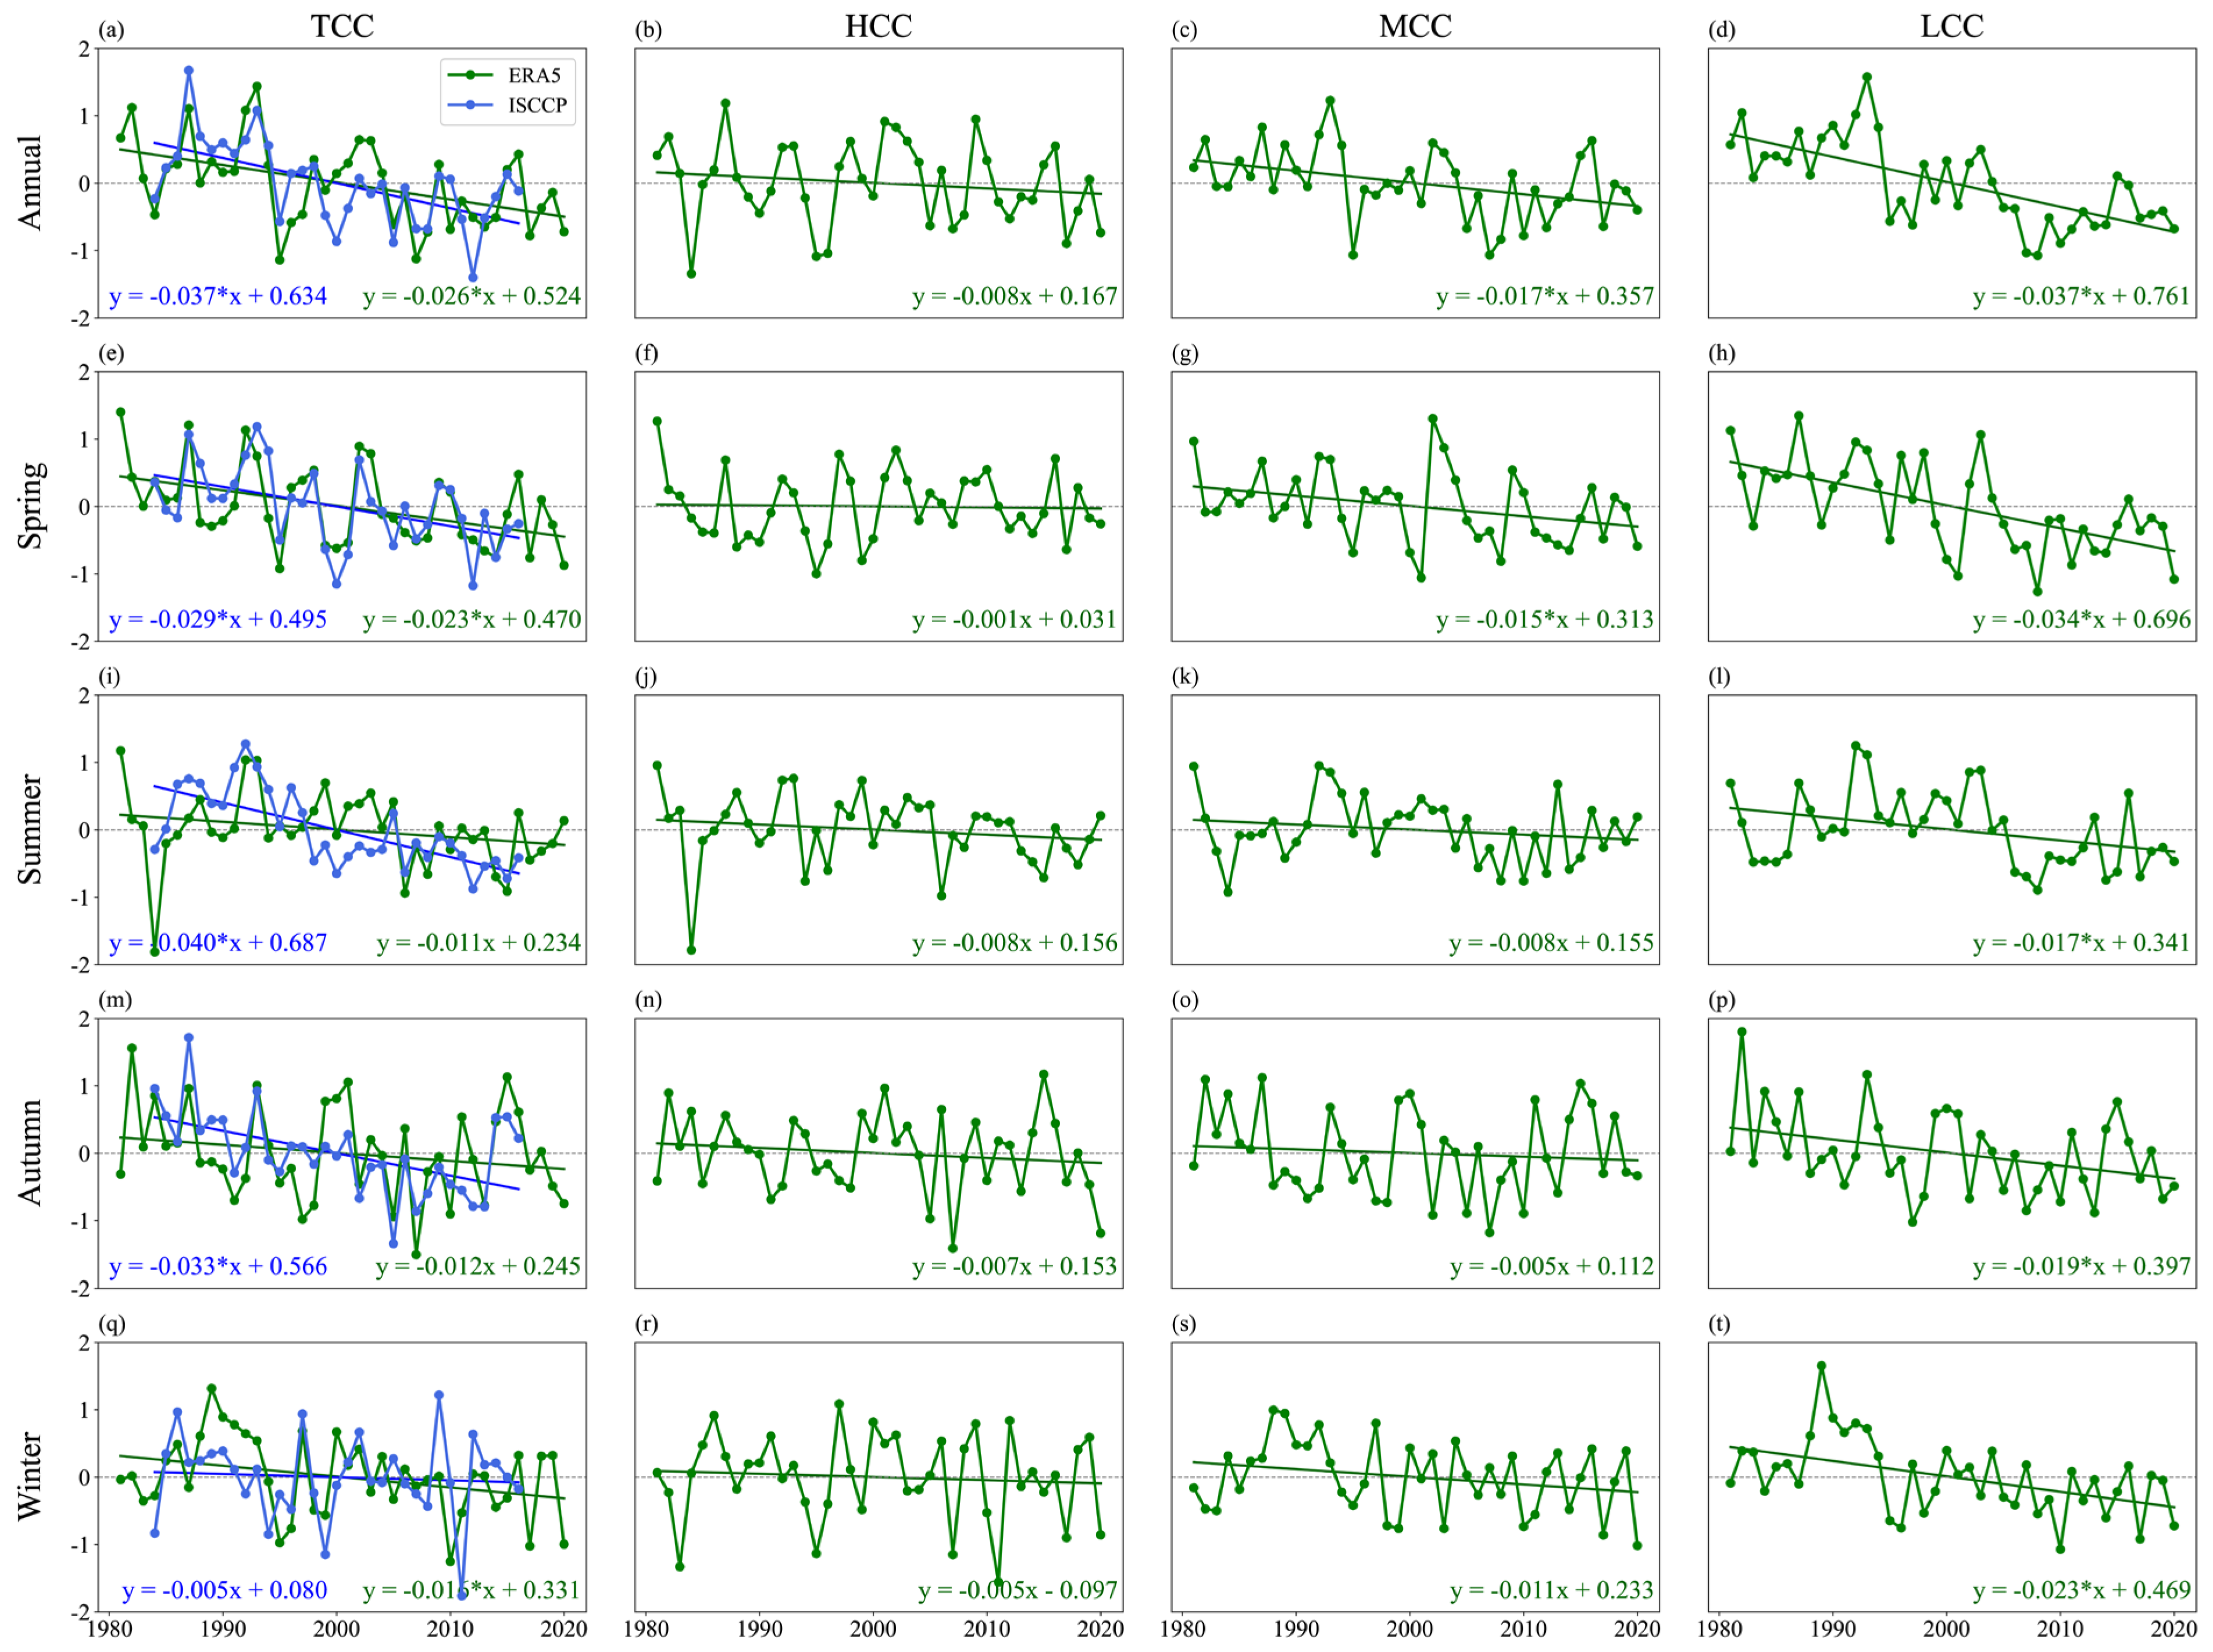
Analysis of the ERA5 reanalysis (1981–2020) and ISCCP satellite (1984–2016) data reveals declining trends in the various cloud cover types across Central Asia, with notable differences between data sources and cloud categories (Figure 5). Comparing the two datasets, the decline rate of TCC in the ISCCP data is generally faster than that in the ERA5 data (Figure 5a,e,i,m,q), potentially due to the higher sensitivity of satellite observations to cloud layers and the difference in temporal coverage [45]. Winter is an exception, with ERA5 exhibiting a faster TCC decrease. For HCC, the ERA5 data suggest no significant decreasing trend at the annual or seasonal scales. The MCC decreases at a yearly rate of –0.017 (Figure 5c), with the most significant seasonal decline in spring at –0.015 per year (Figure 5g). The LCC contributes the most to the annual TCC decline, passing significance tests across all seasons, with the most pronounced decline in spring (Figure 5d,h,l,p,t). A change-point analysis reveals a critical climatic transition around 2006, as the annual TCC and seasonal LCC time series exhibited a significant shift from declining to increasing trends. These trends are possibly associated with adjustments in the climate system of Central Asia during the early 21st century.
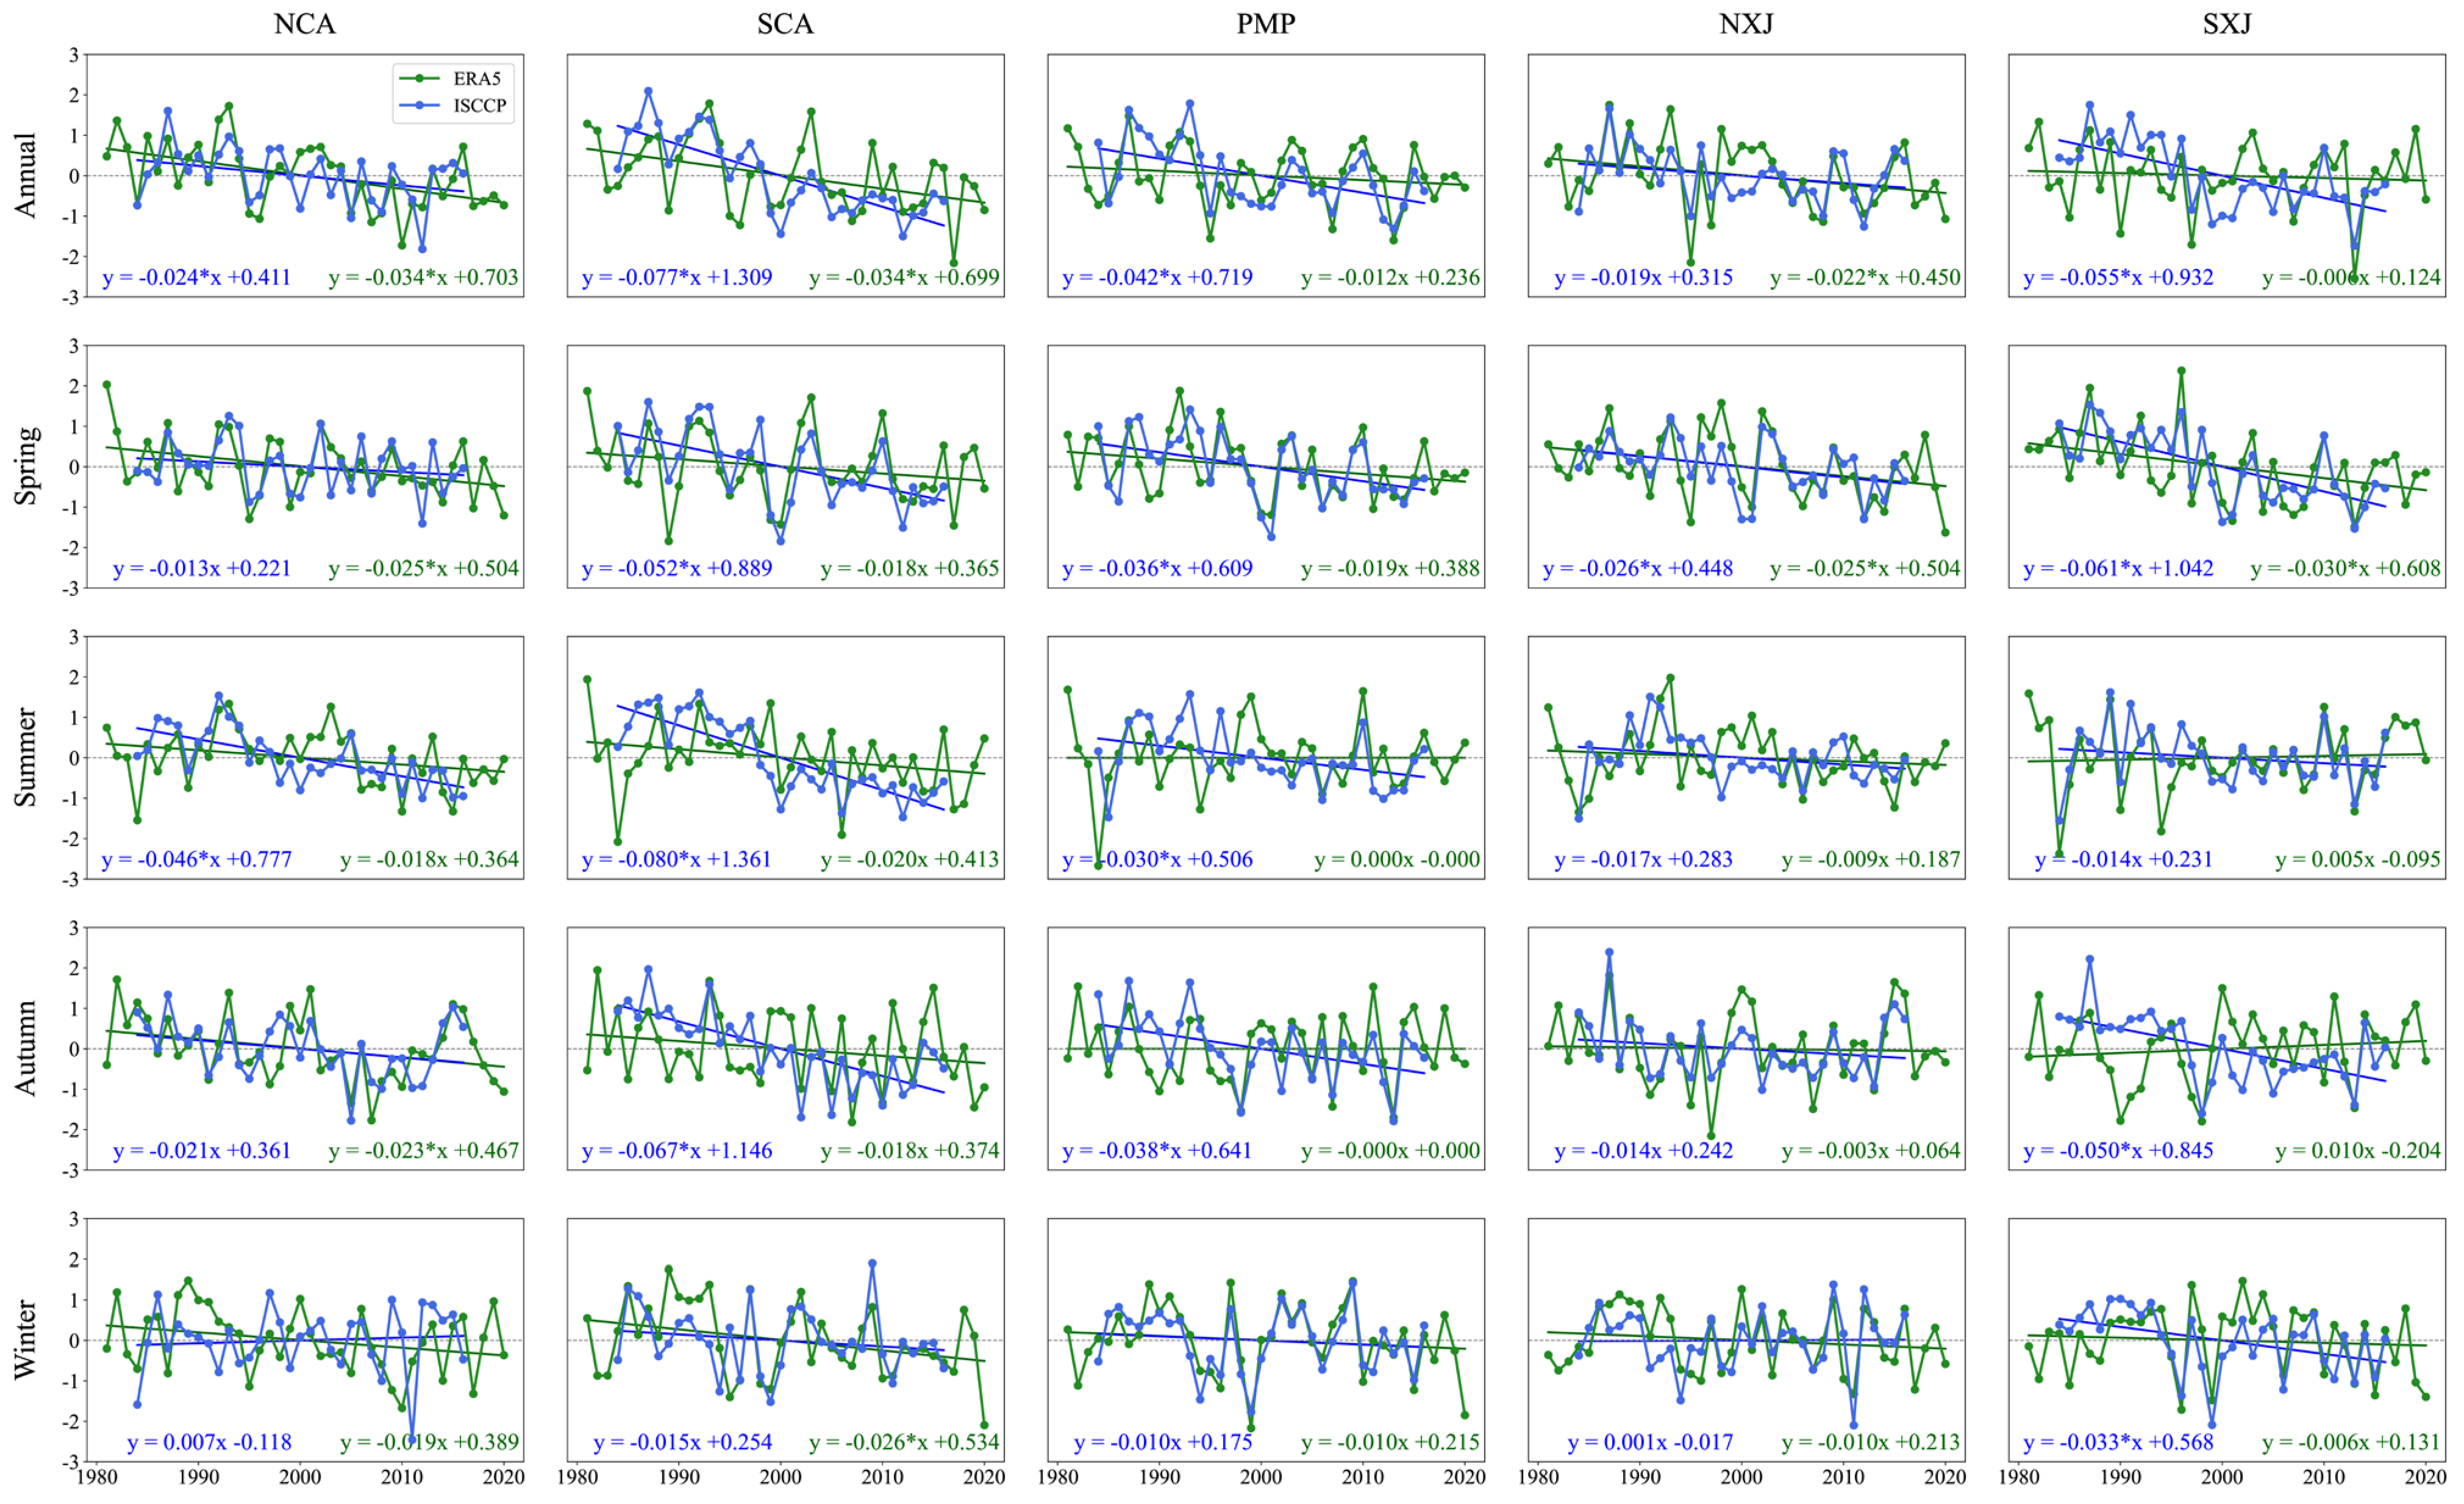
To explore the spatial characteristics of cloud cover changes over Central Asia, we conduct a comparative analysis of the TCC trends derived from the ISCCP and ERA5 datasets for the five subregions (Figure 6). The results reveal spatial heterogeneity in the trends of TCC across the region. In NCA, the ERA5 data show faster TCC declines than the ISCCP data except in summer. In contrast, SCA displays the most rapid TCC decline in the ISCCP data, with an annual regression coefficient of –0.077. The decrease is robust in summer, and the ISCCP trends surpass those of the ERA5 in all seasons except winter. Interestingly, in the PMP, ISCCP shows a significant TCC decline, while ERA5 reveals a much weaker downward trend. In high-altitude areas, the presence of glaciers and snow cover can lead to cloud misclassification in satellite observations, as their reflectance properties closely resemble those of cloud tops [46,47]. In NXJ and SXJ, spring emerges as the season with the most pronounced TCC decreases. These regional differences likely reflect the varying capabilities of the two datasets in capturing cloud changes over complex terrain. They also suggest that cloud cover responses to climate changes in Central Asia exhibit significant spatial variability across different subregions.
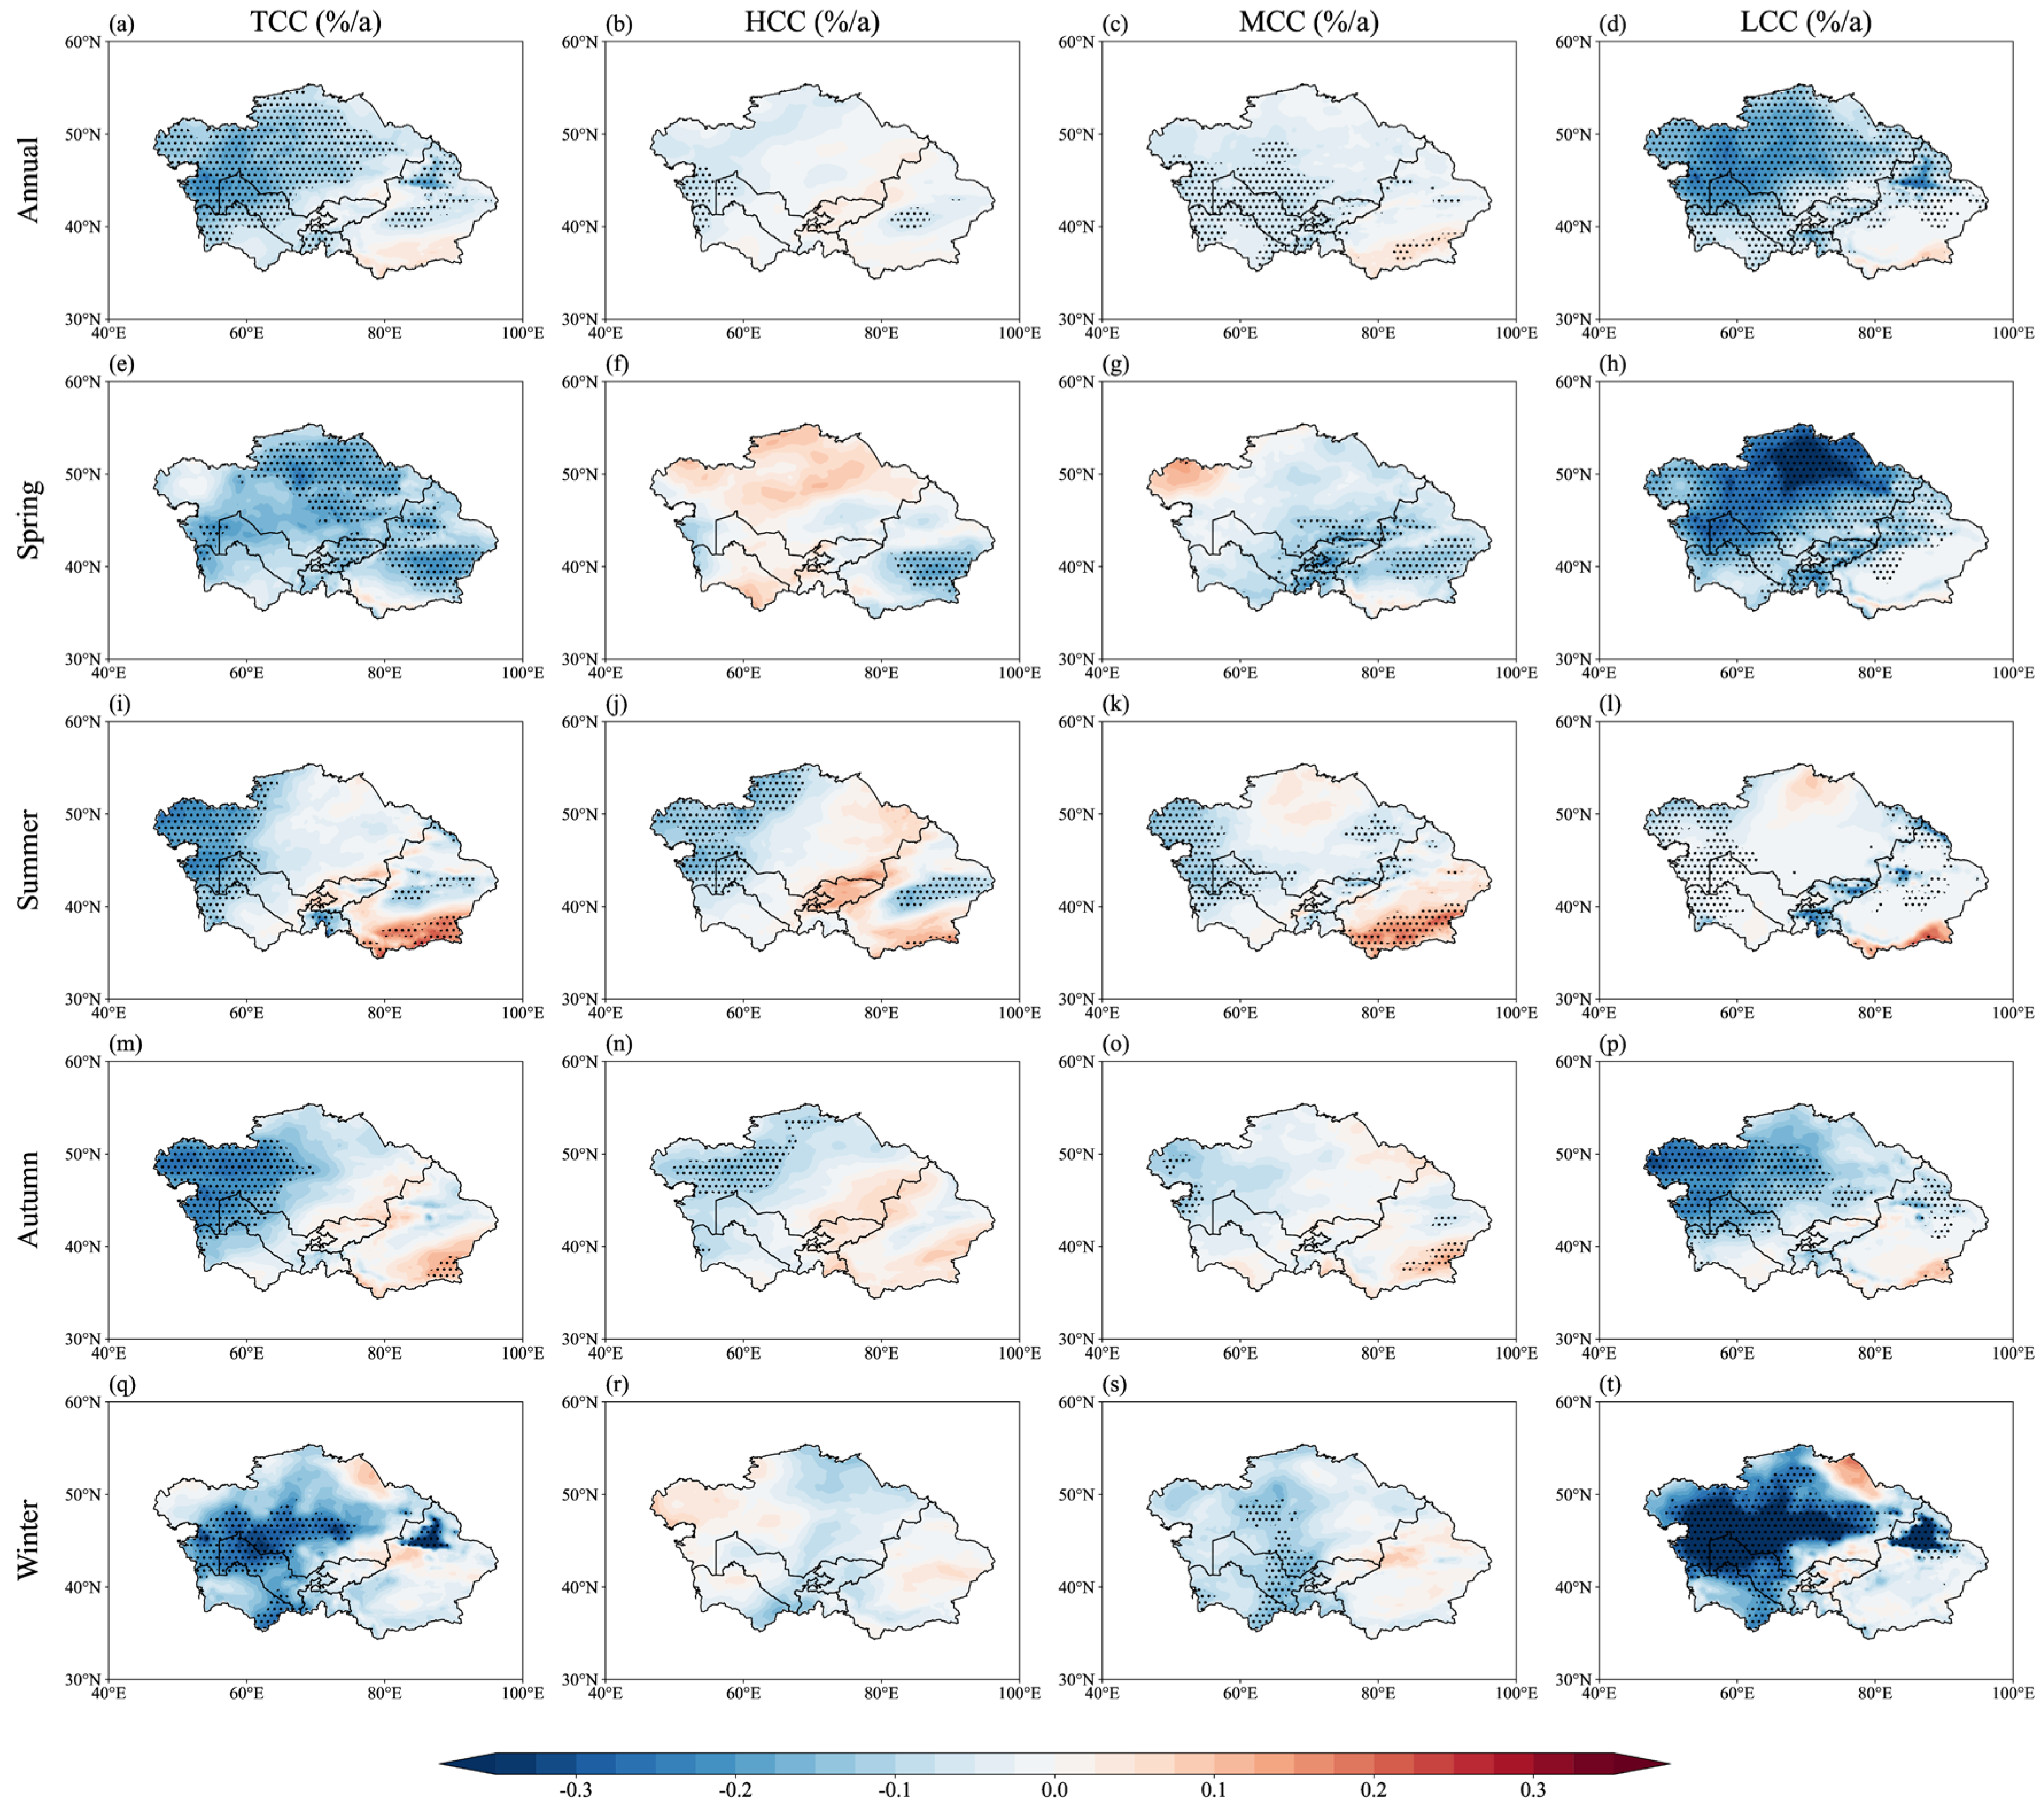
Furthermore, this study analyzes the spatial distribution of the trends in different cloud cover types over Central Asia from 1981 to 2020 (Figure 7). Based on the ERA5 reanalysis data, the TCC generally exhibits a decreasing trend across most parts of Central Asia. However, upward trends are observed in high-altitude regions such as the Kunlun Mountains, Tianshan Mountains, and the PMP, with the most pronounced increases occurring in summer (Figure 7i). Significant declines in HCC are primarily concentrated in the Tarim Basin of SXJ and western NCA (Figure 7b,f,j,n). The MCC shows distinct regional variability, characterized by a downward trend in the west and an upward trend in the southeast (Figure 7c). Notably, the LCC demonstrates the most substantial decrease among cloud covers. The reduction is observed across nearly all of Central Asia (Figure 7d,h,l,p,t), with faster LCC decline occurring in NCA and NXJ during spring and winter, exceeding –0.4% per year.

3.3. Influence of Cloud Cover on Skin Temperature over Central Asia

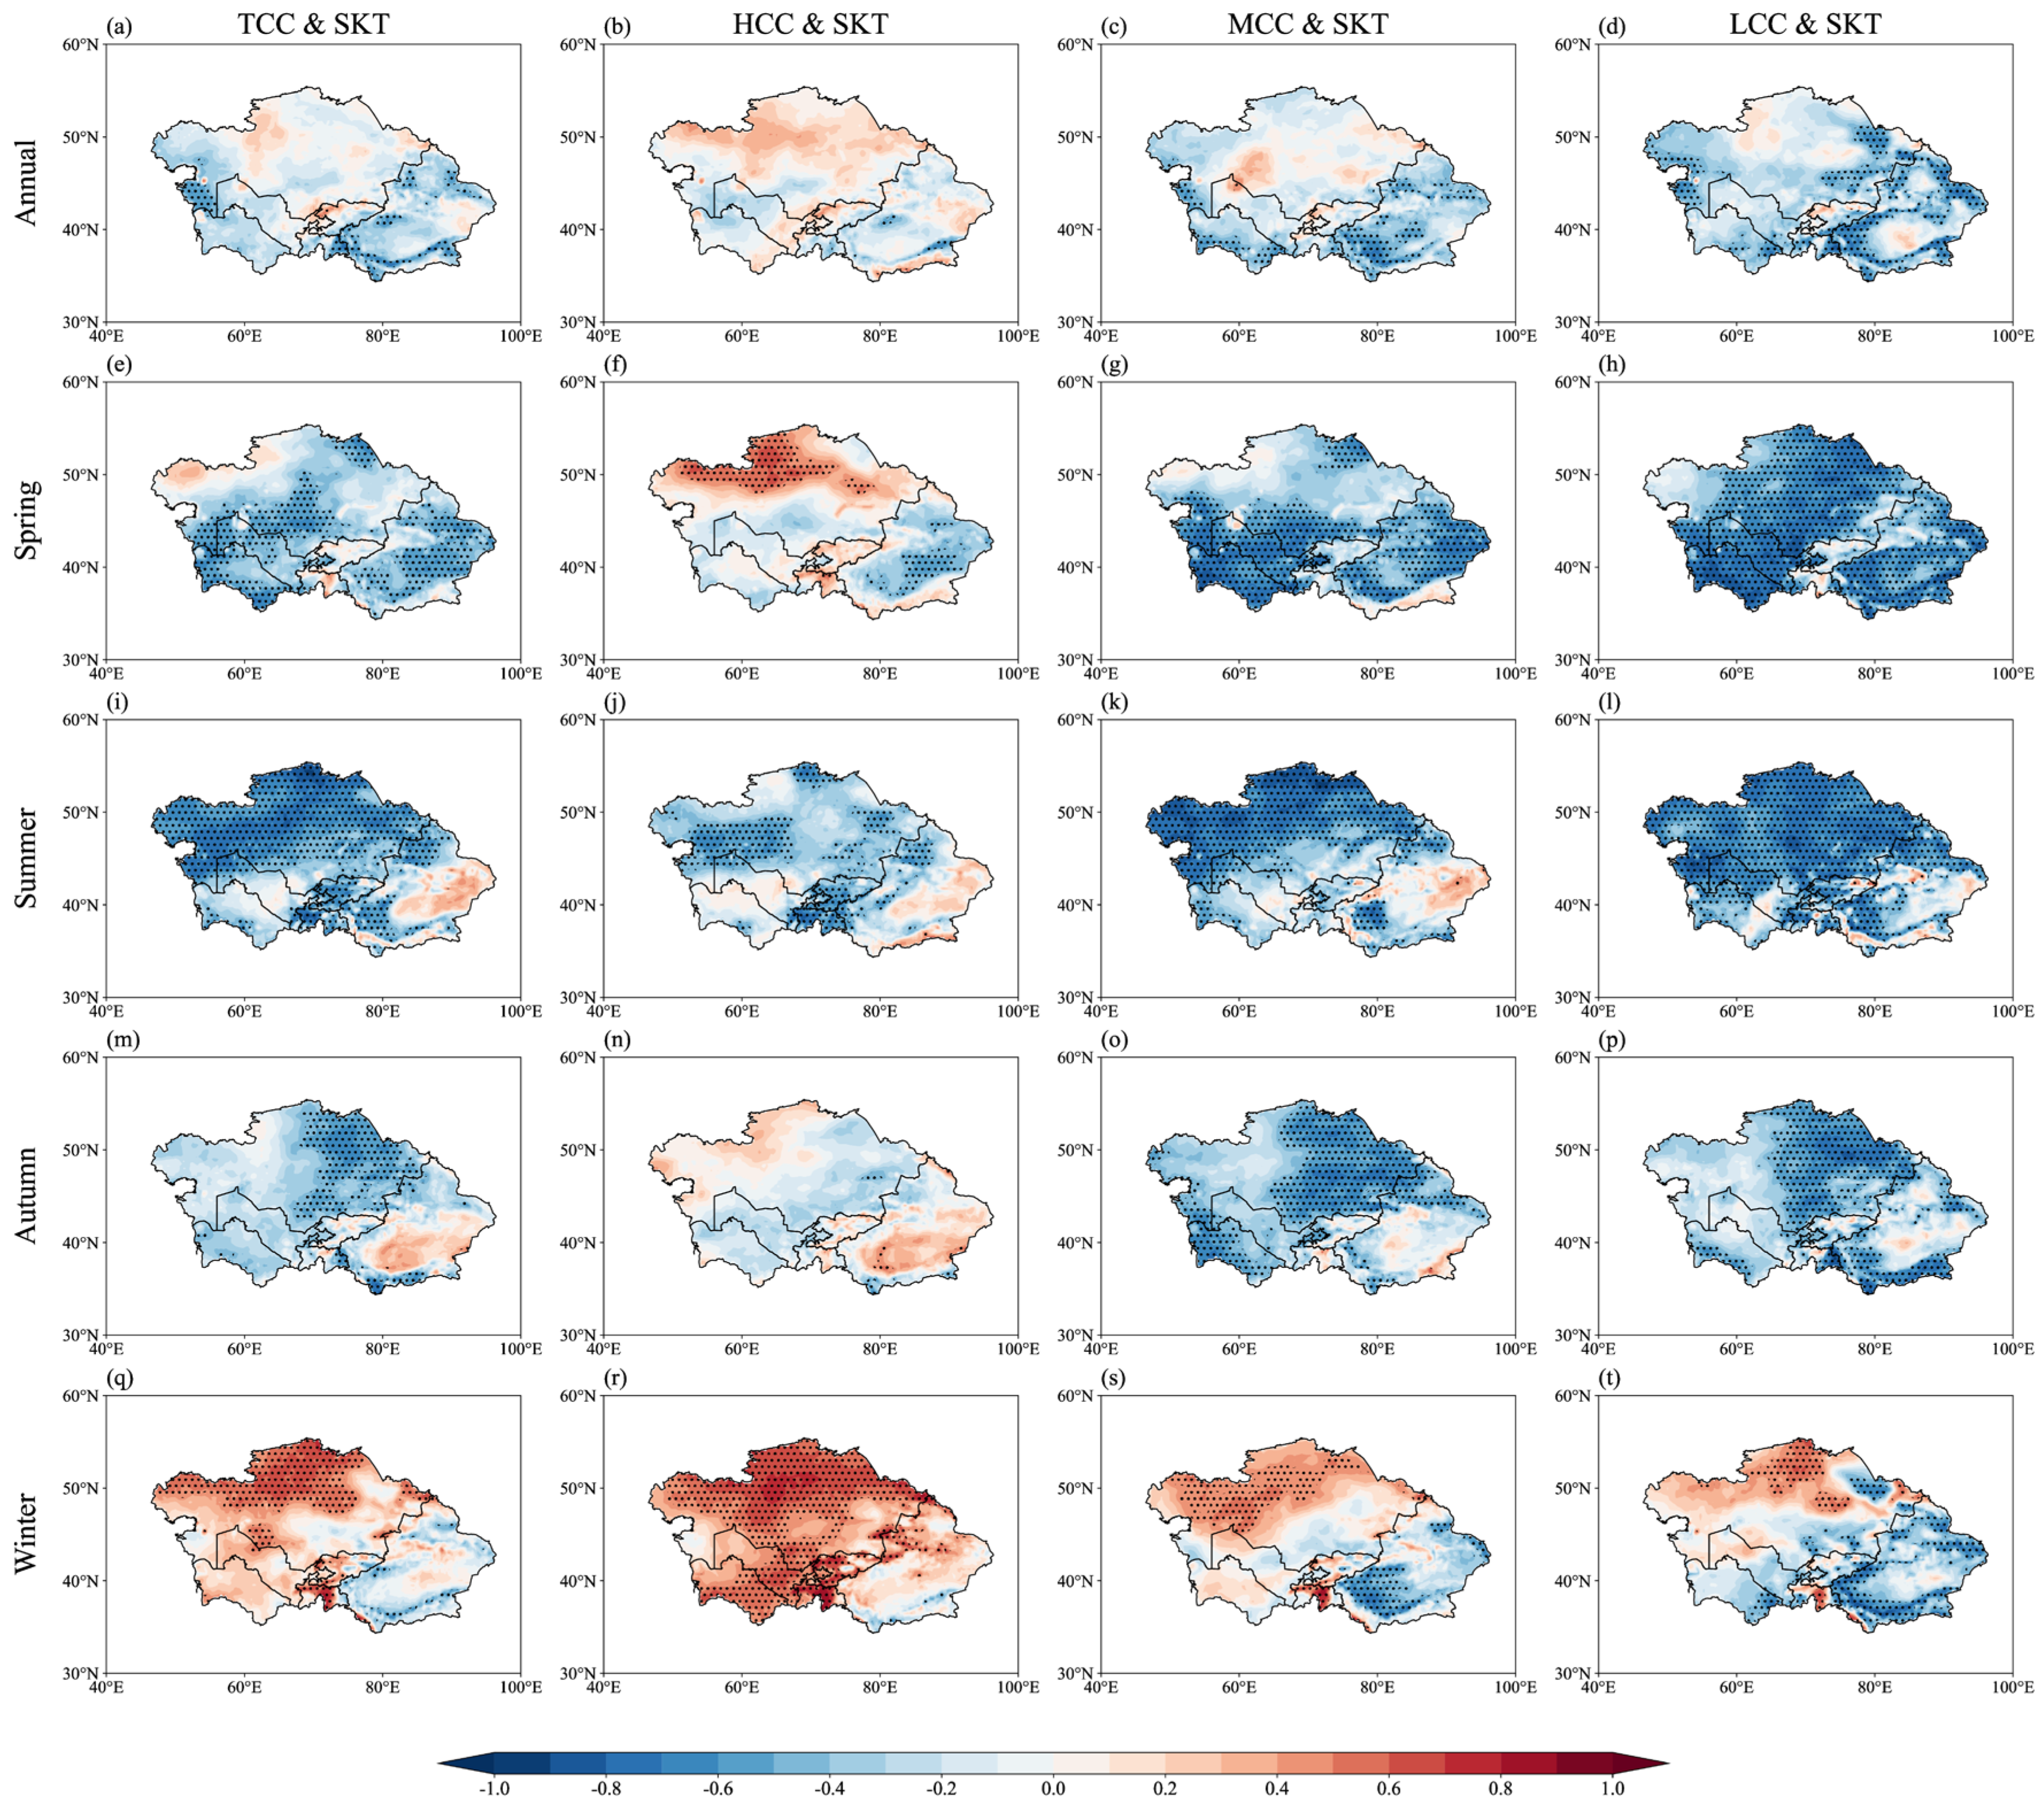
Clouds play a crucial role in modulating surface temperature by scattering and absorbing solar radiation as well as absorbing and emitting thermal radiation, considerably influencing the Earth’s energy balance [48,49]. Figure 8 illustrates the spatial distribution of the correlation coefficients between cloud cover and skin temperature in Central Asia from 2001 to 2020. The TCC generally exhibits a negative correlation with skin temperature, indicating that higher cloud cover is associated with lower temperatures. Winter correlations are opposite to those in the other seasons, showing a positive relationship across most of Central Asia (Figure 8q), with an averaged mean correlation coefficient of 0.325 (Table 3). Similar to the results reported by Rudisill et al. [50], clouds contribute to surface warming during winter and exert a cooling effect during summer. The HCC is positively correlated with skin temperature in NCA but has negative correlations in SCA (Figure 8b). In winter, the HCC shows the strongest positive correlation with skin temperature, playing a dominant role in shaping the spatial pattern of the correlation between TCC and skin temperature. The spatial distributions of the correlation coefficients for the MCC and LCC are similar (Figure 8c,d). Summer and winter exhibit opposing correlation patterns in most regions (Figure 8k,l,s,t). During summer, correlations between clouds and skin temperature are generally significant, with the MCC showing the strongest correlation at –0.72 (Table 3).
Table 3 summarizes the proportion of grid points passing the 99% and 95% significance levels. The TCC, MCC, and LCC in summer show the highest proportions of significant grid points, particularly LCC, with 60% of the region showing significance at the 99% level. This indicates widespread skin temperature regulation by low clouds. These findings suggest that the HCC influences skin temperature in winter, and MCC and LCC exert strong effects in summer. Subsequent analysis focuses on the modulations of summer cloud cover on skin temperatures and precipitation.
We calculate the correlation coefficients between cloud cover and skin temperature across the different subregions in summer (Table 4). In NCA, all cloud types are significantly negatively correlated with skin temperature, with the MCC exhibiting the highest correlation coefficient (r = –0.87). In SCA and NXJ, the LCC plays a dominant role in modulating skin temperature, with the strongest correlation coefficients of –0.71 and –0.62, respectively. The HCC shows the strongest correlation in the high-elevation PMP region, likely owing to topographic influences. In SXJ, the correlations between all clouds and skin temperature are relatively weak.
Figure 9a,b illustrate the spatial distribution and temporal evolution of the summer skin temperature trends over Central Asia during 2001–2020. The spatial distribution closely resembles that of the TCC, with a pronounced contrast between the northwestern and southeastern regions of Central Asia (Figure 7i and Figure 9a). Specifically, the skin temperature increases and TCC decreases in the northwest, while the opposite occurs in the southeast, with skin temperature decreasing and TCC increasing. The areas that experience pronounced warming include the western and eastern parts of NCA, northern parts of SCA, and NXJ. In contrast, cooling trends are mainly observed in the Tarim Basin of SXJ. The regional averaged time series indicates a significant warming trend in summer (Figure 9b), with a regression coefficient of 0.054 (p < 0.05). During 2001–2020, a significant interannual correlation (p < 0.05) was observed between summer cloud radiative forcing (CRF) and skin temperature, indicating that CRF exerts influence on surface thermal conditions by modulating the surface radiative energy balance.
As a key factor of the climate system, clouds influence the surface energy balance primarily by altering the shortwave and longwave radiation forcing [39,50]. To quantitatively assess the cloud cover on summer skin temperature in Central Asia, this study calculates the CRF, LWCF, and SWCF. The spatial distribution of the CRF reveals a southwest-to-northeast decreasing pattern that is reversely distributed compared with TCC (Figure 2i and Figure 9c). The lowest CRF values (below –60 W m 2 ) are observed in high-elevation regions such as the Tianshan and Kunlun Mountains. The spatial distribution of the CRF reveals an increasing trend over most parts of NCA and SCA, whereas a decreasing trend is evident in the PMP, NXJ, and SXJ regions (Figure 9d). In addition, the correlation coefficients demonstrate significant relationships between the CRF and both skin temperature (r = 0.45) and TCC (r = –0.67), implying that increased cloud cover enhances the cooling effect of CRF and suppressed surface warming (Figure 9e). The CRF is most strongly associated with mid- and low-level clouds (p < 0.01), whereas the influence of high clouds is negligible. Figure 9f illustrates the CRF, SWCF, and LWCF for the five subregions of Central Asia. Regional comparisons indicate that the cooling effect of clouds due to SWCF generally exceeds the warming effect from LWCF, resulting in net cooling across all subregions of Central Asia. In particular, the PMP, NXJ, and SXJ exhibit stronger shortwave cooling (SWCF < –45 W m 2 ). In SCA, LWCF and SWCF are nearly balanced, yielding a net CRF close to zero. In summary, summer warming in Central Asia is closely linked to TCC reductions, particularly MCC and LCC. The decline in cloud cover weakens shortwave reflection, increases net surface radiation, and thus amplifies regional warming trends.

3.4. Influence of Cloud Propertites on Precipitation over Central Asia

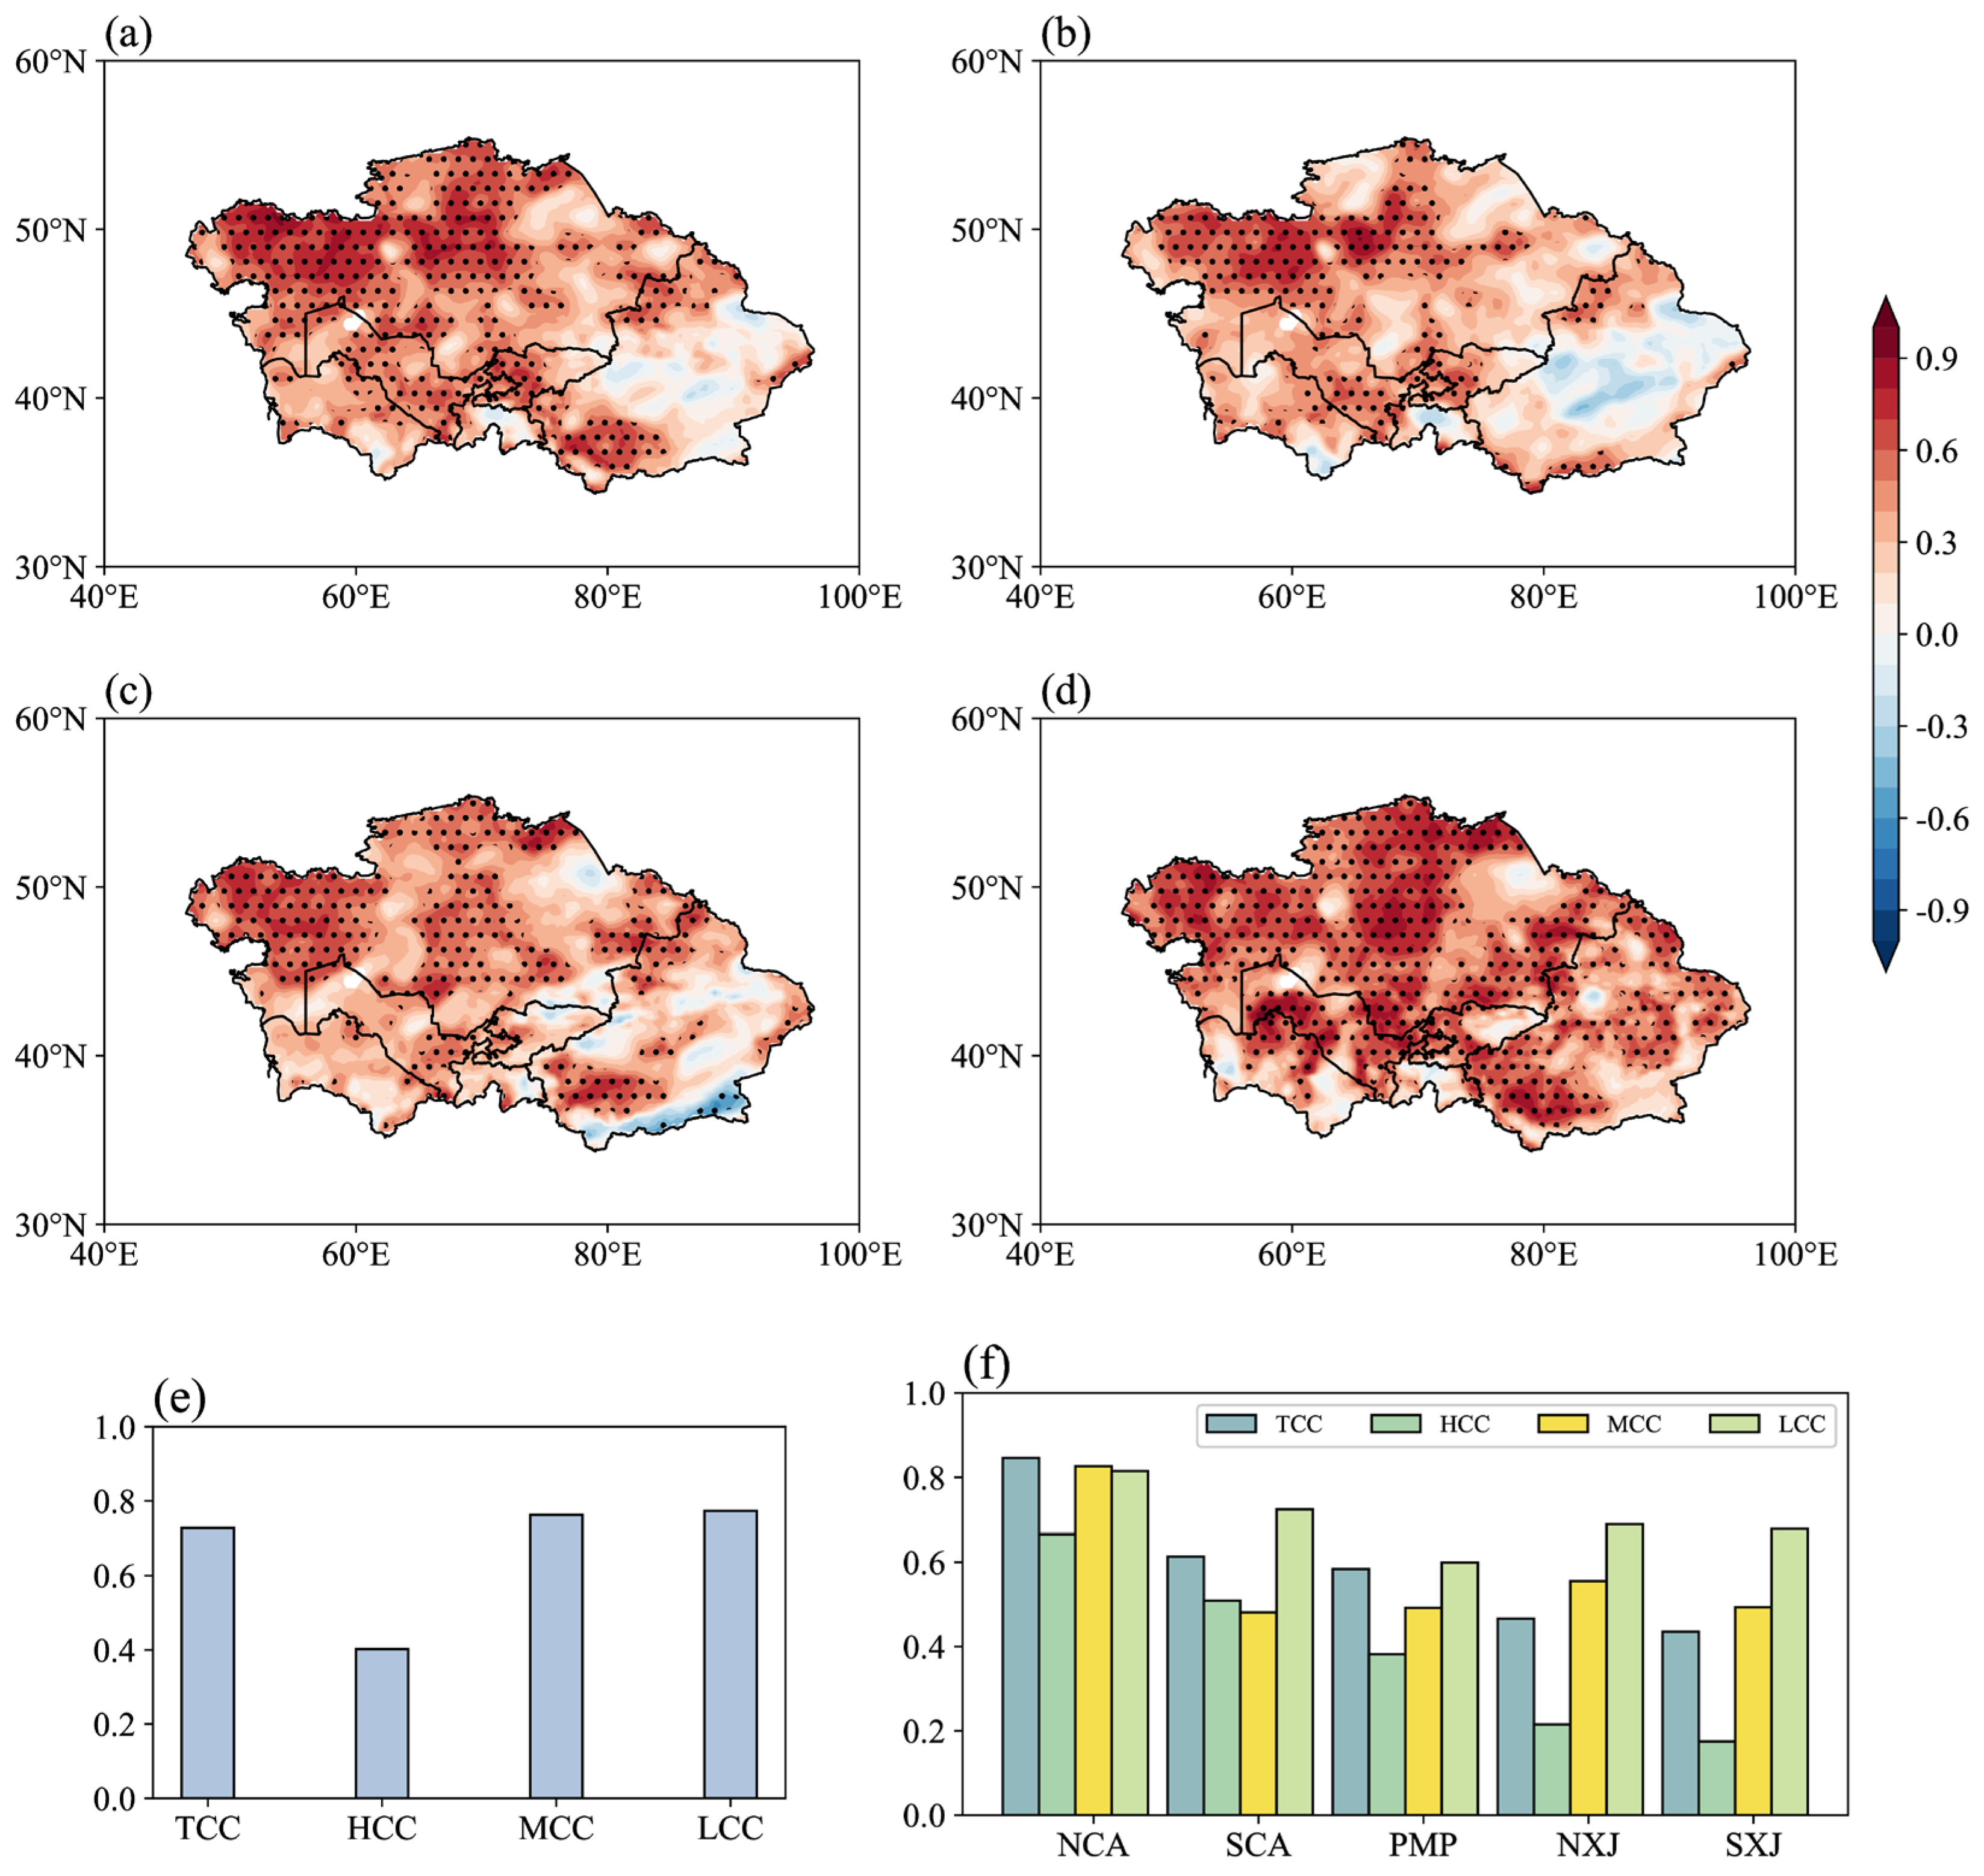
Cloud water resources serve as a crucial prerequisite for precipitation formation. Therefore, understanding the spatial distribution characteristics of atmospheric cloud water and its relationship with precipitation is significant for water resource management and climate change in Central Asia. Figure 10 presents the spatial distribution of the correlation coefficients between the cloud covers and summer precipitation over Central Asia during 2001–2020. The cloud cover exhibits a significantly positive correlation with precipitation across most parts of the region (Figure 10a). The HCC is correlated with precipitation primarily in NCA and PMP (Figure 10b). Notably, the LCC demonstrates the strongest correlations (Figure 10d), with the majority of grids exhibiting a correlation coefficient above 0.4, and some areas exceeding 0.9. The regional averaged correlation coefficient reaches 0.77. Over 60% of the region passes the 95% significant level. A more detailed regional analysis indicates that both MCC and LCC substantially influence precipitation (Figure 10e). The highest correlation is found in NCA. In arid and semi-arid regions such as the PMP, NXJ, and SXJ, mid- and low-level clouds are critical for precipitation development (Figure 10f). Among them, the LCC shows a stronger correlation, with coefficients of 0.599, 0.687, and 0.678, respectively.
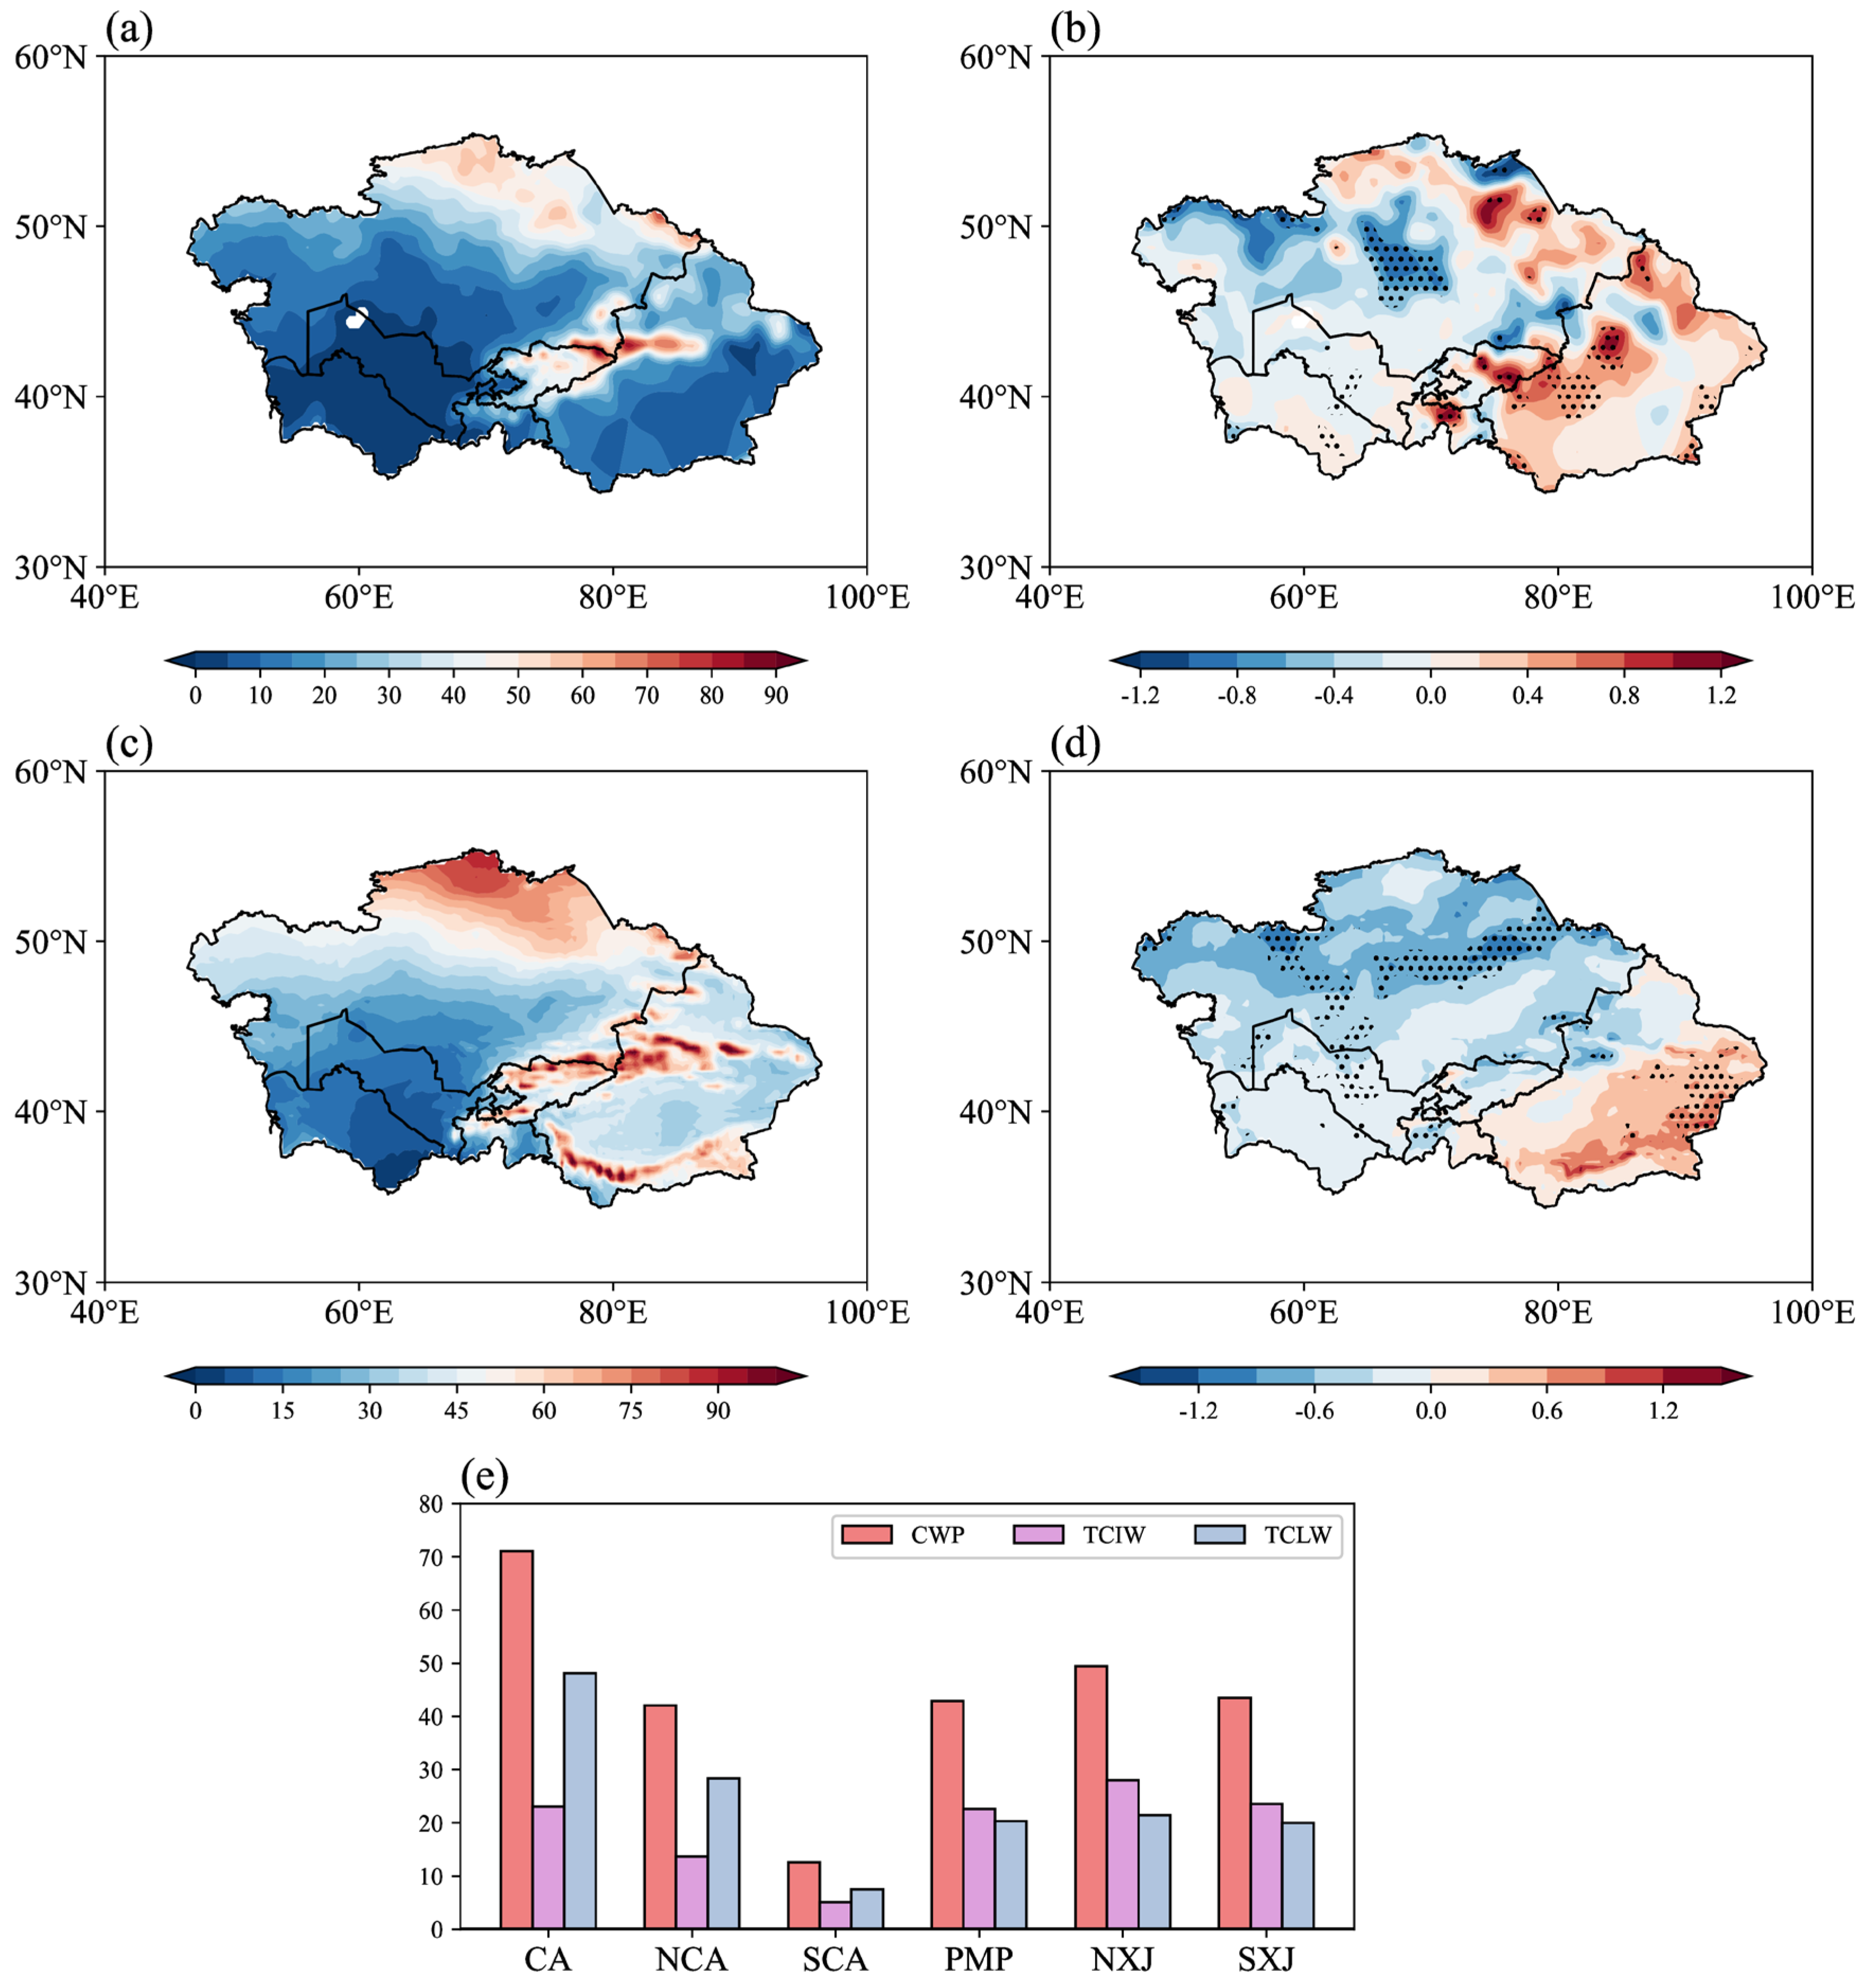
Cloud microphysical processes influence precipitation formation and development by regulating latent heat release and water vapor transport [51]. Figure 11a depicts the spatial distribution of summer precipitation in Central Asia from 2001 to 2020, showing a gradual increase from the southwest to the northeast. SCA exhibits the lowest precipitation, below 10 mm, while the PMP and Tianshan Mountains record the highest, exceeding 80 mm. This precipitation pattern closely resembles the spatial distribution of the summer TCC (Figure 2i). Figure 11b illustrates the spatial distribution of precipitation trends, revealing a dipole pattern, decreasing trends in western Central Asia, and increasing trends in the east. Figure 11c presents the spatial distribution of CWP, which aligns with the precipitation patterns. However, in the Kunlun Mountains, the CWP values are relatively high, while precipitation remains low. The CWP is primarily concentrated in northern NCA, the Tianshan and Kunlun Mountains, and northern PMP. Figure 11d shows the spatial distribution of the CWP trends, characterized by an east–west pattern. The CWP features a decreasing trend in NCA, but a significant increase in eastern SXJ. Figure 11e quantifies the CWP, TCIW, and TCLW across the subregions in Central Asia. NXJ has the most abundant cloud water resources, followed by SXJ, with PMP and NCA having comparable CWP values, and SCA having the least. In NXJ, SXJ, and PMP, the TCIW content exceeds that of TCLW, indicating that cloud water is predominantly stored as solid (ice) water. Conversely, in NCA and SCA, liquid water content surpasses the solid water content.
These results reveal a robust relationship between the atmospheric cloud water content and precipitation, with cloud water predominantly stored in mid- and low-level clouds. It is worth noting that Xinjiang exhibits abundant cloud water resources, characterized by a higher proportion of solid (ice) water content.

4. Discussion

Current cloud classification schemes include the ISCCP category system based on cloud-top pressure and optical thickness, the ERA5 stratification scheme utilizing model pressure levels, and the CERES approach, which refines ISCCP by incorporating cloud-top height and albedo. However, these classification standards face significant challenges in Central Asia’s complex terrain, particularly in the high-altitude regions of the PMP, and Tianshan and Kunlun Mountain ranges. Previous studies have simplified mid- and low-level clouds to low clouds in the Tibet Plateau [28,41]. However, whether this simplification is suitable for Central Asia’s mountainous regions remains uncertain. Cloud-type differentiation relies on CBH, phase composition, or other microphysical parameters. In addition, consideration of the diversity of underlying surfaces, such as deserts, plains, and hills, necessitates the development of region-specific cloud classification standards. This question is pertinent, as different cloud types (e.g., cirrus and altostratus in high clouds, or cumulonimbus and deep convective clouds in mid- and low-level clouds) exert distinct mechanistic influences on local precipitation processes.
CERES EBAF Ed4.2 significantly improves the accuracy of radiative fluxes and cloud properties through algorithm corrections, enhanced data consistency, and higher-quality input data [52]. However, uncertainties and errors persist in the CERES data, including sensor calibration errors, limitations in cloud detection algorithms, model parameterization errors, and uncertainties in aerosol–cloud interactions, which warrant further investigation.
Data quality challenges further complicate cloud studies in Central Asia. Systematic discrepancies exist between ERA5 reanalysis and ISCCP satellite-derived TCC owing to the scarcity of ground-based observations in the region and limitations of data sources in complex terrain. Notably, despite Xinjiang’s abundant atmospheric cloud water resources, the region’s arid atmospheric conditions and unique cloud microphysical properties hinder their efficient conversion into surface precipitation [8]. This highlights a critical challenge of weather modification techniques such as cloud seeding can potentially optimize the phase transition of solid cloud water to enhance precipitation efficiency. Addressing this challenge requires a deeper understanding of Central Asia’s distinctive cloud-precipitation processes and the development of tailored artificial precipitation enhancement technologies suited to arid regions. Therefore, such advancements hold practical importance for alleviating the water resource shortages in Northwest China’s arid zones.

5. Conclusions

This study investigates the spatiotemporal evolution of cloud physical parameters and their climatic impacts over Central Asia. Based on a comprehensive analysis integrating multi-source observations and reanalysis datasets, we find that cloud cover exhibits a pronounced southwest-to-northeast gradient, with higher cloudiness in high-altitude areas such as the PMP, and Tianshan and Kunlun Mountain ranges. In terms of vertical distribution, high-level clouds dominate, and their spatial pattern resembles that of the TCC. Seasonally, cloud cover peaks in winter (TCC of approximately 60%) and reaches a minimum in summer (approximately 35%). Both TCIW and TCLW are enriched in high-latitude and high-elevation regions. The long-term trends from 1981 to 2020 reveal a consistent decrease across all cloud covers, with the most pronounced decline observed in the LCC. A significant climate shift occurred around 2006, marked by a notable transition in the mean LCC. According to ERA5 data, cloud cover reductions are most prominent in NCA and SCA, whereas ISCCP satellite data indicate more rapid decreases in SCA and SXJ. In contrast, high-altitude regions show increasing trends in cloud cover.
During the summer season (2001–2020), a negative cloud-temperature feedback mechanism emerges over Central Asia. Observational analysis further reveals a significant inverse correlation between surface warming and cloud cover reduction (r = –0.68). This process is primarily driven by the radiative forcing effect of mid- and low-level clouds. As the LCC and MCC decrease, their reflective capacity for the shortwave radiation cooling effect weakens, while the longwave radiation heating effect intensifies, collectively enhancing net surface radiation. The increase in net surface radiation leads to an increase in skin temperature; however, CRF remains a source of uncertainty in the impact on climate. This uncertainty arises from the interaction of multiscale factors, including the regulation of the spatiotemporal variability of cloud microphysical properties and macroscopic characteristics and the complex feedback involving clouds, aerosols, and radiation.
To further advance this understanding, future research will involve using Coupled Model Intercomparison Project Phase 6 model outputs to quantify changes in cloud amount and cloud radiative forcing under different Shared Socioeconomic Pathways, thereby enhancing the understanding of cloud-climate interactions in a warming climate.
In terms of the summer cloud–precipitation interactions, a strong positive correlation is found over most parts of Central Asia. The mid- and low-level clouds are closely associated with convective processes. In NCA, the MCC exhibits the strongest correlation with precipitation (r = 0.83), whereas the LCC dominates in the four other subregions. It is worth noting that the spatial distribution of summer precipitation is highly consistent with that of the CWP, with both characterized by a southwest-to-northeast increasing gradient. In addition, the cloud water content is significantly higher in high-altitude regions compared with the surrounding areas. Observations indicate that mountainous regions, including Tianshan and PMP, serve as both cloud water aggregation centers and precipitation maxima, underscoring the critical role of orographic forcing in regulating the regional hydrological cycle. Solid-phase cloud water is predominantly concentrated in PMP, NXJ, and SXJ, whereas liquid-phase cloud water is mainly distributed over NCA and SCA. The distribution pattern reflects the role of clouds in facilitating precipitation formation, warranting further investigation into the atmospheric circulation and specific cloud microphysical processes involved.

Author Contributions

Conceptualization, X.X., W.M. and J.Y.; methodology, X.X. and L.M.; software, X.X.; validation, W.M. and J.Y.; formal analysis, X.X.; investigation, L.M.; resources, X.X.; data curation, X.X.; writing—original draft preparation, X.X.; writing—review and editing, J.Y.; visualization, L.M.; supervision, W.M.; project administration, X.X.; funding acquisition, L.M. All authors have read and agreed to the published version of the manuscript.

Funding

This research was funded by Key R&D Program of Xinjiang Uygur Autonomous Region (Grant No. 2023B03019-2), Shanghai Cooperation Organization (SCO) Science and Technology Partnership and International S&T Cooperation Program (Grant No. 2023E01022), China Desert Meteorological Science Research Foundation (Grant No. Sqj2024004), Key R&D Program of Xinjiang Uygur Autonomous Region (Grant No. 2022B03021-1), S&T Development Fund of CAMS (Grant No. 2021KJ034).

Data Availability Statement

The original contributions presented in this study are included in the article. Further inquiries can be directed to the corresponding author.

Acknowledgments

The authors would like to thank European Centre for Medium Range Weather Forecasts for providing the data of ERA5, ISCCP for providing the data of TCC, Clouds and the Earth’s Radiant Energy System for providing the data of shortwave and longwave, Global Precipitation Climatology Centre for providing the data of precipitation. The authors would also like to acknowledge the reviewers for their thorough comments that helped to improve the manuscript.

Conflicts of Interest

The authors declare no conflicts of interest.

References

  1. Bender, F.A.M.; Ramanathan, V.; Tselioudis, G. Changes in extratropical storm track cloudiness 1983–2008: Observational support for a poleward shift. Clim. Dyn. 2012, 38, 2037–2053. [Google Scholar] [CrossRef]
  2. Stephens, G.L. Cloud Feedbacks in the Climate System: A Critical Review. J. Clim. 2005, 18, 237–273. [Google Scholar] [CrossRef]
  3. Wild, M.; Folini, D.; Hakuba, M.Z.; Schär, C.; Seneviratne, S.I.; Kato, S.; Rutan, D.; Ammann, C.; Wood, E.F.; König-Langlo, G. The energy balance over land and oceans: An assessment based on direct observations and CMIP5 climate models. Clim. Dyn. 2015, 44, 3393–3429. [Google Scholar] [CrossRef]
  4. Zhou, C.; Zelinka, M.D.; Klein, S.A. Impact of decadal cloud variations on the Earth’s energy budget. Nat. Geosci. 2016, 9, 871–874. [Google Scholar] [CrossRef]
  5. Sassen, K.; Wang, Z. Classifying clouds around the globe with the CloudSat radar: 1-year of results. Geophys. Res. Lett. 2008, 35, L04805. [Google Scholar] [CrossRef]
  6. Wu, Y.; Gao, J.; Zhao, A. Cloud properties and dynamics over the Tibetan Plateau—A review. Earth-Sci. Rev. 2024, 248, 104633. [Google Scholar] [CrossRef]
  7. Yan, Y.; Liu, Y.; Lu, J. Cloud vertical structure, precipitation, and cloud radiative effects over Tibetan Plateau and its neighboring regions. J. Geophys. Res. Atmos. 2016, 121, 5864–5877. [Google Scholar] [CrossRef]
  8. Zeng, Y.; Yang, L.; Tong, Z.; Jiang, Y.; Zhou, Y.; Lu, X.; Abulikemu, A.; Li, J. Seasonal Variation in Total Cloud Cover and Cloud Type Characteristics in Xinjiang, China Based on FY-4A. Remote Sens. 2024, 16, 2803. [Google Scholar] [CrossRef]
  9. Crook, N.A.; Tucker, D.F. Flow over Heated Terrain. Part I: Linear Theory and Idealized Numerical Simulations. Mon. Weather Rev. 2005, 133, 2552–2564. [Google Scholar] [CrossRef]
  10. Jianjun, L.I.U.; Baode, C. Cloud Occurrence Frequency and Structure over the Qinghai-Tibetan Plateau from CloudSat Observation. Plateau Meteorol. 2017, 36, 632–642. [Google Scholar] [CrossRef]
  11. Tucker, D.F.; Crook, N.A. The Generation of a Mesoscale Convective System from Mountain Convection. Mon. Weather Rev. 1999, 127, 1259. [Google Scholar] [CrossRef]
  12. Lei, Y.; Letu, H.; Shang, H.; Shi, J. Cloud cover over the Tibetan Plateau and eastern China: A comparison of ERA5 and ERA-Interim with satellite observations. Clim. Dyn. 2020, 54, 2941–2957. [Google Scholar] [CrossRef]
  13. Fujinami, H.; Yasunari, T. The Seasonal and Intraseasonal Variability of Diurnal Cloud Activity over the Tibetan Plateau. J. Meteorol. Soc. Jpn. 2001, 79, 1207–1227. [Google Scholar] [CrossRef]
  14. Wang, W.-C.; Gong, W.; Kau, W.-S.; Chen, C.-T.; Hsu, H.-H.; Tu, C.-H. Characteristics of Cloud Radiation Forcing over East China. J. Clim. 2004, 17, 845–853. [Google Scholar] [CrossRef]
  15. Rucong, Y.; Yongqiang, Y.; Minghua, Z. Comparing cloud radiative properties between the Eastern China and the Indian monsoon region. Adv. Atmos. Sci. 2001, 18, 1090–1102. [Google Scholar] [CrossRef]
  16. Dilinuer, T.; Yao, J.-Q.; Chen, J.; Mao, W.-Y.; Yang, L.-M.; Yeernaer, H.; Chen, Y.-H. Regional drying and wetting trends over Central Asia based on Köppen climate classification in 1961–2015. Adv. Clim. Change Res. 2021, 12, 363–372. [Google Scholar] [CrossRef]
  17. Fallah, B.; Didovets, I.; Rostami, M.; Hamidi, M. Climate change impacts on Central Asia: Trends, extremes and future projections. Int. J. Climatol. 2024, 44, 3191–3213. [Google Scholar] [CrossRef]
  18. Yao, J.; Chen, Y.; Chen, J.; Zhao, Y.; Tuoliewubieke, D.; Li, J.; Yang, L.; Mao, W. Intensification of extreme precipitation in arid Central Asia. J. Hydrol. 2021, 598, 125760. [Google Scholar] [CrossRef]
  19. Chen, F.; Wang, J.; Jin, L.; Zhang, Q.; Li, J.; Chen, J. Rapid warming in mid-latitude central Asia for the past 100 years. Front. Earth Sci. China 2009, 3, 42–50. [Google Scholar] [CrossRef]
  20. Barnett, T.P.; Adam, J.C.; Lettenmaier, D.P. Potential impacts of a warming climate on water availability in snow-dominated regions. Nature 2005, 438, 303–309. [Google Scholar] [CrossRef]
  21. Chen, Y.; Li, W.; Deng, H.; Fang, G.; Li, Z. Changes in Central Asia’s Water Tower: Past, Present and Future. Sci. Rep. 2016, 6, 35458. [Google Scholar] [CrossRef]
  22. Zhang, Q.; Gu, X.; Singh, V.P.; Sun, P.; Chen, X.; Kong, D. Magnitude, frequency and timing of floods in the Tarim River basin, China: Changes, causes and implications. Glob. Planet. Change 2016, 139, 44–55. [Google Scholar] [CrossRef]
  23. Saponaro, A.; Pilz, M.; Wieland, M.; Bindi, D.; Moldobekov, B.; Parolai, S. Landslide susceptibility analysis in data-scarce regions: The case of Kyrgyzstan. Bull. Eng. Geol. Environ. 2015, 74, 1117–1136. [Google Scholar] [CrossRef]
  24. Lemenkova, P. Current problems of water supply and usage in central Asia, Tian Shan basin. Environ. Clim. Technol. 2013, 1, 11–16. [Google Scholar] [CrossRef]
  25. Rossow, W.B.; Schiffer, R.A. Advances in Understanding Clouds from ISCCP. Bull. Am. Meteorol. Soc. 1999, 80, 2261–2288. [Google Scholar] [CrossRef]
  26. Doelling, D.R.; Sun, M.; Nguyen, L.T.; Nordeen, M.L.; Haney, C.O.; Keyes, D.F.; Mlynczak, P.E. Advances in Geostationary-Derived Longwave Fluxes for the CERES Synoptic (SYN1deg) Product. J. Atmos. Ocean. Technol. 2016, 33, 503–521. [Google Scholar] [CrossRef]
  27. Zhao, Y.; Li, J.; Zhang, L.; Deng, C.; Li, Y.; Jian, B.; Huang, J. Diurnal cycles of cloud cover and its vertical distribution over the Tibetan Plateau revealed by satellite observations, reanalysis datasets, and CMIP6 outputs. Atmos. Chem. Phys. 2023, 23, 743–769. [Google Scholar] [CrossRef]
  28. Ma, Q.; You, Q.; Ma, Y.; Cao, Y.; Zhang, J.; Niu, M.; Zhang, Y. Changes in cloud amount over the Tibetan Plateau and impacts of large-scale circulation. Atmos. Res. 2021, 249, 105332. [Google Scholar] [CrossRef]
  29. Hersbach, H.; Bell, B.; Berrisford, P.; Hirahara, S.; Horányi, A.; Muñoz-Sabater, J.; Nicolas, J.; Peubey, C.; Radu, R.; Schepers, D.; et al. The ERA5 global reanalysis. Q. J. R. Meteorol. Soc. 2020, 146, 1999–2049. [Google Scholar] [CrossRef]
  30. Czernecki, B.; Taszarek, M.; Marosz, M.; Półrolniczak, M.; Kolendowicz, L.; Wyszogrodzki, A.; Szturc, J. Application of machine learning to large hail prediction—The importance of radar reflectivity, lightning occurrence and convective parameters derived from ERA5. Atmos. Res. 2019, 227, 249–262. [Google Scholar] [CrossRef]
  31. Bao, S.; Letu, H.; Zhao, J.; Shang, H.; Lei, Y.; Duan, A.; Chen, B.; Bao, Y.; He, J.; Wang, T.; et al. Spatiotemporal distributions of cloud parameters and their response to meteorological factors over the Tibetan Plateau during 2003–2015 based on MODIS data. Int. J. Climatol. 2019, 39, 532–543. [Google Scholar] [CrossRef]
  32. Chen, G.; Zhang, X.; Fu, Y. Diurnal Variation in Clouds and Radiative Budgets Over the Tibetan Plateau During Summer Using CERES Data. J. Geophys. Res. Atmos. 2022, 127, e2021JD036329. [Google Scholar] [CrossRef]
  33. Dolinar, E.K.; Dong, X.; Xi, B. Evaluation and intercomparison of clouds, precipitation, and radiation budgets in recent reanalyses using satellite-surface observations. Clim. Dyn. 2016, 46, 2123–2144. [Google Scholar] [CrossRef]
  34. Young, A.H.; Knapp, K.R.; Inamdar, A.; Hankins, W.; Rossow, W.B. The International Satellite Cloud Climatology Project H-Series climate data record product. Earth Syst. Sci. Data 2018, 10, 583–593. [Google Scholar] [CrossRef]
  35. Loeb, N.G.; Doelling, D.R.; Wang, H.; Su, W.; Nguyen, C.; Corbett, J.G.; Liang, L.; Mitrescu, C.; Rose, F.G.; Kato, S. Clouds and the Earth’s Radiant Energy System (CERES) Energy Balanced and Filled (EBAF) Top-of-Atmosphere (TOA) Edition-4.0 Data Product. J. Clim. 2018, 31, 895–918. [Google Scholar] [CrossRef]
  36. Hu, Z.; Zhou, Q.; Chen, X.; Li, J.; Li, Q.; Chen, D.; Liu, W.; Yin, G. Evaluation of three global gridded precipitation data sets in central Asia based on rain gauge observations. Int. J. Climatol. 2018, 38, 3475–3493. [Google Scholar] [CrossRef]
  37. Kottek, M.; Grieser, J.; Beck, C.; Rudolf, B.; Rubel, F. World Map of the Köppen-Geiger Climate Classification Updated. Meteorol. Z. 2006, 15, 259–263. [Google Scholar] [CrossRef]
  38. Chen, D.; Chen, H.W. Using the Köppen classification to quantify climate variation and change: An example for 1901–2010. Environ. Dev. 2013, 6, 69–79. [Google Scholar] [CrossRef]
  39. Allan, R.P. Combining satellite data and models to estimate cloud radiative effect at the surface and in the atmosphere. Meteorol. Appl. 2011, 18, 324–333. [Google Scholar] [CrossRef]
  40. Shouguo, D.; Guangyu, S.; Chunsheng, Z. Analyzing global trends of different cloud types and their potential impacts on climate by using the ISCCP D2 dataset. Chin. Sci. Bull. 2004, 49, 1301–1306. [Google Scholar] [CrossRef]
  41. Chang, Y.; Guo, X.; Tang, J.; Lu, G. Aircraft measurement campaign on summer cloud microphysical properties over the Tibetan Plateau. Sci. Rep. 2019, 9, 4912. [Google Scholar] [CrossRef] [PubMed]
  42. Wang, J.; Jian, B.; Wang, G.; Yuxin, Z.; Li, Y.; Letu, H.; Zhang, M.; Li, J. Climatology of Cloud Phase, Cloud Radiative Effects and Precipitation Properties over the Tibetan Plateau. Remote Sens. 2021, 13, 363. [Google Scholar] [CrossRef]
  43. Peng, D.; Zhou, T.; Zhang, L. Moisture Sources Associated with Precipitation during Dry and Wet Seasons over Central Asia. J. Clim. 2020, 33, 10755–10771. [Google Scholar] [CrossRef]
  44. Smith, R.B. 100 Years of Progress on Mountain Meteorology Research. Meteorol. Monogr. 2019, 59, 20.1–20.73. [Google Scholar] [CrossRef]
  45. Webb, M.; Senior, C.; Bony, S.; Morcrette, J.J. Combining ERBE and ISCCP data to assess clouds in the Hadley Centre, ECMWF and LMD atmospheric climate models. Clim. Dyn. 2001, 17, 905–922. [Google Scholar] [CrossRef]
  46. Chen, N.; Li, W.; Tanikawa, T.; Hori, M.; Aoki, T.; Stamnes, K. Cloud mask over snow-/ice-covered areas for the GCOM-C1/SGLI cryosphere mission: Validations over Greenland. J. Geophys. Res. Atmos. 2014, 119, 12287–12300. [Google Scholar] [CrossRef]
  47. Stillinger, T.; Roberts, D.A.; Collar, N.M.; Dozier, J. Cloud Masking for Landsat 8 and MODIS Terra Over Snow-Covered Terrain: Error Analysis and Spectral Similarity Between Snow and Cloud. Water Resour. Res. 2019, 55, 6169–6184. [Google Scholar] [CrossRef]
  48. Mendoza, V.; Pazos, M.; Garduño, R.; Mendoza, B. Thermodynamics of climate change between cloud cover, atmospheric temperature and humidity. Sci. Rep. 2021, 11, 21244. [Google Scholar] [CrossRef]
  49. Tang, Q.; Leng, G. Damped summer warming accompanied with cloud cover increase over Eurasia from 1982 to 2009. Environ. Res. Lett. 2012, 7, 014004. [Google Scholar] [CrossRef]
  50. Rudisill, W.; Feldman, D.; Cox, C.J.; Riihimaki, L.; Sedlar, J. Seasonality and Albedo Dependence of Cloud Radiative Forcing in the Upper Colorado River Basin. J. Geophys. Res. Atmos. 2025, 130, e2024JD042366. [Google Scholar] [CrossRef]
  51. Khain, A.; Prabha, T.V.; Benmoshe, N.; Pandithurai, G.; Ovchinnikov, M. The mechanism of first raindrops formation in deep convective clouds. J. Geophys. Res. Atmos. 2013, 118, 9123–9140. [Google Scholar] [CrossRef]
  52. Kato, S.; Rose, F.G.; Rutan, D.A.; Thorsen, T.J.; Loeb, N.G.; Doelling, D.R.; Huang, X.; Smith, W.L.; Su, W.; Ham, S.-H. Surface Irradiances of Edition 4.0 Clouds and the Earth’s Radiant Energy System (CERES) Energy Balanced and Filled (EBAF) Data Product. J. Clim. 2018, 31, 4501–4527. [Google Scholar] [CrossRef]
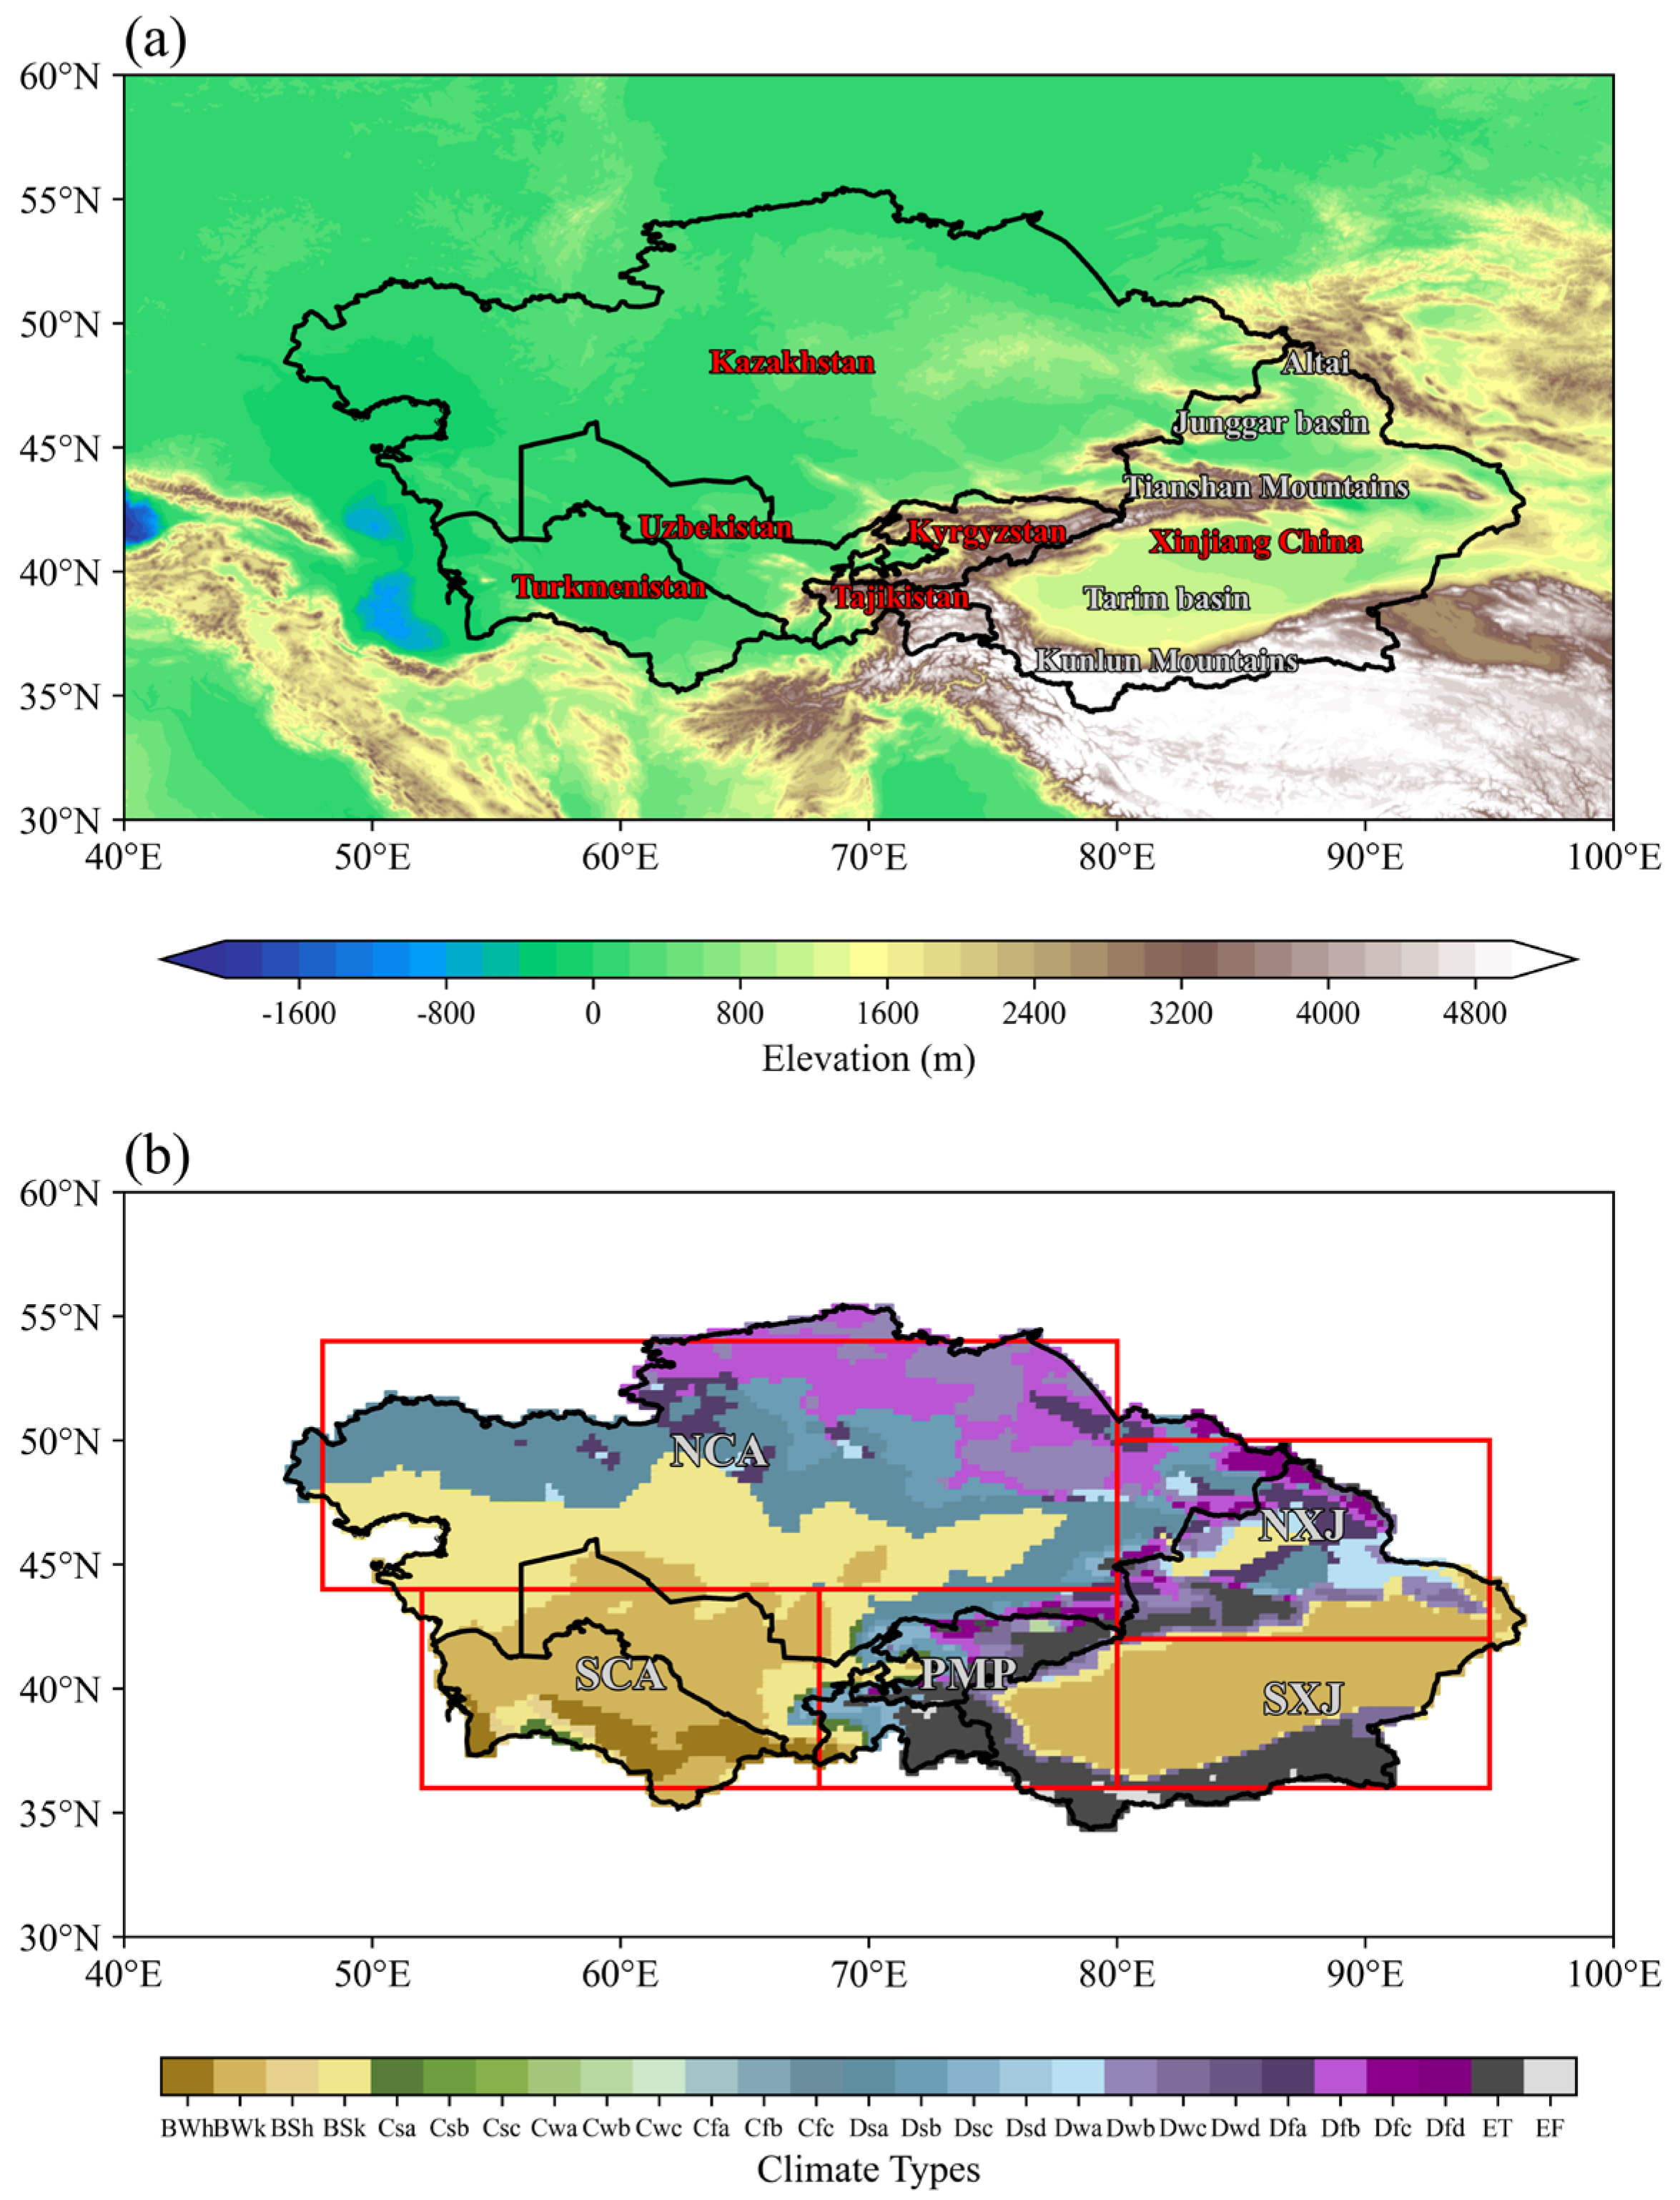
Figure 1. (a) Topography of Central Asia (shading; m); (b) spatial distribution of Köppen climate types (shading) in Central Asia during 2001–2020. The red rectangles represent the five subregions of Central Asia: Northern Central Asia (NCA), Southern Central Asia (SCA), the Pamir Plateau (PMP), Northern Xinjiang (NXJ), and Southern Xinjiang (SXJ).
Remotesensing 17 02724 g001
Figure 2. Spatial distribution of the annual and seasonal cloud cover over Central Asia during 2001–2020. (a,e,i,m,q) Total cloud cover (TCC, %); (b,f,j,n,r) high cloud cover (HCC, %); (c,g,k,o,s) middle cloud cover (MCC, %); and (d,h,l,p,t) low cloud cover (LCC, %). Seasons are defined as spring (MAM), summer (JJA), autumn (SON), and winter (DJF).
Remotesensing 17 02724 g002
Figure 3. Same as Figure 2, but for (a,d,g,j,m) cloud base height (CBH; km); (b,e,h,k,n) total column ice water (TCIW; g m−2); and (c,f,i,l,o) total column liquid water (TCLW; g m−2).
Remotesensing 17 02724 g003
Figure 4. (a) Variations in the regional mean TCC (blue bar; %), HCC, MCC, and LCC (red lines; %) from January to December. (b) Annual and seasonal variations in the regional mean TCC, HCC, MCC, and LCC (%) over Central Asia in the period of 2001–2020.
Remotesensing 17 02724 g004
Figure 5. Normalized time series and linear trends (a−1) of (a,e,i,m,q) TCC; (b,f,j,n,r) HCC; (c,g,k,o,s) MCC; and (d,h,l,p,t) LCC over Central Asia on annual and seasonal scales during 1981–2020 (ERA5; green lines) and 1984–2016 (ISCCP; blue lines). Regression equations are shown for each trend line, with the asterisks denoting statistical significance at the 95% confidence level.
Remotesensing 17 02724 g005
Figure 6. Normalized time series and linear trends (a−1) of TCC in five subregions of Central Asia on annual and seasonal scales during 1981–2020 (ERA5; green lines) and 1984–2016 (ISCCP; blue lines). Regression equations are shown; asterisks indicate significance at the 95% level.
Remotesensing 17 02724 g006
Figure 7. Spatial distribution of the trends in ERA5-derived (a,e,i,m,q) TCC; (b,f,j,n,r) HCC; (c,g,k,o,s) MCC; and (d,h,l,p,t) LCC (% a−1) over Central Asia on annual and seasonal scales during 1981–2020. Dots indicate statistical significance at the 95% confidence level.
Remotesensing 17 02724 g007
Figure 8. Spatial distribution of the correlation coefficients between cloud cover and skin temperature (SKT) over Central Asia on annual and seasonal scales during 1981–2020. (a,e,i,m,q) TCC and SKT; (b,f,j,n,r) HCC and SKT; (c,g,k,o,s) MCC and SKT; and (d,h,l,p,t) LCC and SKT. Black stippling denotes 95% significance (Student’s t-test).
Remotesensing 17 02724 g008
Figure 9. (a) Spatial distribution of the summer skin temperature trends (°C a−1) over Central Asia during 2001–2020. (b) Interannual variations of normalized summer cloud radiative forcing (CRF; bars) and skin temperature (SKT; line) averaged over Central Asia. Regression equations are shown; asterisks indicate significance at the 95% level. (c) Spatial distribution of the summer CRF (W m−2). (d) Summer CRF trends (W m−2 a−1). (e) Regionally averaged correlation coefficients between summer CRF and SKT as well as cloud covers. Light and dark dashed lines indicate significance at the 95% and 99% confidence levels, respectively. (f) Regional averages of the summer CRF (orange bars), shortwave CRF (SWCF; blue bars), and longwave CRF (LWCF; plum bars) for Central Asia (CA), NCA, SCA, PMP, NXJ, and SXJ. Black stippling in panels (a,d) indicate areas where trends are statistically significant at the 95% confidence level.
Remotesensing 17 02724 g009
Figure 10. Spatial distribution of the correlation coefficients between cloud cover and precipitation over Central Asia in summer during 1981–2020. (a) TCC and precipitation; (b) HCC and precipitation; (c) MCC and precipitation; (d) LCC and precipitation. (e) Regionally averaged correlation coefficients between precipitation and cloud covers. (f) Correlation coefficients between precipitation and cloud covers averaged over five subregions of Central Asia. Black stippling denotes 95% significance (Student’s t-test).
Remotesensing 17 02724 g010
Figure 11. (a) Spatial distribution of the summer precipitation over Central Asia during 2001–2020 (mm). (b) Summer precipitation trends (mm a−1). (c) Summer CWP (g m−2). (d) Summer CWP trends (g m−2 a−1). (e) Regional averages of the summer CWP (orange bars), TCIW (plum bars), and TCLW (blue bars) for CA, NCA, SCA, NXJ, and SXJ. Dots in panels (a,c) represent the 95% confidence level.
Remotesensing 17 02724 g011
Table 1. The temporal coverage and resolution of datasets used in this study.
DataTemporal CoverageSpatial ResolutionTemporal Resolution
ERA51981–20200.25° × 0.25°Monthly
ISCCP1984–20161° × 1°Monthly
CERES2001–20201° × 1°Monthly
GPCC2001–20200.25° × 0.25°Monthly
Table 2. Climatic subregions and classification of Central Aisa.
AbbreviationSubregion DistributionKöppen–Geiger Climate Classification
NCA: Northern Central Aisa44–54°N; 48–80°EDry–desert–cold (BWk)
Snow–steppe–hot (Dsa)
SCA: Southern Central Aisa36–44°N; 52–68°EDry–desert–cold (BWk)
Dry–steppe–cold (BSk)
PMP: Pamir Plateau36–44°N; 68–80°EPolar–tundra (ET)
Dry–desert–cold (BWk)
NXJ: Northern Xinjiang42–50°N; 80–95°EDry–desert–cold (BWk)
Snow–humid–hot (Dfa)
SXJ: Southern Xinjiang36–42°N; 80–95°EDry–desert–cold (BWk)
Polar–tundra (ET)
Table 3. Correlation coefficients between cloud cover and skin temperature averaged over Central Asia during 2001–2020, and the proportion of grid points passing the 99% and 95% significance levels.
Correlation
99% Grid Points
95% Grid Points
TCCHCCMCCLCC
Annual−0.223
0.026
0.084
−0.148
0.002
0.014
−0.126
0.033
0.124
−0.178
0.105
0.223
Spring−0.553
0.109
0.329
−0.092
0.050
0.163
−0.608
0.338
0.493
−0.676
0.583
0.742
Summer−0.682
0.406
0.577
−0.457
0.100
0.259
−0.720
0.395
0.512
−0.616
0.600
0.742
Autumn−0.473
0.070
0.212
−0.265
0.002
0.017
−0.644
0.255
0.423
−0.560
0.238
0.403
Winter0.325
0.127
0.268
0.534
0.294
0.523
0.126
0.055
0.228
0.060
0.115
0.252
Note: Bold indicates the 95% confidence level according to Student’s t test.
Table 4. Correlation coefficients between cloud cover and skin temperature averaged over Central Asia in summer during 2001–2020.
SubregionsTCCHCCMCCLCC
NCA0.0830.5500.8680.789
SCA−0.388−0.1890.4480.710
PMP0.5100.559−0.0750.471
NXJ−0.430−0.271−0.3550.617
SXJ0.0090.0110.0170.025
Note: Bold indicates the 95% confidence level according to Student’s t test.
Disclaimer/Publisher’s Note: The statements, opinions and data contained in all publications are solely those of the individual author(s) and contributor(s) and not of MDPI and/or the editor(s). MDPI and/or the editor(s) disclaim responsibility for any injury to people or property resulting from any ideas, methods, instructions or products referred to in the content.