Article

Satellite-Measured Suspended Particulate Matter Flux and Freshwater Flux in the Yellow Sea and East China Sea

1
NOAA National Environmental Satellite, Data, and Information Service, Center for Satellite Applications and Research, College Park, MD 20746, USA
2
Cooperative Institute for Research in the Atmosphere, Colorado State University, Fort Collins, CO 80523, USA
*
Author to whom correspondence should be addressed.
Remote Sens. 2025, 17(15), 2726; https://doi.org/10.3390/rs17152726
Submission received: 13 June 2025 / Revised: 30 July 2025 / Accepted: 5 August 2025 / Published: 6 August 2025
(This article belongs to the Special Issue Remote Sensing for Ocean-Atmosphere Interaction Studies)

Abstract

Traditionally, the surface suspended particulate matter (SPM) and freshwater fluxes have been computed using in situ SPM, salinity, and current measurements or through the numerical modeling. In this study, satellite-derived SPM concentration, ocean current, and sea surface salinity (SSS) are used to demonstrate the capability to characterize and quantify the surface SPM flux and freshwater flux in the Yellow Sea (YS) and East China Sea (ECS). The different routes for SPM and freshwater to transport from the coastal region to the interior ECS are identified. The seasonal and interannual SPM and freshwater fluxes from the coastal region of the ECS are further characterized and quantified. The average SPM flux reaches ~0.3–0.4 g m−2 s−1 along the route. The SPM and the freshwater fluxes in the region show different seasonality. The intensified SPM flux from the ECS coast to the offshore in winter is one order higher than the SPM flux in summer, while the offshore freshwater flux peaks in summer and weakens significantly in winter. Particularly, we found that the SPM and SSS features in the ECS changed in response to the 2020 summer Yangtze River flood event. These spatial and temporal changes for SPM and SSS in the ECS in the 2020 summer and early autumn were attributed to the anomalous surface SPM and freshwater fluxes in the same period.

1. Introduction

As one of the world’s most turbid water regions [1,2], the Yellow Sea (YS) and East China Sea (ECS) are featured with high loadings of sediment concentrations [3,4] in the continental shelf regions. Significant seasonal changes in the suspended particulate matter (SPM) concentration [1,3,5] were reported with the highest SPM in spring and winter and the lowest in summer. Notably, SPM even reached over ~700 mg/L in the Subei Shoal region of the YS and ECS [4].
Corresponding to the dynamics of SPM in the YS and ECS, the ocean optical properties, e.g., normalized water-leaving radiance spectra [nLw(λ)] from the blue to near-infrared (NIR) and shortwave infrared (SWIR) bands [6,7], and diffuse attenuation coefficient at 490 nm [Kd(490)] [8], all exhibit distinct features compared to the other coastal and inland waters [1,9]. It is also found that suspended sediments are transported from the Subei coast of the YS to the central YS, and sediments were likely transported across the front to the central continental shelf of the ECS during the winter season [10].
The Yangtze River, the fifth largest river in the world, discharges ~2.8 × 10⁴ m3/s freshwater into the ECS [11]. The sediment discharge into the ECS is approximately 5.0 × 10⁸ tons annually [12]. An over 50% decline of Yangtze River water and sediment discharge was reported in the last two decades due to the climate change and the construction of the Three Gorges Dam [13,14]. The freshwater discharge during the dry season (November to March) is only about one third of the freshwater discharge in the rainy season (June to August) [11].
In the YS, sediment depositions from the ancient Yellow River help to form the Subei Shoal [15] off China’s Jiangsu province [15]. In fact, an estimated of 40% sediment load in the Yangtze River is deposited in the estuary, mostly seaward of the South Channel. The other sediments are deposited offshore and resuspended, and carried further offshore to open oceans in the winter season [16]. Significant drop of the sediment transportation from the Yangtze River into the sea was observed after the Three Gorge Dam was commissioned [17].
Seasonal monsoons, the Kuroshio Current, and semidiurnal and diurnal tides [18] are primary processes that dominate the ocean hydrography, ocean circulation, and SPM dynamics in the YS and ECS. The Yellow Sea Coast Current (YSCC), Yellow Sea Warm Current (YSWC), Subei Coastal Current (SCC), Taiwan Warm Current (TWC), TsushiMa Warm Current (TMWC), and Kuroshio Current are the major ocean currents that drive the ocean circulation, SPM and freshwater transports in the YS and ECS [19,20,21,22]. Both coastal currents in shallow waters and secondary branch currents of the Kuroshio (e.g., YSWC) show significant seasonal variability from winter to summer [20].
Sea surface salinity (SSS) in the YS and ECS shows strong seasonal variability [23]. In the ECS, Changjiang/Yangtze River Diluted Water (CDW) (or the Changjiang/Yangtze River plume) caused by the freshwater flux of Yangtze River is a major driver of the SSS distribution, and evaporation minus precipitation (E-P) has a secondary effect on the SSS distribution. The dynamic and thermodynamic effects of the freshwater input from the river may be phase lagged by up to a season [24]. It is also found that surface salinity interannual variability in the YS and ECS is mainly attributed to El Niño–Southern Oscillation (ENSO), which causes the change in precipitation in China, and eventually affects the variability of Yangtze River discharge [25]. The northward drifting of low-salinity CDW was even found to intrude into interior of the YS and ECS [26].
In the YS and ECS, satellite remote sensing has long been used to study physical, optical, biological, and biogeochemical processes from SST images [27,28,29], pigment concentrations [30], occurrences of green algae blooms in the YS [31,32], the seasonal sediment plume in central ECS [33], and the spring-neap tidal effects [34] in the ECS from satellite ocean color observations. SSSs derived from the combination of satellite ocean color observations using the machine learning method in the YS and ECS [35,36] were also explored. Specifically, SPM seasonal maps in the YS and ECS are quantified and characterized with the satellite observations [1]. The variability of suspended sediment concentration in the Yangtze Estuary and adjacent coast driven by the river discharge was captured [5]. SSS measurements from the Soil Moisture Active Passive (SMAP) and Soil Moisture and Ocean Salinity (SMOS) missions are used to map global SSS with good accuracy [37]. The SMAP SSS in combination with the Hybrid Coordinate Ocean Model (HYCOM) SSS can be synergistically integrated to improve SSS observations for global oceans [38]. In addition, seasonal variations in surface circulation of the YS and ECS were derived from satellite altimetry data [39].
Although numerous studies have investigated SPM, salinity, and the ocean circulations in the YS and ECS regions from the satellite remote sensing, few synthetic research studies examined the SPM flux and freshwater flux simultaneously in the YS and ECS. Indeed, recent developments in the ocean satellite remote sensing, e.g., SPM [4], SMAP and SMOS SSS data [40,41], and ocean circulation data from the Jason 1–3 [42] and Surface Water Ocean Topography (SWOT) [43] missions have provided us the indispensable data to assess the SPM and freshwater fluxes in the YS and ECS. It should be noted that both SPM and freshwater fluxes in here refer to the surface (or top layer) SPM and freshwater fluxes that are derived from satellite measurements.
SPM plays important roles in water quality, biogeochemical cycles, and nutrient supplies in the marine ecosystem, while the freshwater flux is highly related to the ocean-atmosphere-land interactions, and is one of major drivers for ocean circulation, thermohaline dynamics, and coastal ecosystem change. Characterizing the SPM and freshwater fluxes over coastal oceans is essential to better understand the ocean physical, optical, biological, and biogeochemical dynamics and monitor the ocean environmental changes, especially in coastal regions. This is particularly true in the YS and ECS due to their complexity of the ocean hydrological, physical, biological, and ecological dynamics and the large population living around the YS and ECS regions.
In this study, we will fuse satellite-derived SPM, SSS, and surface current data on a daily basis in the YS and ECS to evaluate the SPM and freshwater fluxes between 2018 and 2023. The seasonal and interannual variability of the SPM and freshwater fluxes are characterized and quantified. The routes of transporting SPM and freshwater from the coast and Yangtze River Estuary region to the YS and ECS interior are identified. Finally, we reveal and discuss the influence of the Yangtze River floods on SPM and SSS in the YS and ECS.

2. Materials and Methods

2.1. Satellite SPM, SSS, and Current Velocity Data

2.1.1. SPM Data

Observations from the Visible Infrared Imaging Radiometer Suite (VIIRS) on the Suomi National Polar-orbiting Partnership (SNPP), NOAA-20, and NOAA-21 satellites can provide ocean color products such as nLw(λ) at around 412–862 nm [6,7,44,45], chlorophyll-a (Chl-a) concentration [46], Kd(490) [8], SPM, etc. The daily SPM data are derived from VIIRS global nLw(λ) at the visible and NIR bands in the study region [4,47]. The SPM algorithm is based on a calibrated relationship between SPM and a generalized index composed of four nLw(λ) ratios (486, 671, 745, and 862 nm over 551 nm, respectively, for VIIRS-SNPP) [4,47]. This SPM algorithm shows that it can be used to produce high-quality satellite-derived SPM product for global oceans, especially in the coastal region and turbid or highly turbid waters in the YS and ECS [4,47].
In this study, the gap-free daily SPM product data from 2018 to 2023 are used. The daily gap-free SPM data are derived using the Data Interpolating Empirical Orthogonal Functions (DINEOF) method from multi-satellite observations [48,49]. This method fills missing data in satellite-derived ocean color products with the surrounding data (spatially) and historical (temporally) patterns (EOF modes). The reconstructed pixels are comparable to the original data in terms of the data accuracy [48]. Using Chl-a as an example, the difference in the reconstructed data and the original data is generally within ~2% of the original data with a standard deviation of ~15%. The SPM products from multiple satellite ocean color sensors can even be merged to improve global spatial coverage, providing more ocean features over coastal and inland waters, and further enhancing the accuracy of the gap-free data [49].

2.1.2. SSS Data

The daily SSS data were produced through a multivariate optimal interpolation algorithm, which combines SSS measurements from NASA’s SMAP mission and ESA’s SMOS mission with the in situ salinity measurements and satellite SST information. Comparisons between the SMAP SSS and objectively interpolated (OI) gridded Argo SSS datasets show that the SMAP SSS data have an accuracy of ~0.2 psu in the tropics [50].
The SSS product from the SMOS mission [41] has been providing the high-quality SSS data for the global ocean with an effective spatial resolution of ~40 km and temporal resolution ~3 days since November 2009. The accuracy of the Leval-3 SMOS SSS is ~0.24 psu [51].
In this study, the gap-free daily global SSS data were acquired from the Copernicus Marine Environment Monitoring Service (https://doi.org/10.48670/moi-00051 (accessed on 18 February 2025). The spatial resolution for this dataset is 0.125° × 0.125° for the global coverage. The daily SSS maps in the YS and ECS were extracted from the global SSS data.

2.1.3. Ocean Current Data

The daily ocean current data were acquired from the Copernicus Marine Environment Monitoring Service (https://doi.org/10.48670/moi-00148 (accessed on 18 February 2025)). This dataset has a spatial resolution of 0.125° × 0.125°. The ocean surface velocity is computed using the satellite altimetry measurements from a variety of the satellite altimetry missions such as TOPEX/POSEIDON [52] and Jason missions [53,54].
The absolute surface currents in this study are computed using the principle of geostrophic flow from the gridded Absolute Dynamic Topography (ADT) data [54]. Comparisons between the satellite altimetry derived velocity and the velocity from drifter show that the root mean square (RMS) between them is around 11.4 cm/s for zonal component and 10.5 cm/s for the meridional component for the global ocean excluding the equatorial ocean [54]. In the YS and ECS, the difference between them is relatively small, and the geostrophic approximation indeed leads to an accurate estimation of the currents in this area.
On the other hand, assessment for the impact of the Ekman (wind) effect on the global ocean currents shows that the wind-driven Ekman response to the wind stress forcing in the YS and ECS regions is low at both the surface and 15 m depth [55]. Studies also show that the altimetry-derived current products are generally robust and in good agreement with the surface drifter measurements in a variety of the regions such as the Gulf of America (GOA, previously Gulf of Mexico) [56,57] and Greenland shelf region [58]. All of these provide further evidence that the daily current data derived from satellite altimetry can be confidently used to assess the surface SPM and freshwater fluxes in the YS and ECS regions.

2.2. Satellite-Derived SPM and Freshwater Fluxes

The ocean surface SPM flux in the YS and ECS is calculated from the current velocity and SPM as follows:
F s p m x x , y = U x , y × S s p m x , y ,
F s p m y x , y = V x , y × S s p m x , y ,   and
F s p m T ( x , y ) = F s p m x x , y 2 + F s p m y x , y 2 ,
where F s p m x (x, y), F s p m y (x, y), and F s p m T (x, y) represent surface SPM flux zonal component, meridional component, and total at location (x, y), respectively, and U(x, y) and V(x, y) (unit of m/s) are the sea surface velocities in the zonal and meridional directions, respectively. Sspm(x, y) (unit of mg/L) is the SPM concentration at location (x, y) from satellite observations.
Similarly to the approach to compute the freshwater flux [59,60,61], the surface freshwater flux in the YS and ECS is calculated as follows:
F f w x x , y = U x , y × R f w x , y ,
F f w y x , y = V x , y × R f w x , y ,
Rfw(x, y) = (SrefS(x, y)) × Dref, and
F f w T x , y = F f w x x , y 2 + F f w y x , y 2 ,
where F f w x (x, y), F f w y (x, y), and F f w T (x, y) are the zonal, meridional, and total surface freshwater fluxes at location (x, y), Rfw(x, y) represents the relative freshwater mass, S(x, y) is SSS at (x, y), Dref is the reference density of the ocean water at 20 °C and 32 psu, and Sref is the reference SSS in the YS and ECS. In the YS and ESC study region, the mean satellite SSS in the YS and ECS during the study period was 32.08 psu, thus we use 32 psu for Sref and 1.015 kg L−1 for Dref to compute Rfw(x, y) in order to characterize and quantify the freshwater flux in the YS and ECS from satellite observations. Note that the SPM and freshwater fluxes in the above equations are the fluxes at the sea surface (i.e., transports in the ocean top-layer), and the units for the surface SPM and freshwater fluxes are both g m−2 s−1. The freshwater flux (instead of the salt budget) is computed to better reflect the impact of the driving forcing (river discharge, rainfall, etc.) in the YS and ECS regions.
Equations (1)–(7) show that the surface SPM and freshwater fluxes are determined by SPM, SSS, and current velocity, thus accuracies of SPM, SSS, and surface current velocity retrievals from satellite data are critical for the quantification of the surface SPM and freshwater fluxes in the YS and ECS regions. A couple of studies have shown that satellite ocean color measurements can provide high-quality SPM in the open ocean, coastal, and inland waters [4,47]. The comparison of global SSS measurements from various satellite missions (e.g., SMAP, SMOS) show good agreements [37], and the accuracy of the SMAP SSS in the tropical Pacific is <~0.2 psu in comparison with the in situ measurements [50]. The altimetry-derived current products are generally robust and in good agreement with the surface drifter measurements as described in the previous studies [56,57,58]. On the other hand, satellite-derived seasonal SPM fluxes in the northern GOA region in a recent study are consistent with the in situ measurements and model simulations [62,63]. Furthermore, the interannual net surface SPM flux off the Mississippi River from the satellite-derived SPM flux in the period of 2018–2023 agreed well with the river discharge data at the United States Geological Survey (USGS) station of Vicksburg, MS, USA.

3. Results

3.1. Climatology of the SPM and Freshwater Fluxes

Using the satellite measurements from 2018 to 2023, we computed the climatology maps of the ocean current (Figure 1a), SPM (Figure 1b), and SSS (Figure 1c) in the YS and ECS. Note that the climatology of a specific parameter (e.g., SPM, SSS, SPM and freshwater fluxes) in this study is computed as the mean value of all measurements from 2018 to 2023, while the monthly climatology is the mean value of all measurements in a specific month from 2018 to 2023. Figure 1a shows the major circulation patterns in the region. The TWC flowing alongshore in the South China Sea starts to move offshore at 28°N–30°N. The strong Kuroshio current is still visible at the SE of the study region. In the ESC, the alongshore SCC to the north of the Yangtze River Estuary can be observed moving northwestward, and it starts to turn offshore at ~33.5°N, and merges with the YSCC, and then flows southeastward.
The climatology SPM in the YS and ECS in the period from 2018 to 2023 is similar to the SPM map in the previous study [1] in terms of both the spatial pattern and magnitude. Enhanced SPM with SPM > 100 mg L−1 can be observed in the Hangzhou Bay, Yangtze River Estuary, and coastal region of the ECS. Moderately high SPM is also observed in the central ECS due to the suspension of the sediment [33] and transport of the SPM from the ECS coastal region.
The spatial pattern of SSS in the YS and ECS (Figure 1c) is different from that of SPM. In the coastal region of the ECS and Yangtze River Estuary, the climatology SSS is ~31.5 psu, and it gradually increases to 32.0 psu in the central ECS. A SSS front can be identified across the ECS from southwest ECS to northeast ECS around the Korean Peninsula. This SSS front marks the offshore flow of the TWC. To the east of the SSS front, SSS is featured with high values at ~33–34 psu.
Using Equations (1)–(3), the daily SPM flux in the YS and ECS is computed from 2018 to 2023. Figure 1d is the mean SPM flux in the YS and ECS based on the daily SPM flux in the region between 2018 and 2023. Clearly, a strong offshore SPM flux is observed in coastal regions, especially in the northern Subei Shoal region. However, the surface SPM flux in the ECS becomes significantly weaker across SPM front region. The result is consistent with the previous study showing that most offshore SPM transport actually deposits in the sediment front region [10].
Figure 1d also shows the SPM transport route from the coastal region to offshore. The SPM from the Subei Shoal moves southeastward and merges with the SPM flux from north of the Yangtze River Estuary and eventually moves offshore into the central ECS. The offshore SPM flux reaches ~0.3–0.4 g m−2 s−1. Even though the current velocity in the southeast ECS is significant as shown in Figure 1a, the SPM flux in the southeast ECS is insignificant since the SPM concentration in that region is negligible.
A notable feature of the freshwater flux (Figure 1e) in the YS and ECS is that the freshwater flux follows the circulation of the SCC and YSCC in the ECS and eventually moves into the central ECS. On the other hand, the southwestward alongshore freshwater flux in the coastal region of the YS is attributed to the strong YSCC and the relatively positive freshwater mass Rfw(x, y). The freshwater flux in the southeastern ECS is the strongest in the study region, and it is in the opposite direction of the current as shown in Figure 1a due to the relatively negative freshwater mass Rfw(x, y) in the region.
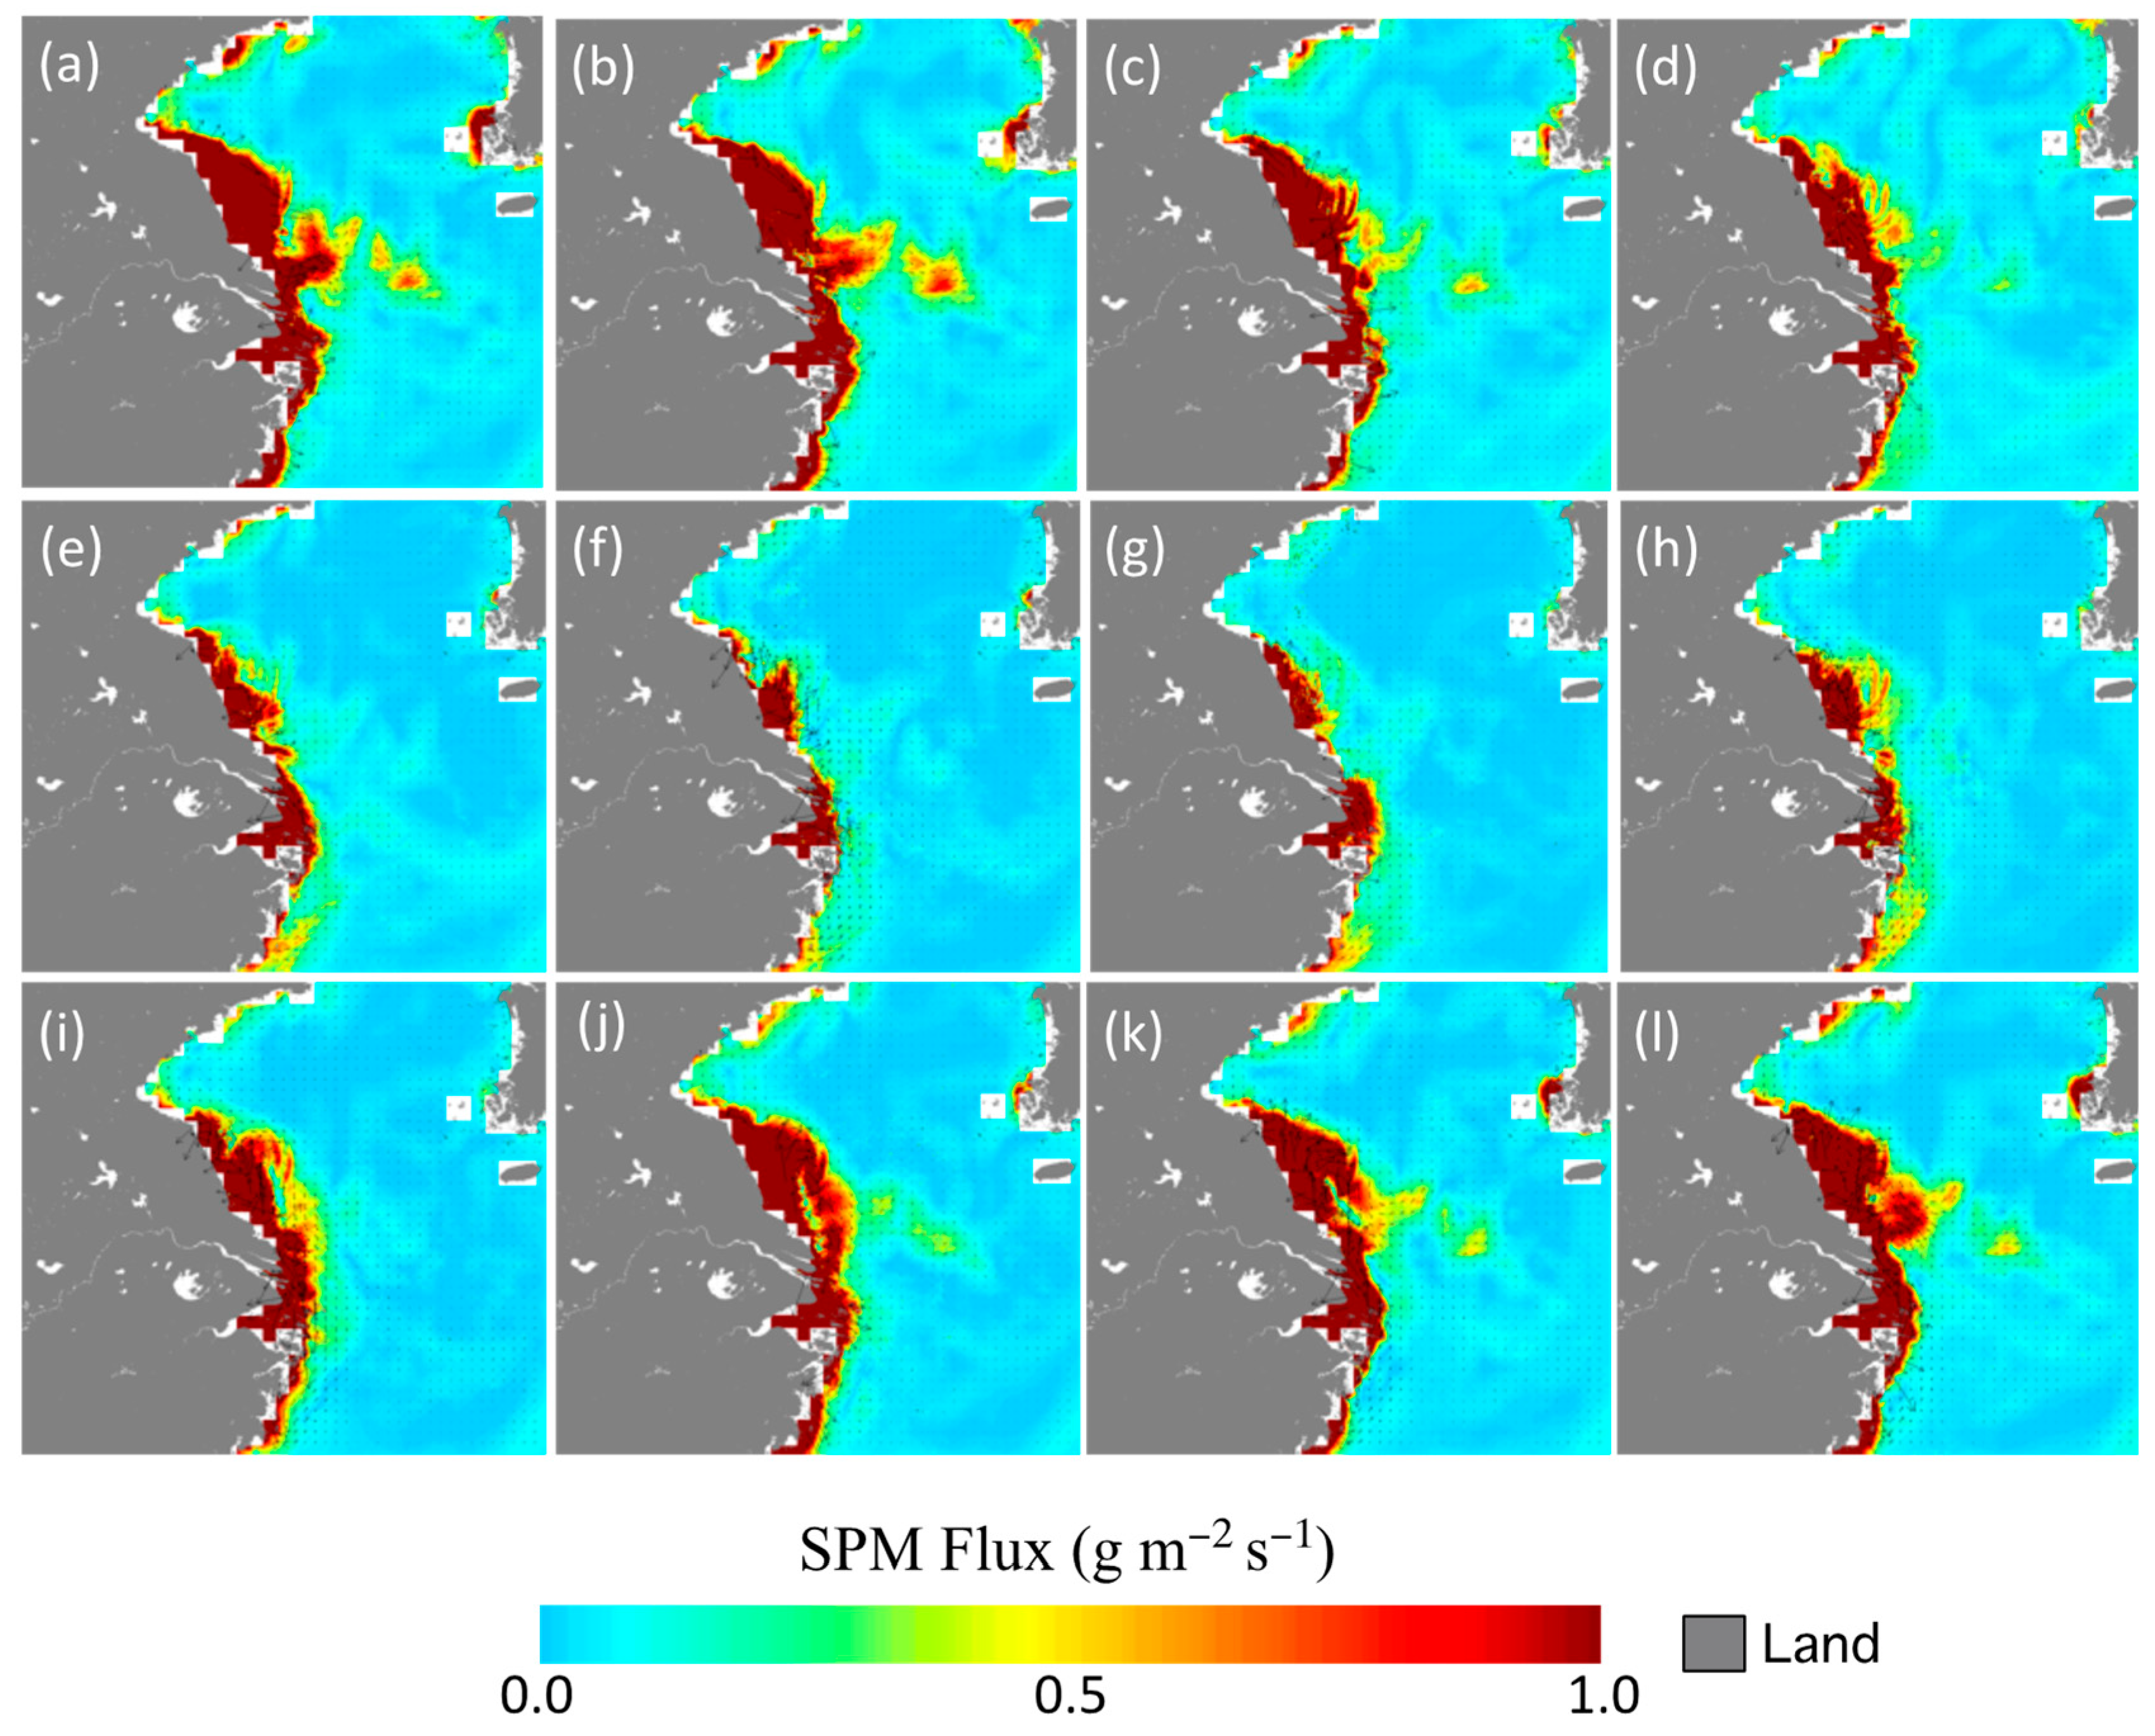
Figure 2 shows the climatology (mean) monthly surface SPM flux in the YS and ECS in the period between 2018 and 2023. Significant seasonal variability of SPM flux can be found in the region. In the period between January and April (Figure 2a–d), the highest SPM flux is found along the coastal region of the ECS, e.g., the Subei Shoal and Hangzhou Bay. This is consistent with the high SPM concentration in these regions in winter and early spring [1]. This suggests that the surface SPM flux in the coastal region is dominated by the SPM concentration.
In the late spring and summer (Figure 2f–h), the coverage of the enhanced SPM flux shrinks in the SE of ECS significantly, and high SPM flux is found to be confined in the nearshore region. Examination of the corresponding current velocity and SPM in each month shows that the low SPM flux is primarily caused by the low SPM concentration during this period [1]. In autumn, the offshore SPM flux increases from its summer low, in terms of both the strength and coverage (Figure 2i–k).
Even though the highest offshore SPM flux is located in the Subei Shoal region, especially in winter and early spring (Figure 2a–d), a sharp decrease in the SPM flux can be found in the offshore region of Subei Shoal. This implies a large amount of SPM deposited in the outskirts of the enhanced SPM flux region. Comparison of the SPM flux maps in this study and the monthly SPM map in the YS and ECS shows that they are generally co-located. This is consistent with the report in the field investigation [10]. The seasonal SPM flux in the region also shows that the SPM flux into the interior YS and ECS during the winter season (Figure 2a,b) is much stronger than that in the summer season (Figure 2f–h). At station C [122.39°E, 32.10°N] marked in Figure 1a, which is close to the Yangtze River Estuary, the offshore SPM flux reaches ~1.84 g m−2 s−1 in January, while it is only ~0.20 g m−2 s−1 in July.
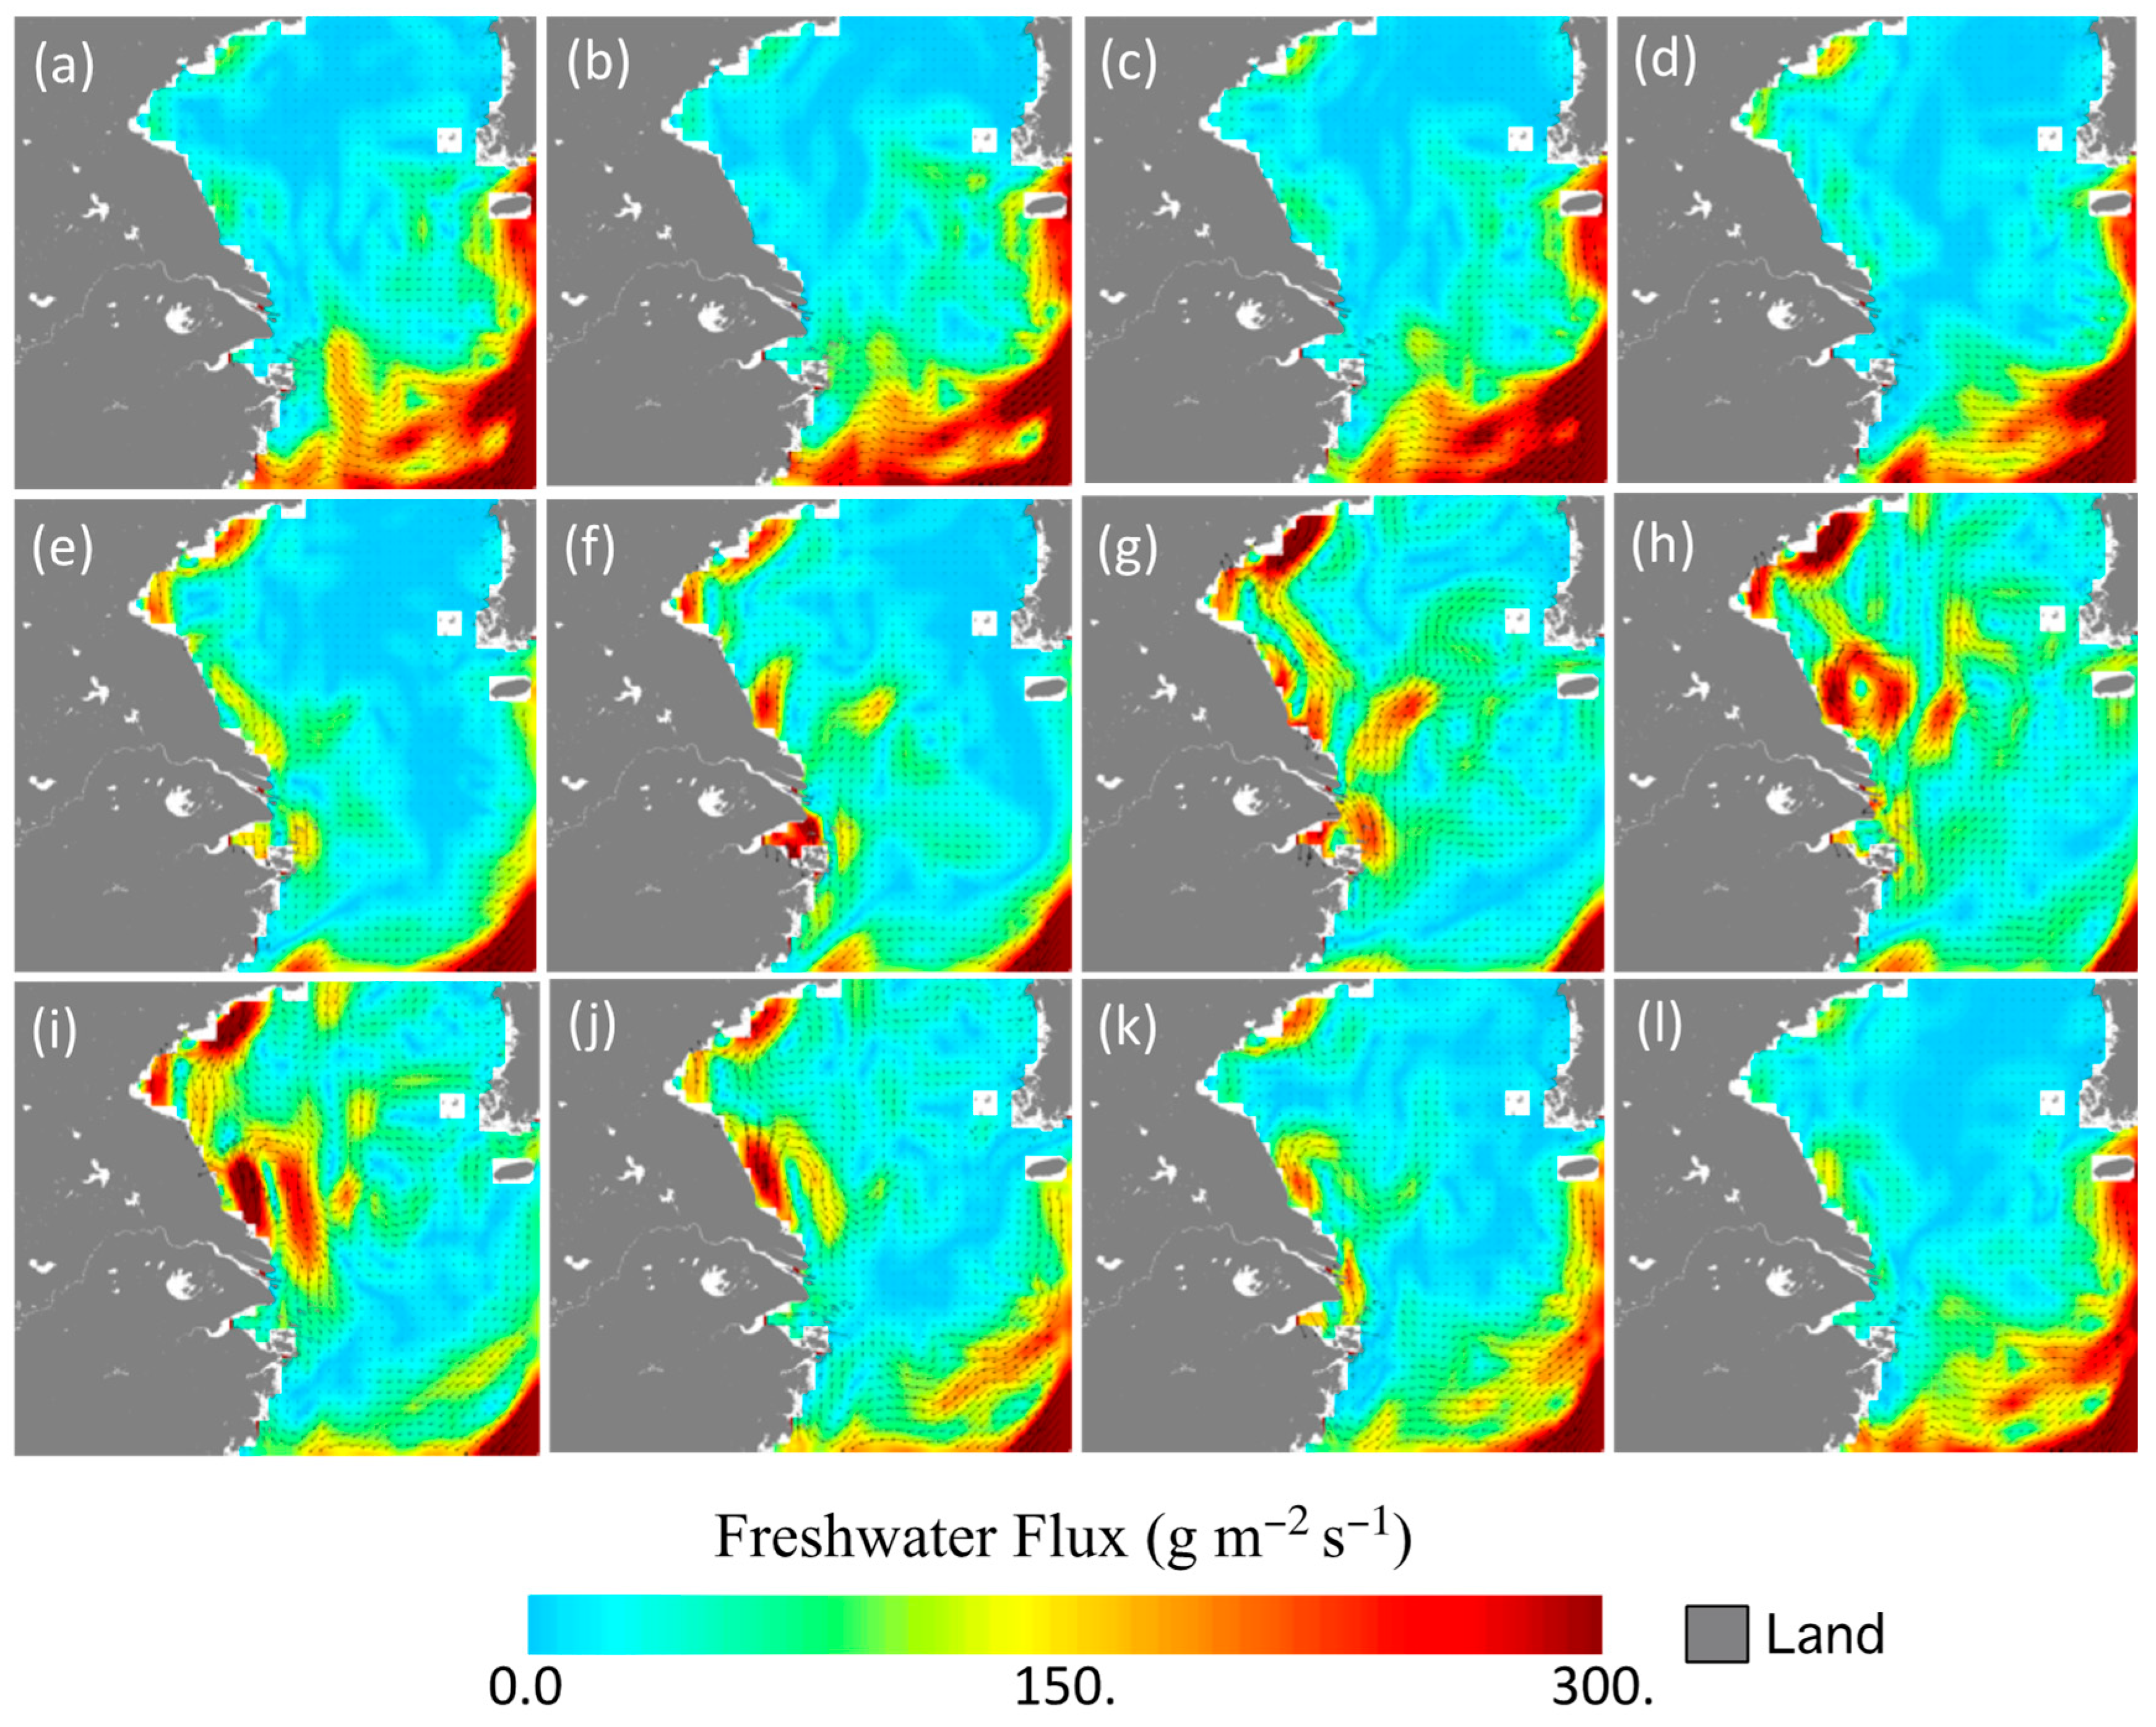
The imagery of the monthly freshwater flux (Figure 3) shows an entirely different spatial pattern from the imagery of the monthly SPM flux (Figure 2). In the southeastern ECS, the freshwater flux into the ECS in winter and early spring (Figure 3a–d) is attributed to the incursion and northeastward flow of higher SSS TWC and Kuroshio. In the northern ECS and YS, the freshwater flux generally shows less variability in this period.
The freshwater flux in the ECS becomes strengthened in the summer season, especially in the Subei Shore and the offshore region near the Yangtze River Estuary. The freshwater flux becomes very dynamic and complex in this period (Figure 3f–h). Specifically, northeastward freshwater flux transports the freshwater to the interior ECS off the Yangtze River Estuary. In September, October, and November, the freshwater flux follows the coastal circulation pattern of the SCC and YSCC to flow alongshore northwestward initially from north of the Yangtze River Estuary, take an offshore right turn in the Subei Shoal region, and then move southeastward (Figure 3i–k).

3.2. Interannual Variability of the SPM and Freshwater Fluxes

To address the complexity of the SPM and freshwater fluxes in the YS and ECS, especially in the region impacted by the Yangtze River and highly dynamic Subei Shoal area, a meridional transect line A, a zonal transect line B, and a station C near the Yangtze River Estuary as noted in Figure 1a are chosen to further quantify the variability of SPM and freshwater fluxes, and to understand the impact of the SPM and freshwater fluxes on the variability of the SPM and SSS in the region.
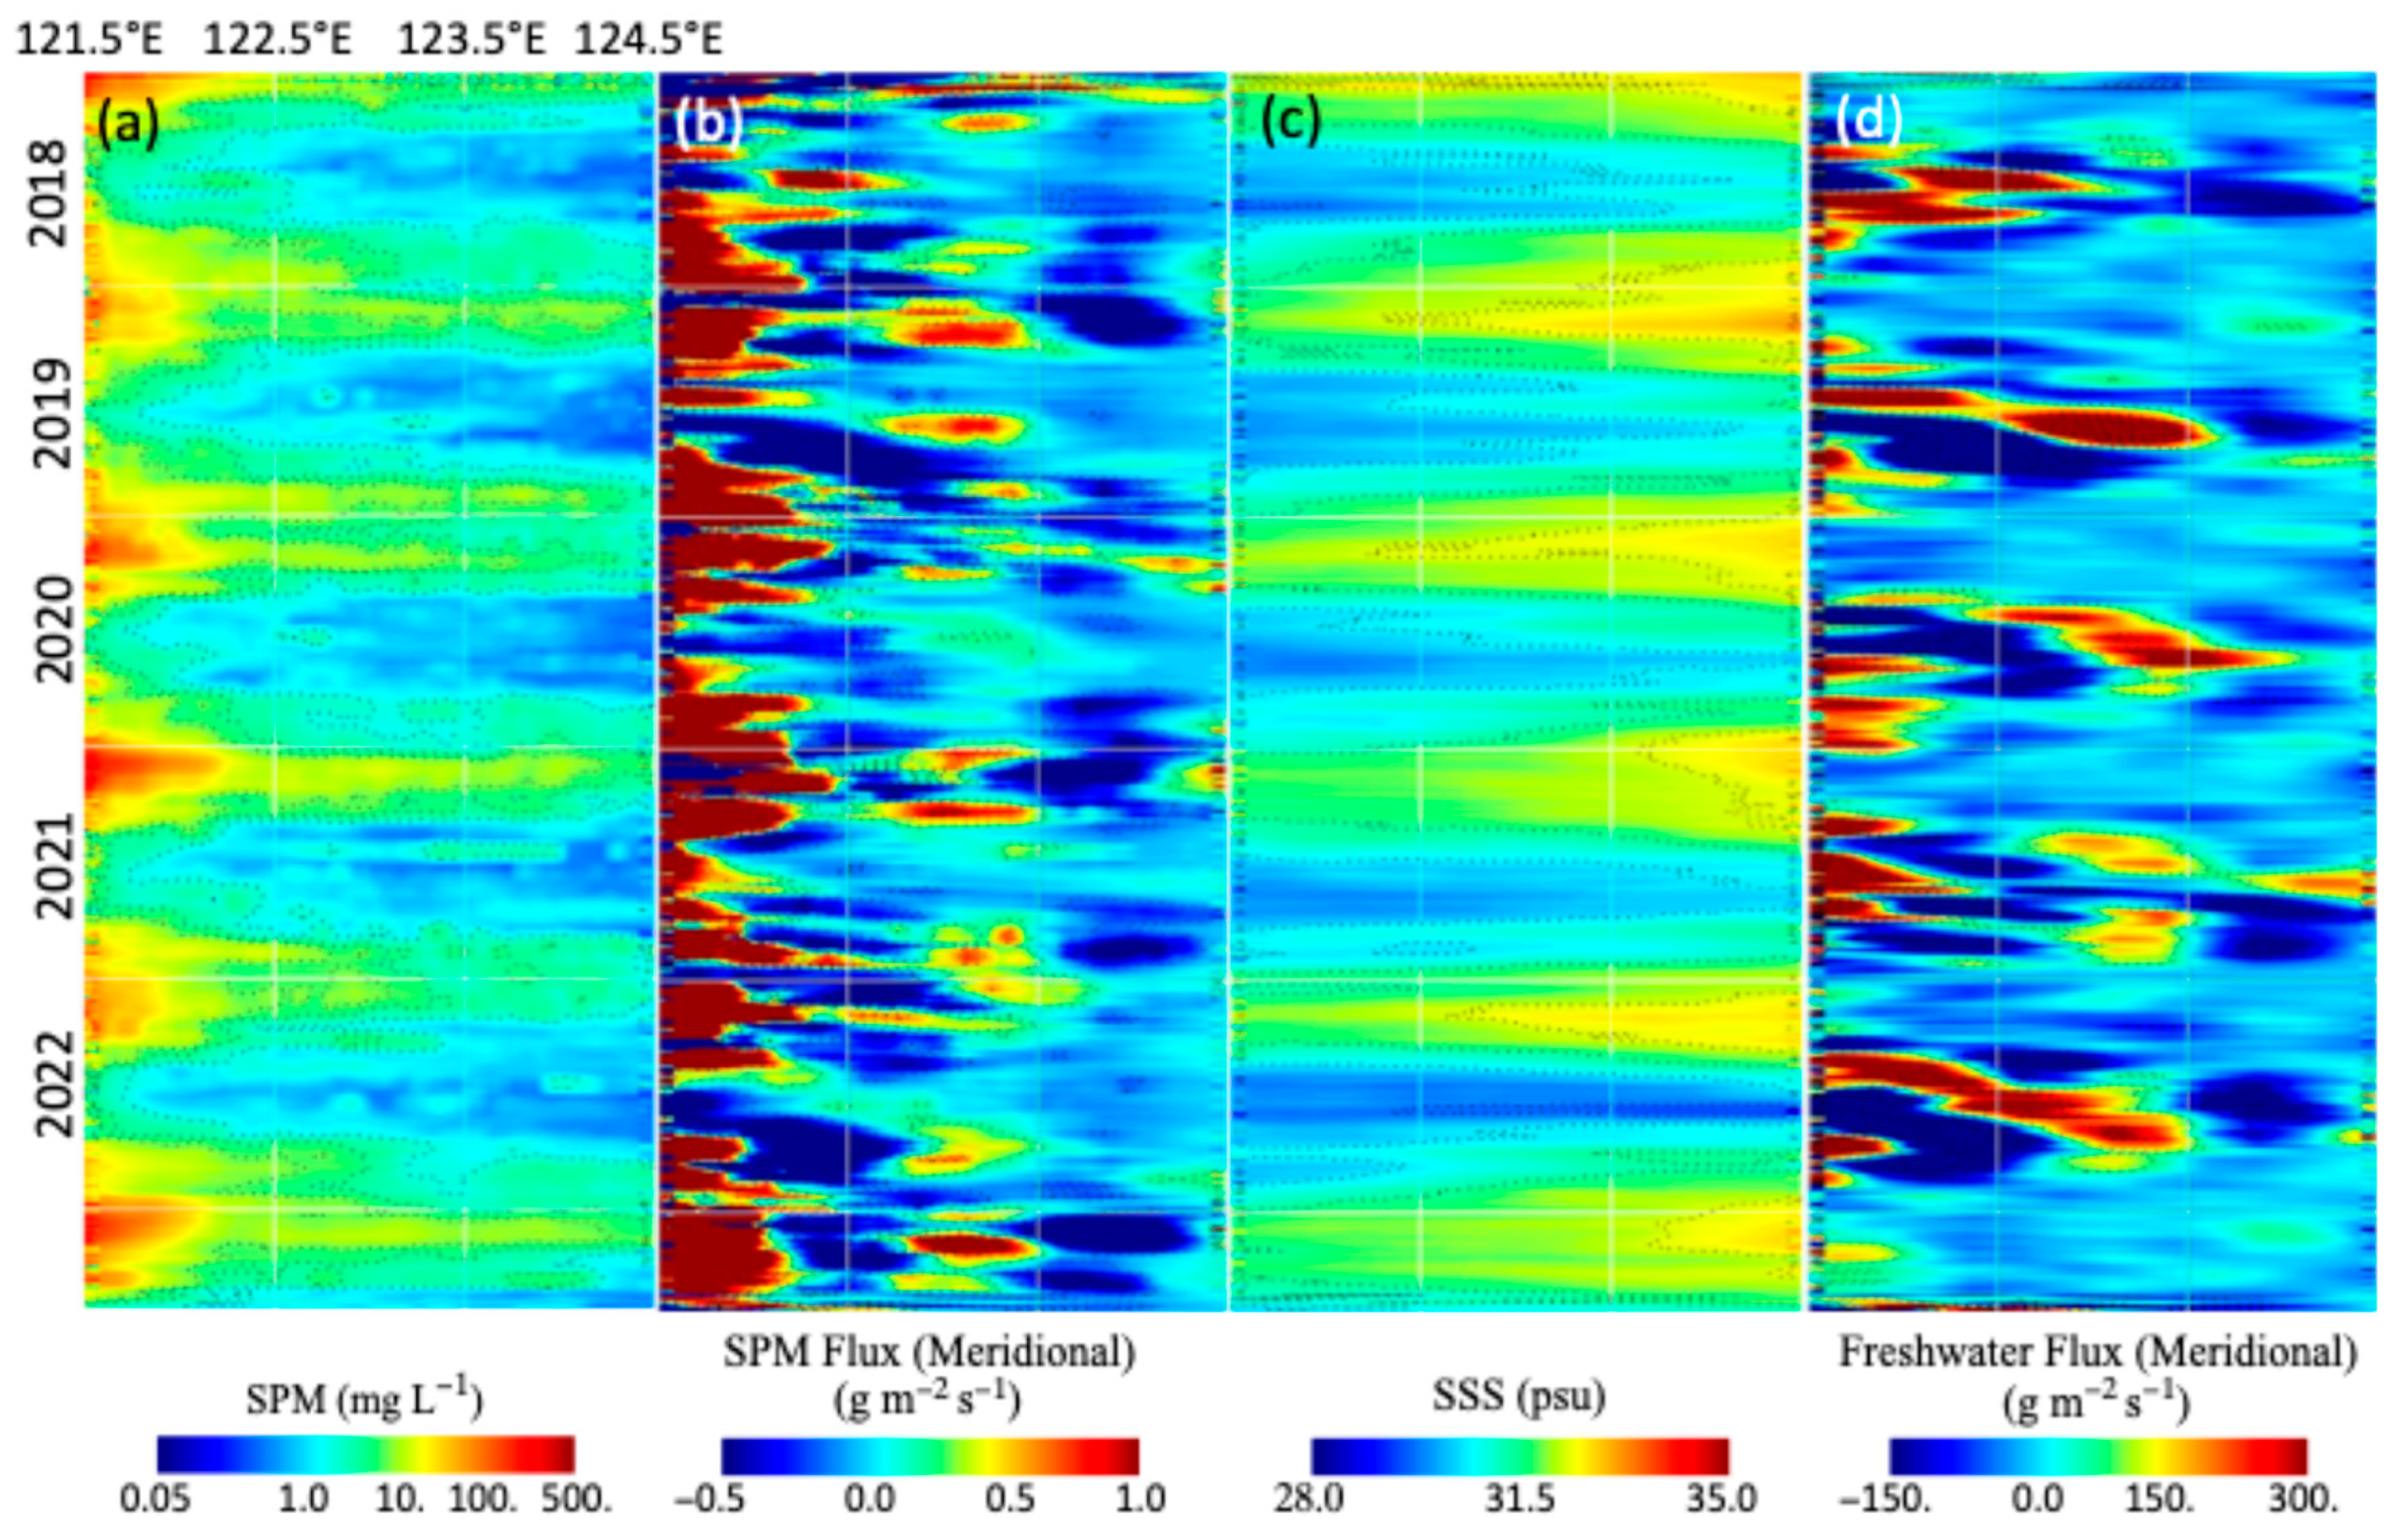
Figure 4 shows SPM (Figure 4a), SPM flux (Figure 4b), SSS (Figure 4c), and freshwater flux (Figure 4d) across the transect line A from 2018 to mid-2023. Both the seasonal and interannual variability for all these four properties are remarkable. SPM (Figure 4a) and SSS (Figure 4c) were enhanced in the winter season and weakened in the summer season at the transect line A. The much more enhanced SPM were located between 32°N and 33°N (Figure 4a), while the strengthened SSS were located in the southern part (31°N–32°N) of transect line A (Figure 4c).
The SPM flux (Figure 4b) also shows strong seasonal and interannual variability across transect line A. Similar to the SPM at transect line A, the maximal SPM fluxes occurred in the winter season and were situated between 32°N and 33°N. The zonal SPM fluxes were observed to reach over ~3 g m−2 s−1 in January and February. The coincidence and collocation of SPM in Figure 4a and SPM flux in Figure 4b suggest that the SPM flux plays a critical role in transporting SPM from the coast area to offshore region in the ECS region. In fact, the strong offshore eastward SPM flux across transect line A agrees with the 6-year mean monthly SPM flux maps in January–March (Figure 2a–c).
The freshwater flux (Figure 4d) shows that most of the eastward freshwater fluxes occurred in summer and early autumn. This provides a clear contrast of the seasonal SPM flux in the winter season and reflects the impact of the seasonal Yangtze River discharge on the offshore freshwater flux in the ECS. Most of the eastward freshwater flux were observed between 32°N and 33°N. The enhanced offshore eastward freshwater flux across transect line A is consistent with the monthly freshwater flux as shown in Figure 3f–i. The difference of SPM flux (Figure 4b) and freshwater flux (Figure 4d) reflects the different temporal variations in SPM (Figure 4a) and SSS (Figure 4c) along transect line A.
The SPM at transect line B also shows notable seasonal variability (Figure 5a) with high SPM in winter and low SPM in summer. SPM in the western section of the transect line B was >100 mg L−1 in the winter season and it dropped to <10 mg L−1 in the summer season. SPM decreased from coast to the offshore region at transect line B. On the other hand, the seasonality of SSS at transect line B was also significant with SSS increasing from coast to the offshore region (Figure 5c). SSS in the western part of the transect line B was ~32.0 psu in the winter season and it dropped to <30.0 psu in the summer season.
The variability of the meridional SPM flux across transect line B (Figure 5b) was significantly higher than that of the zonal SPM flux across transect line A (Figure 4b). In coastal region to the western part of transect line B, the SPM flux was strong and primarily featured in the northward direction. This can be attributed to the northward SCC as shown in Figure 1a. In the offshore region at ~122.5°N, frequently southward (negative) SPM fluxes, e.g., in 2019, 2020, and 2021, were observed due to the extension of the southward flowing YSCC in the ECS. The surface freshwater flux across transect line B (Figure 5d) shows that it was low in the winter season and significantly higher in the summer season. Both strong northward and southward freshwater fluxes were observed for the entire transect line B.
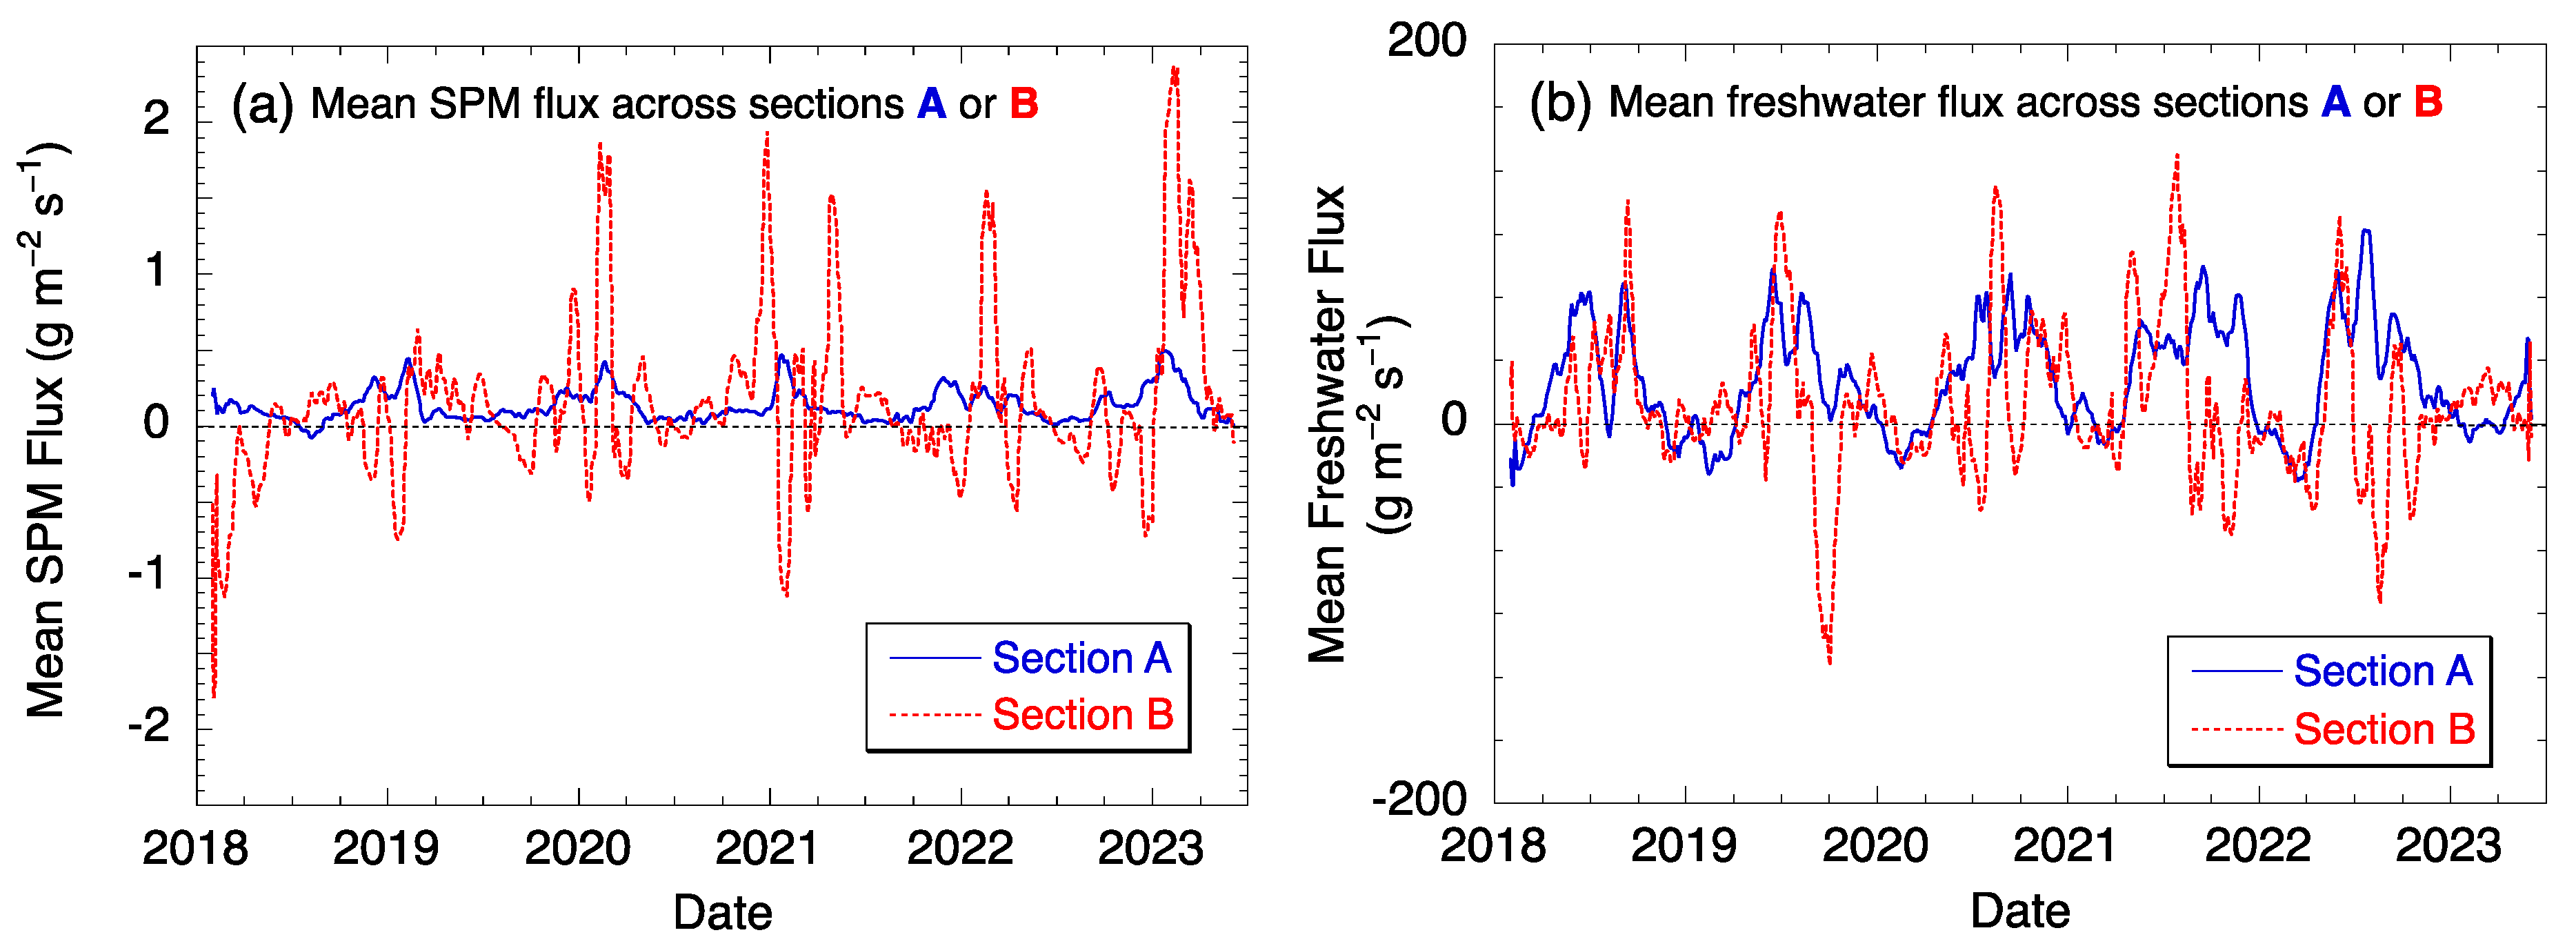
The averaged zonal and meridional SPM fluxes across transect line A (Figure 6a) further show that SPM was constantly transported eastward from the coast to the open ocean. In consistence with Figure 3b, the seasonal variability of the SPM flux is significant. The eastward SPM was low and generally < 0.05 g m−2 s−1 in summer, while it reached ~0.5 g m−2 s−1 in winter. On the other hand, the outbursts of the meridional SPM flux, e.g., in late 2020 and early 2021, were also observed in winter with the mean meridional SPM flux reaching to ~2 g m−2 s−1. The SPM flux across transect line B (Figure 5a) shows most of the outbursts of the northward (positive) meridional SPM flux occurred in the coastal region, while the outbursts of the southward (negative) meridional SPM flux were located in the offshore region at this transect.
In contrast to the seasonal variability of the zonal SPM flux across transect line B, the mean eastward freshwater flux reached the maximum of ~80 g m−2 s−1 in summer, while it was much weaker and even became westward (negative) in winter and spring (Figure 6b). As shown in Figure 4d, most of the eastward freshwater fluxes across transect line A were located between 32°N and 33°N. In the summer of 2022, the freshwater flux was over 300 g m−2 s−1. Frequent outbursts of the meridional freshwater flux were often observed in the summer season. This reflects that the large variability of the meridional freshwater flux indeed occurred from the coast to the open ocean as shown in Figure 5.
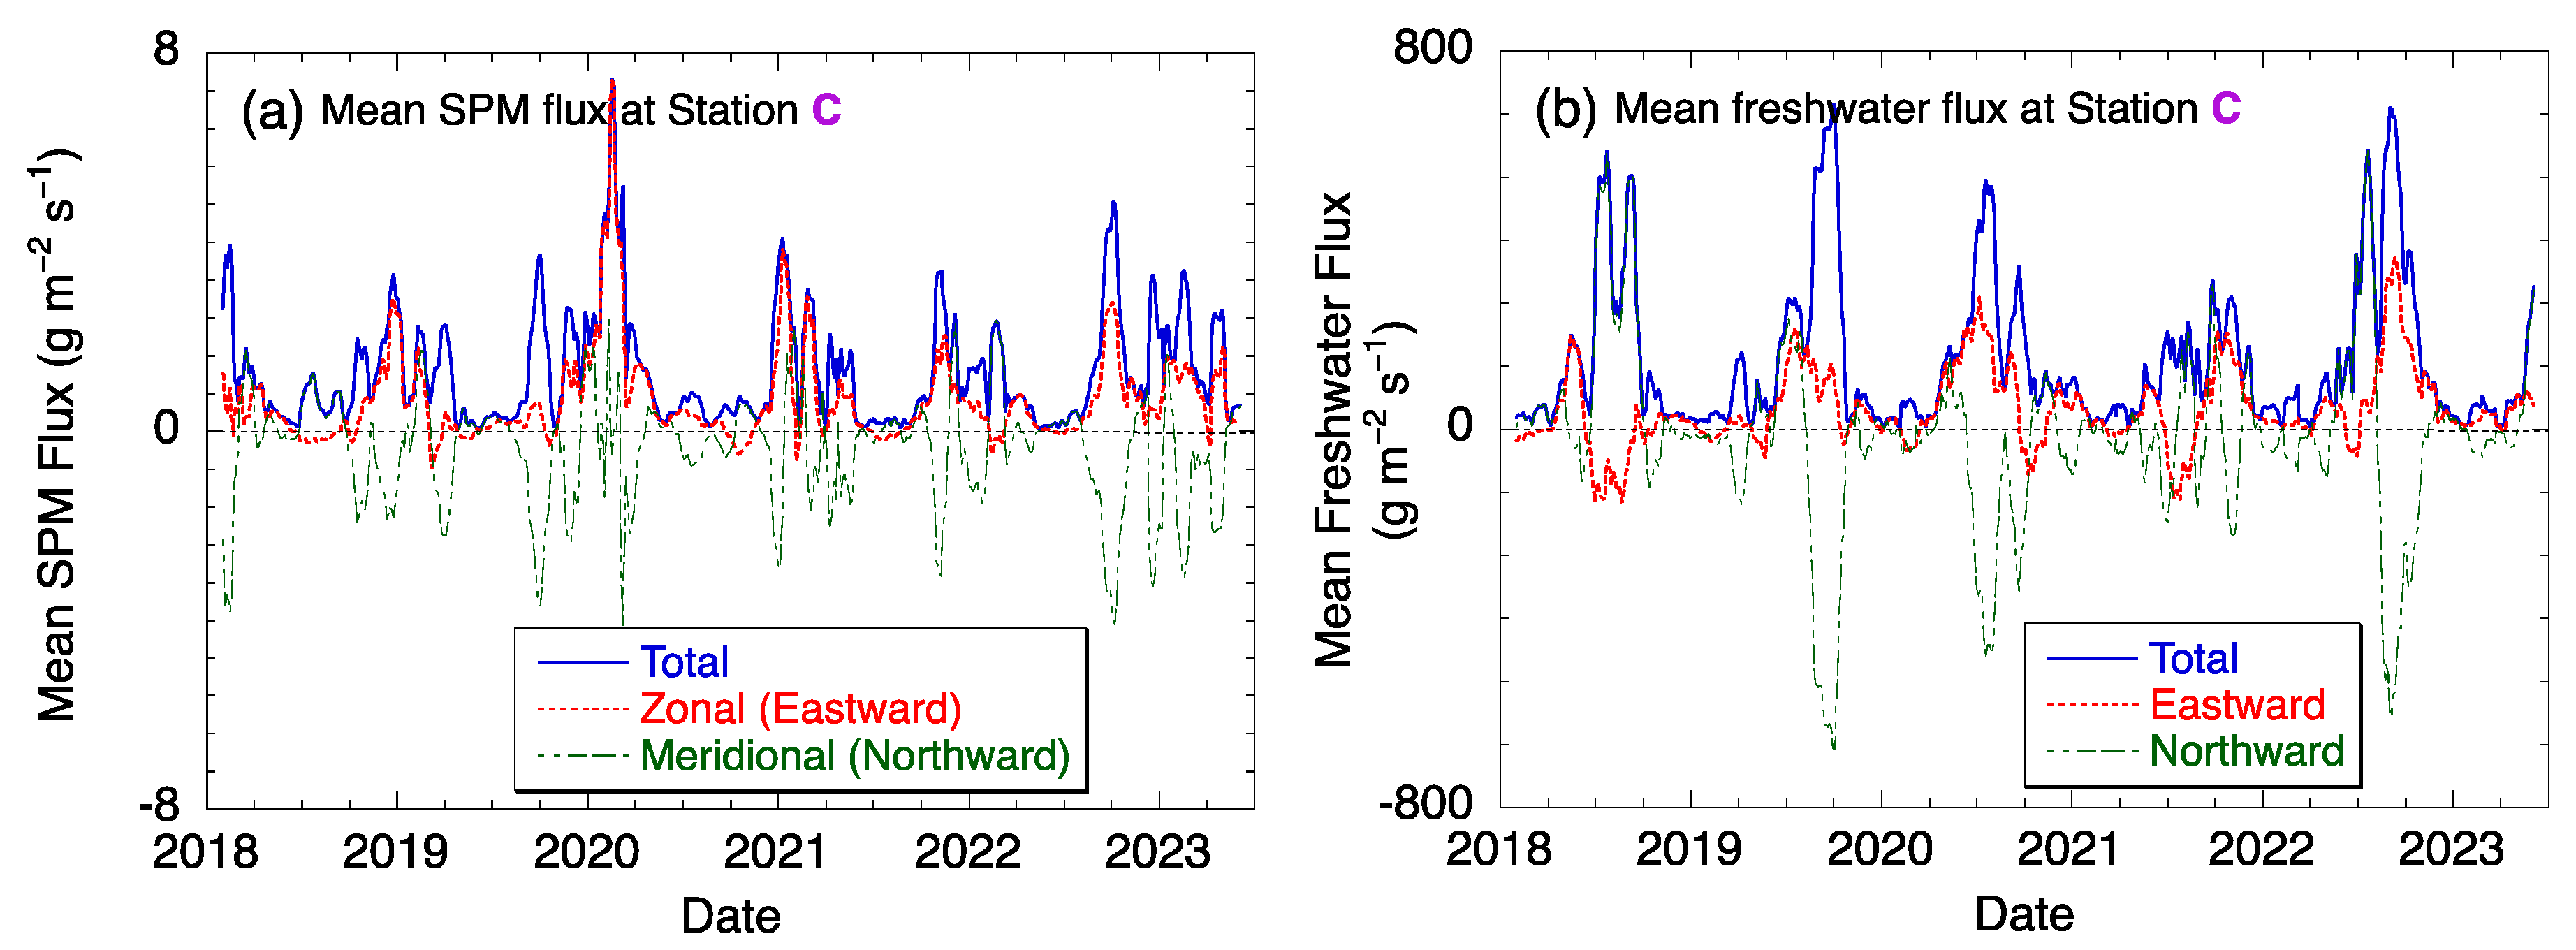
Since the SPM and freshwater fluxes in the YS and ECS, especially in the ECS, can be impacted by the discharge of the Yangtze River, the zonal and meridional SPM and freshwater fluxes at station C near the Yangtze River are evaluated (Figure 7). In general, similar seasonal variability of the zonal SPM flux can be found at this station. The SPM flux could reach ~2–3 g m−2 s−1 in winter, while it dropped to <0.3 g m−2 s−1 in summer (Figure 7a). At station C, the outbursts of the meridional SPM flux also frequently occurred in winter. Most of the strengthened meridional SPM flux were southward (negative).
The zonal freshwater flux at station C (Figure 7b) shows the offshore (eastward) SPM flux. The eastward freshwater flux normally reached its peak ~200–300 g m−2 s−1 in summer and became insignificant in the winter season. In the summer of 2020, the eastward freshwater flux kept elevated for the entire summer, while the elevated eastward freshwater flux only lasted one or two months in the other summers. It is also noted that the peak eastward freshwater flux actually occurred in autumn instead of summer in 2022. On the other hand, three significant outbursts of the freshwater flux occurred in the summer of 2020, autumns of 2019 and 2022 even though the meridional freshwater fluxes were generally weak in the other periods. In the summer of 2020, the southward freshwater flux was >400 g m−2 s−1, and the eastward freshwater flux was ~250–300 g m−2 s−1. Thus, the total freshwater flux reached >500 g m−2 s−1 and flowed southeastward from the Yangtze River Estuary into the interior ECS.

3.3. Impact of the 2020 Yangtze River Floods in the YS and ECS

In the summer of 2020, the Yangtze River experienced the worst floods in the last two decades due to heavy rainfall in the Yangtze River basin and its tributaries. The 2020 Yangtze River flooding was tied to the extreme Indian Ocean conditions [64]. In the period between July and August, there were five severe floods [65]. The maximum discharge at the Datong Station reached over ~80,000 m3/s in 2020, while the long-term average is ~50,000 m3/s [66].
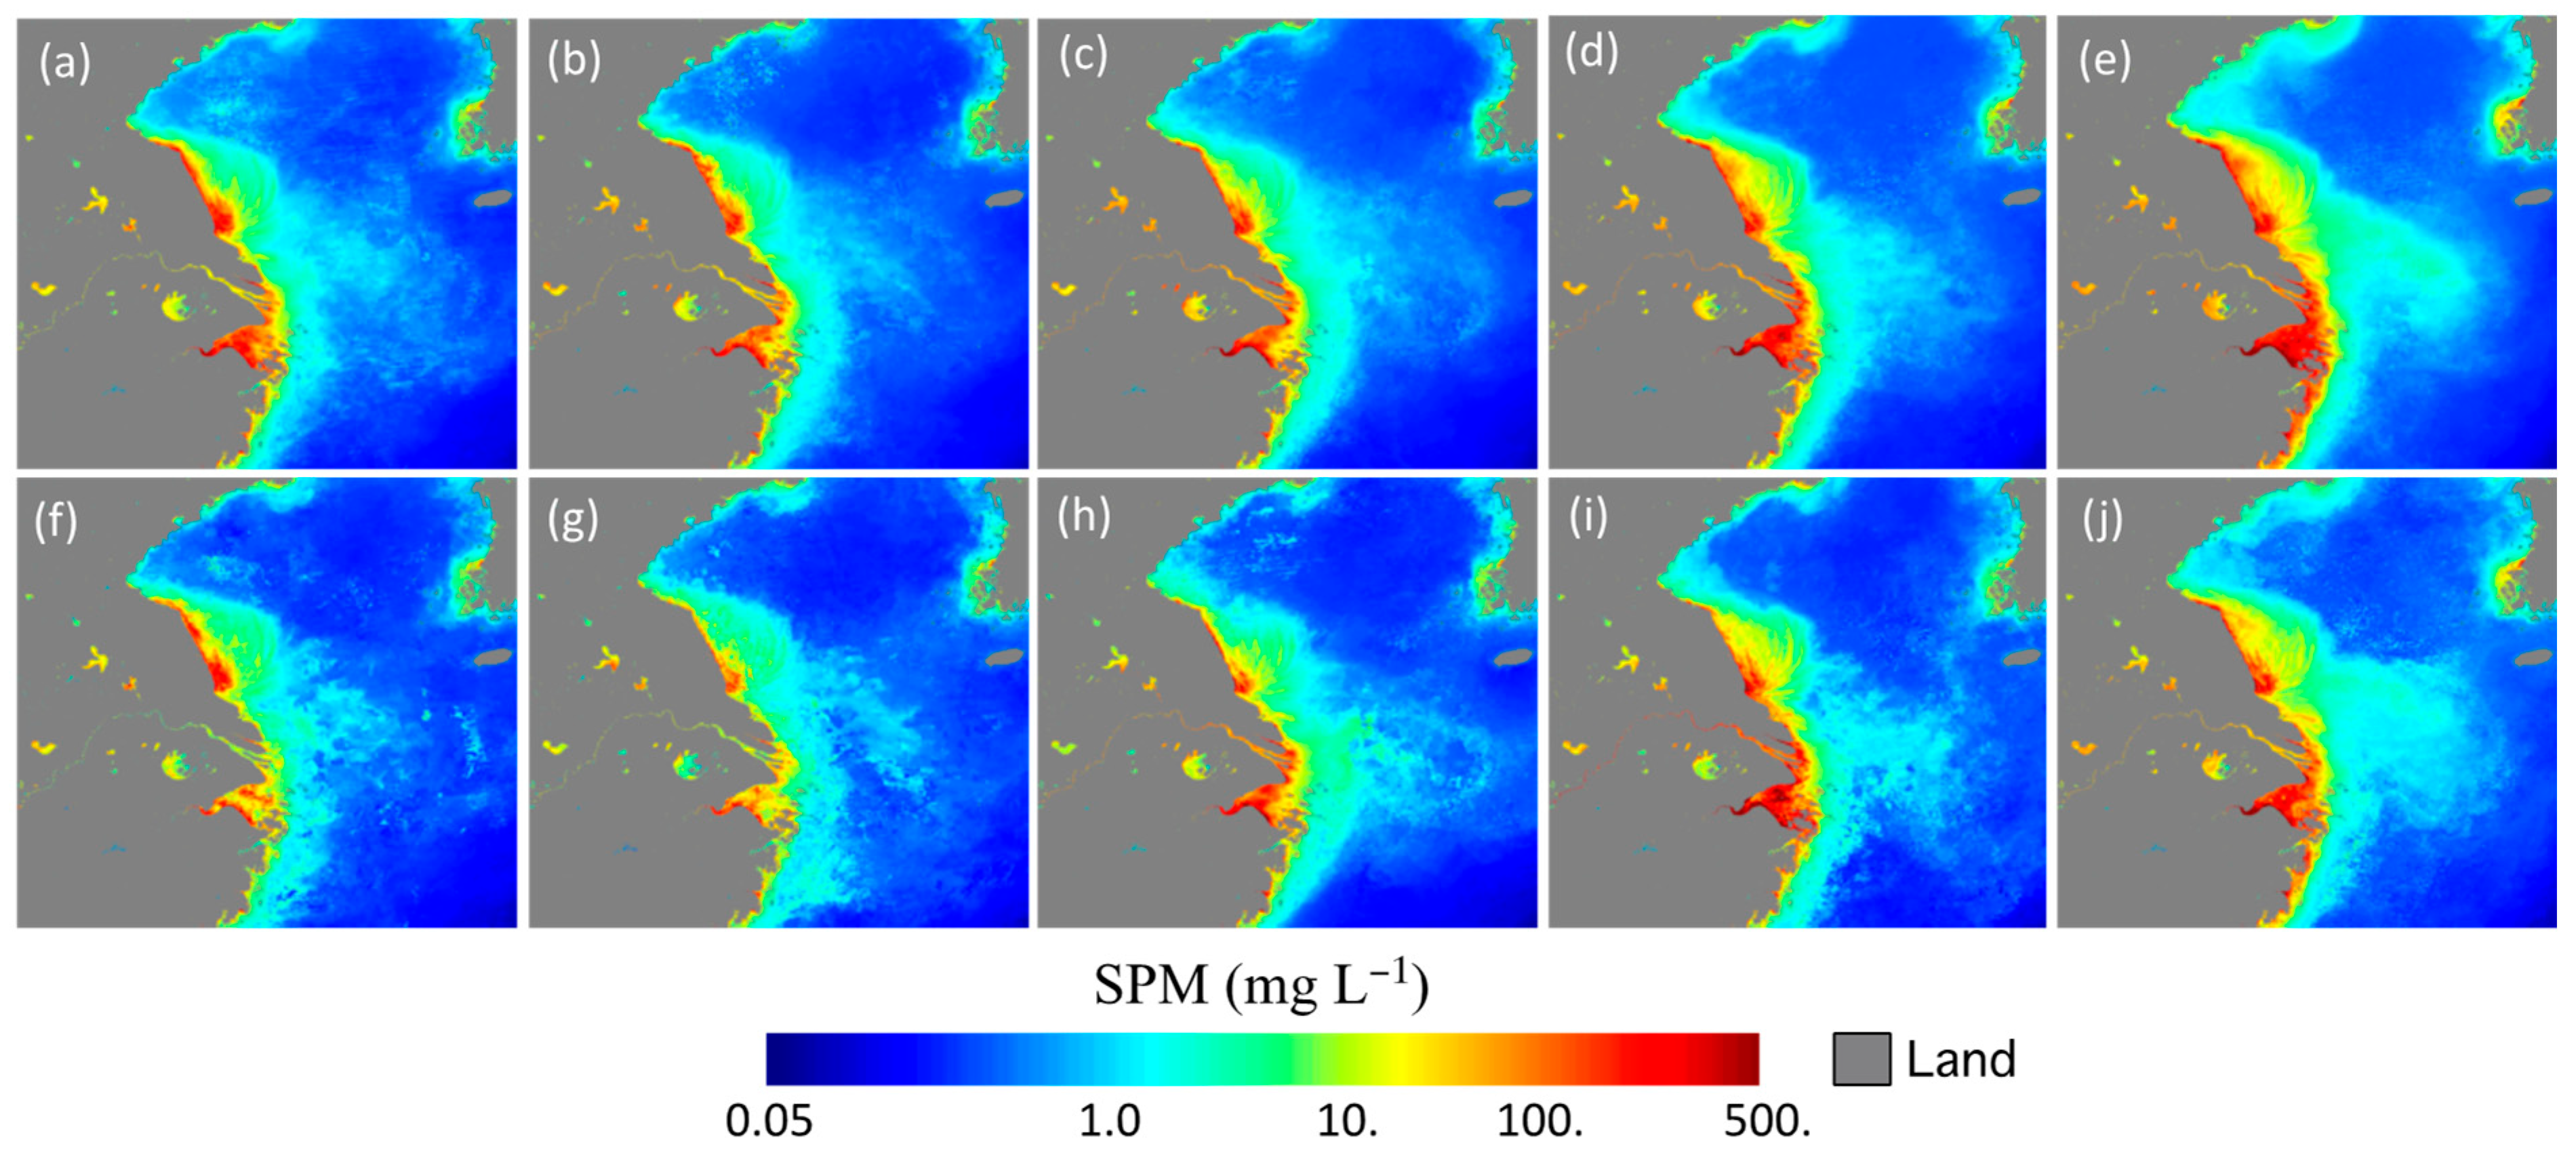
Figure 8 shows the comparison of the SPM maps in June (Figure 8f), July (Figure 8g), August (Figure 8h), September (Figure 8i), and October (Figure 8j) in 2020 and the corresponding monthly climatology SPM maps derived from the measurements from 2018 to 2023 (Figure 8a–e). In June and July 2020, SPM were similar to the corresponding monthly climatology SPM in the same months in terms of both the spatial pattern and magnitude (Figure 2a,b,f,g). SPM in the Hangzhou Bay and near the Subei Shoal were actually a little bit less enhanced in June and July 2020. Starting from August 2020, SPM showed notable increase in the offshore region east of the Yangtze River Estuary, especially in the region near the Yangtze River Estuary, while SPM in the Hangzhou Bay and Subei Shoal were less impacted by the increase in the Yangtze River discharge. At station C, SPM concentration was 7.1 mg L−1, while the climatology SPM is 4.6 mg L−1 at this location. On the other hand, SPM in the other part of the YS and ECS were similar to the climatology SPM in the same months. In September (Figure 8i) and October (Figure 8j), the enhanced SPM to the east of the Yangtze River Estuary further expanded into the central ECS in comparison with the climatology SPM maps in the same months (Figure 8d,e).
With the anomalous Yangtze River runoff in July and August of 2020, the large freshwater discharge into the ECS is expected to influence the SSS field in the ECS region significantly. Before the start of the 2020 summer flooding in June, SSS in the coastal region of the ECS was actually slightly higher than that in a normal year (Figure 9a,f). In July 2020, a large area of SSS drop to the east and southeast of the Yangtze River Estuary was observed (Figure 9g). In comparison, the climatology SSS in the same month (Figure 9c) was ~0.2 psu higher than SSS in August 2020 in this region. It is also noted that no impact of the 2020 flooding was shown in the northern YS and ECS. Actually, SSS in July 2020 was higher than the SSS climatology in the northern YS and ECS.
Figure 9h,i shows that the low SSS further spread into the central and eastern ECS in August and September 2020. In comparison with the climatology SSS map in the same month (Figure 9c), a broad SSS drop covered the central, eastern, and southeastern ECS region. SSS in the region near the Jeju Island of South Korea in the eastern ECS were 31.01 and 31.20 psu in August and September 2020, respectively, while the climatology SSS are 31.18 and 31.48 psu in these two months, respectively. Due to the advection of the anomalous freshwater, the SSS front in August and September 2020 was pushed southeastward off the ECS (Figure 9h,i) in comparison to its normal location (Figure 9c,d). In October 2020, SSS in the ECS showed a broad increase in September, and the low SSS at the coastal region of the ECS disappeared (Figure 9j). In the central and eastern ECS, SSS were still notably lower in October 2020 than the climatology SSS in the same month (Figure 9e). This suggests that the effect of the high Yangtze River discharge in the summer of 2020 on SSS in the ECS still existed two months later.
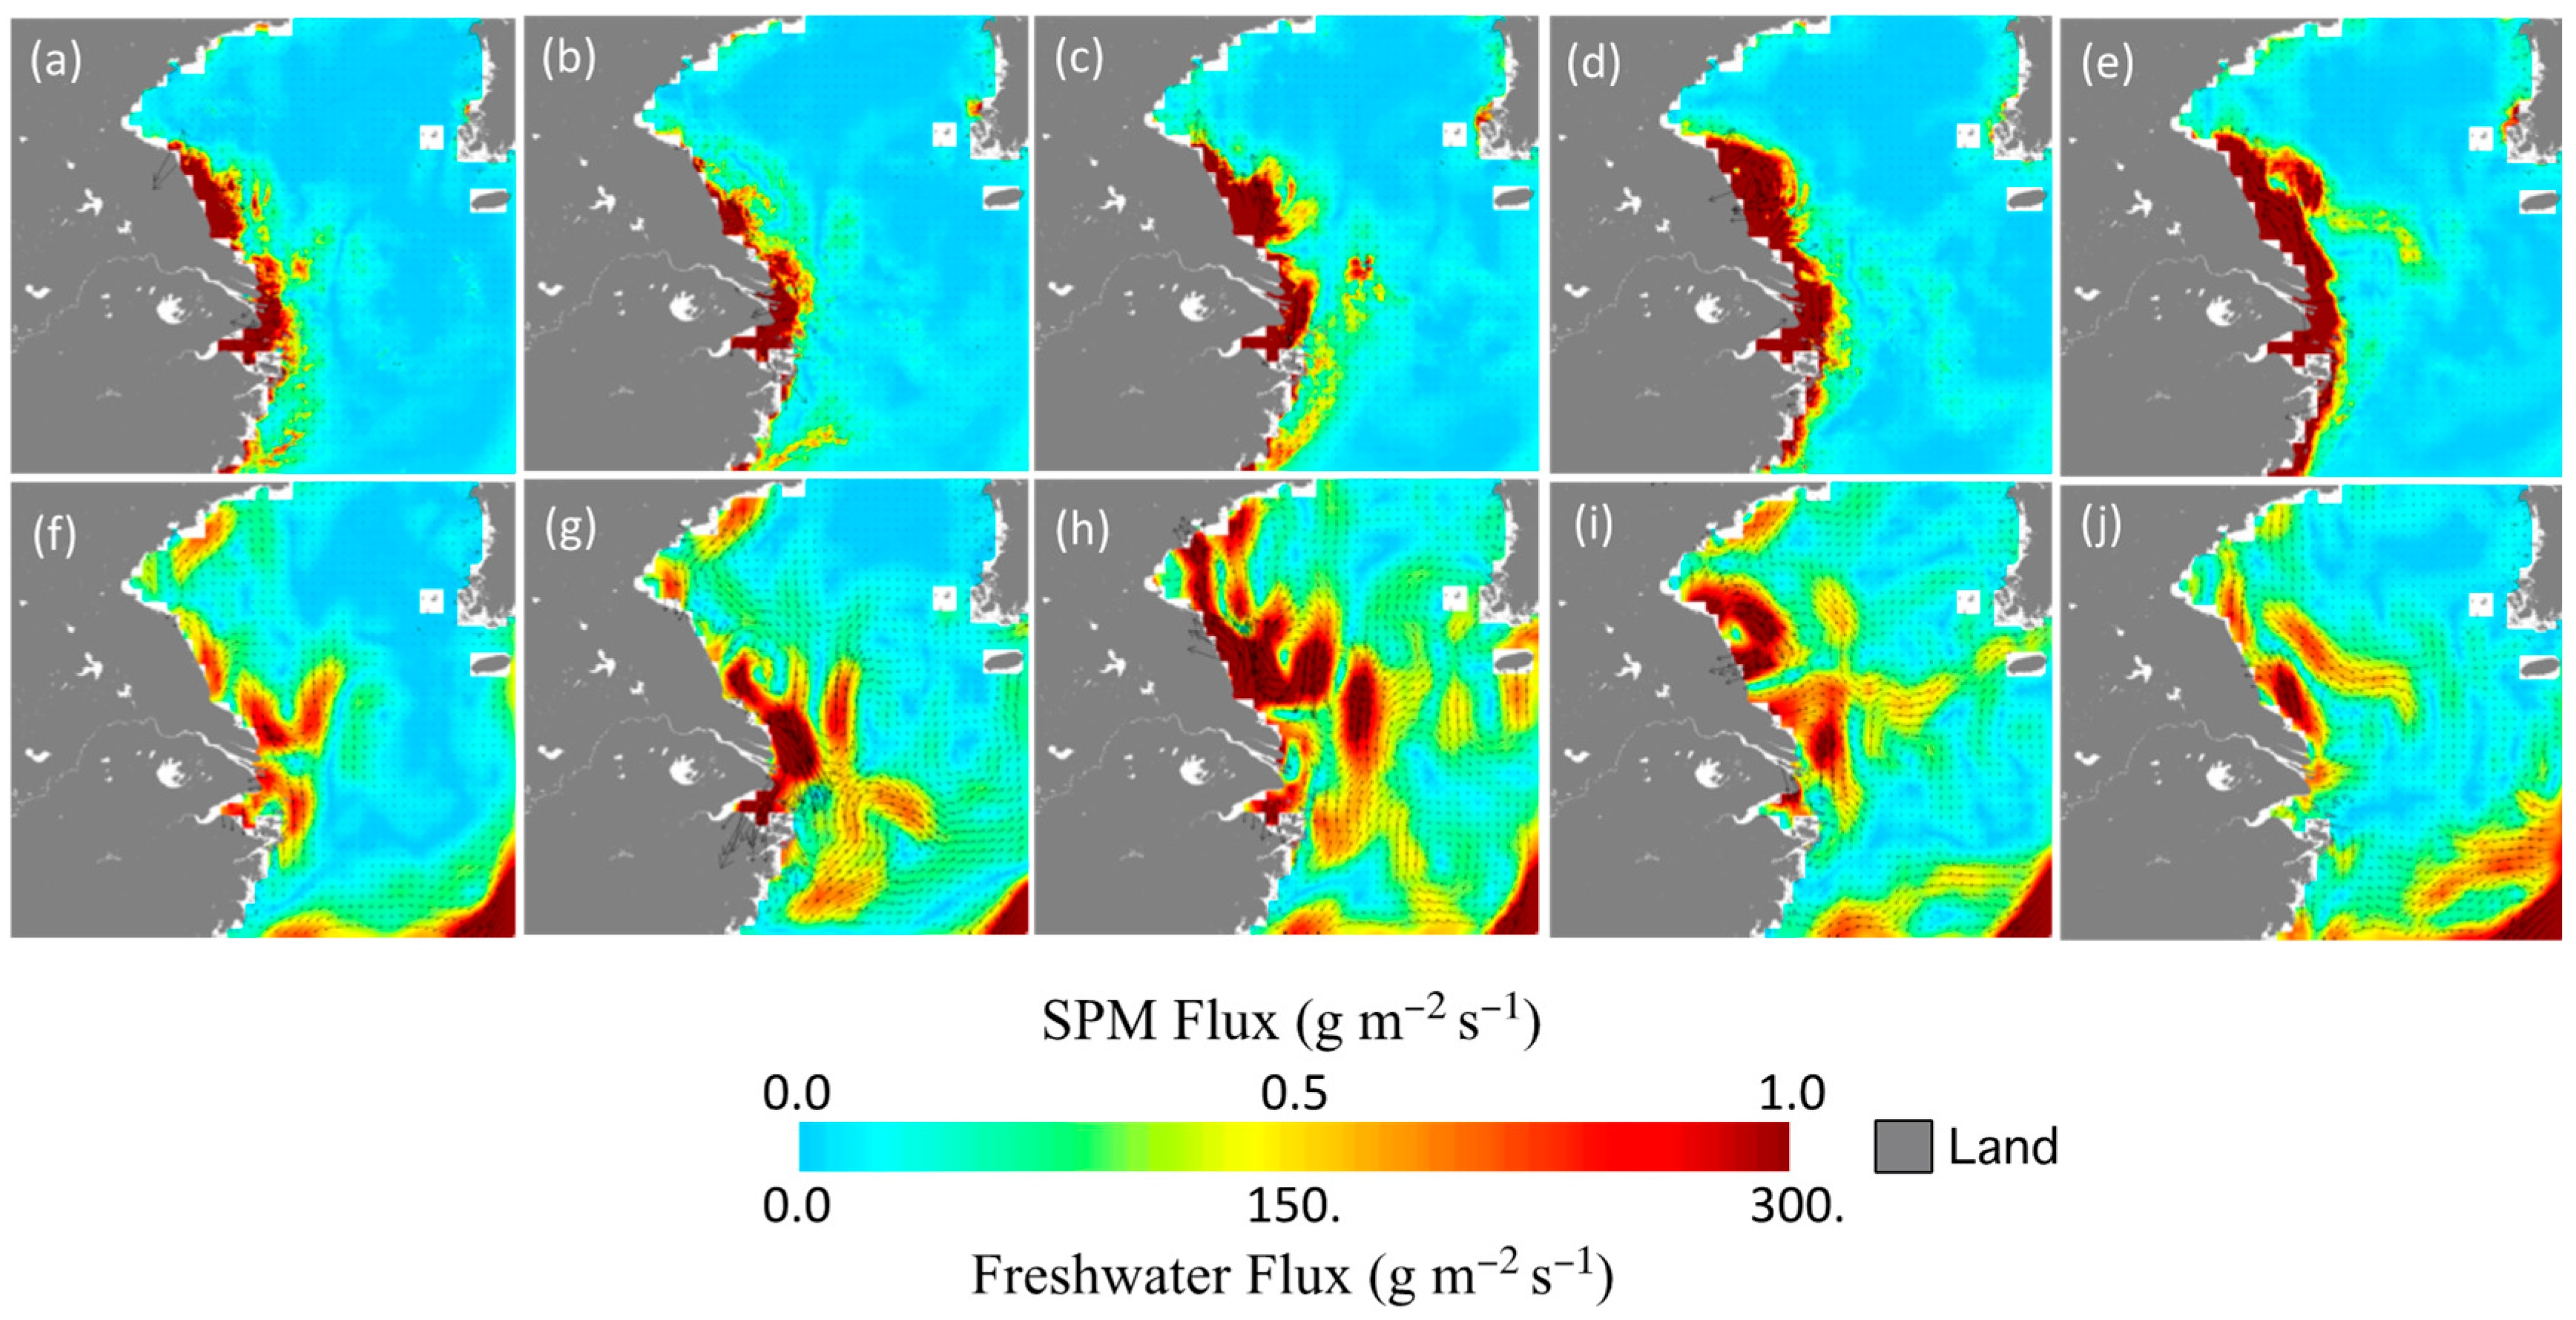
The SPM and freshwater fluxes are the major drivers for the SPM and SSS changes in the YS and ECS. Magnitudes of the SPM and freshwater fluxes are dominated by SPM and SSS values, while directions of the SPM and freshwater fluxes are determined by the surface current velocity. Figure 10 shows the monthly SPM flux maps (Figure 10a–e) and surface freshwater flux maps (Figure 10f–j) from June to October 2020. In June 2020, the SPM flux near the Yangtze River Estuary flowed southeastward (Figure 10a). The SPM flux further enhanced in July (Figure 10b) and August (Figure 10c). As comparison, the climatology SPM fluxes near the Yangtze River Estuary in this period (Figure 2f–h) are weaker than those in 2020. In the offshore region of the ECS, enhanced SPM fluxes were also observed from July to October 2020 in comparison to the corresponding climatology monthly SPM fluxes (Figure 2g–j).
The SSS distribution in the summer of 2020 can be well addressed by the freshwater fluxes in this period. In July 2020, strong southeastward freshwater flux was located in the Yangtze River Estuary region (Figure 10g). At station C, the freshwater flux was 272 g m−2 s−1 in this month. This led to anomalous low SSS in the region to the southeast of the Yangtze River Estuary. The climatology freshwater flux in July (Figure 3g) shows moderate northeastward movement of freshwater in the same month. The freshwater flux at station C is 131 g m−2 s−1 in this month. Thus, the low SSS was observed in the offshore region of ECS to the southeast of the Yangtze River Estuary (Figure 9g). In August and September 2020, the strengthened freshwater fluxes were observed in interior ECS (Figure 10h,i). This was largely driven by the lower SSS in the coast region north of the Yangtze River due to the advection of the flood water in the summer of 2020, different from normal years. It helped spreading the freshwater and lowering SSS across the entire ECS as shown in Figure 9h,i. In October 2020, the freshwater flux (Figure 10j) became similar to the climatology one in the same month (Figure 3j).

4. Discussion

In this study, satellite-derived ocean current, SPM, and SSS data are used to assess the dynamics of the surface SPM and freshwater fluxes in the YS and ECS. In combination with the SPM flux study in the GOA [63], we demonstrated that the synergy of various satellite-derived products from different categories can provide a new insight, research, and knowledge of the ocean processes, which cannot be achieved with a sole ocean data category, e.g., SPM product from satellite ocean color observations or ocean current products from satellite altimetry measurements. A similar approach can be further extended to provide the SPM and freshwater fluxes for the global coastal waters, thereby SPM and freshwater fluxes for the global coastal and river estuarine regions can be effectively evaluated and monitored in near-real-time with the combined satellite measurements of ocean current, SPM, and SSS. New research studies, such as the interaction of the river on the coastal and estuarine ecosystem, linkage between the atmosphere/land events, and the variability of sediment and freshwater/saltwater flux, can be conducted with the synergetic effort to fuse these different satellite ocean data into the new ocean products.
It is noted that the SPM and freshwater fluxes are computed, instead of the direct measurements, from current velocity, SPM, and SSS data as described in Equations (1)–(7). Specifically, the surface SPM flux is calculated using Equations (1)–(3) with the surface SPM concentration and surface current velocity [63]. The YS region covers ~380,000 km2 with a mean water depth of 44 m, while the ECS has ~1,249,000 km2 with a mean water depth of ~350 m. The vast domain and moderate water depth in the YS and ECS determine that the accuracy of the SPM and freshwater fluxes in this study should be similar to those in a variety of the coastal regions in GOA [56,57] and Greenland shelf region [58]. Thus, the mesoscale features and quantifications of SPM and freshwater fluxes as shown in this study should generally hold well with high accuracy. On the other hand, the uncertainty of the SPM and freshwater fluxes can be significantly increased in the near-shore region such as the Subei Shoal with the water depth of only a couple of meters. The errors come mainly from those of satellite-derived products (surface current velocity, SPM, and SSS) and ageostrophic components driven by the tide, winds, etc.
The sea surface velocity is composed of both the geostrophic component driven by the sea surface height measurements and the ageostrophic components due to winds and tides, etc. For most of the YS and ECS regions, the wind-driven Ekman component is less significant than the geostrophic velocity at the sea surface and at 15 m water depth [55]. However, the wind-driven current can still be significant in the extremely shallow waters such as the Subei Shoal region. For the altimetry measurements, larger errors within a few kilometers offshore distance are caused by the land contamination, complication of the bathymetry, and the inaccurate tide prediction [67]. It is noted that since the geostrophic current at the ocean surface is the strongest in the water column, the total SPM and SSS transports can more or less be represented by the surface SPM and SSS fluxes. Indeed, results of the surface SPM fluxes (Figure 1d) and their seasonal changes (Figure 2) agree generally well with the SPM transport and sediment accumulation at the ocean bottom in the YS and ECS from both the experiment survey [10] and a model study [68].
The tidal effects on satellite altimetry and consequently the altimetry-derived surface current are mostly removed in the altimetry data processing in the coastal region. Therefore, the satellite-derived current velocity data do not include the tidal component. However, the errors caused by the flood and ebb tidal currents on the daily products can be largely canceled out with each other [69] when the monthly velocity is calculated in the YS and ECS regions. Thus, the tidal effects and corresponding errors are not significant when assessing the SPM and freshwater fluxes on monthly basis from 2018 to 2023 in this study.
In the coastal region, the SSS accuracy presents significant challenges compared to that in open oceans due to various factors, e.g., land-sea contamination, coarse spatial resolution [70]. The uncertainty of the SSS retrievals increase from ~0.22 psu for the open ocean to ~0.5 psu in the region close to the coastline (0–150 km) [71]. Note that most part of the transect lines A and B are in the farther offshore region and the station C is ~52 km away from the coastline in this study.
In all, this study provides a solid and reliable analysis of the SPM and freshwater fluxes for most part of the YS and ECS. However, cautions should be given in the nearshore region especially over the extremely shallow waters such as the Subei Shoal region due to high uncertainties in the satellite-derived SSS and current velocity products.
It is also noted that the interannual variability of the SPM and freshwater fluxes has been well explored quantitatively with the fluxes across transect lines A and B in Figure 4, Figure 5, Figure 6 and Figure 7 and the anomalous SPM and freshwater fluxes during the summer of 2020 (Figure 8, Figure 9 and Figure 10). However, the available data only cover the period between 2018 and 2023, which is not long enough to evaluate the long-term trend. Future research and continuous satellite measurements of these ocean properties are essential to address the long-term trend of the surface SPM and freshwater fluxes in the region.

5. Conclusions

Satellite observations of the surface SPM flux clearly show the routes and seasonality from the coastal region of the ECS to the interior ECS. In the northern Subei Shoal, the offshore-flowing SPM largely deposit in the sediment front region of the Subei Shoal sediment plume. There are two main sources for the surface SPM flux from the coastal region to the interior ECS, i.e., one from the Subei Shoal plume and another from the Yangtze River Estuary region. The average surface SPM flux reaches ~0.3–0.4 g m−2 s−1 along the transportation route. The highest SPM flux occurs in the winter season and the lowest SPM flux in the summer season. In fact, the offshore surface SPM flux is usually one order higher in winter than that in summer.
The surface freshwater flux in the YS and ECS shows a different feature from the surface SPM flux in terms of both the spatial pattern and seasonal variability. The freshwater flux map shows the route of freshwater flux from the Yangtze River Estuary region. It follows the SCC moving alongshore northward, turns offshore at around the Subei Shoal, merges with southward freshwater flux accompanying with the YSCC, and eventually moves southward into central ECS. In contrast to the strongest offshore surface SPM flux in the winter season, intensive offshore surface freshwater flux happens in the summer season, corresponding to the Yangtze River discharge peak in summer. At the transect line A between [122.94°E, 31.00°N] and [122.94°E, 34.00°N] off the Yangtze River Estuary and Subei Shoal, the eastward freshwater flux ranges between 60 and 90 g m−2 s−1, while it is <30 g m−2 s−1 westward in winter. Unlike the clear seasonality of the zonal surface SPM and freshwater fluxes, both the meridional surface SPM and freshwater fluxes are dominated with the short-term variability driven by the constant reversal and uncertainty of the ocean current in meridional direction.
Using the satellite ocean color, SSS, and altimetry measurements, we also observed the SPM and SSS changes, and the corresponding surface SPM and freshwater fluxes that drove the SPM and SSS during the 2020 Yangtze River summer flooding event. The anomalous SPM distribution was found and largely confined in the nearshore region off the Yangtze River Estuary in August, and the enhanced SPM spread further offshore in September and October. The enhancement of surface SPM flux agrees with the change in the SPM pattern correspondingly. The SSS change in the summer of 2020 was driven by the enhanced surface freshwater flux in the same period. The stronger southward surface freshwater flux near the Yangtze River Estuary in August 2020 led to a wedge-shaped low SSS pattern to the southeast of the Yangtze River Estuary. The enhanced surface freshwater flux in August and September further spread the low-salinity water in the entire ECS.

Author Contributions

Conceptualization, W.S. and M.W.; Methodology, W.S. and M.W.; Formal analysis, W.S.; Investigation, W.S. and M.W.; Data curation, W.S.; Writing—original draft, W.S.; Writing—review & editing, W.S. and M.W.; Supervision, M.W.; Funding acquisition, M.W. All authors have read and agreed to the published version of the manuscript.

Funding

This research was supported by the Joint Polar Satellite System (JPSS) funding.

Data Availability Statement

The original contributions presented in this study are included in the article. Further inquiries can be directed to the corresponding author.

Acknowledgments

We thank four anonymous reviewers for their useful comments. Figure 1, Figure 2, Figure 3, Figure 4, Figure 5, Figure 8, Figure 9 and Figure 10 are produced using the Ocean Color Data Analysis and Processing System (OCDAPS) (https://dx.doi.org/10.1117/12.2070478) developed by the NOAA Ocean Color Science Team. The scientific results and conclusions, as well as any views or opinions expressed herein, are those of the author(s) and do not necessarily reflect those of NOAA or the Department of Commerce.

Conflicts of Interest

The authors declare no conflict of interest.

References

  1. Shi, W.; Wang, M. Satellite views of the Bohai Sea, Yellow Sea, and East China Sea. Prog. Ocean. 2012, 104, 30–45. [Google Scholar] [CrossRef]
  2. Shi, W.; Wang, M. Characterization of global ocean turbidity from Moderate Resolution Imaging Spectroradiometer ocean color observations. J. Geophys. Res.-Ocean. 2010, 115, C11022. [Google Scholar] [CrossRef]
  3. Bian, C.W.; Jiang, W.S.; Quan, Q.; Wang, T.; Greatbatch, R.J.; Li, W. Distributions of suspended sediment concentration in the Yellow Sea and the East China Sea based on field surveys during the four seasons of 2011. J. Mar. Syst. 2013, 121, 24–35. [Google Scholar] [CrossRef]
  4. Wei, J.W.; Wang, M.; Jiang, L.D.; Yu, X.L.; Mikelsons, K.; Shen, F. Global Estimation of Suspended Particulate Matter From Satellite Ocean Color Imagery. J. Geophys. Res.-Ocean. 2021, 126, e2021JC017303. [Google Scholar] [CrossRef] [PubMed]
  5. Shen, F.; Zhou, Y.X.; Li, J.F.; He, Q.; Verhoef, W. Remotely sensed variability of the suspended sediment concentration and its response to decreased river discharge in the Yangtze estuary and adjacent coast. Cont. Shelf. Res. 2013, 69, 52–61. [Google Scholar] [CrossRef]
  6. Gordon, H.R.; Wang, M. Retrieval of Water-Leaving Radiance and Aerosol Optical-Thickness over the Oceans with Seawifs—A Preliminary Algorithm. Appl. Opt. 1994, 33, 443–452. [Google Scholar] [CrossRef]
  7. Wang, M. Remote sensing of the ocean contributions from ultraviolet to near-infrared using the shortwave infrared bands: Simulations. Appl. Opt. 2007, 46, 1535–1547. [Google Scholar] [CrossRef] [PubMed]
  8. Wang, M.; Son, S.; Harding, L.W. Retrieval of diffuse attenuation coefficient in the Chesapeake Bay and turbid ocean regions for satellite ocean color applications. J. Geophys. Res.-Ocean. 2009, 114, C10011. [Google Scholar] [CrossRef]
  9. Shi, W.; Wang, M. Ocean reflectance spectra at the red, near-infrared, and shortwave infrared from highly turbid waters: A study in the Bohai Sea, Yellow Sea, and East China Sea. Limnol. Ocean. 2014, 59, 427–444. [Google Scholar] [CrossRef]
  10. Dong, L.X.; Guan, W.B.; Chen, Q.; Li, X.H.; Liu, X.H.; Zeng, X.M. Sediment transport in the Yellow Sea and East China Sea. Estuar. Coast. Shelf Sci. 2011, 93, 248–258. [Google Scholar] [CrossRef]
  11. Xu, Z.; Ma, J.; Wang, H.; Hu, Y.J.; Yang, G.Y.; Deng, W. River Discharge and Saltwater Intrusion Level Study of Yangtze River Estuary, China. Water 2018, 10, 683. [Google Scholar] [CrossRef]
  12. Milliman, J.D.; Meade, R.H. World-Wide Delivery of River Sediment to the Oceans. J. Geol. 1983, 91, 1–21. [Google Scholar] [CrossRef]
  13. Yang, S.L.; Xu, K.H.; Milliman, J.D.; Yang, H.F.; Wu, C.S. Decline of Yangtze River water and sediment discharge: Impact from natural and anthropogenic changes. Sci. Rep. 2015, 5, 12581. [Google Scholar] [CrossRef] [PubMed]
  14. Mei, X.F.; Dai, Z.J.; van Gelder, P.H.A.J.M.; Gao, J.J. Linking Three Gorges Dam and downstream hydrological regimes along the Yangtze River, China. Earth Space Sci. 2015, 2, 94–106. [Google Scholar] [CrossRef]
  15. Wang, Y.; Aubrey, D.G. The Characteristics of the China Coastline. Cont. Shelf Res. 1987, 7, 329–349. [Google Scholar] [CrossRef]
  16. Milliman, J.D.; Shen, H.T.; Yang, Z.S.; Meade, R.H. Transport and Deposition of River Sediment in the Changjiang Estuary and Adjacent Continental-Shelf. Cont. Shelf Res. 1985, 4, 37–45. [Google Scholar] [CrossRef]
  17. Chen, X.Q.; Yan, Y.X.; Fu, R.S.; Dou, X.P.; Zhang, E.F. Sediment transport from the Yangtze River, China, into the sea over the Post-Three Gorge Dam Period: A discussion. Quatern. Int. 2008, 186, 55–64. [Google Scholar] [CrossRef]
  18. Fang, G.H. Tides and tidal currents in East China Sea, Huanghai Sea and Bohai Sea. In Oceanology of China Seas; Zhou, D., Liang, Y.B., Zeng, C.K., Eds.; Kluwer Academic Publisher: Dordrecht, The Netherlands, 1994; Volume 1, pp. 101–112. [Google Scholar]
  19. Liu, Z.Q.; Gan, J.P.; Hu, J.Y.; Wu, H.; Cai, Z.Y.; Deng, Y.F. Progress on circulation dynamics in the East China Sea and southern Yellow Sea: Origination, pathways, and destinations of shelf currents. Prog. Ocean. 2021, 193, 102553. [Google Scholar] [CrossRef]
  20. Lie, H.J.; Cho, C.H. Seasonal circulation patterns of the Yellow and East China Seas derived from satellite-tracked drifter trajectories and hydrographic observations. Prog. Ocean. 2016, 146, 121–141. [Google Scholar] [CrossRef]
  21. Isobe, A. Recent advances in ocean-circulation research on the Yellow Sea and East China Sea shelves. J. Ocean. 2008, 64, 569–584. [Google Scholar] [CrossRef]
  22. He, Z.Y.; Zhu, S.X.; Sheng, J.Y. Numerical Study of Circulation and Seasonal Variability in the Southwestern Yellow Sea. J. Mar. Sci. Eng. 2022, 10, 912. [Google Scholar] [CrossRef]
  23. Chen, X.Y.; Wang, X.H.; Guo, J.S. Seasonal variability of the sea surface salinity in the East China Sea during 1990–2002. J. Geophys. Res.-Ocean. 2006, 111, C05008. [Google Scholar] [CrossRef]
  24. Delcroix, T.; Murtugudde, R. Sea surface salinity changes in the East China Sea during 1997–2001: Influence of the Yangtze river. J. Geophys. Res.-Ocean. 2002, 107, SRF 9-1–SRF 9-11. [Google Scholar] [CrossRef]
  25. Park, T.; Jang, C.J.; Kwon, M.; Na, H.; Kim, K.Y. An effect of ENSO on summer surface salinity in the Yellow and East China Seas. J. Mar. Syst. 2015, 141, 122–127. [Google Scholar] [CrossRef]
  26. Oh, K.H.; Lee, J.H.; Lee, S.; Pang, I.C. Intrusion of low-salinity water into the Yellow Sea Interior in 2012. Ocean Sci. J. 2014, 49, 343–356. [Google Scholar] [CrossRef]
  27. Hickox, R.; Belkin, I.; Cornillon, P.; Shan, Z. Climatology and seasonal variability of ocean fronts in the east China, Yellow and Bohai Seas from satellite SST data. Geophys. Res. Lett. 2000, 27, 2945–2948. [Google Scholar] [CrossRef]
  28. Tseng, C.T.; Lin, C.Y.; Chen, S.C.; Shyu, C.Z. Temporal and spatial variation of sea surface temperature in the East China Sea. Cont. Shelf Res. 2000, 29, 373–387. [Google Scholar] [CrossRef]
  29. Xie, S.-P.; Hafner, J.; Tanimoto, Y.; Liu, W.T.; Tokinaga, H.; Xu, H. Bathymetric effect on the winter sea surface temperature and climate of the Yellow and East China Seas. Geophy. Res. Lett. 2002, 29, 81-1–81-4. [Google Scholar] [CrossRef]
  30. Tang, D.L.; Ni, I.H.; Muller-Karger, F.E.; Liu, Z.J. Analysis of annual and spatial patterns of CZCS-derived pigment concentrations on the continental shelf of China. Cont. Shelf Res. 1998, 18, 1493–1515. [Google Scholar] [CrossRef]
  31. Shi, W.; Wang, M. Green macroalgae blooms in the Yellow Sea during the spring and summer of 2008. J. Geophys. Res.-Ocean. 2009, 114, C12010. [Google Scholar] [CrossRef]
  32. Hu, C.M.; Li, D.Q.; Chen, C.S.; Ge, J.Z.; Muller-Karger, F.E.; Liu, J.P.; Yu, F.; He, M.X. On the recurrent Ulva prolifera blooms in the Yellow Sea and East China Sea. J. Geophys. Res.-Ocean. 2010, 115, C05017. [Google Scholar] [CrossRef]
  33. Shi, W.; Wang, M. Satellite observations of the seasonal sediment plume in central East China Sea. J. Mar. Syst. 2010, 82, 280–285. [Google Scholar] [CrossRef]
  34. Shi, W.; Wang, M.; Jiang, L. Spring-neap tidal effects on satellite ocean color observations in the Bohai Sea, Yellow Sea, and East China Sea. J. Geophys. Res.-Ocean. 2011, 116, C12032. [Google Scholar] [CrossRef]
  35. Kim, D.W.; Park, Y.J.; Jeong, J.Y.; Jo, Y.H. Estimation of Hourly Sea Surface Salinity in the East China Sea Using Geostationary Ocean Color Imager Measurements. Remote Sens. 2020, 12, 755. [Google Scholar] [CrossRef]
  36. Liu, J.; Bellerby, R.G.J.; Zhu, Q.; Ge, J.Z. Estimating Sea Surface Salinity in the East China Sea Using Satellite Remote Sensing and Machine Learning. Earth Space Sci. 2023, 10, e2023EA003230. [Google Scholar] [CrossRef]
  37. Bao, S.L.; Wang, H.Z.; Zhang, R.; Yan, H.Q.; Chen, J. Comparison of Satellite-Derived Sea Surface Salinity Products from SMOS, Aquarius, and SMAP. J. Geophys. Res.-Ocean. 2019, 124, 1932–1944. [Google Scholar] [CrossRef]
  38. Jang, E.; Kim, Y.J.; Im, J.; Park, Y.G.; Sung, T. Global sea surface salinity the synergistic use of SMAP satellite and HYCOM data based on machine learning. Remote Sens. Environ. 2022, 273, 112980. [Google Scholar] [CrossRef]
  39. Yanagi, T.; Morimoto, A.; Ichikawa, K. Seasonal variation in surface circulation of the East China Sea and the Yellow Sea derived from satellite altimetric data. Cont. Shelf Res. 1997, 17, 655–664. [Google Scholar] [CrossRef]
  40. O’Neill, P.; Entekhabi, D.; Njoku, E.; Kellogg, K. The Nasa Soil Moisture Active Passive (Smap) Mission: Overview. In Proceedings of the 2010 IEEE International Geoscience and Remote Sensing Symposium, Honolulu, HI, USA, 25–30 July 2010; pp. 3236–3239. [Google Scholar]
  41. Kerr, Y.H.; Waldteufel, P.; Wigneron, J.P.; Delwart, S.; Cabot, F.; Boutin, J.; Escorihuela, M.J.; Font, J.; Reul, N.; Gruhier, C.; et al. The SMOS Mission: New Tool for Monitoring Key Elements of the Global Water Cycle. Proc. IEEE 2010, 98, 666–687. [Google Scholar] [CrossRef]
  42. Lambin, J.; Morrow, R.; Fu, L.L.; Willis, J.K.; Bonekamp, H.; Lillibridge, J.; Perbos, J.; Zaouche, G.; Vaze, P.; Bannoura, W.; et al. The OSTM/Jason-2 Mission. Mar. Geod. 2010, 33, 4–25. [Google Scholar] [CrossRef]
  43. Morrow, R.; Fu, L.L.; Ardhuin, F.; Benkiran, M.; Chapron, B.; Cosme, E.; d’Ovidio, F.; Farrar, J.T.; Gille, S.T.; Lapeyre, G.; et al. Global Observations of Fine-Scale Ocean Surface Topography With the Surface Water and Ocean Topography (SWOT) Mission. Front. Mar. Sci. 2019, 6, 232. [Google Scholar] [CrossRef]
  44. Wang, M.; Liu, X.; Tan, L.; Jiang, L.; Son, S.; Shi, W.; Rausch, K.; Voss, K. Impacts of VIIRS SDR performance on ocean color products. J. Geophys. Res.-Atmos. 2013, 118, 10347–10360. [Google Scholar] [CrossRef]
  45. Goldberg, M.D.; Kilcoyne, H.; Cikanek, H.; Mehta, A. Joint Polar Satellite System: The United States next generation civilian polar-orbiting environmental satellite system. J. Geophys. Res.-Atmos. 2013, 118, 13463–13475. [Google Scholar] [CrossRef]
  46. Wang, M.; Son, S. VIIRS-derived chlorophyll-a using the ocean color index method. Remote Sens. Environ. 2016, 182, 141–149. [Google Scholar] [CrossRef]
  47. Yu, X.L.; Lee, Z.; Shen, F.; Wang, M.H.; Wei, J.W.; Jiang, L.D.; Shang, Z.H. An empirical algorithm to seamlessly retrieve the concentration of suspended particulate matter from water color across ocean to turbid river mouths. Remote Sens. Environ. 2019, 235, 111491. [Google Scholar] [CrossRef]
  48. Liu, X.; Wang, M. Gap Filling of Missing Data for VIIRS Global Ocean Color Products Using the DINEOF Method. IEEE Trans. Geosci. Remote Sens. 2018, 56, 4464–4476. [Google Scholar] [CrossRef]
  49. Liu, X.; Wang, M. Global daily gap-free ocean color products from multi-satellite measurements. Int. J. Appl. Earth Obs. 2022, 108, 102714. [Google Scholar] [CrossRef]
  50. Tang, W.Q.; Fore, A.; Yueh, S.; Lee, T.; Hayashi, A.; Sanchez-Franks, A.; Martinez, J.; King, B.; Baranowski, D. Validating SMAP SSS with in situ measurements. Remote Sens. Environ. 2017, 200, 326–340. [Google Scholar] [CrossRef]
  51. Olmedo, E.; González-Haro, C.; Hoareau, N.; Umbert, M.; González-Gambau, V.; Martínez, J.; Gabarró, C.; Turiel, A. Nine years of SMOS sea surface salinity global maps at the Barcelona Expert Center. Earth Syst. Sci. Data 2021, 13, 857–888. [Google Scholar] [CrossRef]
  52. Fu, L.L.; Christensen, E.J.; Yamarone, C.A.; Lefebvre, M.; Menard, Y.; Dorrer, M.; Escudier, P. Topex/Poseidon Mission Overview. J. Geophys. Res.-Ocean. 1994, 99, 24369–24381. [Google Scholar] [CrossRef]
  53. Nerem, R.S.; Chambers, D.P.; Choe, C.; Mitchum, G.T. Estimating Mean Sea Level Change from the TOPEX and Jason Altimeter Missions. Mar. Geod. 2010, 33, 435–446. [Google Scholar] [CrossRef]
  54. Pujol, M.I.; Faugère, Y.; Taburet, G.; Dupuy, S.; Pelloquin, C.; Ablain, M.; Picot, N. DUACS DT2014: The new multi-mission altimeter data set reprocessed over 20 years. Ocean Sci. 2016, 12, 1067–1090. [Google Scholar] [CrossRef]
  55. Rio, M.H.; Mulet, S.; Picot, N. Beyond GOCE for the ocean circulation estimate: Synergetic use of altimetry, gravimetry, and in situ data provides new insight into geostrophic and Ekman currents. Geophys. Res. Lett. 2014, 41, 8918–8925. [Google Scholar] [CrossRef]
  56. Liu, Y.G.; Weisberg, R.H.; Vignudelli, S.; Mitchum, G.T. Evaluation of altimetry-derived surface current products using Lagrangian drifter trajectories in the eastern Gulf of Mexico. J. Geophys. Res.-Ocean. 2014, 119, 2827–2842. [Google Scholar] [CrossRef]
  57. Mulet, S.; Etienne, H.; Ballarotta, M.; Faugere, Y.; Rio, M.H.; Dibarboure, G.; Picot, N. Synergy between surface drifters and altimetry to increase the accuracy of sea level anomaly and geostrophic current maps in the Gulf of Mexico. Adv. Space Res. 2021, 68, 420–431. [Google Scholar] [CrossRef]
  58. Coquereau, A.; Foukal, N.P. Evaluating altimetry-derived surface currents on the south Greenland shelf with surface drifters. Ocean Sci. 2023, 19, 1393–1411. [Google Scholar] [CrossRef]
  59. Munchow, A.; Melling, H.; Falkner, K.K. An observational estimate of volume and freshwater flux leaving the arctic ocean through nares strait. J. Phys. Ocean 2006, 36, 2025–2041. [Google Scholar] [CrossRef]
  60. Brokaw, R.J.; Subrahmanyam, B.; Morey, S.L. Loop Current and Eddy-Driven Salinity Variability in the Gulf of Mexico. Geophys. Res. Lett. 2019, 46, 5978–5986. [Google Scholar] [CrossRef]
  61. Mazloff, M.R.; Heimbach, P.; Wunsch, C. An Eddy-Permitting Southern Ocean State Estimate. J. Phys. Ocean 2010, 40, 880–899. [Google Scholar] [CrossRef]
  62. Zang, Z.C.; Xue, Z.G.; Xu, K.H.; Bentley, S.J.; Chen, Q.; D’Sa, E.J.; Ge, Q. A Two Decadal (1993–2012) Numerical Assessment of Sediment Dynamics in the Northern Gulf of Mexico. Water 2019, 11, 938. [Google Scholar] [CrossRef]
  63. Shi, W.; Wang, M.; Subrahmanyam, B. Surface Suspended Particulate Matter Flux in the Northern Gulf of Mexico from Satellite Observations. IEEE Geosci. Remote Sens. Lett. 2025, 22, 1501005. [Google Scholar] [CrossRef]
  64. Zhou, Z.Q.; Xie, S.P.; Zhang, R.H. Historic Yangtze flooding of 2020 tied to extreme Indian Ocean conditions. Proc. Natl. Acad. Sci. USA 2021, 118, e2022255118. [Google Scholar] [CrossRef]
  65. Zhang, H.R.; Dou, Y.H.; Ye, L.; Zhang, C.; Yao, H.M.; Bao, Z.F.; Tang, Z.Y.; Wang, Y.Q.; Huang, Y.K.; Zhu, S.; et al. Realizing the full reservoir operation potential during the 2020 Yangtze river floods. Sci Rep. 2022, 12, 2822. [Google Scholar] [CrossRef] [PubMed]
  66. Zhu, Z.N.; Zhu, X.H.; Zhang, C.Z.; Chen, M.M.; Zheng, H.; Zhang, Z.S.; Zhong, J.W.; Wei, L.X.; Li, Q.; Wang, H.; et al. Monitoring of Yangtze River Discharge at Datong Hydrometric Station Using Acoustic Tomography Technology. Front. Earth Sci. 2021, 9, 723123. [Google Scholar] [CrossRef]
  67. Birol, F.; Bignalet-Cazalet, F.; Cancet, M.; Daguze, J.A.; Fkaier, W.; Fouchet, E.; Léger, F.; Maraldi, C.; Niño, F.; Pujol, M.I.; et al. Understanding uncertainties in the satellite altimeter measurement of coastal sea level: Insights from a round-robin analysis. Ocean Sci. 2025, 21, 133–150. [Google Scholar] [CrossRef]
  68. Bian, C.W.; Jiang, W.S.; Greatbatch, R.J. An exploratory model study of sediment transport sources and deposits in the Bohai Sea, Yellow Sea, and East China Sea. J. Geophys. Res.-Ocean. 2013, 118, 5908–5923. [Google Scholar] [CrossRef]
  69. Groen, P. On the residual transport of suspended matter by an alternating tidal current. Neth. J. Sea Res. 1967, 3, 564–574. [Google Scholar] [CrossRef]
  70. Kim, Y.J.; Han, D.; Jang, E.; Im, J.; Sung, T. Remote sensing of sea surface salinity: Challenges and research directions. Gisci. Remote Sens. 2023, 60, 2166377. [Google Scholar] [CrossRef]
  71. Reul, N.; Grodsky, S.A.; Arias, M.; Boutin, J.; Catany, R.; Chapron, B.; D’Amico, F.; Dinnat, E.; Donlon, C.; Fore, A.; et al. Sea surface salinity estimates from spaceborne L-band radiometers: An overview of the first decade of observation (2010–2019). Remote Sens. Environ. 2020, 242, 111769. [Google Scholar] [CrossRef]
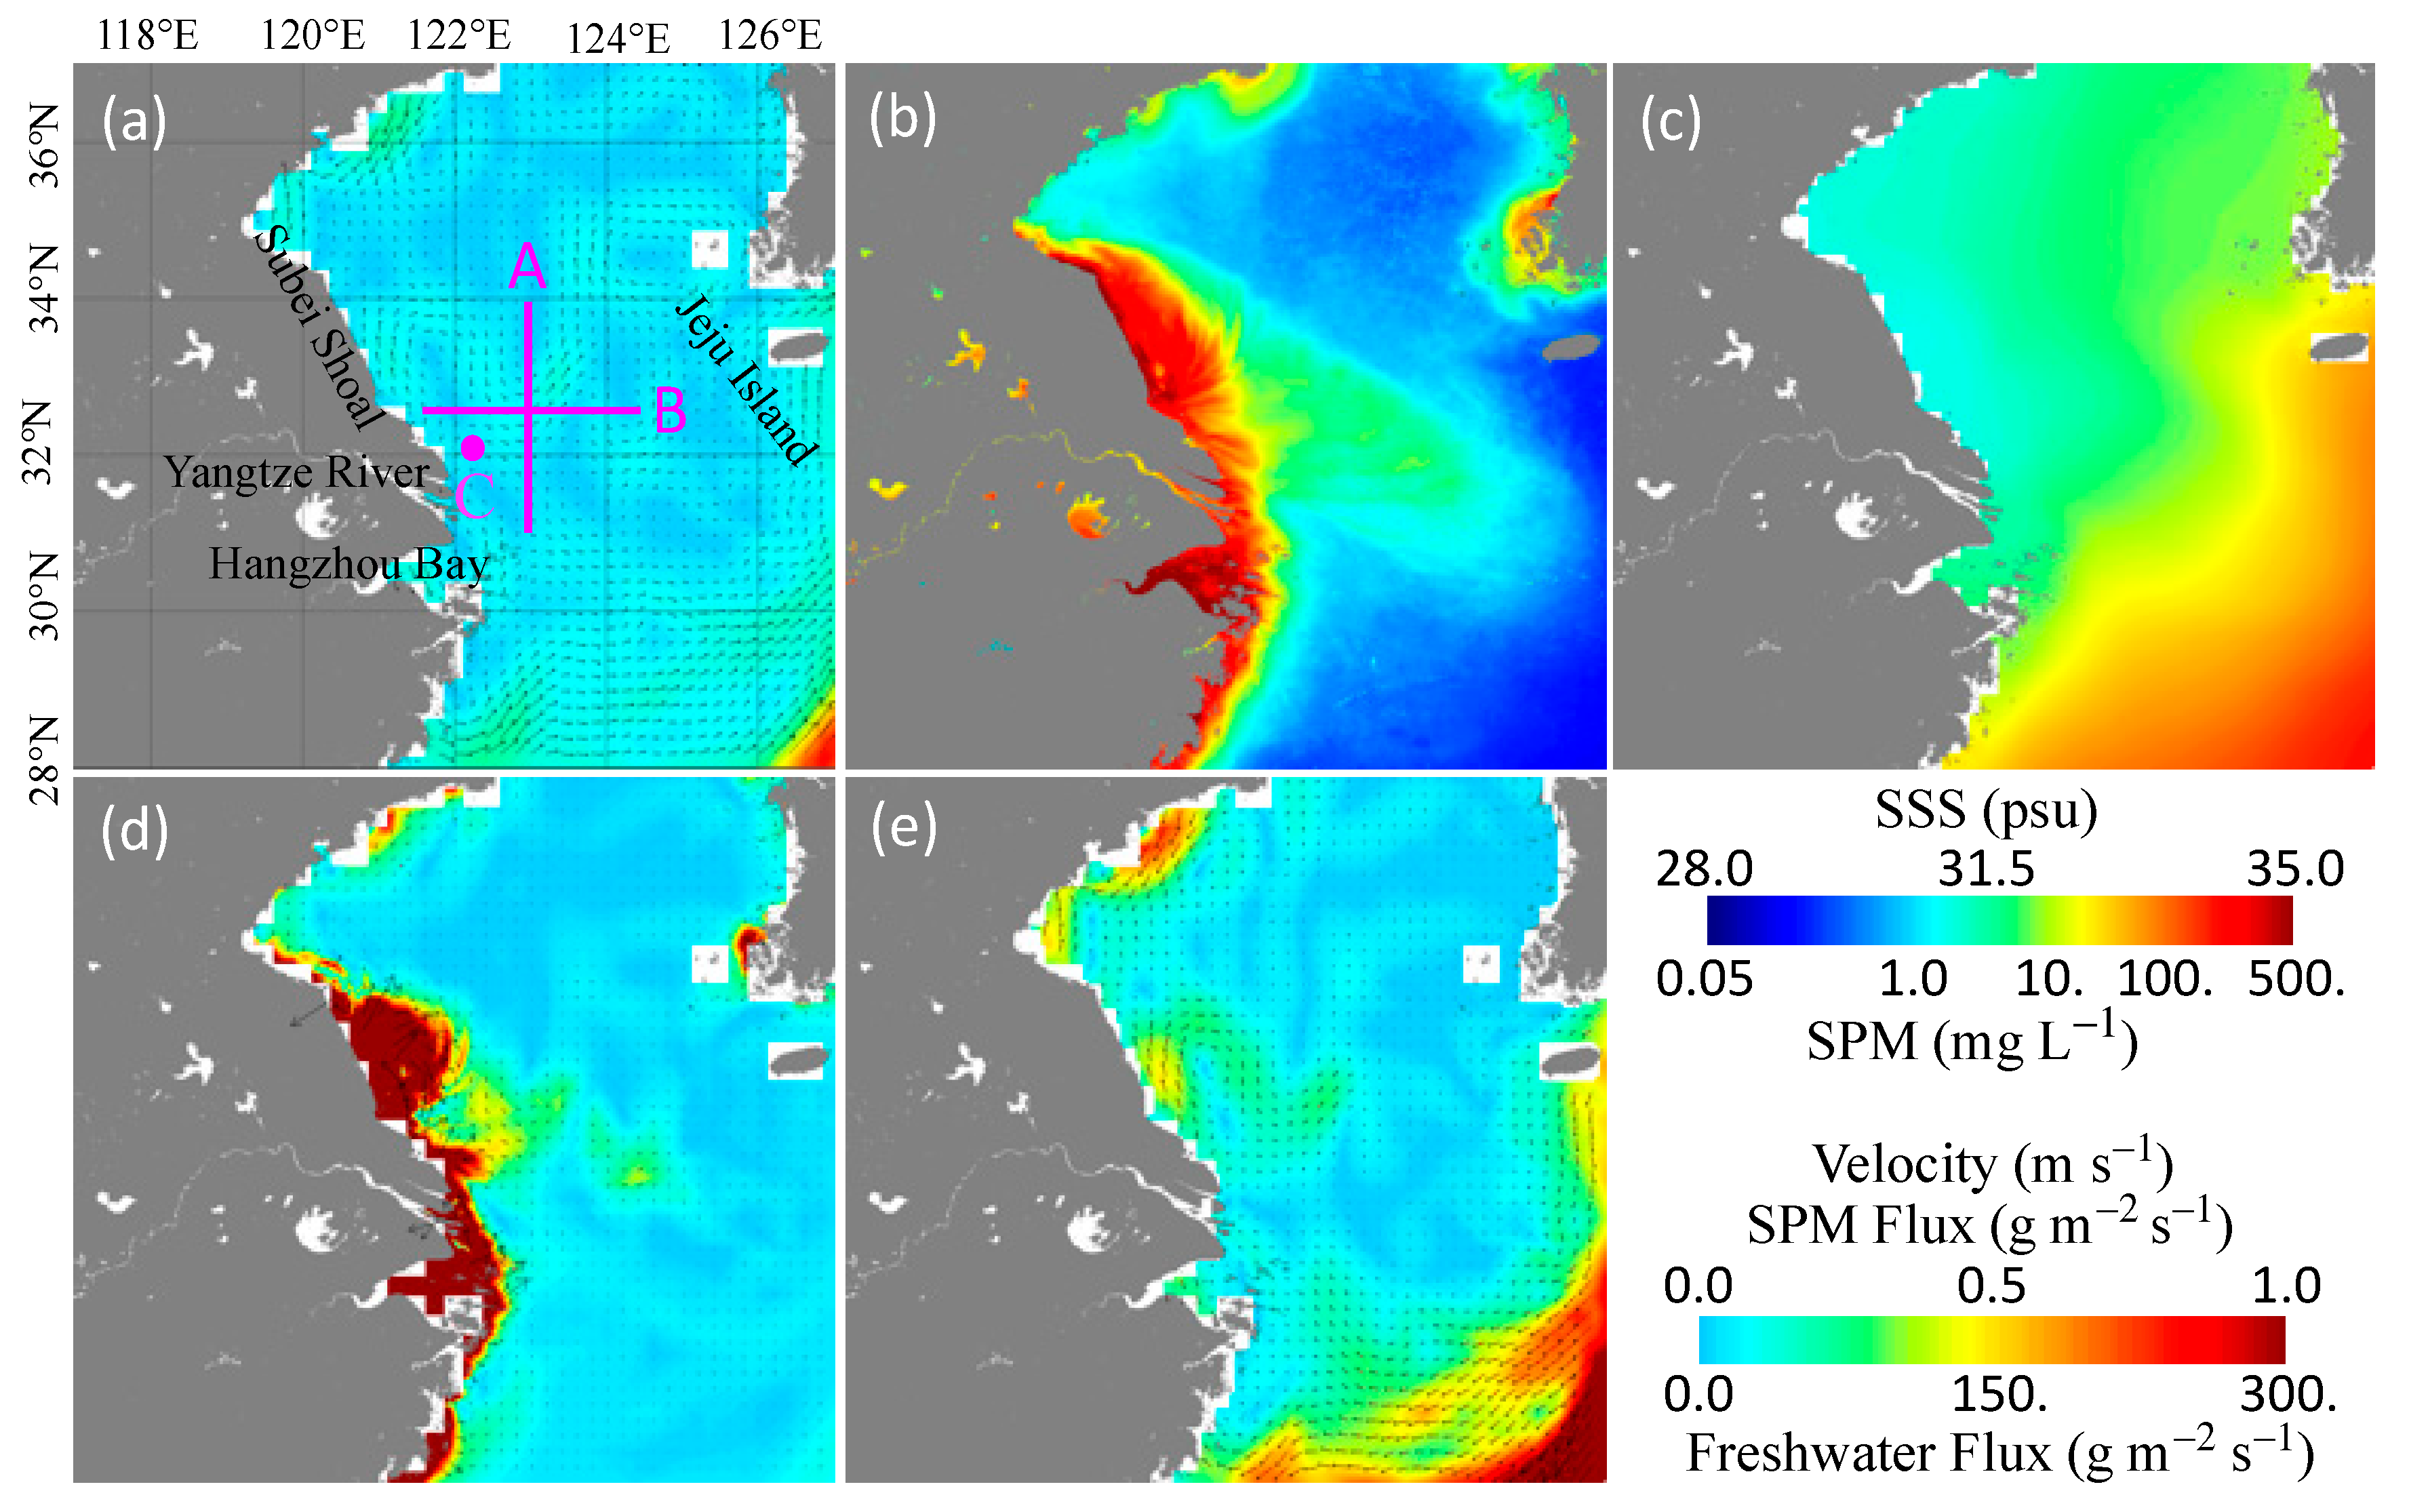
Figure 1. Climatology (2018–2023) images of (a) current velocity (scale: 0–1.0 m s−1), (b) SPM, (c) SSS, (d) surface SPM flux, and (e) surface freshwater flux derived in the Yellow Sea and East China Sea. The meridional transect line A between [122.94°E, 31.00°N] and [122.94°E, 34.00°N] and zonal transect line B between [121.50°E, 31.50°N] and [124.50°E, 31.50°N] are marked in pink for further analysis. The station C near the Yangtze River Estuary at [122.30°E, 32.10°N] is also marked.
Remotesensing 17 02726 g001
Figure 2. Monthly climatology (2018–2023) images of surface SPM flux in (al) January–December.
Remotesensing 17 02726 g002
Figure 3. Monthly climatology (2018–2023) images of surface freshwater flux in (al) January–December.
Remotesensing 17 02726 g003
Figure 4. Ocean sea surface properties across transect line A between 2018 and 2023 for (a) SPM, (b) zonal surface SPM flux, (c) SSS, and (d) zonal surface freshwater flux.
Remotesensing 17 02726 g004
Figure 5. Ocean surface properties across transect line B between 2018 and 2023 for (a) SPM, (b) meridional surface SPM flux, (c) SSS, and (d) meridional surface freshwater flux.
Remotesensing 17 02726 g005
Figure 6. Temporal variations in transect mean values for (a) zonal and meridional SPM fluxes and (b) zonal and meridional freshwater fluxes, across the transect lines A and B, respectively.
Remotesensing 17 02726 g006
Figure 7. Temporal variations at station C near the Yangtze River Estuary for (a) zonal and meridional SPM fluxes and (b) zonal and meridional freshwater fluxes.
Remotesensing 17 02726 g007
Figure 8. Comparison between monthly climatology surface SPM in (ae) June, July, August, September, and October, and the monthly surface SPM (fj) in the same months of the 2020 flood year.
Remotesensing 17 02726 g008
Figure 9. Comparison between monthly climatology SSS in (ae) June, July, August, September, and October, and the monthly SSS (fj) in the same months of the 2020 flood year.
Remotesensing 17 02726 g009
Figure 10. Monthly surface SPM flux maps (ae) and monthly surface freshwater flux maps (fj) in June, July, August, September, and October of the 2020 flooding year.
Remotesensing 17 02726 g010
Disclaimer/Publisher’s Note: The statements, opinions and data contained in all publications are solely those of the individual author(s) and contributor(s) and not of MDPI and/or the editor(s). MDPI and/or the editor(s) disclaim responsibility for any injury to people or property resulting from any ideas, methods, instructions or products referred to in the content.