Abstract
While significant progress has been made in controlling point source pollution, agricultural non-point source pollution (AGNPSP) has emerged as a major contributor to global water pollution, posing a severe threat to ecological quality. According to China’s Second National Pollution Source Census, AGNPSP constitutes a substantial proportion of water pollution, making its mitigation a critical challenge. Identifying AGNPSP risk zones is essential for targeted management and effective intervention. This study focuses on Yongchuan District, a representative hilly–mountainous area in the Yangtze River Basin. Applying the landscape ecology “source–sink” theory, we selected seven natural factors influencing AGNPSP and constructed a minimum cumulative resistance model using remote sensing post-processing data. An attempt was made to classify the “source” and “sink” landscapes, and ultimately conduct a risk assessment of AGNPSP in Yongchuan District, identifying the key areas for AGNPSP control. Key findings include: 1. Vegetation coverage is the most significant natural factor affecting AGNPSP. 2. Extremely high- and high-risk zones cover 90% of Yongchuan, primarily concentrated in the central and southern regions, indicating severe AGNPSP pressure that demands urgent management. 3. The levels of ammonia nitrogen and total phosphorus in the typical sections are related to the risk levels of the corresponding sections. Consequently, the risk level of AGNPSP directly correlates with the pollutant concentrations measured in the sections. This study provides a robust scientific basis for AGNPSP risk assessment and targeted control strategies, offering valuable insights for pollution management in Yongchuan and similar regions.
1. Introduction
Globally, AGNPSP is a prevalent issue that is now challenging to resolve [1]. The primary constituents of AGNPSP are soil particles, in addition to nutrients such as nitrogen and phosphorus, and pesticides. The entry of AGNPSP into water bodies, soil, or the atmosphere occurs via surface runoff, farmland drainage, and other mechanisms. The sources of this phenomenon are diverse, including domestic sewage, fertilizer application, and household waste [2]. The AGNPSP is characterized by randomness, a wide range, ambiguity, and lag. According to data, AGNPSP has contaminated 30–50% of the earth’s surface [3]. Nitrogen and phosphorus from agricultural sources represent 81% and 93% of China’s water pollution, respectively. In comparison with point source pollution, non-point source pollution (particularly AGNPSP) is characterized by its extensive distribution, the complexity of tracing its origins, and the significant variation in its characteristics across different land types, during both flood seasons and non-flood seasons. This, in turn, results in considerable challenges in the domains of monitoring and governance [4]. The issue with AGNPSP is not optimistic. The AGNPSP issue is not hopeful [5].
Governments and scholars from across the world have also carried out essential AGNPSP research. AGNPSP risk assessment is currently regarded by many nations as one of the crucial methods for the efficient prevention and control of AGNPSP [6]. Both nationally and globally, research on the risk assessment of AGNPSP has produced some results, especially when it comes to the application of models, from early empirical statistics to more sophisticated modeling, for example, the originally representative mechanism models CREAMS, HSPF, and SWMM [7,8,9]. Through the process of parameter calibration and validation, these models have achieved a substantial enhancement in the accuracy of predictions concerning runoff water quality under diverse environmental conditions;the mid-term combination of GIS technology and “3S” (GIS, RS, GPS) technology, which investigates the interrelationship between AGNPSP and soil erosion [10,11,12,13,14,15,16]; the SWAT (Soil and Water Assessment Tool), HSPF (hydraulic simulation program fortran), and ANNAGNPS (annualized agricultural non-point source) models [17,18]; the multi-factor comprehensive evaluation method [19]; the output risk model method [20]; the remote sensing distributed non-point source pollution assessment model [21]; etc. The primary classification of these models is into empirical and mechanistic models. Empirical models are characterized by ease of data collection and operational simplicity. However, mechanistic models require a greater number of parameters and necessitate adjustment of these parameters according to the specific characteristics of the study area. The simulation results will be more accurate. Regarding content, various researchers also assess the risk of AGNPSP based on environmental factors, economic factors, etc.: C. Berka et al. [22] evaluated the risk of AGNPSP in the Canadian Sumas Basin using GIS technology in conjunction with other technologies; Potter et al. [23] and Vazquezv-Amabile et al. [24] investigated the risk of non-point source pollution at the watershed scale and the best course of action for management; in order to assess the risk of agricultural non-point source phosphorus pollution in the Yellow River Basin, Song et al. [25] used the spatial analysis function of GIS and the method of nutrient balance calculation; Ding et al. [26] used GIS methods to create a spatial distribution map of soil nutrients in the Wangjiagou small watershed of the Three Gorges Reservoir Area and carried out a risk assessment of nutrient status. Since the concept of source–sink landscapes can combine landscape patterns and point monitoring data with planar features in a somewhat organic way, the source–sink theory and the minimum cumulative resistance model, which were initially used to analyze ecological landscape patterns, have also been applied in recent years to the study of AGNPSP [27]. In addition, the physical features of the watershed landscape influence and limit the growth of AGNPSP both in terms of its occurrence and pace [28]. In addition, the minimum cumulative resistance model offers a quantitative method for evaluating the non-point source contamination risk. For instance, Sun et al. [29] used landscape pattern indices to reflect spatial differences in AGNPSP; Wang et al. [30] identified the source–sink risk of farmland non-point source pollution in the Three Gorges Reservoir Area based on the minimum cumulative resistance; Liu et al. [31] constructed the minimum cumulative resistance model to analyze the risk pattern of AGNPSP in Beibei District, Chongqing; and Dong et al. [32] studied the resistance base evaluation system and analyzed the risk level of AGNPSP sink upstream of Erhai Lake. Few researchers, meanwhile, have combined external natural elements that influence non-point source pollution to identify danger thresholds. However, after assessing the risk pattern, additional analysis was not coupled with point monitoring data due to the limits of the first study. As a result, AGNPSP sink analysis remained at the risk pattern evaluation level.
The Yangtze River Basin is strategically significant to China’s general pattern of regional development. However, years of extensive agricultural planting and other factors have resulted in AGNPSP remaining a key source of pollution in the Yangtze River Basin. Currently, one of the main goals of water ecological preservation in the Yangtze River Basin is improving the prevention and management of non-point source pollution [33]. The Yangtze River’s middle and upper sections are primarily hilly and mountainous regions with significant topography variations, fractured landscape, and comparatively concentrated rainfall. Severe soil erosion has also been caused by overcultivation and planting in hilly regions. Yongchuan District is one of Chongqing’s typical hilly and mountainous regions; it has a significant amount of sloping arable land in addition to a broad distribution of arable land. The AGNPSP issue is well-known. Therefore, conducting a risk assessment of AGNPSP, identifying risk areas and implementing zoned prevention, control, and management measures to reduce risks and protect the ecological environment in hilly and mountainous areas is of great significance.
In order to assess the source and sink risks of AGNPSP in Yongchuan District, Chongqing City, this study uses the district as its research area. This is achieved by selecting typical natural impact factors and assigning weights to them. A minimum cumulative resistance model is then built based on multi-source remote sensing data, and the risks of AGNPSP in Yongchuan District are identified. In typical hilly and mountainous regions, the research methodology can offer logical scientific support and reference recommendations for the risk assessment and prevention management of AGNPSP.
2. Materials and Methods
2.1. Overview of the Research Area
Situated in the southwest of Chongqing, on the north bank of the upper sections of the Yangtze River, Yongchuan District is located at latitude 28°56′–29°34′N and longitude 105°38′–106°05′E. The terrain of Yongchuan District is relatively level and features a wide variety of complicated landform types, the majority of which are low ranges and hills. The region is a typical hilly area of Chongqing, with hills, mild hills, and terraces strewn throughout (Figure 1). The five low mountain ranges encompass the entire area in a “Chuan” pattern from north to south. The Yangtze River is the main water system, and a section of the Yangtze River crosses the southern end of the district. Due to its unique physical and natural features, Yongchuan District serves as both an ecological barrier in the upper reaches of the Yangtze River and a crucial strategic hub for Chongqing’s main metropolitan area. Yongchuan District is responsible for 16 towns and 7 subdistricts. The primary crops grown in Yongchuan District include vegetables, oil crops, and cereal crops. The district has 653 km2 of total sowing area for grain crops, with 481,000 tons of total output. The main products of the livestock and poultry production in the area are live pigs and chickens. Owing to the typical hills’ geomorphic features, Yongchuan District has a high percentage of sloping farmland and a low quantity of good-quality farmland, which makes the latter vulnerable to soil erosion.
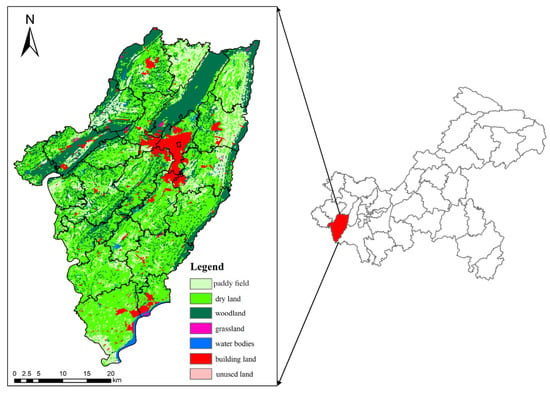
Figure 1.
Land use types in Yongchuan District, Chongqing City.
2.2. Introduction to Data Sources
This study uses remote sensing post-processing data, including land use type data from Yongchuan District in 2020, data from the district’s Digital Elevation Model (DEM), daily rainfall data from Chongqing stations in 2020, data from Yongchuan District’s Normalized Difference Vegetation Index (NDVI) in 2021, soil type data from Chongqing in 2020, and data from cross-sectional monitoring in Chongqing. With the exception of soil type data, which has a resolution of 1 km, raster data has a resolution of 30 m. In order to guarantee the uniformity of the data scales, a process of downscaling was incorporated into the data processing. This process involved the standardization of the land type data to a uniform scale of 30 m. The Chinese Academy of Sciences provided the data on land use types in Yongchuan District, while the Data Center of Resources and Environmental Sciences of the Chinese Academy of Sciences provided the data on the soil types, DEM, and NDVI. The cultivated land area of each subdistrics and town in Yongchuan District in 2020 is from the Yongchuan District Statistical Yearbook. Both the cross-sectional monitoring data and the meteorological data are gathered from the appropriate Yongchuan District agencies.
Section 2.3.2 provides details of the specific operation and instructions for remote sensing data.
2.3. Methods
Different agricultural contaminants that enter rivers through surface runoff and other processes from various sources are thought to be the cause of AGNPSP, which results in water pollution. The “source–sink” landscape pattern theory and the migration behavior of non-point source pollutants between heterogeneous patches are perfectly aligned, according to the field of landscape ecology.
First derived from the idea of air pollution sources and sinks [34,35], the theory of “source–sink” landscape patterns progressively extended the notions of source–sink to encompass broader ecological processes. The influence of landscape patterns on ecological processes was examined from the standpoint of source and sink, demonstrating the quantitative relationship between ecological processes and landscape ecological patterns and optimizing research methodologies. The coupling relationship between landscape patterns and AGNPSP in Yongchuan District is analyzed in this study using the notion of source–sink landscape patterns. In research, the term “source” landscape refers to landscape patches that support the AGNPSP development process, while the term “sink” landscape refers to landscape patches that impede and postpone AGNPSP development. Non-point source pollutants move from the “source” to the “sink” landscape when they are influenced by natural environmental conditions. This migration process creates regional variations in source–sink risk. The superposition effect of natural environmental elements and geographical distance are the causes of these spatial inequalities. By superimposing spatial distance and factors, the minimum cumulative resistance model may create a resistance base and determine the risk resistance surface. Therefore, this study evaluates the risk of AGNPSP in Yongchuan District by establishing a minimum cumulative resistance model for AGNPSP (Figure 2).
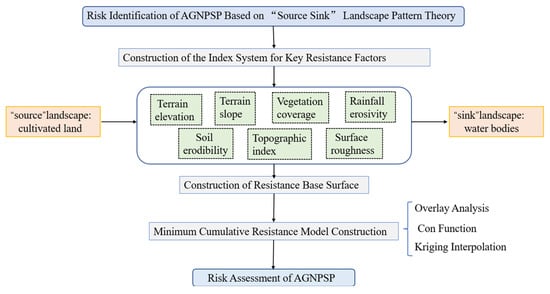
Figure 2.
Model flowchart.
2.3.1. Minimum Cumulative Resistance Model
Nowadays, a lot of analyses of non-point source pollution, landscape pattern, species conservation, and other topics use the minimum cumulative resistance model [36,37]. This model provides the least resistance needed to reach the target from the source across various resistance bases, and it considers three factors: the source, the spatial distance, and the resistance base [38]. The following is the calculating formula:
where MCR is the minimum cumulative resistance. represents the positive correlation function between MCR and . is the spatial movement distance of material and energy from the source landscape to the landscape. represents the resistance coefficient of landscape unit to spatial motion processes.
Cultivated land is the primary source of non-point source pollutants in Chongqing City’s Yongchuan District. Water pollution will eventually result from the leftover nitrogen and phosphorus compounds in farmed soil entering the water body through surface runoff. Water bodies are therefore regarded as the “sink” landscape in this study, while cultivated land is regarded as the “source” landscape.
2.3.2. Construction of the Resistance Base Surface
Selection of Environmental Impact Factors
The process of AGNPSP is continuous and dynamic. The complete pollution chain includes five key hydro-ecological processes: the rainfall process, the soil erosion process, the surface runoff process, the sediment transport process, and the pollutant migration and transformation process [39]. When these processes occur, they are subject to varying degrees of resistance from natural environmental factors such as soil, vegetation, terrain, and rainfall. Therefore, this study selected seven factors: relative elevation, slope, vegetation coverage, rainfall erosivity, surface roughness, topographic wetness index, and soil erosivity. These factors were chosen based on the characteristics of hilly and mountainous areas in Yongchuan District and previous research [30,31,32,40,41,42,43,44] (Table 1). The resistance base plane is established through the post-processing of remote sensing data using each resistance factor.

Table 1.
Indicator factors affecting AGNPSP in Yongchuan District.
In the indicator system, the risk of AGNPSP increases with increasing relative elevation because of the increased gravity on pollutants and less resistance they face during migration.
Slope is computed using the DEM. There is a lot of sloping farmland in hilly and mountainous regions, and the slope greatly affects how agricultural non-point source pollutants migrate. The likelihood of soil erosion, decreased resistance, and increased risk of AGNPSP increases with slope size.
High-vegetation-coverage landscape regions frequently have greater resistance levels, which can impede AGNPSP. The normalized difference vegetation index (NDVI) is employed in this study to represent the amount of vegetation. The NDVI is an important parameter reflecting the growth status and coverage of vegetation in remote sensing images. It is calculated through specific algorithms based on the differences in the reflection characteristics of vegetation in the red light and near-infrared bands [45], and the calculation formula is as follows:
where the NDVI is the normalized difference vegetation index. NIR is the reflectance value in the near-infrared band. R represents the reflectance value in the red light band.
The study employed the monthly rainfall model to compute the rainfall erosivity in the Chongqing region, which was reported by Shi et al. [46] based on artificially generated rainfall experiments. Rainfall erosivity is determined by the rainfall erosion model. In China, this paradigm is frequently in use [47].
where Ryear is the erosive force of rainfall (MJ mm hm−2 h−1 a−1). Pi is the monthly rainfall (mm). P is the annual rainfall (mm).
The Ryear value of each meteorological station was calculated based on the monthly rainfall model and the monthly rainfall data collected from 38 meteorological stations in various districts and counties of Chongqing. Using this calculation, the rainfall erosivity in Yongchuan District was determined and visualized. The research adopted the cooperative Kriging interpolation method for the spatial calculations, which were all completed using the spatial analysis tool in ArcGIS.
Using the Yongchuan District DEM data, the surface roughness is computed within the ArcGIS spatial analysis module. Pollutant movement and loss are impacted by surface roughness. The resistance increases with roughness and decreases with AGNPSP risk.
where C represents surface roughness and S represents slope (°).
The soil in the area can more easily become saturated and generate runoff at higher topographic wetness index values [48], which lowers resistance and increases susceptibility to AGNPSP.
Where CI is the topographic wetness index, α is the catchment area per unit contour length, and β is the local slope angle.
Based on Wu et al.’s research [49] in the Three Gorges Reservoir Area, soil erosivity is a quantitative indicator of soil erosion. The China Soil Database was used to extract the soil types in Yongchuan District, and the k values of the various soil types were computed.
Due to differences in the data values of various indicators, the natural breakpoint method is used to normalize the discrete grid values of each indicator when establishing the resistance baseline. These values are then divided into five levels (1, 3, 5, 7, and 9), which represent resistance values ranging from low to high for resistance analysis.
Determining Weights
Based on a review of the literature and an analysis of the regional topographic and geomorphic characteristics, it is evident that various natural factors contribute significantly to the risk of AGNPSP. The process of determining the weights takes into account the topographic characteristics of the hilly and mountainous study area, as well as the relative importance of each factor in soil erosion and pollutant migration processes.
Based on current research into environmental impact factors and their weights in China [30,31,32,40,41,42,43,44], particularly in hilly and mountainous areas (Table 2), this study summarizes the relevant literature on AGNPSP risk factors. It analyzes the relative importance of each evaluation factor in existing studies and focuses on the characteristics of the study area. Frequency statistics are used to comprehensively screen and assign weights to establish the initial weights. Considering the topographic and geomorphic characteristics of Yongchuan District—a hilly and mountainous area with significant terrain undulations and concentrated rainfall—it was analyzed that vegetation coverage, elevation, slope, and the rainfall process have the most significant impact on pollutant migration. The entropy weight method was therefore adopted to assign final weights to the selected factors, determining the weights of the seven factors in the natural factor resistance evaluation index system (Table 3).

Table 2.
Environmental impact factors and weights in related studies.

Table 3.
The weight of the resistance factor.
2.4. Risk Assessment of AGNPSP
In Yongchuan District, the sources of cultivated land are dispersed extensively. Based on the features of cultivated land, the study’s cultivated land source landscape was further divided into dry land sources and paddy field sources. Six major rivers in Yongchuan District and the Yangtze River’s main stream are used as the “sink” landscapes in this study since they eventually flow into the Yangtze River. The categories of “source” and “sink” were largely defined in earlier research. The source–sink landscape was analyzed in this study using a grading system based on their attributes. The source landscape was categorized using Wang et al.’s [30] research approach in order to guarantee the study’s logic and objectivity. A buffer zone encompassing the whole Yongchuan District was created around the “sink” (Figure 3), at an equal spacing of 2.2 km. Primary source, secondary source, tertiary source, and tertiary source are the four tiers of zones that were created on the farmed land (Figure 4).
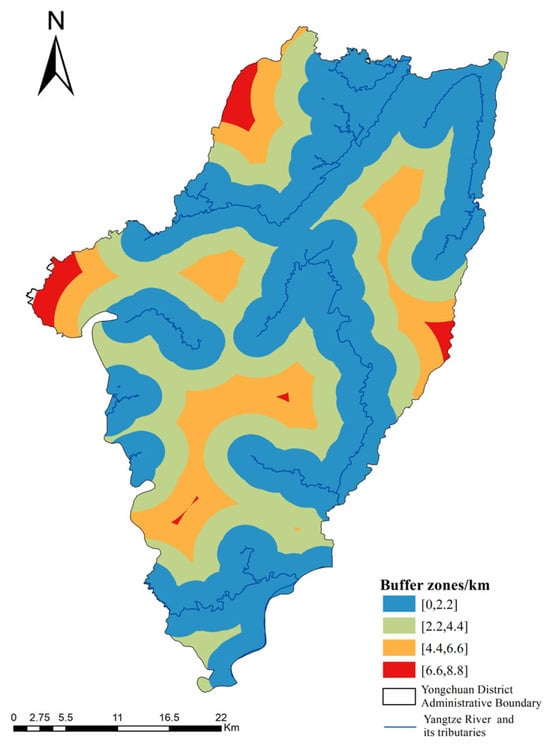
Figure 3.
Buffer grading.
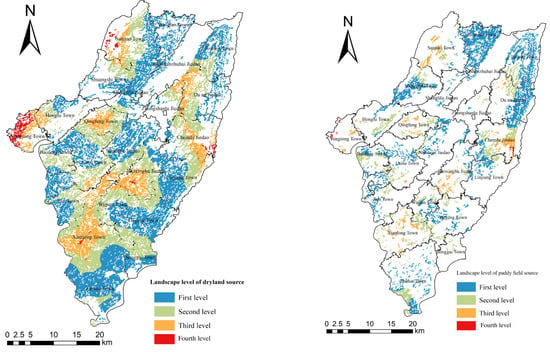
Figure 4.
Distribution of landscape levels of cultivated land sources.
In the end, a thorough study of the danger of AGNPSP occurrence in Yongchuan District is produced based on the resistance basis and natural factor resistance assessment index system developed in Section 2.3. The AGNPSP risk in Yongchuan District was divided into five levels using the natural breakpoint method: extremely high-risk area, high-risk area, medium-risk area, low-risk area, and extremely low-risk region. This allowed for a more intuitive risk evaluation.
The aforementioned analytical procedure is specifically used with the raster calculators, cost resistance tools, buffer tools, Con functions, and other features of the ArcGIS 10.4 software.
3. Results
3.1. Analysis of the Resistance Base and Minimum Resistance Surface
According to the landscape classification analysis of source and sink, there are differences in the spatial distribution of resistance surfaces at different levels (Figure 5). As can be seen from Figure 5A,E, the spatial distribution of the resistance surface of the first level dry land source landscape and the paddy field source landscape is consistent. Based on the characteristics of both, it can be concluded that the closer to the main river, the smaller the resistance face value, and the higher the risk of AGNPSP. Therefore, the distribution of primary source landscape resistance surface values shows a trend from low to high as the distance from the Yangtze River’s main stream and major rivers increases. The highest resistance values occur in the northern and western areas far from the main rivers. These areas include Sanjiao Town, Yongrong Town, Xianlong Town, Qingfeng Town, and parts of Weixing Lake Jiedao.
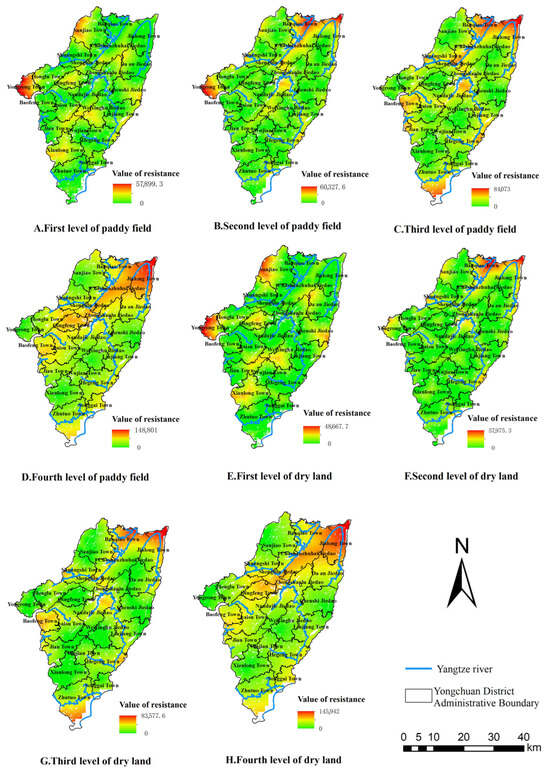
Figure 5.
Different levels of resistance surfaces for dry land sources and paddy field sources.
In Figure 5B,F, the spatial distribution of resistance surfaces in the landscapes of the second level dry land source and the second level paddy field source is evident, and it differs from that of the first level source. Yongrong Town, Jinlong Town, and Chashan Zhuhai Jiedao are the key locations with high secondary source resistance surface values. Yongrong Town has a higher concentration of high landscape resistance surface values for the dry land source than for the paddy field source.
It is evident from Figure 5C,G that the geographical arrangement the main rivers’ distribution is correlated with changes in the secondary source landscape’s resistance surface. With increasing distance from the main rivers, the tertiary source landscape’s resistance surface diminishes.
It is evident from Figure 5D,H that the resistance surface’s geographical distribution in the fourth level source landscape is comparable to that of the third level source landscape. However, the features are more pronounced, with the high-value area of the fourth level source resistance surface situated in Jinlong Town, the northeasternmost region of Yongchuan District, and stretching in a strip from the northeast to the southwest.
The Con function is used to choose the minimal resistance surface from various levels of sources, generating the final landscape resistance surfaces for dry land and paddy field sources, based on different levels of resistance surfaces for these sources (Figure 6). The high values of the landscape resistance surface in dry land sources are primarily found in Shuangshi Town, Honglu Town, Chashan Zhuhai Jiedao, and Zhongshan Road Jiedao, as shown by the analysis of Figure 6. The concentrated distribution of high resistance surface values in these areas can be explained by two factors: first, a small amount of cultivated land is present in some of these areas, which lowers the risk of AGNPSP; second, the majority of these areas are forested with high vegetation coverage, which inhibits surface source pollution. The highest value of paddy field source landscape resistance surface (23,739.8) is higher than that of dry land source landscape resistance surface (14,768.1). This suggests that contaminants are more likely to flow into rivers and that the source effect of AGNPSP, as represented by dry land sources, is stronger. The primary locations of the high values of the paddy field source landscape resistant surface are Chashan Zhuhai Jiedao, South Street Jiedao, Zhongshan Road Jiedao, Shengli Road Jiedao, and portions of Linjiang Town and Hegeng Town. The majority of these distribution areas are made up of forest and urban residential land, both of which are highly resistant to pollution from non-point sources in agriculture.
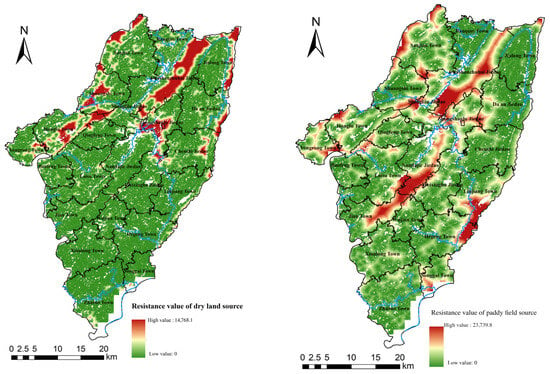
Figure 6.
Landscape resistance surface of dry land source and paddy field source in Yongchuan District.
3.2. Risk Assessment and Analysis of AGNPSP
The natural breakpoint approach is employed in Yongchuan District to categorize the risk level of AGNPSP based on the resistance surfaces of source landscapes that are dry land and source landscapes that are paddy fields. Yongchuan District should be divided into five levels (Figure 7). Because dry land is widely and densely distributed in Yongchuan District, which is next to other landscape blocks, it is evident that the spatial distribution of AGNPSP risk is similar to the spatial distribution of dry land source resistance. The ratio of high-risk to extremely high-risk locations is quite high. The area of extremely high-risk and high-risk areas accounts for 90% of the total area of the region. It can be seen that the AGNPSP situation in Yongchuan District is severe and needs attention.
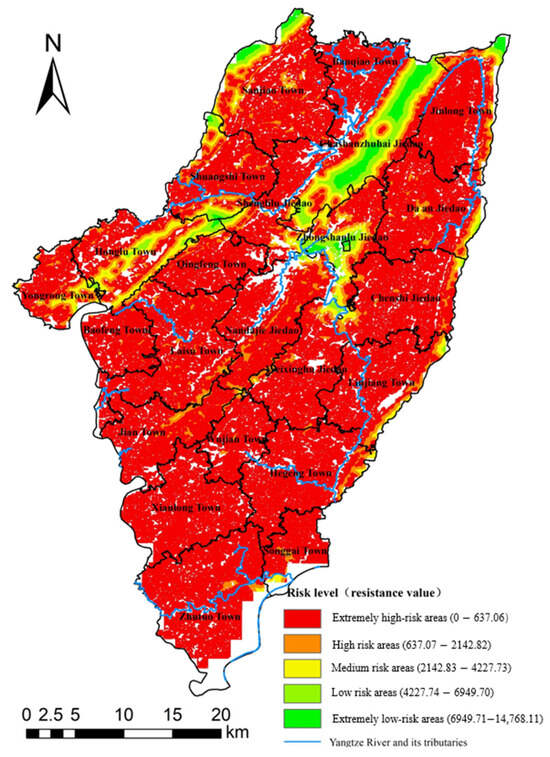
Figure 7.
Distribution map of AGNPSP source–sink risk in Yongchuan District.
Yongchuan District has a complicated and varied landscape, with five minor mountain ranges encircling the whole region in the pattern of a “Chuan” from north to south. Yunwu Mountain lies to the east, and Bayue Mountain and Yingshan Mountain to the west. It is directly cut by Jishan and Cucumber Mountains, which are primarily composed of low mountains and hills with sporadic terraces, mild slopes, and hills. Figure 6 shows that the majority of the high-risk locations in Yongchuan District are both extremely high-risk and high-risk. These areas mostly include the towns of Banqiao, Qingfeng, Baofeng, Laisu, Ji’an, Wujian, Hegeng, Xianlong, Zhutuo, and Songjiang. The reason for this is that Yongchuan District is a typical hilly region of Chongqing, featuring a large number of low mountains and hills, flat terrain that encourages the growth of agricultural fields, and a large portion of sloping farmland. It is also evident from the different land uses that Yongchuan District has a sizable expanse of dry land and paddy fields. Farmers will use large amounts of fertilizers and pesticides during the land development process in order to plant. This results in an excessive amount of nitrogen and phosphorus being produced by unscientific application, which enters water bodies through surface runoff and causes AGNPSP.
Additionally, Figure 7 analysis reveals that the areas with the lowest risk of AGNPSP are mainly mountainous regions and urban functional zones. One example is Chashan Zhuhai Jiedao, which forms the ecological backbone of Yongchuan District and is primarily made up of the Jishan Mountains. With a high vegetation coverage and a great biological habitat, the area is primarily forested. Zhongshan Road Jiedao is an urban functional area with limited distribution of arable land and less production of fertilizer and pesticide from agricultural activities, which hinders the migration of pollutants. The cultivated land area in the extremely low-risk area and the comparable low-risk area in the subdistricts and towns is comparatively modest, as can also be shown from the statistics of cultivated land area in various subdistricts and towns in Yongchuan District (Figure 8). In conclusion, the majority of non-point source contamination originates from sources on cultivated land. Analyzing the risk of AGNPSP occurrence and managing AGNPSP in Yongchuan District through prevention and control involves dividing the risk levels of AGNPSP.
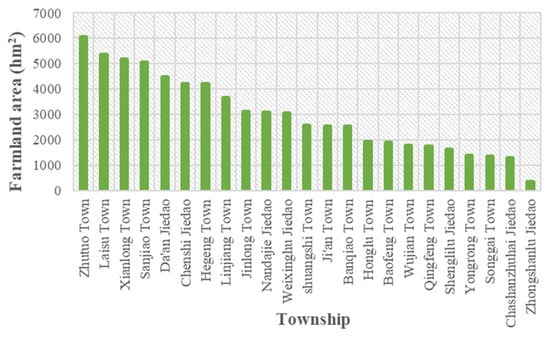
Figure 8.
Statistical chart of cultivated land area in various subdistricts and towns of Yongchuan District.
3.3. Contributions of the Environmental Factors and Risk Assessment Analysis
The spatial variations in relative height and slope are consistent, and the characteristic hilly and mountainous terrain in the study area determines the distribution of their high and low values, as can be observed from the distribution map of environmental factors impacting AGNPSP (Figure 9). Land use categories and vegetation coverage are closely connected. Arable land is the next most vegetated area after forested and grassland lands. Vegetation is least prevalent in residential areas. As a result, the risk of AGNPSP is minimal in regions with significant plant cover since pollutant transport is substantially impeded. There is a low in the northwest and a high in the southeast in terms of rainfall erosivity. The research area’s topography is also related to surface roughness and soil erosivity, although there is no clear pattern in the topographic wetness index’s geographic distribution.
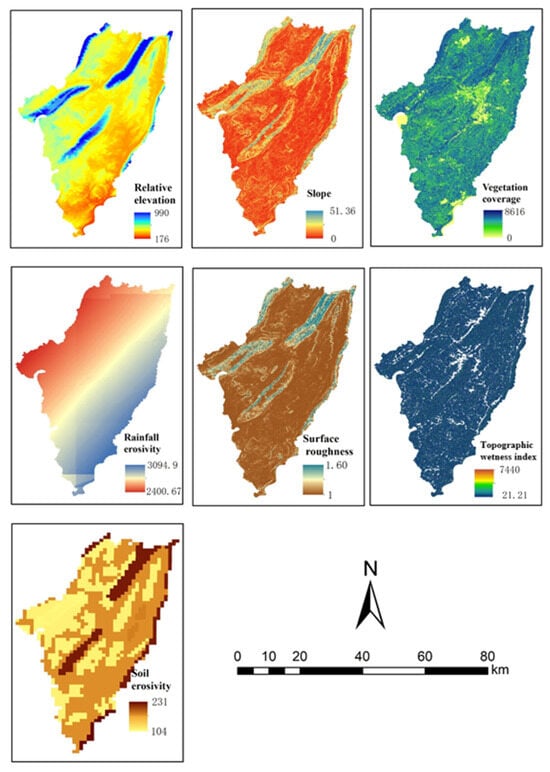
Figure 9.
Spatial Ddistribution of environment impact factors.
It can be inferred from a review of the literature and an examination of the study area’s topography features that different environmental factors contribute differently to the risk of AGNPSP. Quantitative weights are used to express the contribution; vegetation covering is given the largest weight, followed by soil erosivity, slope, topographic wetness index, surface roughness, and relative elevation. Different landscapes have different pattern characteristics and respond differently to the weights of resistance factors. There is no single best way to determine the weights; rather, there is an appropriate way to determine the weights for specific landscapes. Therefore, the weights assigned to each influencing element are determined by taking into account the features of the study area’s typical hilly and mountainous areas as well as the relative importance of each factor in the processes of pollution migration and soil erosion.
3.4. Relationship Between the Concentration of Cross-Sectional Non-Point Source Pollutants and the Risk Zone of AGNPSP
Typical cross-sectional monitoring sites were chosen to examine the relationship between pollutant concentration and risk area distribution based on the identification of the AGNPSP risk areas in Yongchuan District. One national controlled section, Zhutuo section, and two municipal controlled sections, Ciba section and Linjiang River plant section, were chosen for the study. Zhutuo section is situated near the Yangtze River’s main stream; Ciba section is situated in Hegeng Town, which has a higher risk level; and Hongjiang Zhaba is located in an urban residential area with a low risk level. The monitoring points of the cross-section are shown in Figure 10.
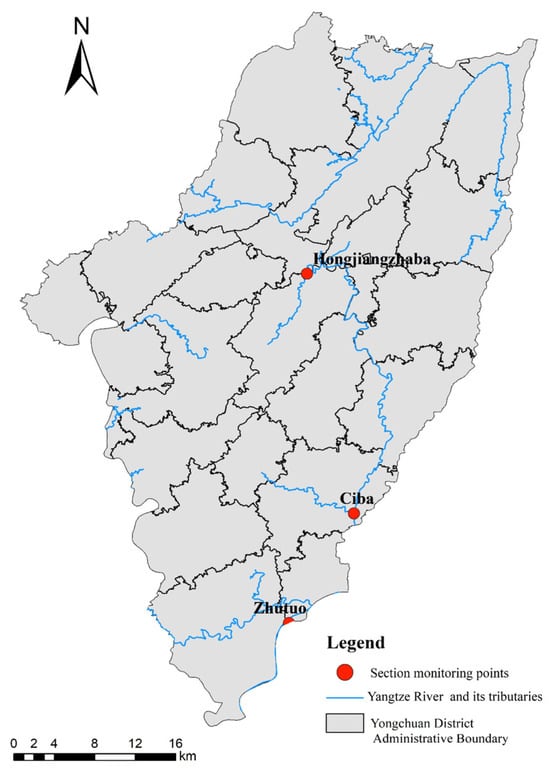
Figure 10.
Cross-sectional monitoring points map.
Figure 10 illustrates the results of sorting and analyzing the data on ammonia nitrogen and total phosphorus concentration of three sections obtained from the Ecological Environment Bureau of Yongchuan District in 2021 (Figure 11). It is clear that the three sections’ ammonia nitrogen levels remained within the Class III water standard during the year and did not surpass it. The Zhutuo portion has the fewest pollutants out of all of them, and in May and October, the water plant section has more pollutants than the Ciba section, but in all other months, it has less. The increased output of urban domestic sewage during holidays in May and October could be attributed to this phenomenon, or it could be the result of AGNPSP that lags behind. The distribution position of the cross-section shows a positive correlation between the risk level of AGNPSP and the ammonia nitrogen concentration. The Zhutuo section, which is close to the Yangtze River’s main stream, and the Hongjiangzhaba section in urban residential areas have low risk levels of AGNPSP and low concentrations of ammonia nitrogen; Hegeng Town, on the other hand, has higher concentrations of ammonia nitrogen and AGNPSP. Simultaneously, the three portions’ total phosphorus concentrations and ammonia nitrogen concentrations displayed the same pattern. In other words, the Ciba portion had the greatest total phosphorus concentration, and in May, it surpassed the Class III water requirement. The total phosphorus concentration also varied within the Class III water requirement during the flood season. Out of the three portions, the Zhutuo section has the lowest concentration of total phosphorus. In summary, the levels of ammonia nitrogen and total phosphorus in the typical sections are related to the risk levels of the corresponding sections. Consequently, the risk level of AGNPSP directly correlates with the pollutant concentrations measured in the sections. Furthermore, Yongchuan District’s total phosphorus pollution is a major non-point source of pollution, and its management and avoidance require extra care.

Figure 11.
Changes in ammonia nitrogen and total phosphorus concentrations at different cross-sections in 2021.
The aforementioned research shows that the AGNPSP risk areas identified using the method adopted in this study can respond effectively to changes in pollutant concentrations across the cross-section.
4. Discussion
The risk of AGNPSP is influenced by multiple natural environmental factors. The selection of scientific, rational, and appropriate factors, along with the determination of their respective contributions, constitutes the critical foundation for constructing the minimum cumulative resistance model. The fundamental premise of AGNPSP is that fertilizers which are not fully absorbed and utilized by crops, or livestock manure and domestic sewage which are not adequately treated, migrate and accumulate in rivers through the processes of soil erosion, rainfall, and sediment transport [50]. It is evident that natural environmental factors, including terrain, precipitation, flora, and soil, exert a significant influence on the AGNPSP process. In constructing the model for the minimum cumulative resistance surface, it is necessary to select factors with stronger significance. These factors should then be used to conduct the risk analysis of AGNPSP occurrence. Wang et al. [51] selected eight natural evaluation factors, including elevation, slope, pollution intensity, and distance from the road, based on the characteristics of light soil erosion and small grassland coverage in Chagan Lake. Wang et al. [52] selected seven resistance factors (i.e., elevation, slope, rainfall erosion force, and distance from water) for analysis of the upper reaches of the Yangtze River basin. These factors were selected based on the availability, operability, and comprehensiveness of the data. Xie et al. [53] conducted a coupled analysis of AGNPSP in the Hanjiang River Basin. This analysis was based on the migration and transformation laws of non-point source pollution. It used six resistance factors, including the normalized difference vegetation index, land use, and soil erosion. In this study, the selection of resistance factors was consistent with previous research. In light of the topographical, slope-related, and climatic characteristics of Yongchuan District, in conjunction with the accessibility and comprehensiveness of the data, a selection of seven natural environmental factors was deemed appropriate for consideration as resistance factors. These factors encompass the terrain elevation, terrain slope, NDVI, rainfall erosivity, surface roughness, topographic index, and soil erodibility. With regard to the determination of weight, an analysis of the topography and landform characteristics of Yongchuan District was also included in the integration of weights from previous studies, thus rendering the weight threshold more reasonable. Given that Yongchuan District is characterized by a predominantly hilly and mountainous topography, the employment of the minimum cumulative resistance model to analyze AGNPSP in such environments is deemed more suitable.
The application of the minimum cumulative resistance model and the analysis of pollutant concentration in cross-sections indicates that most areas of Yongchuan District fall into the extremely high-risk and high-risk categories for AGNPSP. Cultivated land continues to be the primary source of AGNPSP due to its severe AGNPSP. Therefore, the prevention and control of AGNPSP in Yongchuan District is of the utmost urgency. During the management process, it is necessary to strengthen zoning and classification management, prioritizing the treatment of high-risk areas.
A number of natural environmental factors affect the risk of AGNPSP. Building a minimum cumulative resistance model requires selecting realistic, scientific criteria and figuring out how much of each factor to include. Combining findings from earlier studies, the relevant elements (Table 2) mostly center on distance, vegetation, rainfall, terrain, and other factors. The seven parameters chosen for this study are consistent with those found in other studies, and their weighting is based on the features of the research area and the threshold range established in other studies, which makes their use appropriate. In the process of data processing, multi-source remote sensing data were combined and a model was constructed using post-processed vector data. The remote sensing data were then applied to identifying the risk of AGNPSP, thereby enriching the research data.
From the standpoint of landscape ecology, it has been discovered that the migration of agricultural non-point source pollutants is a process of migration from source to sink, in accordance with the source–sink theory. As a result, it is necessary to start preventing and controlling AGNPSP at the source end of the process. In Yongchuan District, agriculture cultivation continues to be the primary source of AGNPSP. Therefore, AGNPSP can be controlled at the source using techniques like optimizing irrigation techniques, adjusting farmland slope, using scientific fertilization, using pesticides rationally, and using soil testing formula technology in a reasonable manner. As a result, the study demonstrates that there is less chance of non-point source contamination in regions with a high plant cover. In order to intercept pollutants and prevent their passage into water bodies, ecological interception technology can be employed to create vegetation filter belts, ecological ditches, etc. Water bodies can then be treated using techniques like ecological purification pond technology and pre-storage technology [54,55,56,57,58,59]. Furthermore, a robust assessment and evaluation system is necessary to undertake realistic evaluations in order to carry out the prevention and control of AGNPSP. Measurement, tracing, computation, and treatment-based activities must be used to manage AGNPSP, consolidate efficacy, and support AGNPSP prevention and control.
5. Conclusions and Outlook
This study examines the cultivated land sources in Yongchuan District. It does this by using the minimum cumulative resistance model in the district and an understanding of AGNPSP. A resistance base was built by identifying seven natural elements that influence AGNPSP. The risk of AGNPSP in Yongchuan District was identified using the minimal cumulative resistance model. Simultaneously, an examination of correlation was carried out between the risk area and the concentration of contaminants in typical portions. The precise result is as follows:
(1) Based on previous studies and the characteristics of the study area, seven natural environmental factors affecting AGNPSP were selected for this study. These factors were relative elevation, slope, vegetation coverage, rainfall erosivity, surface roughness, topographic wetness index, and soil erosivity. An index system was then formed using these factors. A minimum cumulative resistance model was constructed using post-processed remote sensing vector data. According to the contribution degree of indicator factors, the weight of vegetation coverage is the highest (20%).
(2) Using the natural breakpoint method, the AGNPSP risks in Yongchuan District have been scientifically classified into five levels: extremely high-risk area, high-risk area, medium-risk area, low-risk area, and extremely low-risk area. Extremely high-risk and high-risk areas account for 90% of the district’s total area, mainly in the central and southern regions. The proportion of cultivated land in the affected towns and villages is high. These findings indicate that the AGNPSP situation in Yongchuan District is severe and that there is an urgent need to strengthen research into pollution mechanisms and prevention and control measures.
(3) Three typical monitoring stations were chosen for pollutant concentration data based on an analysis of AGNPSP risk area in Yongchuan District. The levels of ammonia nitrogen and total phosphorus in the typical sections are related to the risk levels of the corresponding sections. Consequently, the risk level of AGNPSP directly correlates with the pollutant concentrations measured in the sections. Total phosphorus is a major pollutant of AGNPSP in Yongchuan District. The concentration of pollutants in the section increases with the danger level of AGNPSP. Research-derived AGNPSP risk can adapt to variations in cross-sectional pollutant concentrations efficiently.
Lastly, recommendations are made for the prevention and management of AGNPSP in Yongchuan District based on the data analysis of this study. Preventing and controlling AGNPSP should prioritize treating high-risk areas, paying attention to zoned and classified management, and taking measures from source to end. Furthermore, the final assessment and evaluation should be based on the entire measurement, traceability, calculation, and treatment chain to consolidate achievements and promote the prevention and control of AGNPSP.
Furthermore, due to the absence and inadequacy of monitoring data, data will be collected and updated continuously in subsequent studies. A more detailed analysis of the risk pattern of AGNPSP and the migration of pollutants will be conducted by fully integrating multi-source, high-precision remote sensing data.
Author Contributions
Y.L.: methodology, writing—original draft, validation. G.D. and R.Y.: writing—review and editing, supervision. M.S.: writing—review and editing, validation. L.Z.: formal analysis. Y.Z.: writing—review and editing, data curation. Y.Y.: data curation. X.L.: conceptualization, methodology. All authors have read and agreed to the published version of the manuscript.
Funding
This research was supported by the National Key Research and Development Project of China (No. 2021YFC3201505).
Data Availability Statement
The data presented in this study are available on reasonable request from the corresponding author.
Conflicts of Interest
The authors declare no conflicts of interest.
References
- Zhu, K.W.; Cheng, Y.-C.; Yang, Z.-M.; Huang, L.; Zhang, S.; Lei, B. Research Trends of Agricultural Non-Point Source Pollution Risk Assessment Based on Bibliometric Method. J. Ecol. Rural Environ. 2020, 36, 425–432. [Google Scholar]
- Wen, Y.H.; Liu, K.X. Review of domestic and international pollution control measures. Beijing Water Aff. 2020, 2, 29–31. [Google Scholar]
- Dennis, L.; Corwin, K. Non-point Pollution Modeling Based on GIS. Soil Water Conserv. 1998, 1, 75–88. [Google Scholar]
- Wang, M.; Yang, S.G.; Geng, R. Analysis on Monitoring and Practices of Agricultural Non-point Source Pollution Control. China Environ. Monit. 2022, 38, 61–66. [Google Scholar]
- Lu, Y.R.; Wang, C.; Yang, R.; Sun, M.; Zhang, L.; Zhang, Y.; Li, X. Research on the Progress of Agricultural Non-Point Source Pollution Management in China: A Review. Sustainability 2023, 15, 13308. [Google Scholar] [CrossRef]
- Cheng, X.; Chen, L.D.; Sun, R.H.; Jing, Y.C. An Improved Export Coefficient Model to Estimate Non-Point Source Phosphorus Pollution Risks Under Complex Precipitation and Terrain Conditions. Environ. Sci. Pollut. Res. 2018, 25, 20946–20955. [Google Scholar] [CrossRef] [PubMed]
- Wang, B.Q.; Ma, Q.T. Research Status and Development Trends of Non-point Source Pollution Load Prediction. J. Xi’an Univ. Archit. Technol. 2010, 42, 717–722. [Google Scholar] [CrossRef]
- Han, L.; Liu, S.F.; Huang, M.S.; Ma, J.F.; Wei, J.B.; Hu, W. Research progress on watershed hydrological and water quality simulation based on HSPF model. J. East China Norm. Univ. 2015, 2, 9. [Google Scholar]
- Qin, P.; Lei, K.; KHU, S.T.; Qiao, F. Exploring the Characteristics of Urban Non point Source Pollution in China and Its Model Application. J. Environ. Eng. Technol. 2016, 4, 397–406. [Google Scholar]
- Basnyat, P.; Teeter, L.D.; Lockaby, B.G.; Flynn, K.M. The use of remote sensing and GIS in watershed level analyses of non-point source pollution problems. For. Ecol. Manag. 2000, 128, 65–73. [Google Scholar] [CrossRef]
- Lant, C.L.; Kraft, S.E.; Beaulieu, J.; Bennett, D.; Loftus, T.; Nicklow, J. Using GIS-based ecological-economic modeling to evaluate policies affecting agricultural watersheds. Ecol. Econ. 2005, 55, 467–484. [Google Scholar] [CrossRef]
- Choi, J.Y.; Engel, B.A.; Harbor, J. GIS and Web-based DSS for Preliminary TMDL Development. Water Eng. Res. 2003, 4, 19–30. [Google Scholar]
- Luzio, M.D.; Arnold, J.G.; Srinivasan, R. Effect of GIS data quality on small watershed stream flow and sediment simulations. Hydrol. Process. 2005, 19, 629–650. [Google Scholar] [CrossRef]
- Hanzlik, J.E. Locating turfgrass production sites for removal of phosphorus in Erath County, Texas. Master’s Thesis, Texas A and M University, College Station, TX, USA, 2003. [Google Scholar]
- Ning, S.K.; Jeng, K.-Y.; Chang, N.B. Evaluation of non-point sources pollution impacts by integrated 3S information technologies and GWLF modelling. Water Sci. Technol. 2002, 46, 217–224. [Google Scholar] [CrossRef] [PubMed]
- Williams, M.R.; Fisher, T.R.; Boynton, W.R.; Cerco, C.F.; Kemp, M.W.; Eshleman, K.N.; Kim, S.; Hood, R.R.; Fiscus, D.A.; Radcliffe, G.R. An integrated modelling system for management of the Patuxent River estuary and basin, Maryland, USA. Int. J. Remote Sens. 2006, 27, 3705–3726. [Google Scholar] [CrossRef]
- Liang, L.N.; Zhao, Y.H.; Wu, J.J.; Wei, D.; Jin, L.; Xu, S.; Wang, L. Research progress and frontier analysis of agricultural non-point source pollution based on Citespace at home and abroad. China Agric. Resour. Zoning 2023, 4, 99–112. [Google Scholar]
- Wu, Y.Y.; Xi, X.; Tang, X.; Luo, D.; Gu, B.; Lam, S.K.; Vitousek, P.M.; Chen, D. Policy distortions, farm size, and the overuse of agricultural chemicals in China. Proc. Natl. Acad. Sci. USA 2018, 115, 7010–7015. [Google Scholar] [CrossRef] [PubMed]
- Liu, J.C.; Yan, Y.; Liu, F.; Ding, D.; Zhao, M. Risk assessment and safety evaluation using system normative indexes integration method for non-point source pollution on watershed scale. Environ. Sci. 2008, 29, 599–606. [Google Scholar] [CrossRef] [PubMed]
- Jing, Y.D.; Zhang, H.M. Risk assessment of non-point source pollution output in Nansihu Lake Basin based on LUCC. J. Nat. Resour. 2019, 34, 128–139. [Google Scholar]
- Feng, A.P.; Wang, X.-L.; Xu, Y.; Huang, L.; Wu, C.-Q.; Wang, C.-Z.; Wang, H.-L. Potential risk assessment of non-point source pollution in the Haihe River Basin based on the DPeRS model. Environ. Sci. 2020, 41, 4555–4563. [Google Scholar] [CrossRef]
- Berka, C.; Schreier, H.; Hall, K. Linking Water Quality with Agricultural Intensification in a Rural Watershed. Water Air Soil Pollut. 2001, 127, 389–401. [Google Scholar] [CrossRef]
- Potter, K.M.; Cubbage, F.W.; Blank, G.B. A Watershed Scale Model for Predicting Nonpoint Pollution Risk in North Carolina. Environ. Manag. 2004, 34, 62–74. [Google Scholar]
- Vazquez-Amabile, G.; Engel, B.A.; Flanagan, D.C. Modeling and Risk Analysis of Nonpoint-Source Pollution Caused by Atrazine Using Swat. Trans. ASABE 2006, 49, 667–678. [Google Scholar] [CrossRef]
- Song, Y.J.; Liu, Y.M.; Yang, J.; Mo, M.H.; Zhang, L.C. Risk assessment of non-point source phosphorus pollution in agricultural land in the Yellow River Basin. Technol. Rev. 2010, 28, 66–71. [Google Scholar]
- Ding, E.J.; Xie, D.T.; Wei, C.F.; Ni, J.P. Risk assessment of agricultural non-point source pollution in the Chongqing section of the Three Gorges Reservoir Area based on the MUSLE model. J. Southwest Univ. 2010, 32, 96–101. [Google Scholar]
- Wang, J.L.; Xie, D.T.; Ni, J.P.; Shao, J.A. Identification of soil erosion risk patterns in a watershed based on source-sink landscape units. Acta Ecol. Sin. 2017, 37, 8216–8226. [Google Scholar][Green Version]
- Wang, J.L.; Tan, S.J.; Li, M.B.; Ni, J.P.; Zhou, B.J. Research progress in source-sink landscape pattern analysis based on non-point source pollution processes in watersheds. Chin. J. Eco-Agric. 2023, 31, 1657–1667. [Google Scholar][Green Version]
- Sun, R.H.; Chen, L.D.; Wang, W. Evaluation of total nitrogen loss in the Haihe River Basin based on the "source" and "sink" landscape pattern index. Environ. Sci. 2012, 33, 1784–1788. [Google Scholar][Green Version]
- Wang, J.L.; Xie, D.T.; Shao, J.A.; Ni, J.P.; Lei, P. Identification of source-sink risk pattern of agricultural non-point source pollution in cultivated land in Three Gorge Reservoir Area based on accumulative minimum resistance model. Trans. Chin. Soc. Agric. Eng. 2016, 32, 206–215. [Google Scholar] [CrossRef]
- Liu, F.; Xie, D.T.; Wang, S. Evaluation of Source sink risk pattern of non-point source pollution in farmland based on the minimum cumulative resistance model: A case study of Beibei District, Chongqing. Jiangsu Agric. Sci. 2018, 46, 253–259. [Google Scholar] [CrossRef]
- Dong, Y.K.; Wang, Y.; Zeng, W.J. Analyzing ”source-sink ”psttern of NPS pollution risks in upper reaches od Erhai Lake basin by minimum cumulative resisitance model. Bull. Soil Water Conserv. 2022, 42, 166–175. [Google Scholar]
- Zhao, J.; Ji, Y.; Liu, Y.; Liu, Q.L.; Bai, J.; Song, Y.H. Current Situation, Problems and Countermeasures of Agricultural Non-point Source Pollution in the Yangtze River Basin. Environ. Prot. 2022, 50, 30–32. [Google Scholar] [CrossRef]
- Chen, L.D.; Fu, B.J.; Zhao, W.W. The theory of "source" and "sink" landscape and its ecological significance. J. Ecol. 2006, 5, 1444–1449. [Google Scholar] [CrossRef]
- Xu, S.L.; Zhou, H. Dynamic characteristics and quantitative methods of landscape “source and sink”. Soil Water Conserv. Res. 2008, 15, 64–67. [Google Scholar]
- Knaapen, J.P.; Scheffer, M.; Harms, B. Estimating habitat isolation in landscape planning. Landsc. Urban Plan. 1992, 23, 10–16. [Google Scholar] [CrossRef]
- Ye, Y.Y.; Su, Y.X.; Zhang, H.O.; Liu, K.; Wu, Q. Construction of an ecological resistance surface model and its application in urban expansion simulations. J. Geogr. Sci. 2015, 25, 211–224. [Google Scholar] [CrossRef]
- Greenberg, J.A.; Rueda, C.; Hestir, E.L.; Santos, M.J.; Ustin, S.L. Least cost distanceanalysis for spatial interpolation. Comput. Geosci. 2011, 37, 272–276. [Google Scholar]
- Hao, F.H.; Cheng, H.G. Non-point Source Pollution Models: Theoretical Methods and Applications; China Environmental Science Press: Beijing, China, 2006. [Google Scholar]
- Chen, C.D.; Wu, S.J.; Meurk, C.D.; Lv, M.Q.; Wen, Z.F.; Jiang, Y.; Chen, J.L. The impact of resistance assignment on landscape connectivity simulation. J. Ecol. 2015, 22, 7367–7376. [Google Scholar]
- Zhu, K.W.; Chen, Y.C.; Zhang, S. Identification and prevention of agricultural non-point source pollution risk based on the minimum cumulative resistance model. Glob. Ecol. Conserv. 2020, 23, e01149. [Google Scholar] [CrossRef]
- Chen, Q.; Huang, R.; Li, J.R.; Liu, B.C. Risk assessment of brown ground source pollution in Chengdu based on the “source sink” theory. Green Technol. 2022, 24, 145–149. [Google Scholar]
- Guo, X.; Tankpa, V.; Wang, L.; Ma, F.; Wang, Y. Framework of multi-level regionalization schemes based on non-point source pollution to advance the environmental management of small watersheds. Environ. Sci. Pollut. Res. 2021, 28, 31122–31137. [Google Scholar] [CrossRef] [PubMed]
- Xu, J.F.; Jia, H.Y.; Xin, X.K. Risk identification of non-point source pollution in Danjiangkou water source area based on the minimum cumulative re-sistance model. In Proceedings of the 2020 Academic Annual Meeting of the Chinese Water Resources Society, Beijing China, 18 October 2020. [Google Scholar]
- Li, M.Z.; Han, D.H.; Wang, X. Spectral Analysis Technology and Its Applications; Science Press: Beijing, China, 2006. [Google Scholar]
- Shi, D.M.; Jiang, D.; Lu, X.P. Time distribution characteristics of rainfall erosivity in Fuling District, Chongqing. J. Agric. Eng. 2008, 24, 16–21. [Google Scholar]
- Huang, C.; Hou, X.; Li, H. An improved minimum cumulative resistance model for risk assessment of agricultural non-point source pollution in the coastal zone. Environ. Pollut. 2022, 312, 120036. [Google Scholar] [CrossRef] [PubMed]
- Beven, K.J.; Kirkby, M.J. A physical based variable contributing area model of basin hydrology. Hydrol. Sci. Bull. 1979, 24, 43–69. [Google Scholar] [CrossRef]
- Wu, C.G.; Zeng, Y.; Zhou, Z.X. Study on the K value of soil erodibility in the Three Gorges Reservoir Area. Chin. J. Soil Water Conserv. 2010, 8, 8–12. [Google Scholar]
- Yu, D.; Dong, X.; Gao, S.; Jiang, Y.; Wei, C.; Peng, T.; Liu, J. Evaluation of nitrogen non-point source pollution risk in the Huaihe River Basinbased on an improved minimum cumulative resistance model. Trans. Chin. Soc. Agric. Eng. 2024, 40, 226–235. [Google Scholar]
- Wang, Q.; Wei, L.; Han, Y.; Shi, N.; Xiao, N. Risk Identification and Control of Non-Point Sources Pollution in Chagan LakeCatchment Area. Res. Environ. Sci. 2020, 33, 2074–2083. [Google Scholar]
- Wang, J.; Fu, Z.; Qiao, H.; Bi, Y.; Liu, F. Identifying the Spatial Risk Patterns of Agricultural Non-Point Source Pollution in a Basin of the Upper Yangtze River. Agronomy 2023, 13, 2776. [Google Scholar] [CrossRef]
- Xie, W.; Li, J.; Liu, Y.; Peng, K.; Zhang, K. Evaluation of ecological buffer zone based on landscape pattern for non-point source pollution control: A case study in Hanjiang River basin, China. J. Hydrol. 2023, 626, 130341. [Google Scholar] [CrossRef]
- Zhu, J.; Zeng, Y.; Chen, J.; Zhang, R. Research progress on agricultural non-point source pollution control technology in China. Sichuan Environ. 2014, 33, 153–161. [Google Scholar] [CrossRef]
- Yi, X.; Lin, D.; Li, J.; Zeng, J.; Wang, D.; Yang, F. Ecological treatment technology for agricultural non-point source pollution in remote rural areas of China. Environ. Sci. Pollut. Res. 2021, 28, 40075–40087. [Google Scholar] [CrossRef] [PubMed]
- Wu, S.; Bashir, M.A.; Raza, Q.-U.-A.; Rehim, A.; Geng, Y.; Cao, L. Application of riparian buffer zone in agricultural non-point source pollution control—A review. Front. Sustain. Food Syst. 2023, 7, 64. [Google Scholar] [CrossRef]
- Zhou, L.; Li, L.; Huang, J. The river chief system and agricultural non-point source water pollution control in China. J. Integr. Agric. 2021, 20, 1382–1395. [Google Scholar] [CrossRef]
- Zou, L.; Liu, Y.; Wang, Y.; Hu, X. Assessment and analysis of agricultural non-point source pollution loads in China: 1978–2017. Environ. Manag. 2021, 263, 110400. [Google Scholar] [CrossRef] [PubMed]
- Wang, G.; Li, J.; Sun, W.; Xue, B.; A, Y.; Liu, T. Non-point source pollution risks in a drinking water protection zone based on remote sensing data embedded within a nutrient budget model. Water Res. 2019, 157, 238–246. [Google Scholar] [CrossRef] [PubMed]
Disclaimer/Publisher’s Note: The statements, opinions and data contained in all publications are solely those of the individual author(s) and contributor(s) and not of MDPI and/or the editor(s). MDPI and/or the editor(s) disclaim responsibility for any injury to people or property resulting from any ideas, methods, instructions or products referred to in the content. |
© 2025 by the authors. Licensee MDPI, Basel, Switzerland. This article is an open access article distributed under the terms and conditions of the Creative Commons Attribution (CC BY) license (https://creativecommons.org/licenses/by/4.0/).