Article

Mesoscale Analysis and Numerical Simulation of an Extreme Precipitation Event on the Northern Slope of the Middle Kunlun Mountains in Xinjiang, China

1
Institute of Desert Meteorology, China Meteorological Administration, Urumqi 830002, China
2
State Key Laboratory of Severe Weather, Chinese Academy of Meteorological Sciences, Beijing 100081, China
3
Xinjiang Key Laboratory of Desert Meteorology and Sandstorm, Urumqi 830002, China
4
Xinjiang Meteorological Observatory, Urumqi 830002, China
5
Key Laboratory of Ecological Safety and Ustainable Development in Arid Lands, Xinjiang Institute of Ecology and Geography, Chinese Academy of Sciences, Urumqi 830011, China
6
Xinjiang Climate Center, Urumqi 830002, China
*
Author to whom correspondence should be addressed.
Remote Sens. 2025, 17(14), 2519; https://doi.org/10.3390/rs17142519 (registering DOI)
Submission received: 14 May 2025 / Revised: 14 July 2025 / Accepted: 16 July 2025 / Published: 19 July 2025

Abstract

Under accelerating global warming, the northern slope of the Middle Kunlun Mountains in Xinjiang, China, has seen a marked rise in extreme rainfall, posing increasing challenges for flood risk management and water resources. To improve our predictive capabilities and deepen our understanding of the driving mechanisms, we combine the European Centre for Medium-Range Weather Forecasts Reanalysis-5 (ERA5) reanalysis, regional observations, and high-resolution Weather Research and Forecasting model (WRF) simulations to dissect the 14–17 June 2021, extreme rainfall event. A deep Siberia–Central Asia trough and nascent Central Asian vortex established a coupled upper- and low-level jet configuration that amplified large-scale ascent. Embedded shortwaves funnelled abundant moisture into the orographic basin, where strong low-level moisture convergence and vigorous warm-sector updrafts triggered and sustained deep convection. WRF reasonably replicated observed wind shear and radar echoes, revealing the descent of a mid-level jet into an ultra-low-level jet that provided a mesoscale engine for storm intensification. Momentum–budget diagnostics underscore the role of meridional momentum transport along sloping terrain in reinforcing low-level convergence and shear. Together, these synoptic-to-mesoscale interactions and moisture dynamics led to this landmark extreme-precipitation event.

1. Introduction

Rainstorms and heavy rainfall are among the most significant meteorological disasters during summer in China [1]. Affected by monsoon climate, geographical location and topographic conditions, rainstorm events occur frequently in China and exhibit distinct regional characteristics. The Kunlun Mountains lie adjacent to the Tarim Basin in southern Xinjiang (XJ) to the north, the northern Tibetan Plateau to the south, and the Pamir Plateau to the west (Figure 1). The northern plain of this mountain range is located deep inland and far from the ocean, with limited water availability and an average annual precipitation of only 25.0–50.0 mm, making it a typical inland arid area [2]. Some studies have shown that, in the context of global warming, the number of rainstorm days and the intensity of rainstorm in southern XJ show a significant increasing trend [3,4,5,6], and the precipitation climate characteristics of the precipitation region on the north slope of the Kunlun Mountains have three main features: First, the concentration of heavy rain is high, mainly concentrated in summer, and the summer precipitation accounts for 54.4% of the annual precipitation. Second, heavy rain occurs less frequently, but with greater intensity, shorter duration, and stronger extremity. Short-term heavy rainfall and downpours mainly occur in July. Third, the rainstorm distribution is extremely uneven. Affected by terrain, heavy rain is mainly distributed in mountainous areas [7,8]. Research in the past decade has also indicated a rise in the amount of precipitation and an increase in rainstorm frequency in southern XJ [7,8,9,10,11]. For instance, in mid-to-late June 2014, persistent local rainstorms were observed around the Tarim Basin in southern XJ, with Yutian County in Hotan Prefecture recording over 120 mm of accumulated precipitation. Similarly, from 24 to 28 June 2019, 54 meteorological stations in Hotan, Bazhou, and the surrounding areas experienced precipitation at the level of rainstorm, with the Hotan station witnessing a record-breaking daily rainfall of 27.7 mm [8]. The southern XJ region, located in the hinterland of Asia and Europe, is highly sensitive to climate change. Its fragile ecosystem and sparse vegetation make this region particularly vulnerable to rainstorm-induced disasters, such as urban waterlogging, landslides, and mudflows. These disasters not only disrupt local industrial and agricultural production, but also threaten lives and property, resulting in severe social and economic consequences [12,13,14,15,16]. Furthermore, the sudden and unpredictable nature of rainstorms in southern XJ poses great challenges for disaster prevention and mitigation. Therefore, understanding the occurrence and development mechanisms of rainstorms in this region is of paramount importance [17].
Over the years, numerous scholars have focused on rainstorms in southern XJ. Numerous studies have pointed out that, in the context of global warming, the increase in both precipitation and temperature in this region is greater than the national average, where the increase in precipitation is mainly attributed to the increase in extreme and short-term convective precipitation [18,19,20,21]. Chen et al. [22] found that the increase in precipitation in southern XJ is related to water vapour transport and circulation modulation. Yang et al. [23] and Lu et al. [24] suggested that the precipitation increase in southern XJ is due to the southward subtropical westerly jet stream and the strong meridional circulation at 500 hPa. Water vapour from the Arabian Sea and the western Pacific is transported into southern XJ from both sides of the Tibetan Plateau. Through analyses of summer heavy rainfall events in southern XJ, some scholars have identified the associated circulation patterns and environmental parameters [2,13,25,26,27,28]. Their results indicate that the 100 hPa South Asian high exhibits a bimodal structure, and the subtropical trough deepens. Meanwhile, the 500 hPa Tashkent vortex and the low trough near Lake Baikal constitute an “east–west” confrontation situation, and a strong upper-level divergence zone overlaps with a strong cyclonic convergence zone in front of the low-level easterly jet over the heavy rainstorm area. The low-level westerly flow and easterly jet are conducive to the convergence of water vapour into the rainstorm area, thereby triggering severe convective weather. Using cloud images, radar data, and ground intensified-wind field data, Zeng et al. [28], Liu et al. [29], and Tang et al. [17] identified the meso- and small-scale characteristics of heavy precipitation in southern XJ. Their findings highlight that ground convergence lines serve as an important triggering factor, and the characteristics of radar echoes are indicative of the occurrence and development of mesoscale convection. Xie et al. [30] summarized previous studies on precipitation in XJ and suggested that further efforts should focus on studying water vapour transport, the influence of meso- and small-scale processes, and orographic effects on precipitation. They also emphasized the importance of enhancing the application of meteorological data from radar, satellites, and automatic weather stations. Some scholars used the backward trajectory analysis and sounding data to investigate variations in water vapour and environmental conditions during rainstorm processes [31,32,33,34,35]. Additionally, the triggering and intensity of rainstorms are related to the effect of orographic uplift [36,37,38]. Numerical simulations demonstrated that terrain primarily influences precipitation in its intensity and spatial distribution [39]. These conclusions have been confirmed by numerical simulations of rainstorms in North China by Liao et al. [40], in western China by Liu et al. [41], and along the Meiyu front by Xiong et al. [42]. Similar findings were reported by Liu et al. [43] and Ding et al. [44] through statistical analyses of orographic precipitation, indicating the positive contribution of terrain to precipitation intensity. Regarding orographic precipitation in XJ, Ma et al. [45] pointed out that rainstorm-prone areas are mainly distributed near mountainous terrain, confirming the important role of terrain in triggering such events.
The above findings provide valuable insights into the occurrence and development mechanisms of extreme rainstorms under the unique topographic conditions of XJ. However, previous studies mainly focused on the climatic characteristics, circulation background, water vapour transport, and formation mechanisms of rainstorms in southern XJ [2,5,7,10,12,17,21]. In contrast, relatively few studies have investigated rainstorms on the northern slope of the middle Kunlun Mountains using a mesoscale numerical model simulation analysis. Furthermore, due to the special topography of XJ, there are substantial differences in precipitation (such as water vapour source, precipitation volume, precipitation frequency, precipitation hourly intensity, precipitation duration, etc.) between northern and southern XJ [7,8], highlighting the need for detailed case studies. To this end, this paper investigates an extreme precipitation event that occurred on the northern slope of the middle Kunlun Mountains from 14 to 17 June 2021. It was characterized by a large range, a large number of rainstorm stations, a long duration, a large cumulative rainfall, and strong extremity. On June 16th, the daily precipitation in Luopu County (74.1 mm), Moyu County (59.6 mm), and Hotan City (56.0 mm) all broke the historical extreme values held since the establishment of the stations and exceeded their annual average precipitation. Among them, the daily precipitation in Luopu County on June 16th was 1.7 times the annual average precipitation of the station. The cumulative precipitation during the process in Pishan County reached 80.5 mm, breaking the summer precipitation record since held the establishment of the station and also exceeding the annual average precipitation. More than 56% of the automatic meteorological stations in Hotan Prefecture experienced heavy rain, marking the first time that a large-scale heavy rain was simultaneously monitored. Based on precipitation observation data, the European Centre for Medium-Range Weather Forecasts Reanalysis-5 (ERA5) [46] data, and the Weather Research and Forecasting model (WRF) [47], this paper conducts a numerical simulation of this event to examine the circulation background and analyze the factors affecting the occurrence and development of this heavy precipitation, with the aim of deepening our understanding of the extreme precipitation processes on the northern slope of the middle Kunlun Mountains.
The remainder of this paper is organized as follows: Section 2 introduces the data used in this study. The results are analyzed in Section 3. Section 4 is the discussion part. Finally, Section 5 presents the main conclusions.

2. Data

2.1. Datasets

This study uses hourly precipitation data from meteorological stations in southern XJ to analyze the actual precipitation situation, which is obtained from the meteorological big data cloud platform Tianqing developed by the National Meteorological Information Center [48]. The characteristics of this rainstorm process, such as large-scale circulation background, mesoscale systems, and water vapour transport, are examined by using the ERA5 reanalysis data, which provides hourly outputs at a horizontal resolution of 0.25° × 0.25° [46]. The initial field data required for the WRF simulation are also derived from the ERA5 reanalysis data [46]. For the WRF model, the assimilated data are mainly composed of conventional observations, radiosonde data, aircraft reports, Global Positioning System Zenith Total Delay data, and radar data from 11 stations in XJ. The performance of the WRF simulation is evaluated by using station-based precipitation data and sounding data from Hotan station, both of which are accessed via the Tianqing platform [48,49].

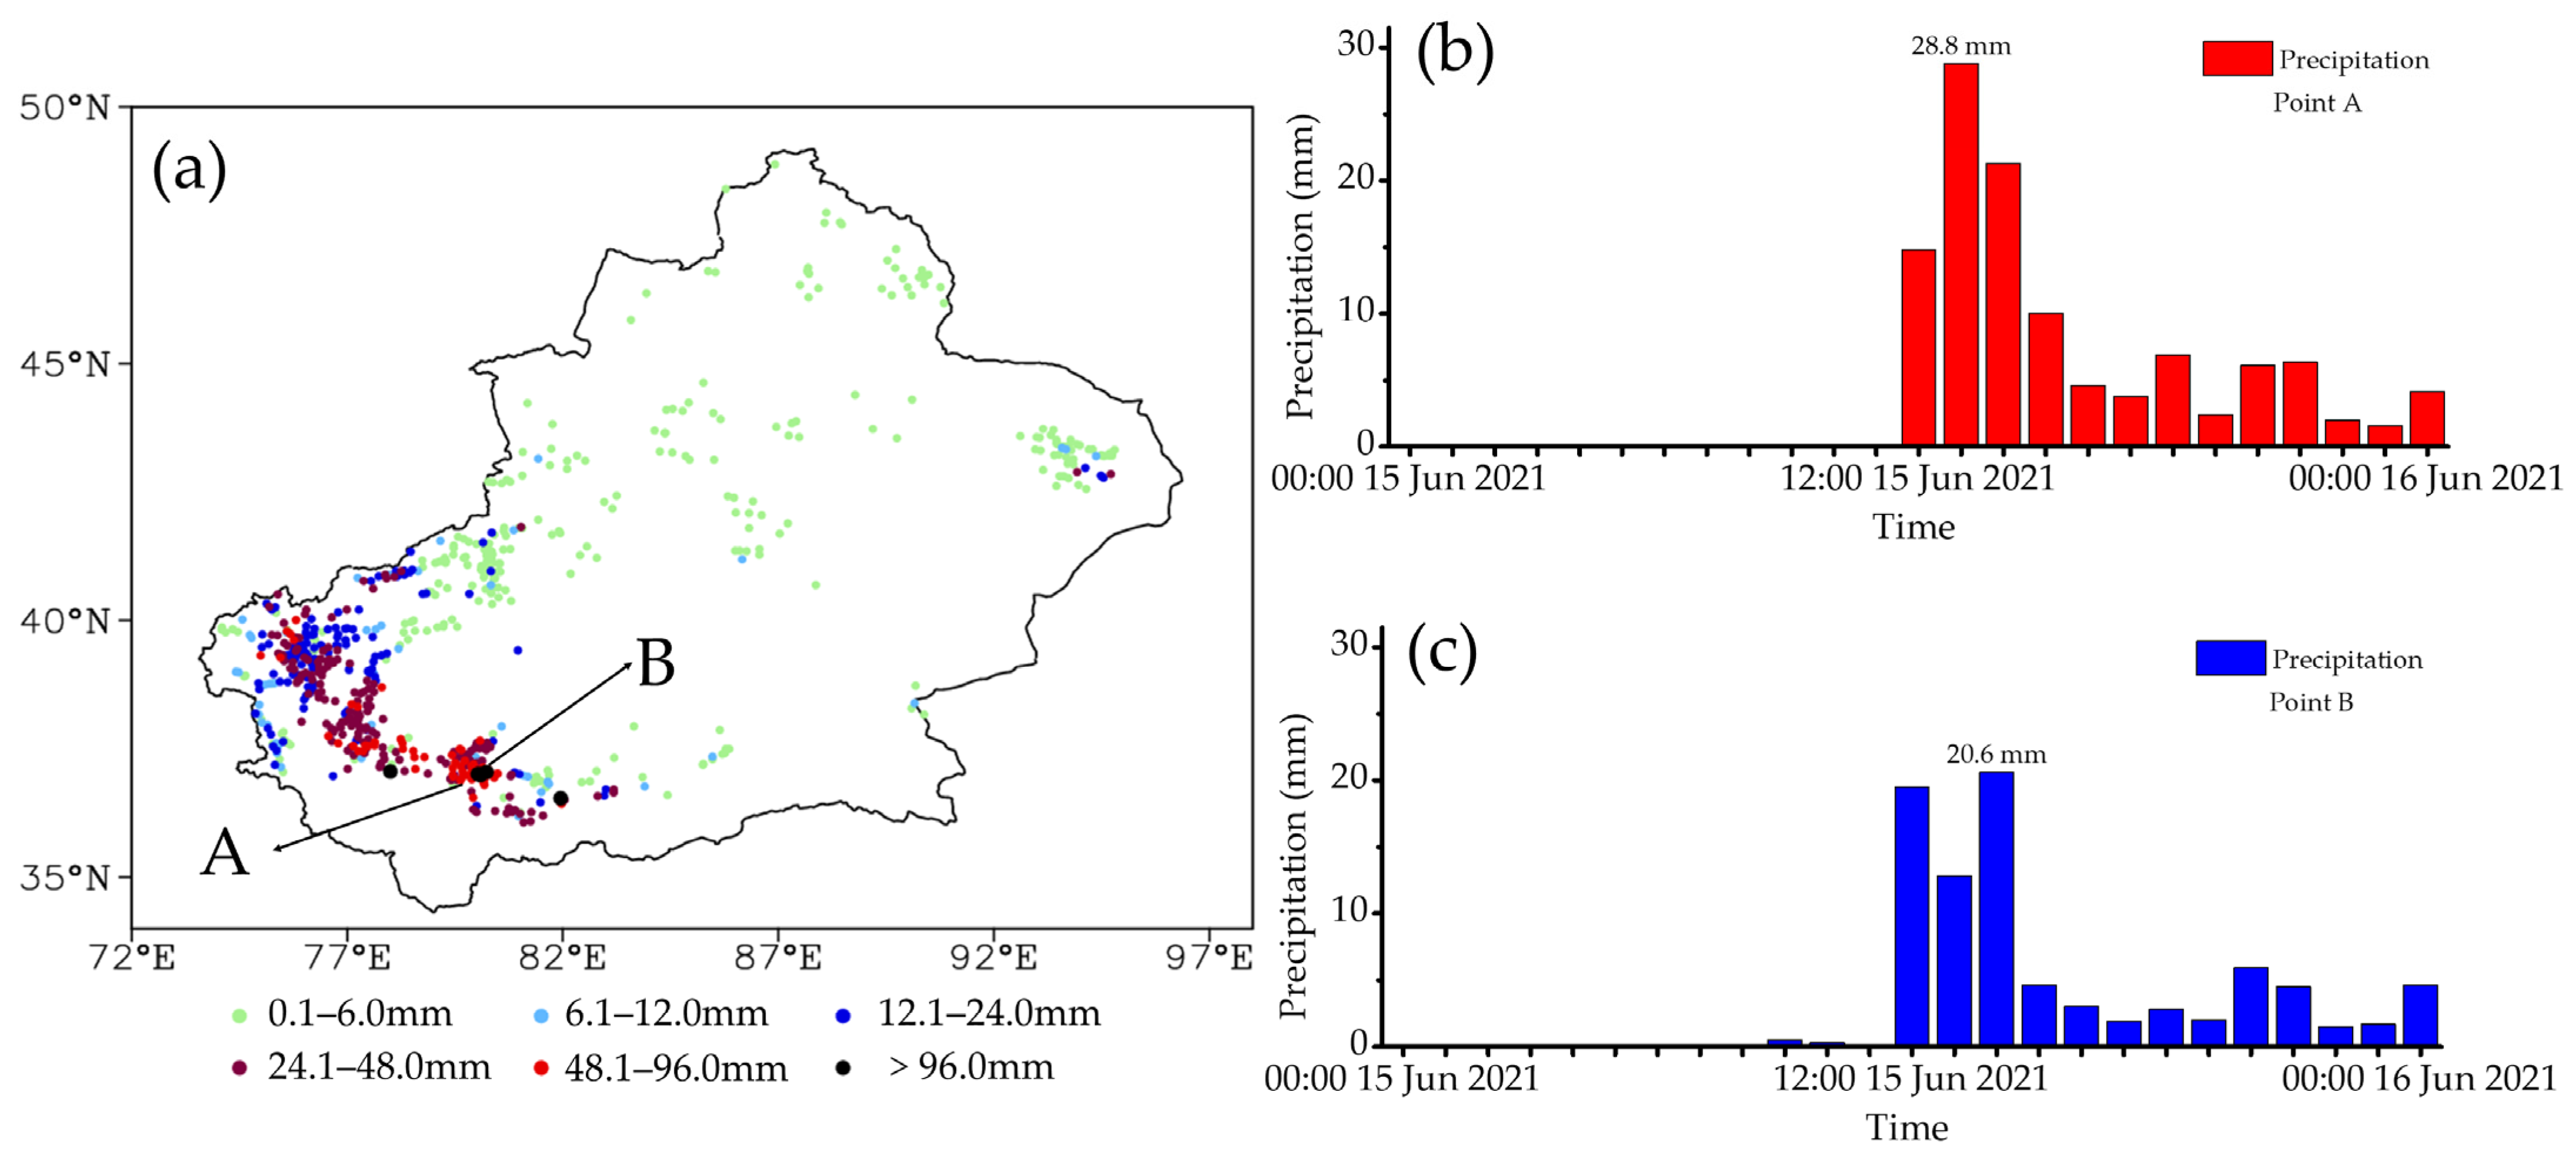
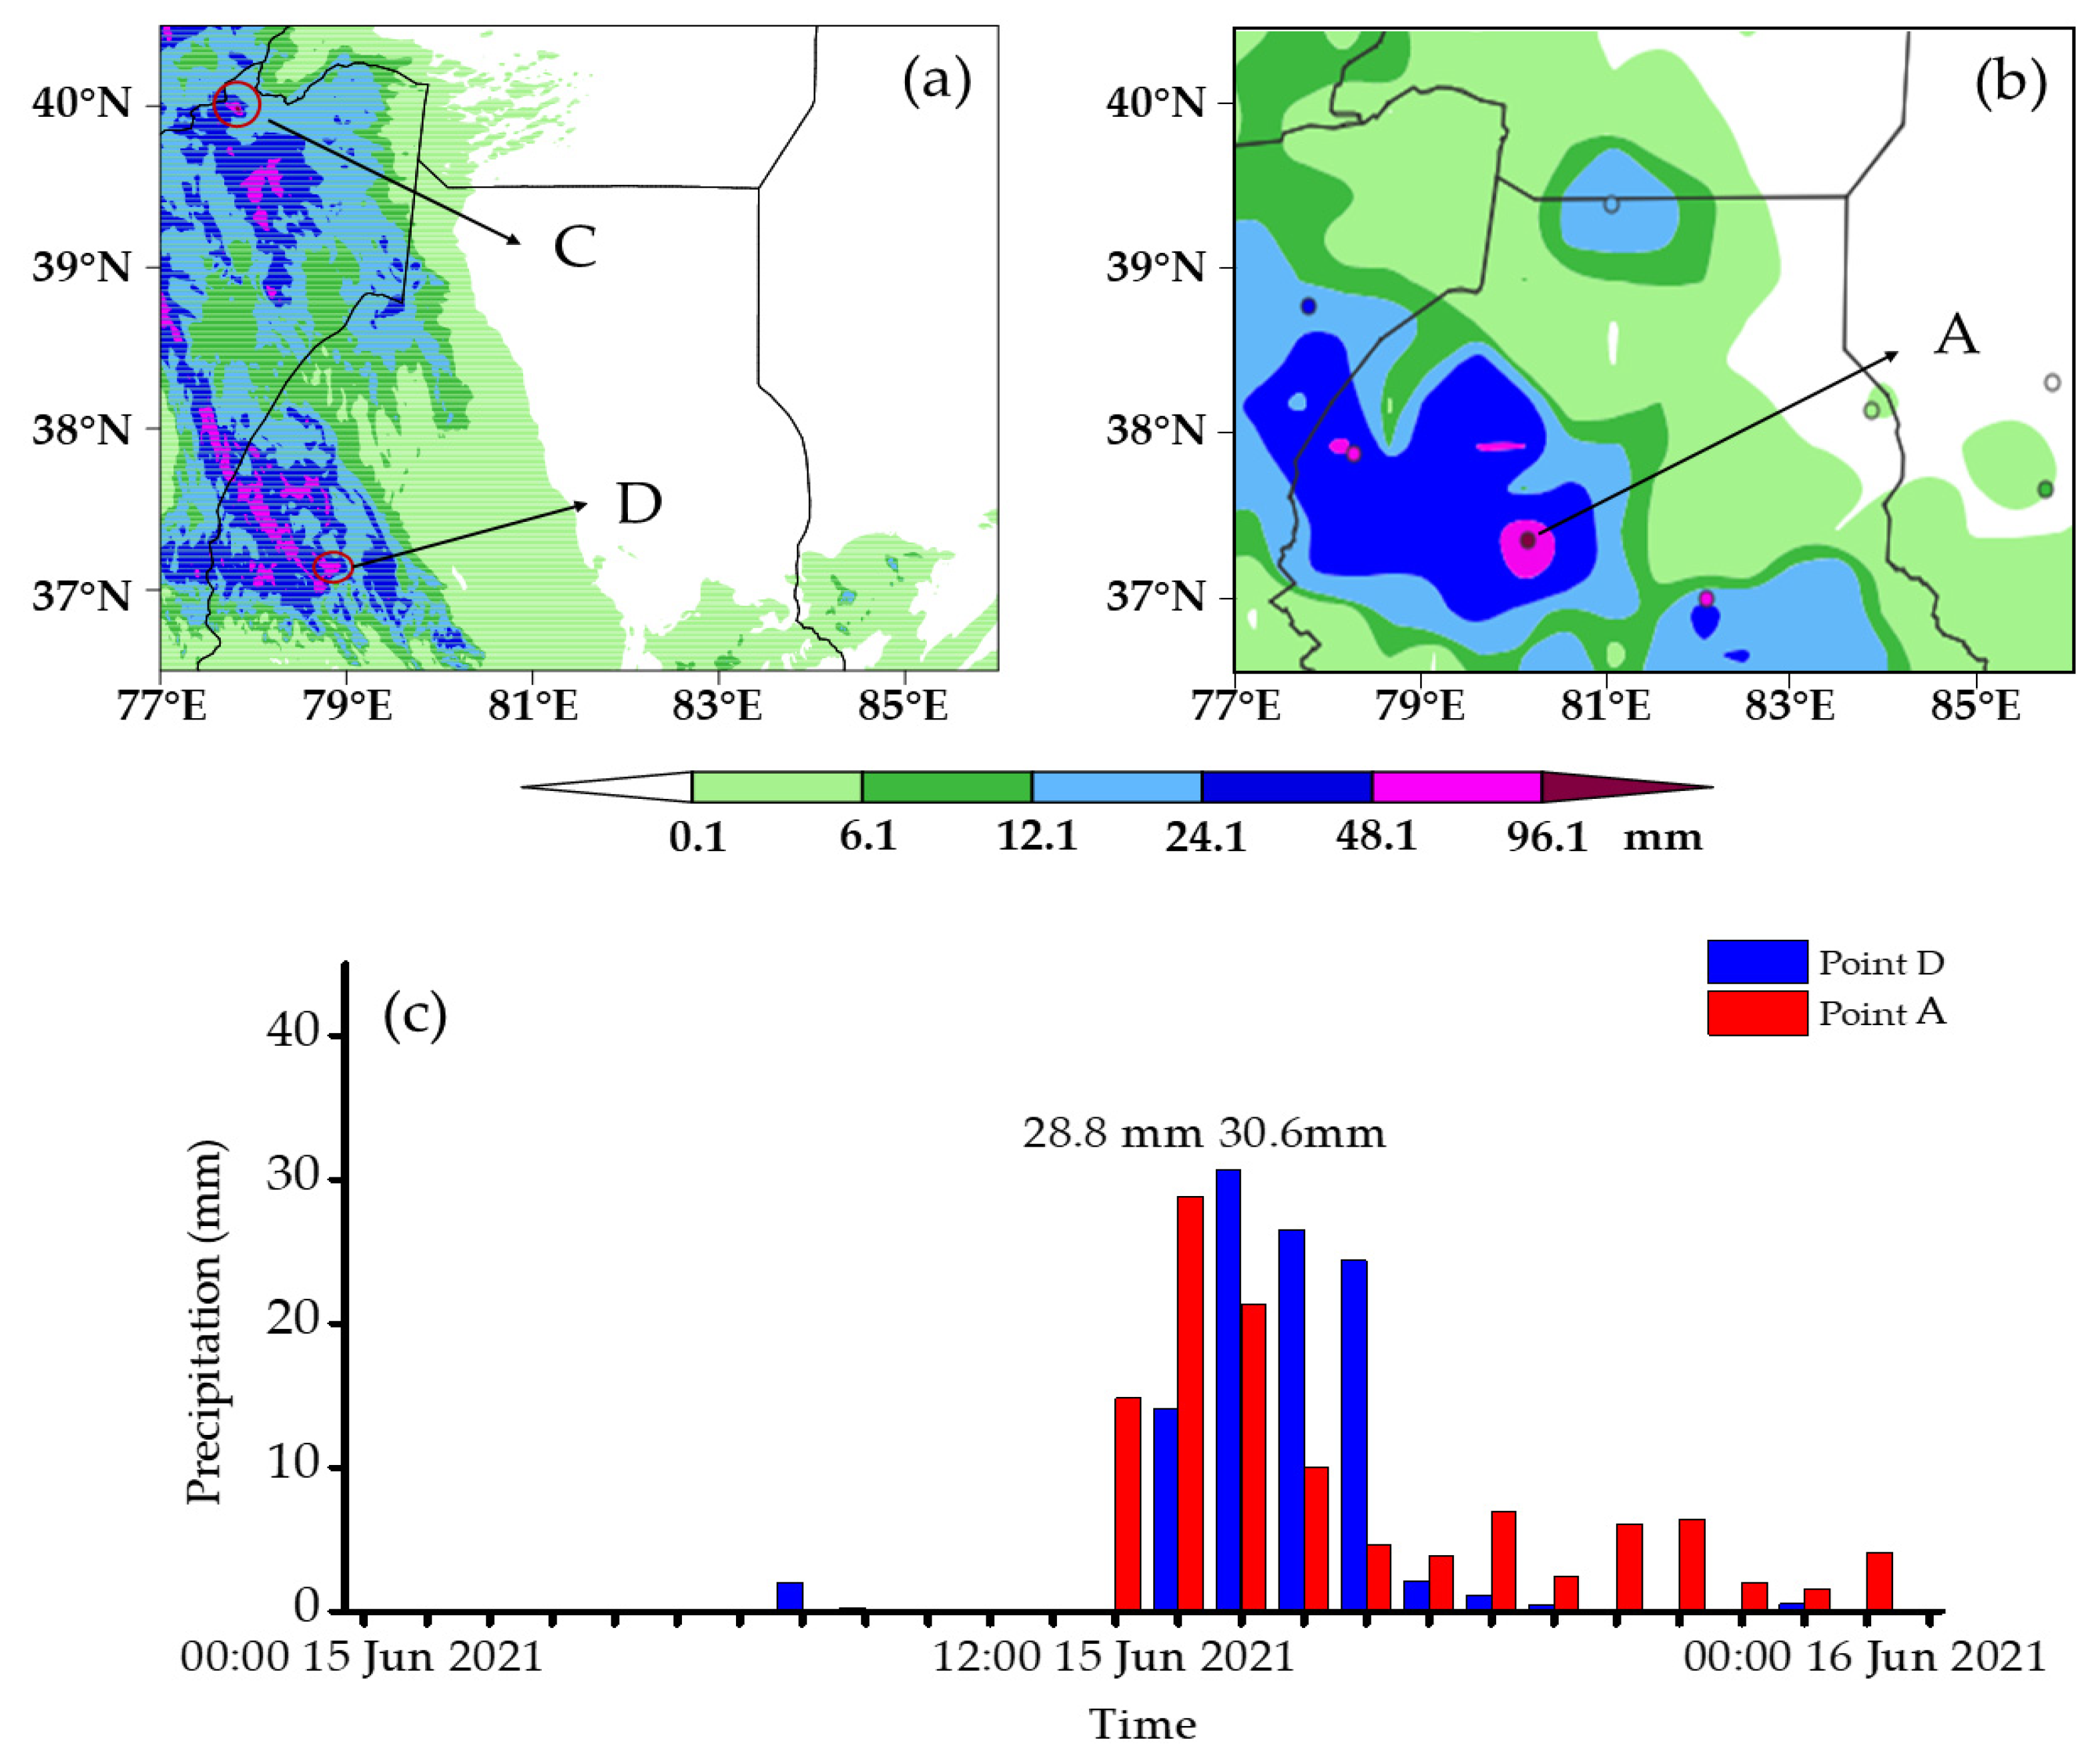
2.2. Precipitation Observations

Figure 1 shows the topographic map of the entire XJ region. It is evident that the terrain on the northern slope of the Kunlun Mountains exhibits a distinct trumpet-shaped structure, bordered by the western Tianshan Mountains to its northwest, the Pamir Plateau to its southwest, the Kunlun Mountains to its south, and the Tarim Basin to its east. Notably, some areas have an altitude of over 5 km. Regarding the typical arid and semi-arid climate in southern XJ [2], local meteorologists have established region-specific standards of precipitation magnitudes, defining 24 h accumulated precipitation over 6.0 mm as moderate rain, over 12.0 mm as heavy rain, and over 24.0 mm as a rainstorm event [50].
From 1200 Coordinated Universal Time (UTC) (which was 2000 Beijing Time, BJT) on 14 June to 0000 UTC (which was 0800 BJT) on 17 June 2021, an extreme precipitation event occurred in Kashgar Prefecture, Kizilsu Kirgiz Autonomous Prefecture, and Hotan Prefecture in southern XJ on the northern slope of the middle Kunlun Mountains (Figure 2a). The daily precipitation in Luopu County (74.1 mm), Moyu County (59.6 mm), and Hotan City (56.0 mm) of Hotan Prefecture broke the historical extreme values and exceeded their annual average precipitation. The precipitation in Luopu County on the 16th was 1.7 times the annual average precipitation of the station. The rainstorm process, with large accumulated precipitation, a large number of rainstorm stations, strong and extreme locality, had a great impact on the production and life of the local people.
According to accumulated precipitation data from meteorological stations across XJ (Figure 2a), a total of 671 stations recorded precipitation. Specifically, 273 stations experienced precipitation of 0.1–6.0 mm, 48 stations witnessed precipitation of 6.1–12.0 mm, 115 stations recorded precipitation of 12.1–24.0 mm, 167 stations witnessed precipitation of 24.1–48.0 mm, 62 stations recorded precipitation of 48.1–96.0 mm, and 6 stations experienced precipitation exceeding 96.0 mm. The large-value centre of this precipitation event was located in the central-western plain of the Hotan region. The maximum precipitation was observed at the No.1 station in the debris flow-prone area of Shanpuru Township, Luopu County (36.99°N, 80.08°E; point A in Figure 2a), with accumulated precipitation reaching 121.6 mm. Meanwhile, the maximum record at national meteorological station was 97.6 mm at Luopu station (37.05°N, 80.23°E; point B in Figure 2a). The evolutions of hourly precipitation data at point A (Figure 2b) and point B (Figure 2c) indicate that the main rainfall period spanned from 0000 UTC on 15 June to 0000 UTC on 16 June 2021, with peak intensities of 28.8 mm at 1400 UTC for point A and 20.6 mm at 1500 UTC for point B on 15 June, respectively.

3. Results

3.1. Synoptic Situation and Environmental Factors Affecting Extreme Precipitation

In June 2021, the average 500 hPa circulation featured a “two ridges and one trough” pattern at higher latitudes, with strong ridges extending from eastern Europe to the Ural Mountains and the Sea of Okhotsk. As affected by the low trough, most regions of XJ experienced intermittent precipitation from 28 May to 20 June [17].

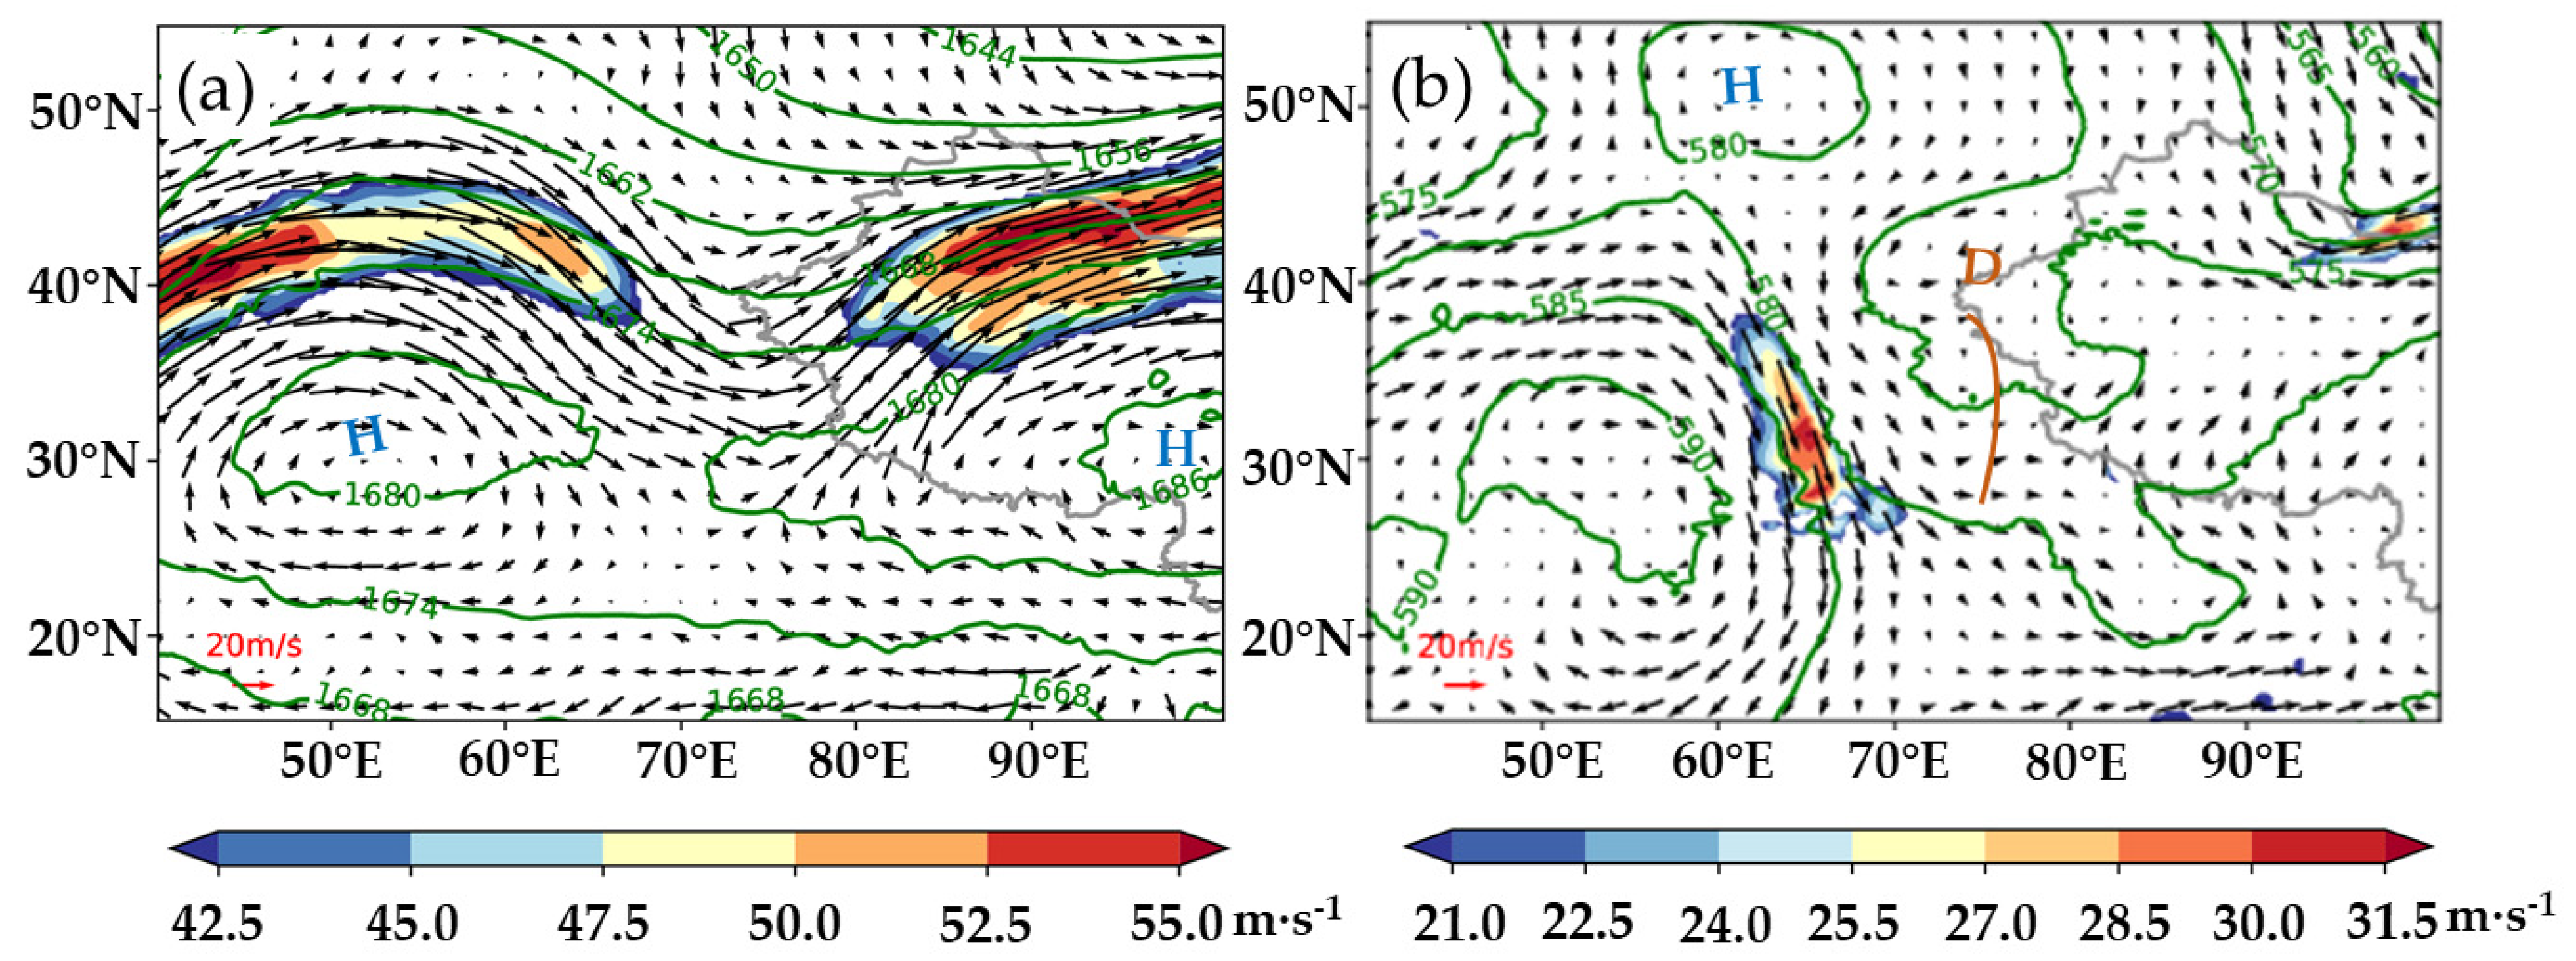
3.1.1. Synoptic Situation

On 14 June, the intensity and spatial extent of the high-pressure centre east of the Tibetan Plateau had increased, and southern XJ was in front of an upper-level trough. At 200 hPa, the western part of southern XJ was located near the rupture of the upper-level jet stream and the entrance region of the eastern jet stream, with maximum wind speed exceeding 40.0 m·s−1. On 15 June, the 100 hPa South Asian high initially located over the Iranian Plateau expanded eastward into the airspace above the region east of the Tibetan Plateau, gradually evolving into a bimodal structure with two centres (Figure 3a).
From 11 to 14 June, a low trough was formed over the Indian Peninsula between the 500 hPa Iran subtropical high and the western Pacific subtropical high. Meanwhile, a meridional low trough extending from Siberia to Central Asia continued to strengthen. The Siberian trough was affected by the terrain when moving eastward, which led to the formation of a transverse trough over Lake Balkhash. Its northern section moved eastward and northward, and the splitting into shortwaves, along with their subsequent eastward movement, caused significant precipitation in mountainous areas of the northern, eastern, and southern XJ. During the period from 15 to 16 June, the northern section of the trough moved eastward to the Lake Baikal, when the northern and eastern parts of XJ were at the bottom of the trough. Simultaneously, the transverse trough over Lake Balkhash crossed the plateau and entered the western part of southern XJ (Figure 3b), which further merged with the trough over the Indian Peninsula during the same phase. The typical “east–west confrontation” and “south–north convergence” jointly contributed to the historically rare rainstorm on the northern slope of the middle Kunlun Mountains.

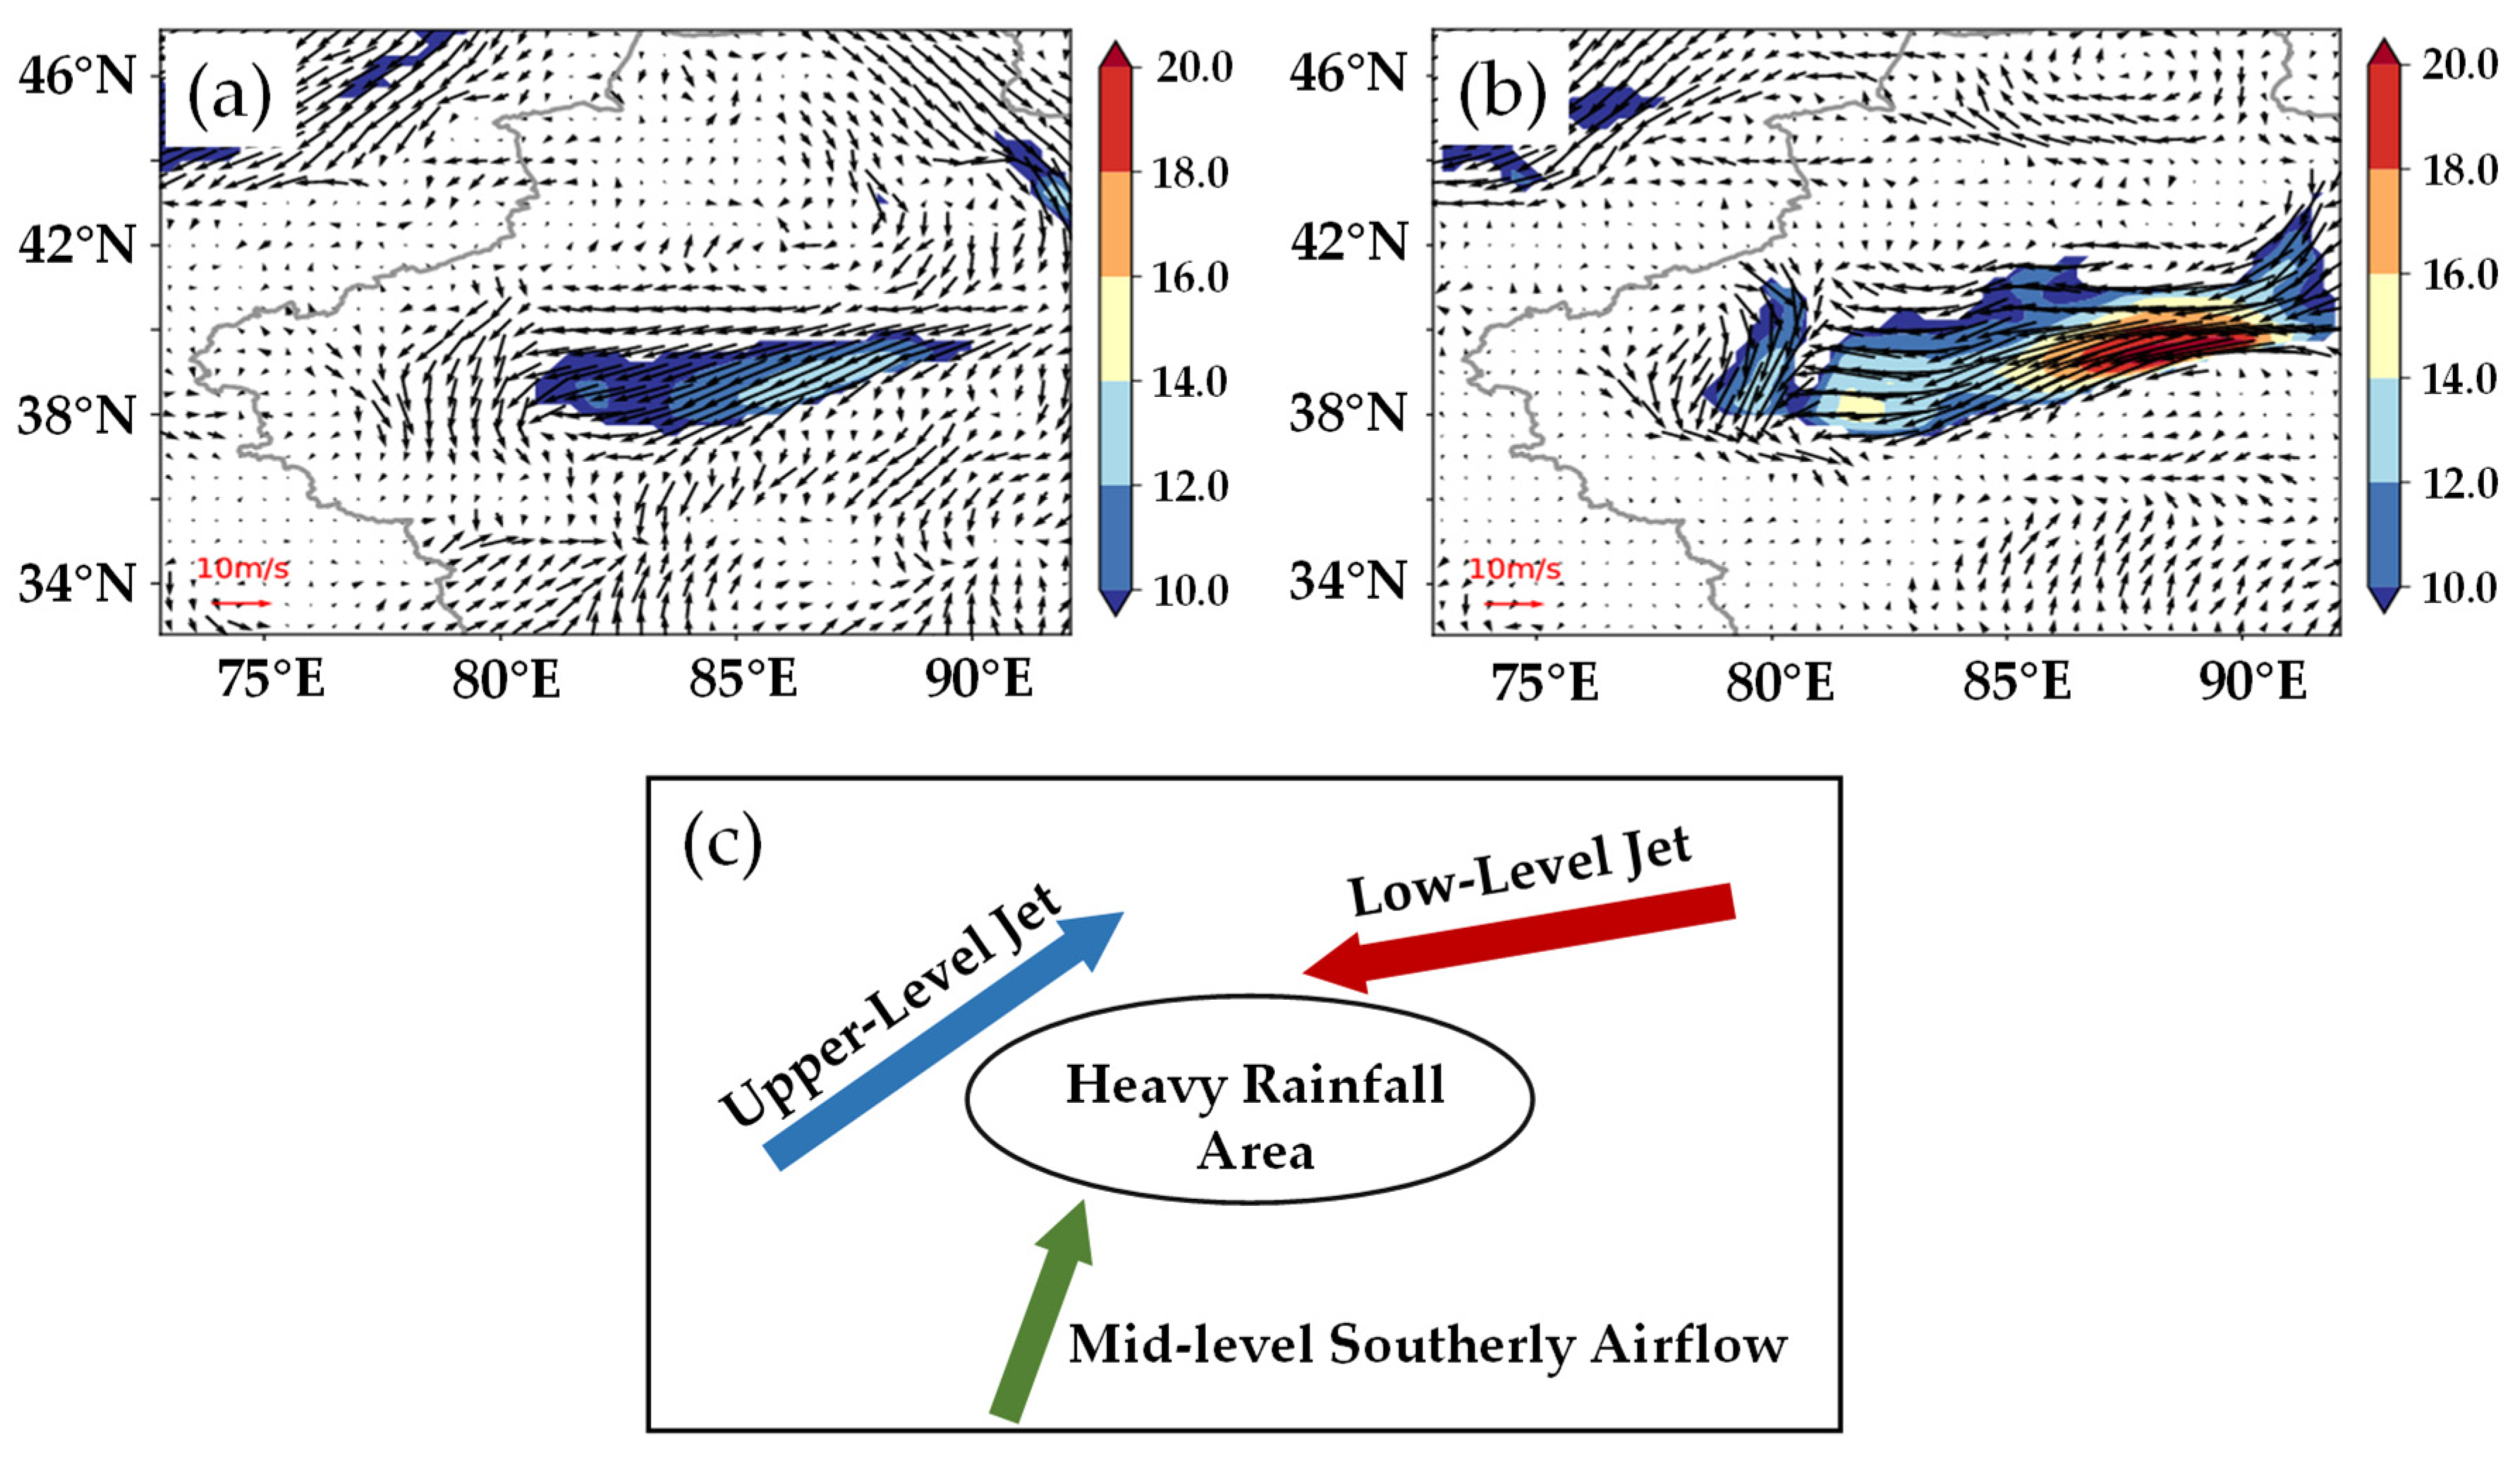
3.1.2. Low-Level Easterly Jet

The easterly jet primarily facilitates water vapour transport, convergence, and dynamical convergence uplift. This kind of extreme precipitation event occurs, as typically observed, in the convergence zone in front of the low-level easterly jet. At 1200 UTC on 15 June, an easterly jet with the wind speed of 12.0–16.0 m·s−1 was observed at 850 hPa on the eastern side of the northern slope of the Kunlun Mountains (Figure 3a), with the strongest wind speed centre located near Qiemo County (85.54°E, 38.13°N). The heavy-rainfall area was positioned at the forefront of the easterly jet. Concurrently, the northwesterly wind west of Hotan (79.93°E, 37.12°N) and the northeastern side of the easterly wind simultaneously strengthened, forming wind shear over the central Hotan. At 0000 UTC on 16 June, the easterly jet reached its peak intensity (Figure 3b) with a wind speed of 20.0 m·s−1. It gradually veered to a southeasterly direction and strengthened over the northern slope of the middle Kunlun Mountains, and the heavy rainfall area moved northwestward. After 0600 UTC on 16 June, the easterly wind weakened while the northwesterly wind strengthened and the convergence line moved northeastward.
In summary, this extreme precipitation event on the northern slope of the middle Kunlun Mountains occurred under a circulation pattern characterized by “two ridges and one trough”. The upper-level South Asian high exhibited a bimodal structure, accompanied by the formation and development of the Central Asian vortex. The rainfall area was located on the right side of the entrance region of the 200 hPa southwesterly jet (Figure 3a), which provided favourable dynamical conditions. The 500 hPa southerly airflow (Figure 3b), 700 hPa shear line, and 850 hPa easterly airflow (Figure 4a,b) facilitated the transport and accumulation of water vapour in the rainfall area, promoting the occurrence of extreme precipitation on the northern slope of the middle Kunlun Mountains (Figure 4c).

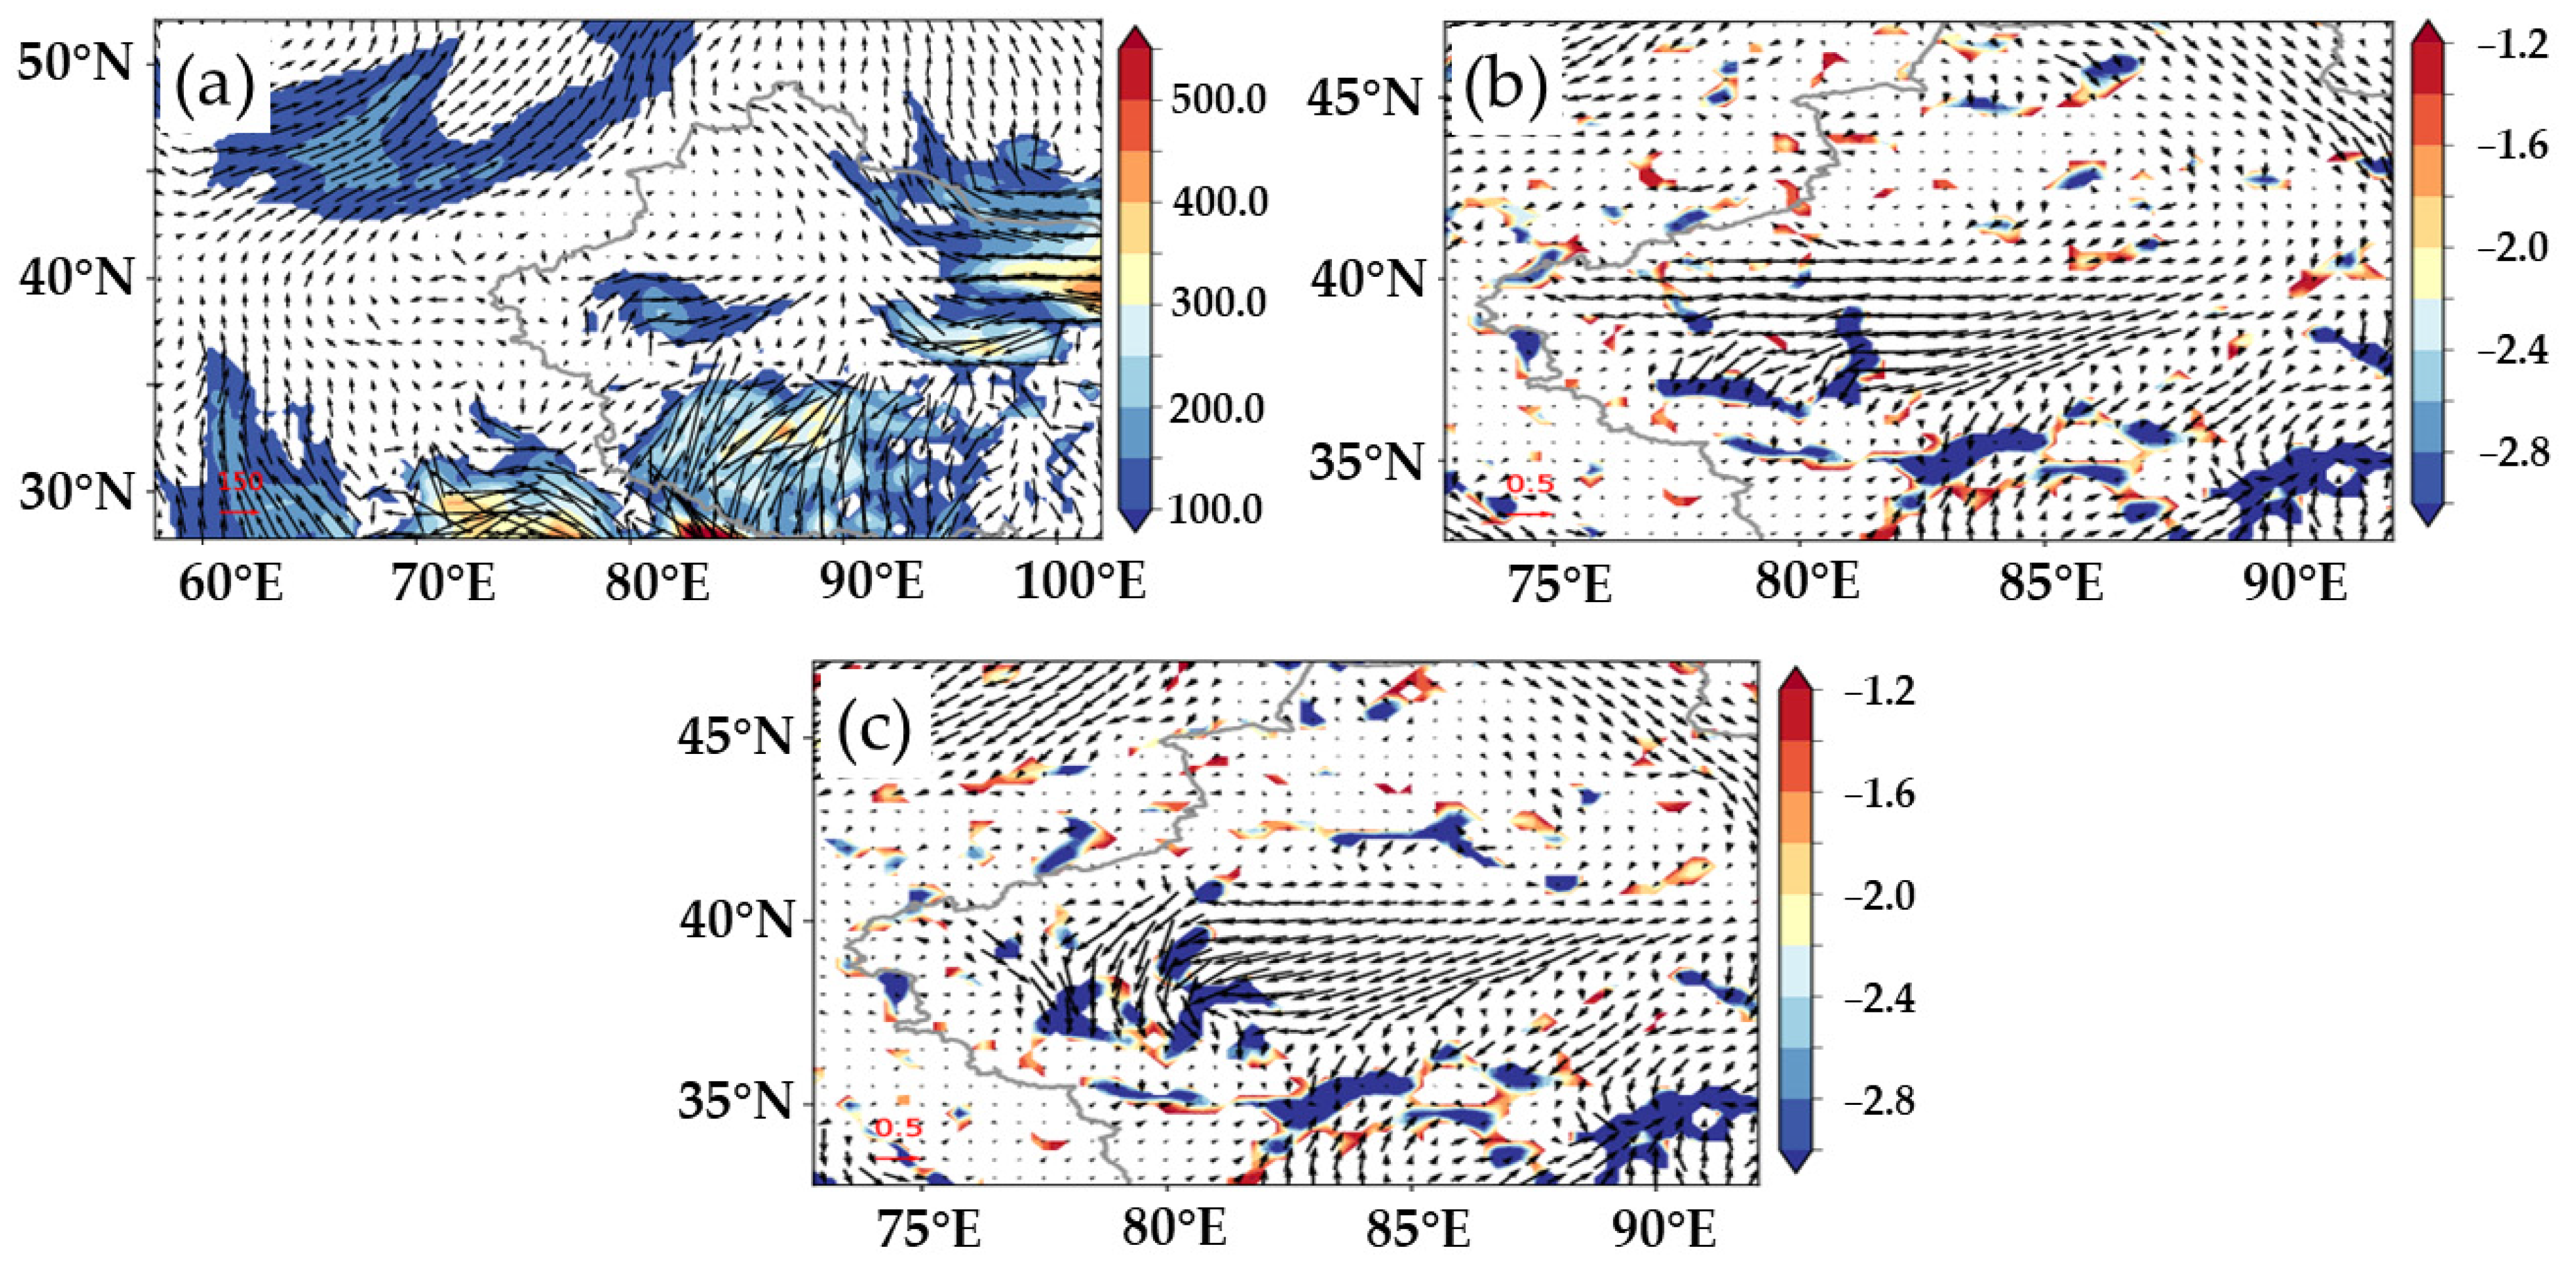
3.1.3. Water Vapour Transport

Water vapour is the most critical factor influencing the rainfall on the northern slope of the middle Kunlun Mountains [2,28,29]. Prior to this precipitation event, water vapour flux from the surface up to the 300 hPa level was continuously transported into the basin by low troughs or shortwaves during the period from 10 to 14 June, primarily in a southwest–northeast direction. From 15 to 16 June, the strong water vapour flux centre moved from east to west, with the central intensity reaching up to 200.0 kg·m−1·s−1 (Figure 5a), and the rainfall process occurred near this centre. Water vapour was transported along the northeast, northwest, and south paths, with the northeastward one being the most intense, channelling water vapour from the southern slope of the Tianshan Mountains to the northern slope of the middle Kunlun Mountains. Specifically, water vapour was transported via the southerly airflow at 500 hPa, northeasterly airflow at 700 hPa (Figure 5b), and both northwesterly and northeasterly airflows at 850 hPa (Figure 5c).
At 700 hPa, easterly water vapour transport persisted until the end of the precipitation process, with water vapour flux convergence occurring over the heavy-rainfall area. At 850 hPa, water vapour was transported along the west, north, and east paths. At 1200 UTC on 15 June, the convergence of northeasterly and northwesterly wind over central Hotan resulted in the strong convergence of water vapour flux divergence at 850 hPa, with the central intensity reaching 3.0 kg·m−1·hPa−1·s−1 (Figure 5c). Meanwhile, the rainstorm area was located in this strong convergence zone.
It can be seen that the continuous and sufficient water vapour transport provided favourable environmental conditions for this extreme precipitation event (Figure 5). The water vapour involved in this rainfall event primarily originated from the accumulation of mid-to-low level water vapour within the basin and the northward transport of water vapour following the merging of low troughs.

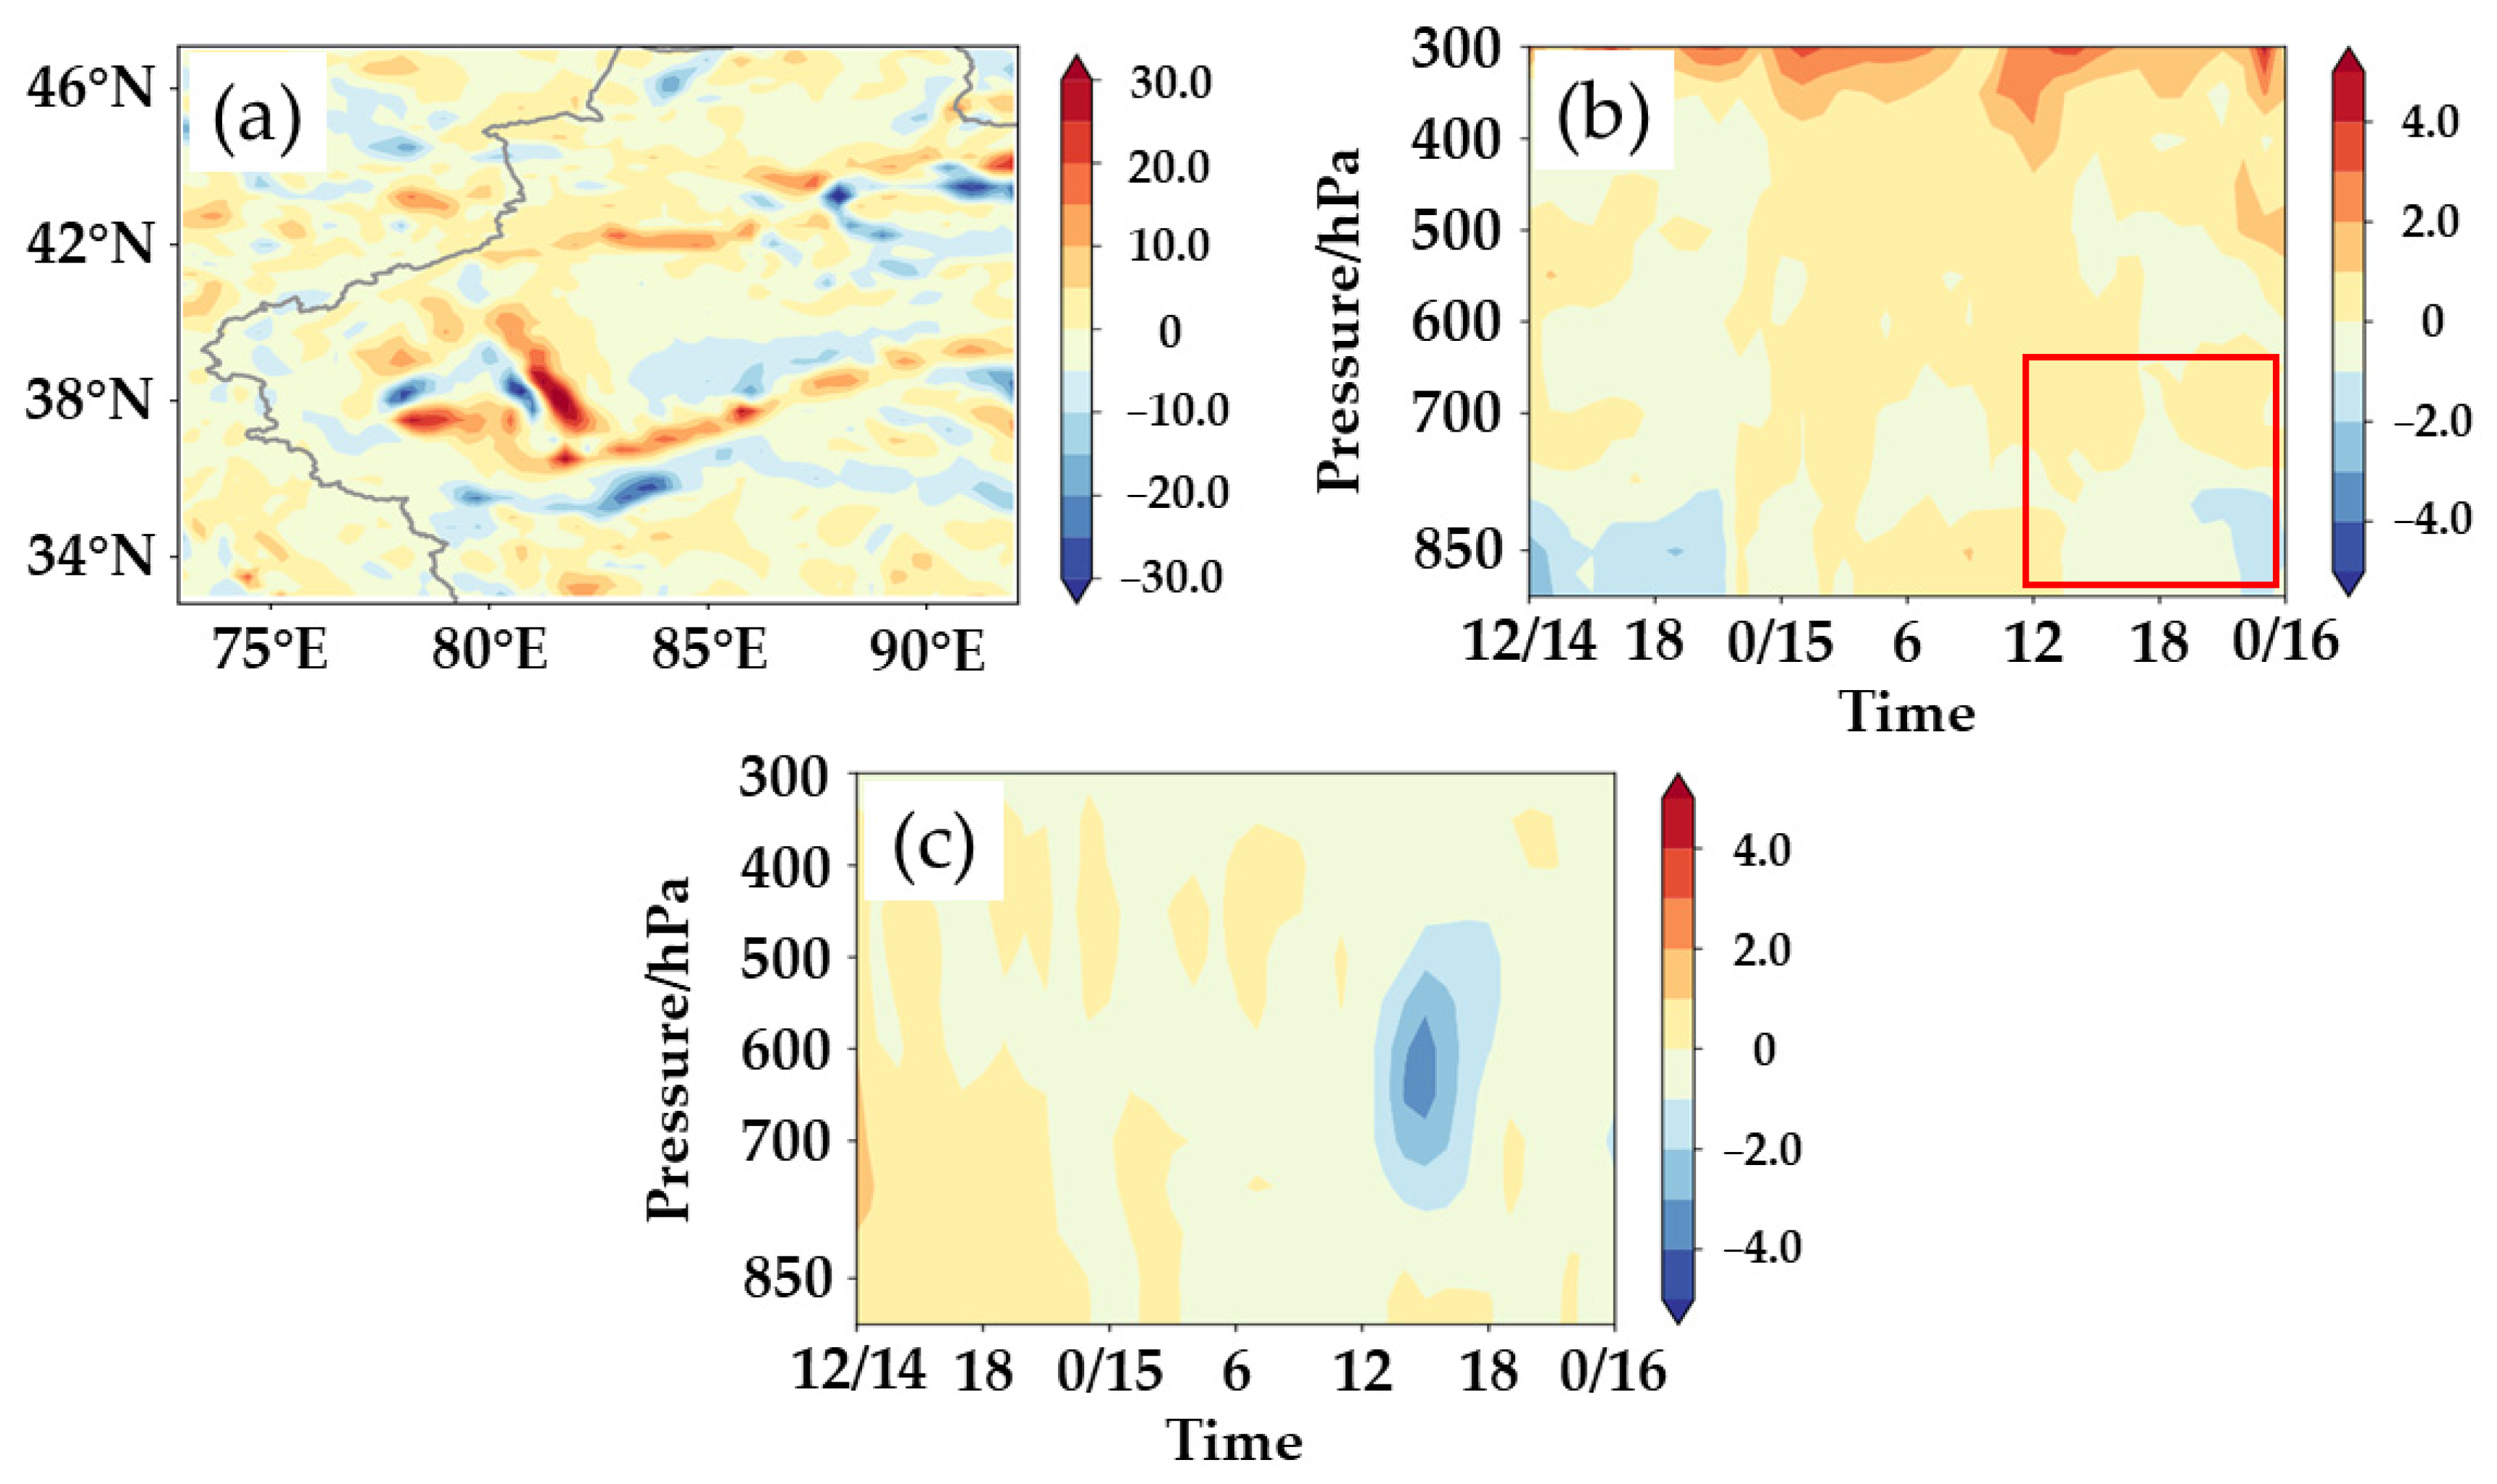
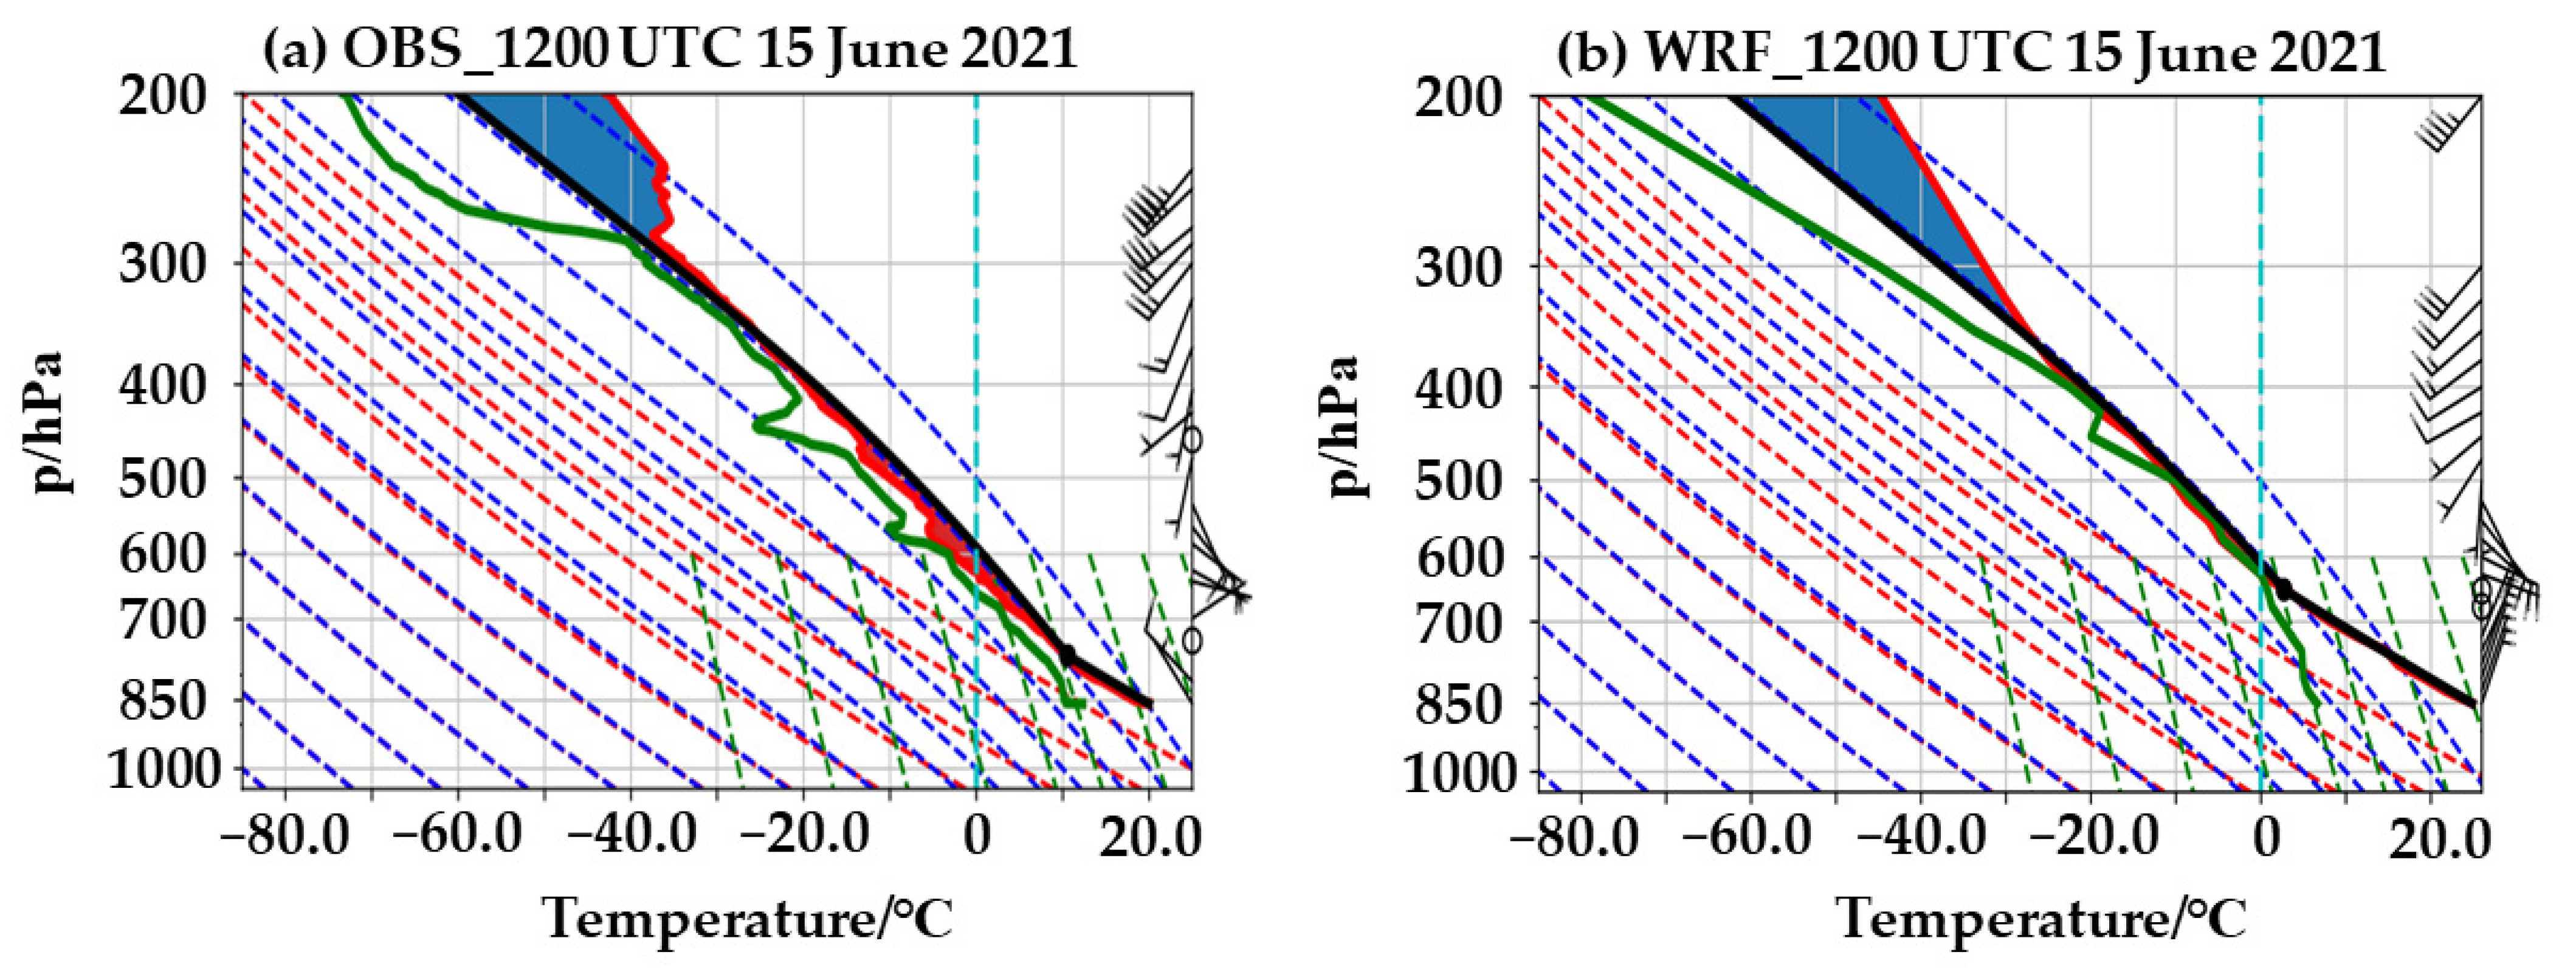
3.1.4. Analysis of Thermodynamic and Dynamical Conditions

Thermodynamic conditions and strong dynamical uplift are important factors for the occurrence and development of heavy rainfall. At 1200 UTC on 15 June, cold and warm advection on the northern slope of the Kunlun Mountains was unevenly distributed. There was a significant difference in cold and warm advection at 850 hPa: the warm advection near the rainstorm centre exceeded 30.0 × 10⁻⁵ °C·s−1, while the cold advection exceeded −20.0 × 10⁻⁵ °C·s−1 (Figure 6a). At Luopu station, during the main rainfall period from 1200 UTC on 15 June to 0000 UTC on 16 June 2021 (Figure 2c), warm advection was observed at 850 hPa, while cold advection occurred between 800 hPa and 700 hPa (Figure 6b). The superposition of upper-level cold advection and lower-level warm advection was conducive to the formation of atmospheric stratification instability, thereby favouring the occurrence and development of heavy rainfall. From the time–height evolution of the vertical velocity at Luopu station (Figure 6c), it can be seen that the vertical velocity peaked at 1200 UTC on 15 June, with a maximum value of 4.0 Pa·s−1. An ascending motion extended from the surface up to 400 hPa, characterized by strong intensity and large thickness.
According to the above analysis of temperature advection and vertical velocity, it can be revealed that the strong warm advection and vertical upward motion over the northern slope of the middle Kunlun Mountains jointly provided favourable dynamical conditions for the occurrence and development of this extreme precipitation event.

3.2. Experimental Design and Validation of the Weather Research and Forecasting Model

This study focuses on the influence of the Central Asian trough and the terrain near the northern slope of the middle Kunlun Mountains on the extreme precipitation event. Given the coarse spatio-temporal resolution of existing observations, the WRF model is employed to perform high-resolution numerical simulations, enabling a more detailed analysis of the mechanisms underlying this extreme precipitation event.
Specifically, this paper employs WRF version 4.1.3, which evolves from the fifth-generation Mesoscale Model [48,51]. The WRF model is a fully compressible non-hydrostatic model suitable for a wide range of applications across spatial scales ranging from metres to thousands of kilometres. It features a horizontal lattice in Arakawa-C format, a hybrid vertical co-ordinate system of power quality, and an Euler centre-based on terrain following. The model allows for the flexible selection of physical parameterization schemes, including microphysics, cumulus, planetary boundary layers, and land surface processes. The WRF modelling system consists of the WRF Pre-Processing System, the Advanced Research WRF, the WRF Data Assimilation, and the post-processing systems. The WRF Pre-Processing System contains the initial data used to define simulation domains, interpolate terrestrial data (including surface vegetation, terrain, soil type, and land use) and horizontally interpolate the initial data into the simulation domains [51,52,53].

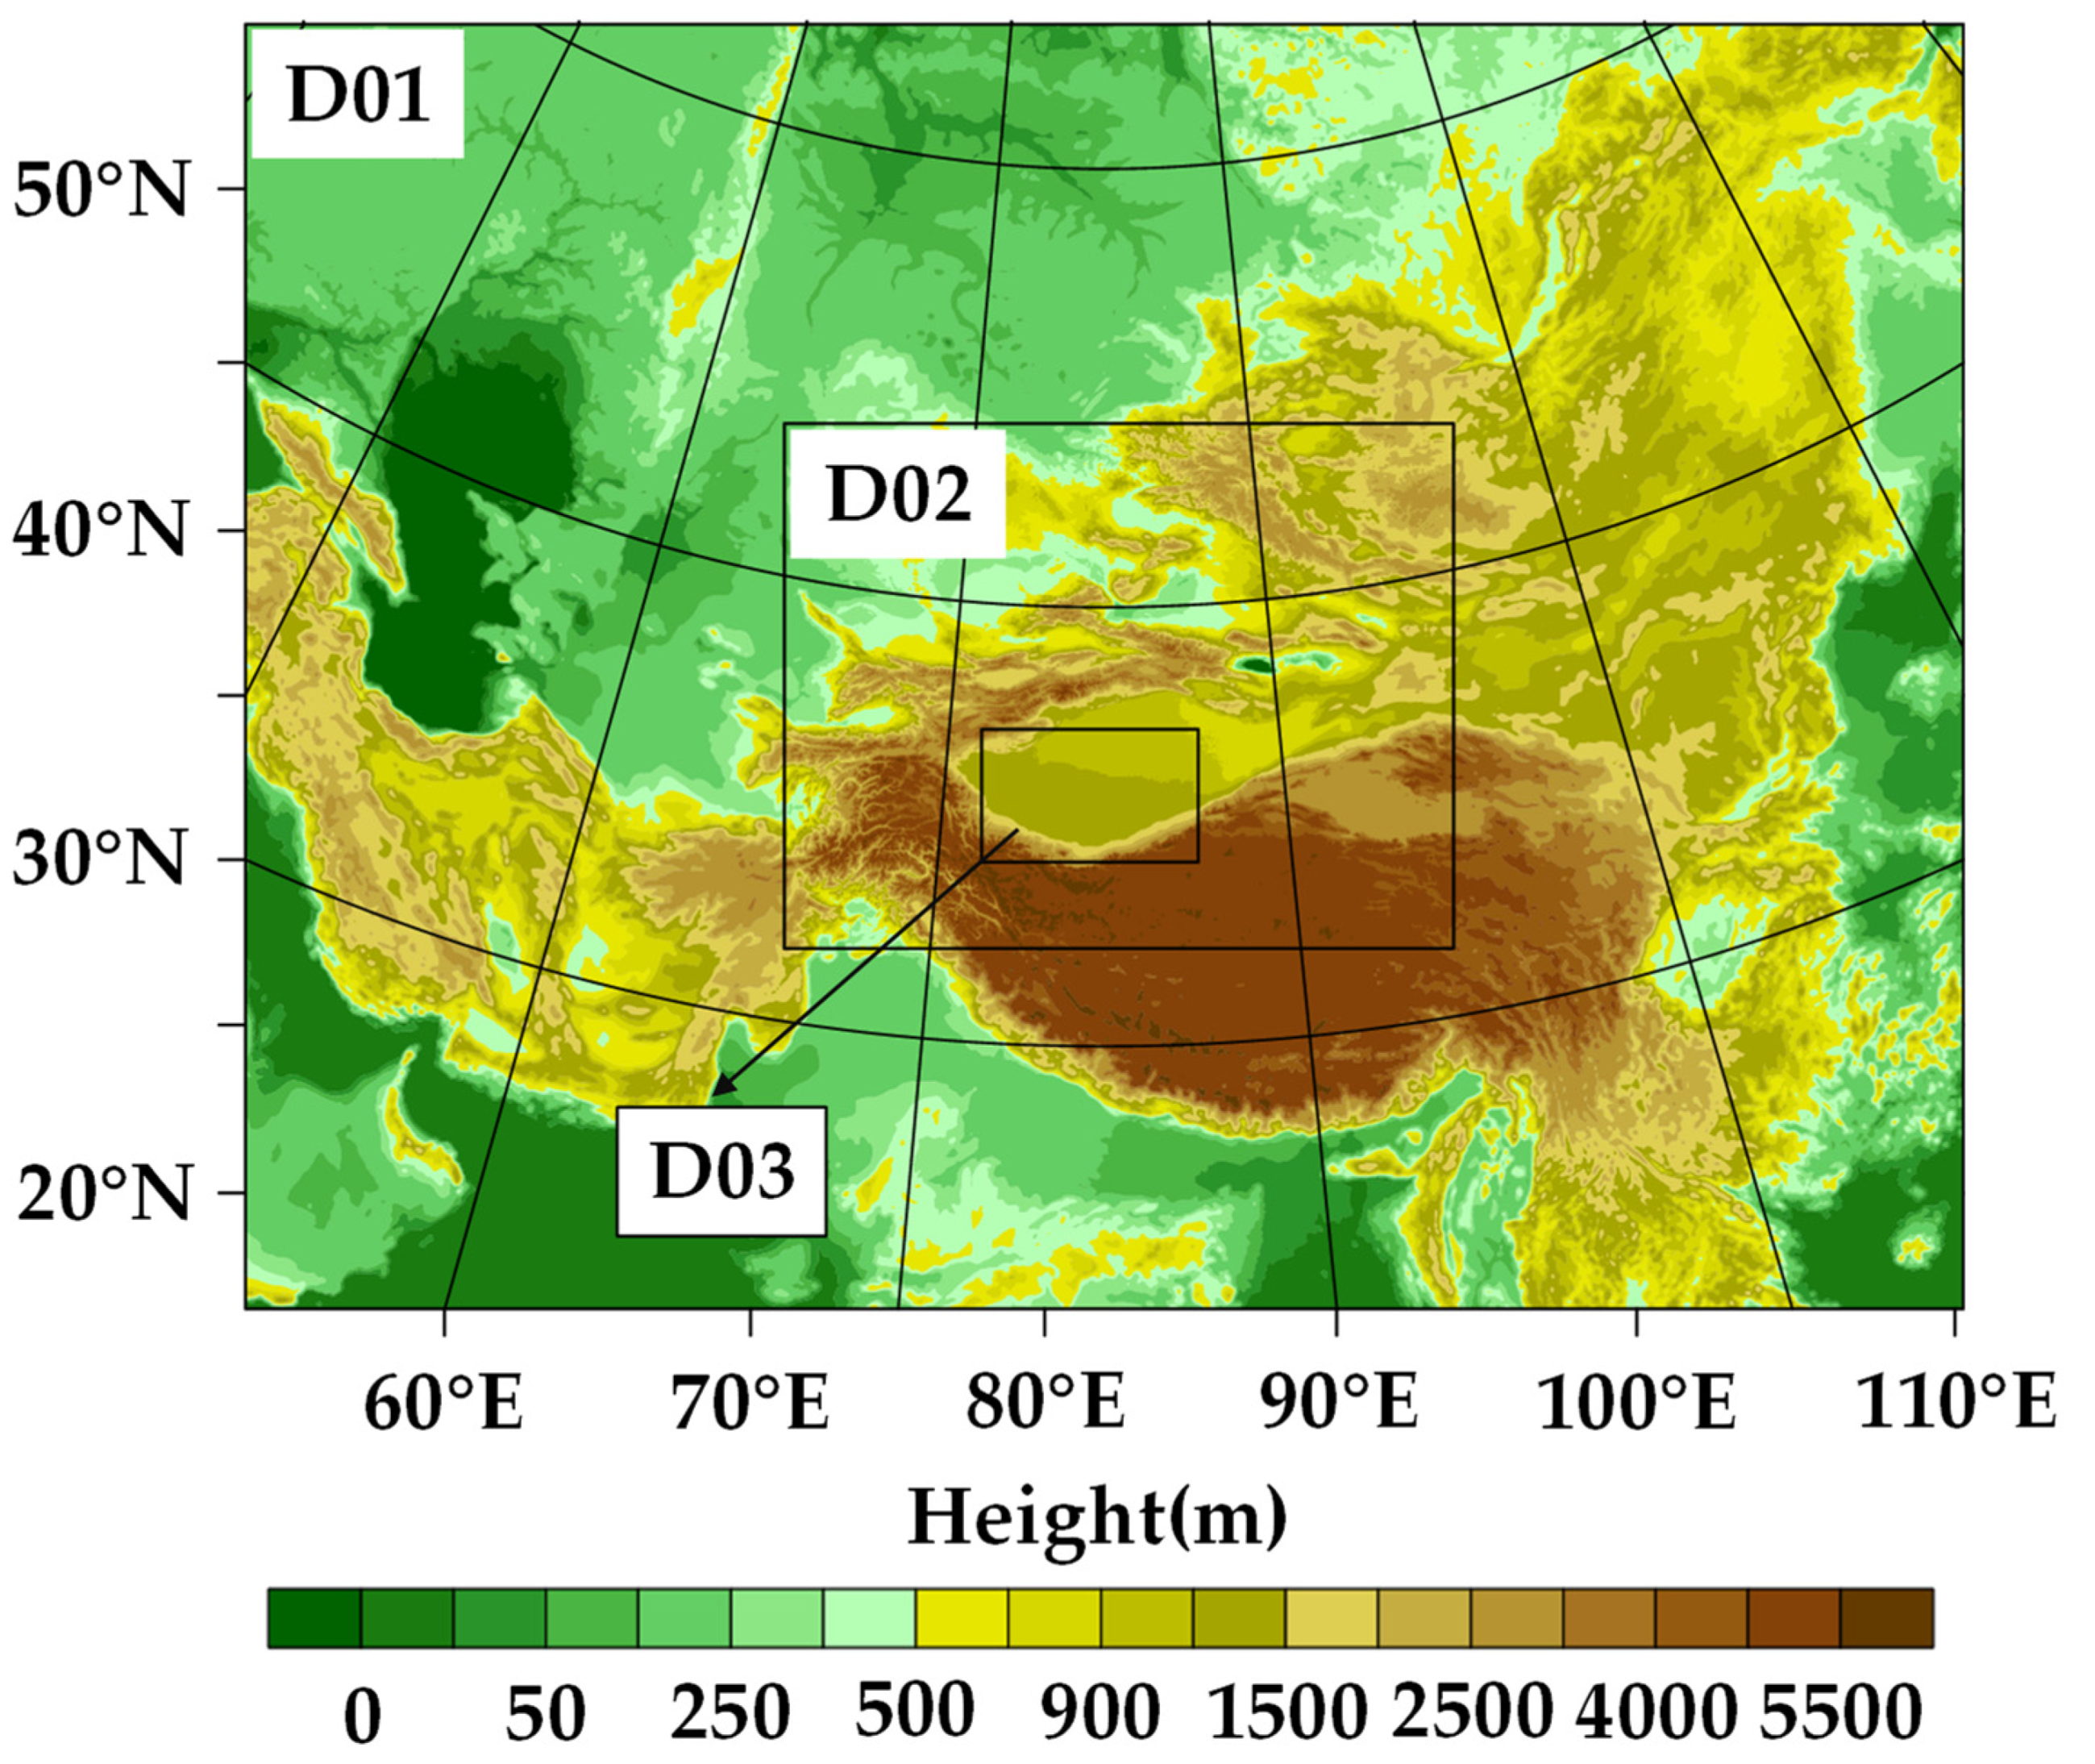
3.2.1. Experimental Design

The initial fields and boundary conditions for the WRF model are derived from the ERA5 reanalysis data, with a spatial resolution of 0.25° × 0.25° and a temporal resolution of 1 h. A variety of observational datasets (listed in Section 2.1) are assimilated at the initial time. The simulation employs a three-domain nested grid configuration with horizontal grid spacings being 9 km (D01), 3 km (D02), and 1 km (D03), and the corresponding numbers of grid dimensions are 712 × 532, 832 × 652, 808 × 496, respectively. The model is set to 50 levels vertically. The initial time of the model simulation is set at 1800 UTC on 14 June 2021, with an integration step-size of 20 s and a total integration time of 36 h. Simulation results are outputted hourly. The simulation domains and corresponding terrain height distribution are shown in Figure 7, and the specific physical parameterization schemes are listed in Table 1.

3.2.2. Validation of Simulation Results

The comparison of 24 h accumulated precipitation between WRF simulation results (Figure 8a) and observations (Figure 8b) reveals that, although the simulated rainfall area is located slightly eastward and southward, the overall spatial extent of the heavy-rainfall area is well reproduced. Additionally, the simulated precipitation centre (130.6 mm at point C and 102.4 mm at point D) closely aligns with the observed precipitation centre (112.8 mm at point A; Figure 2b), demonstrating good agreement in both location and intensity. To further validate the reliability of the WRF simulation results, the hourly precipitation at point D (37.05°N, 78.92°E) is compared with that at point A (36.99°N, 80.08°E) (Figure 8c). It is evident that the precipitation intensity at the two points is basically consistent, with 24 h accumulated precipitation exceeding 96.0 mm, and the main rainfall periods at both points occur between 1200 UTC on 15 June and 0000 UTC on 16 June. The difference lies in the occurrence timing of peak hourly precipitation, which is recorded at 1300 UTC for point A (28.8 mm), but at 1400 UTC for point D (30.6 mm). Thereafter, the precipitation gradually weakens. Overall, the WRF model can basically reproduce the occurrence and development of this extreme precipitation event.
The Hotan sounding station (station number: 51828; 37.12°N, 79.93°E) is located in the study area for this heavy precipitation event. Therefore, the WRF simulation results (Figure 9b) are further compared with the sounding observations from the Hotan station (Figure 9a). It is found that, although the WRF model slightly underestimates the humidity in the lower troposphere, the simulation results accurately capture the atmospheric vertical structure and characteristics over Hotan station, as well as the near-saturated conditions in the mid-to-upper troposphere at 500–250 hPa. In terms of wind direction, the simulation results show that wind above 500 hPa rotates clockwise with height, indicating warm advection, whereas wind below 500 hPa in the mid-to-lower layer over Hotan rotates counterclockwise with height, suggesting cold advection. The intersection of cold and warm advection at this location triggers the release of convective instability energy, further resulting in the formation of precipitation. These findings suggest that the WRF model well reproduces the stratification and wind field conditions associated with this extreme precipitation event.
The validation result in the above demonstrates that the WRF model simulations of this extreme precipitation event align well with the observation. Therefore, the numerical simulation results are generally reliable, providing a solid foundation for an in-depth analysis of the mechanisms underlying this extreme precipitation process by using high-resolution simulation data.

3.3. Analysis of Radar Echo Characteristics, Shear Lines, Evolution of Low-Level Jet, and Momentum Budget

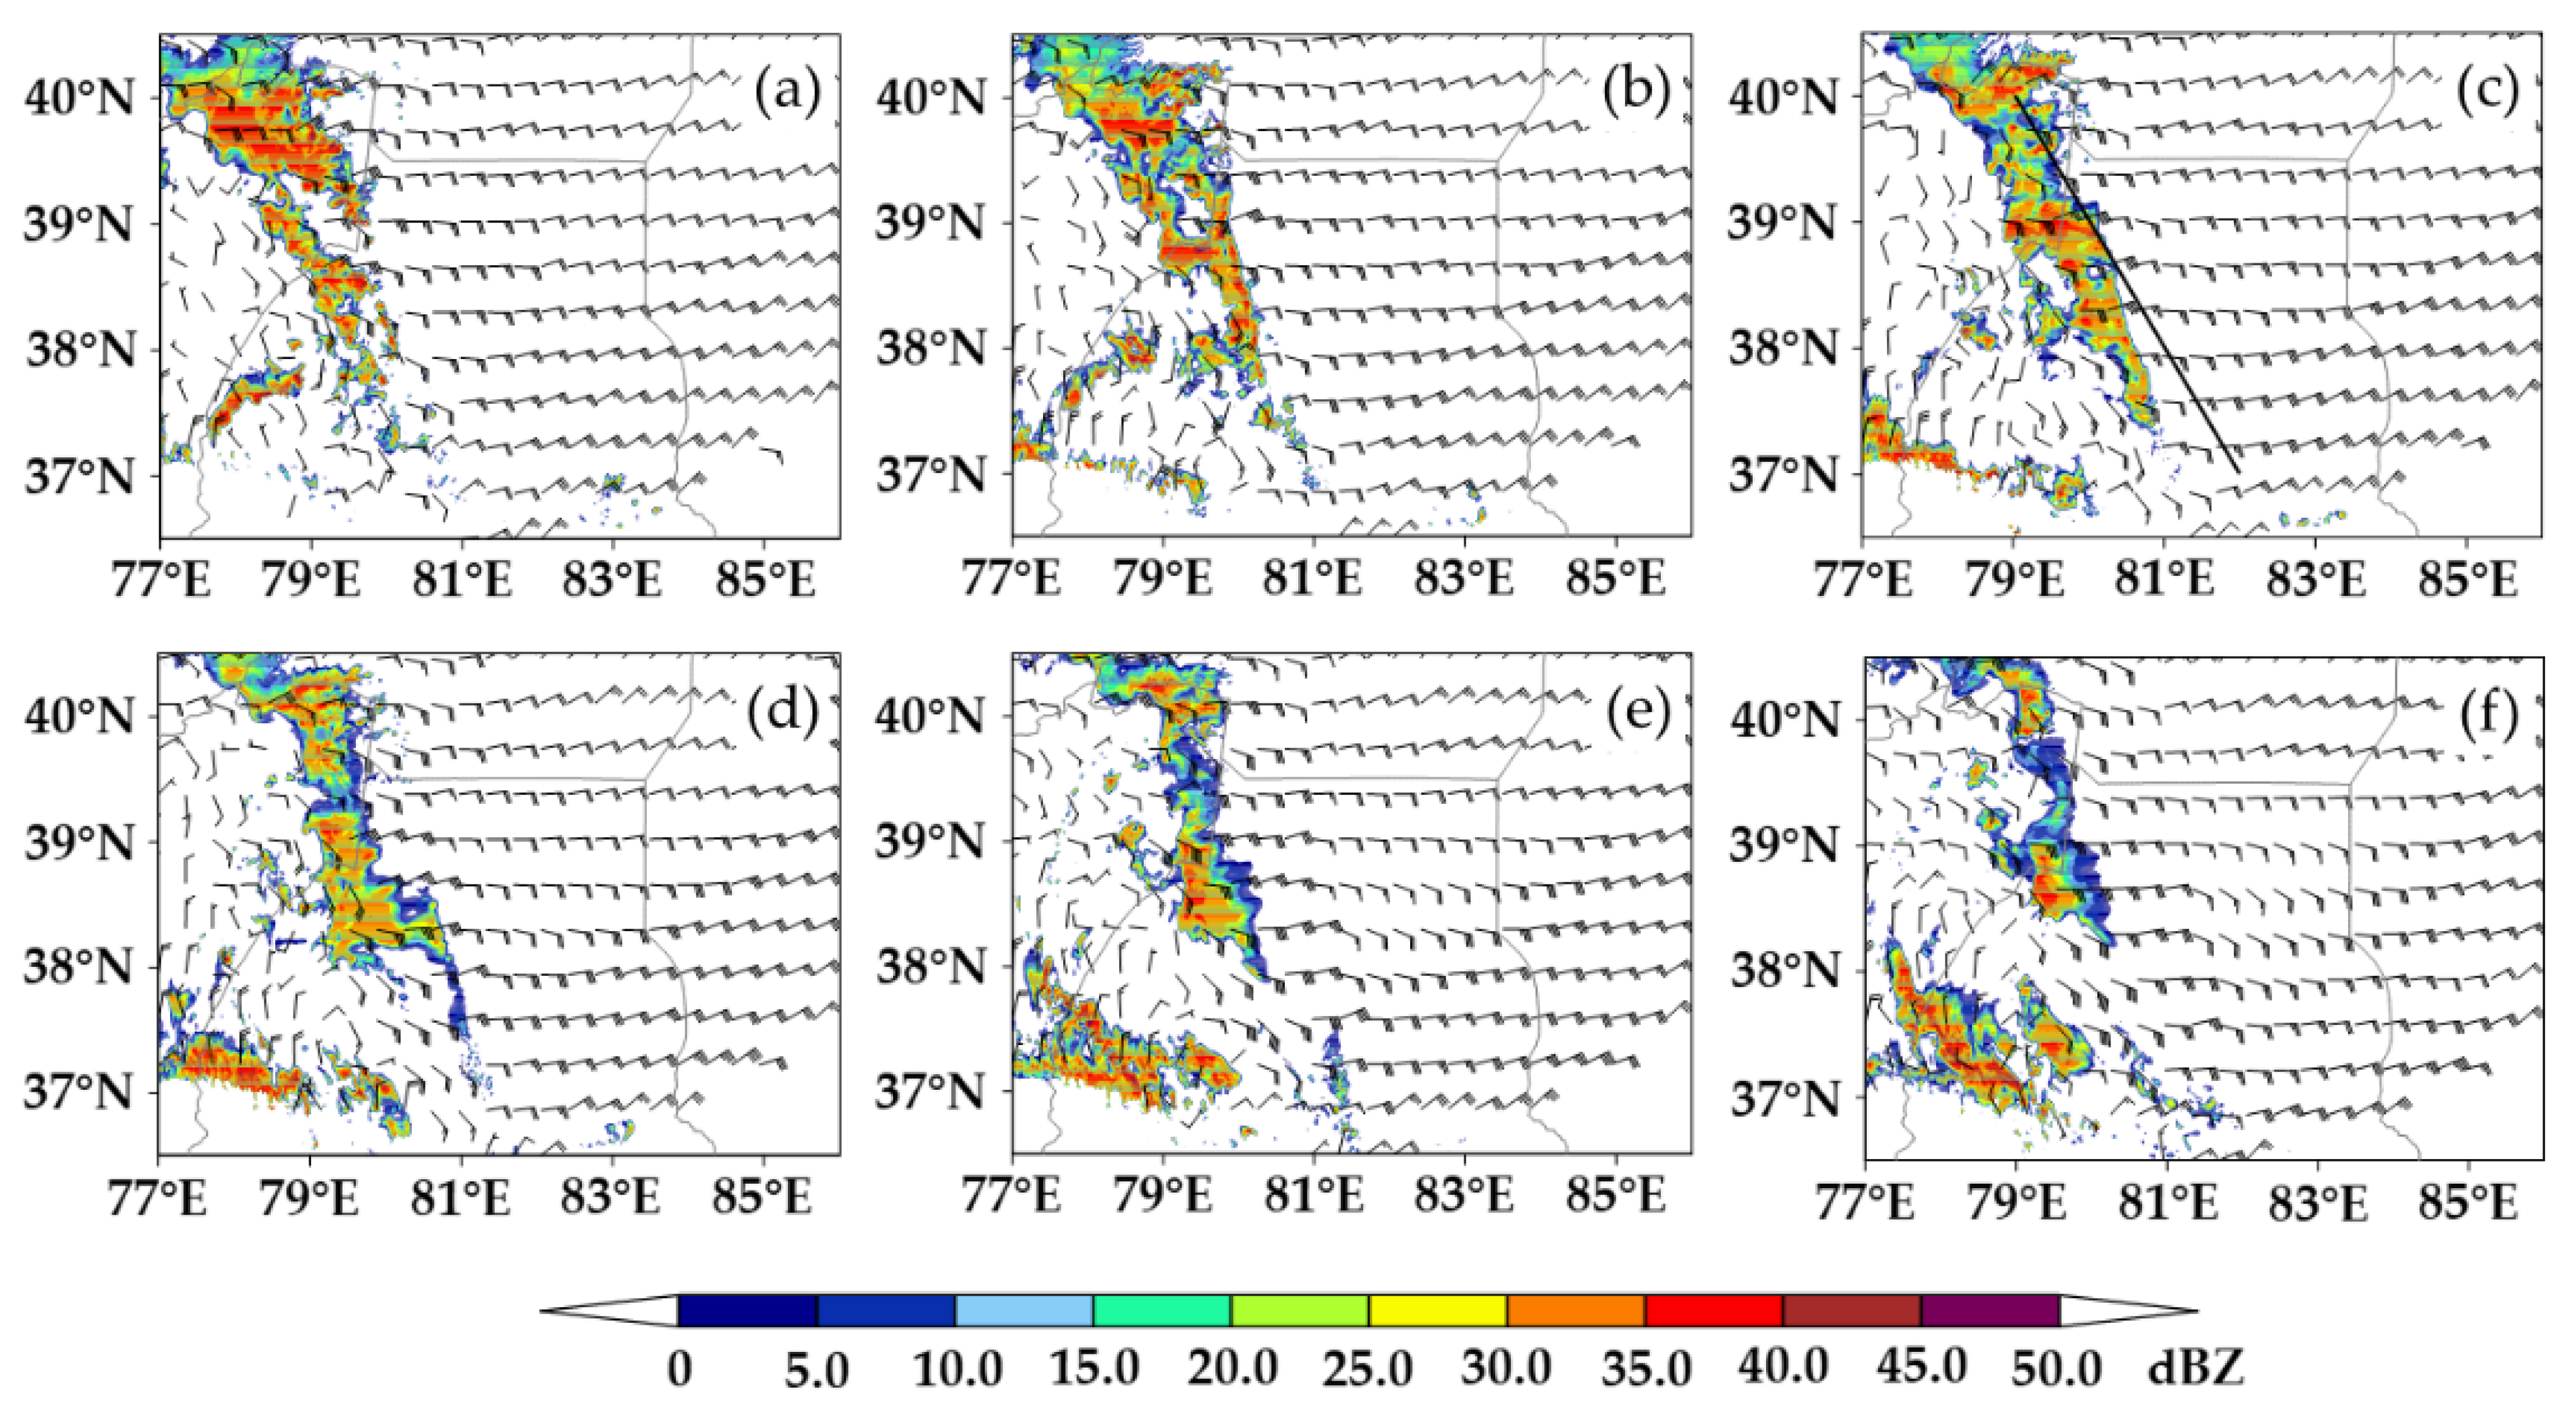
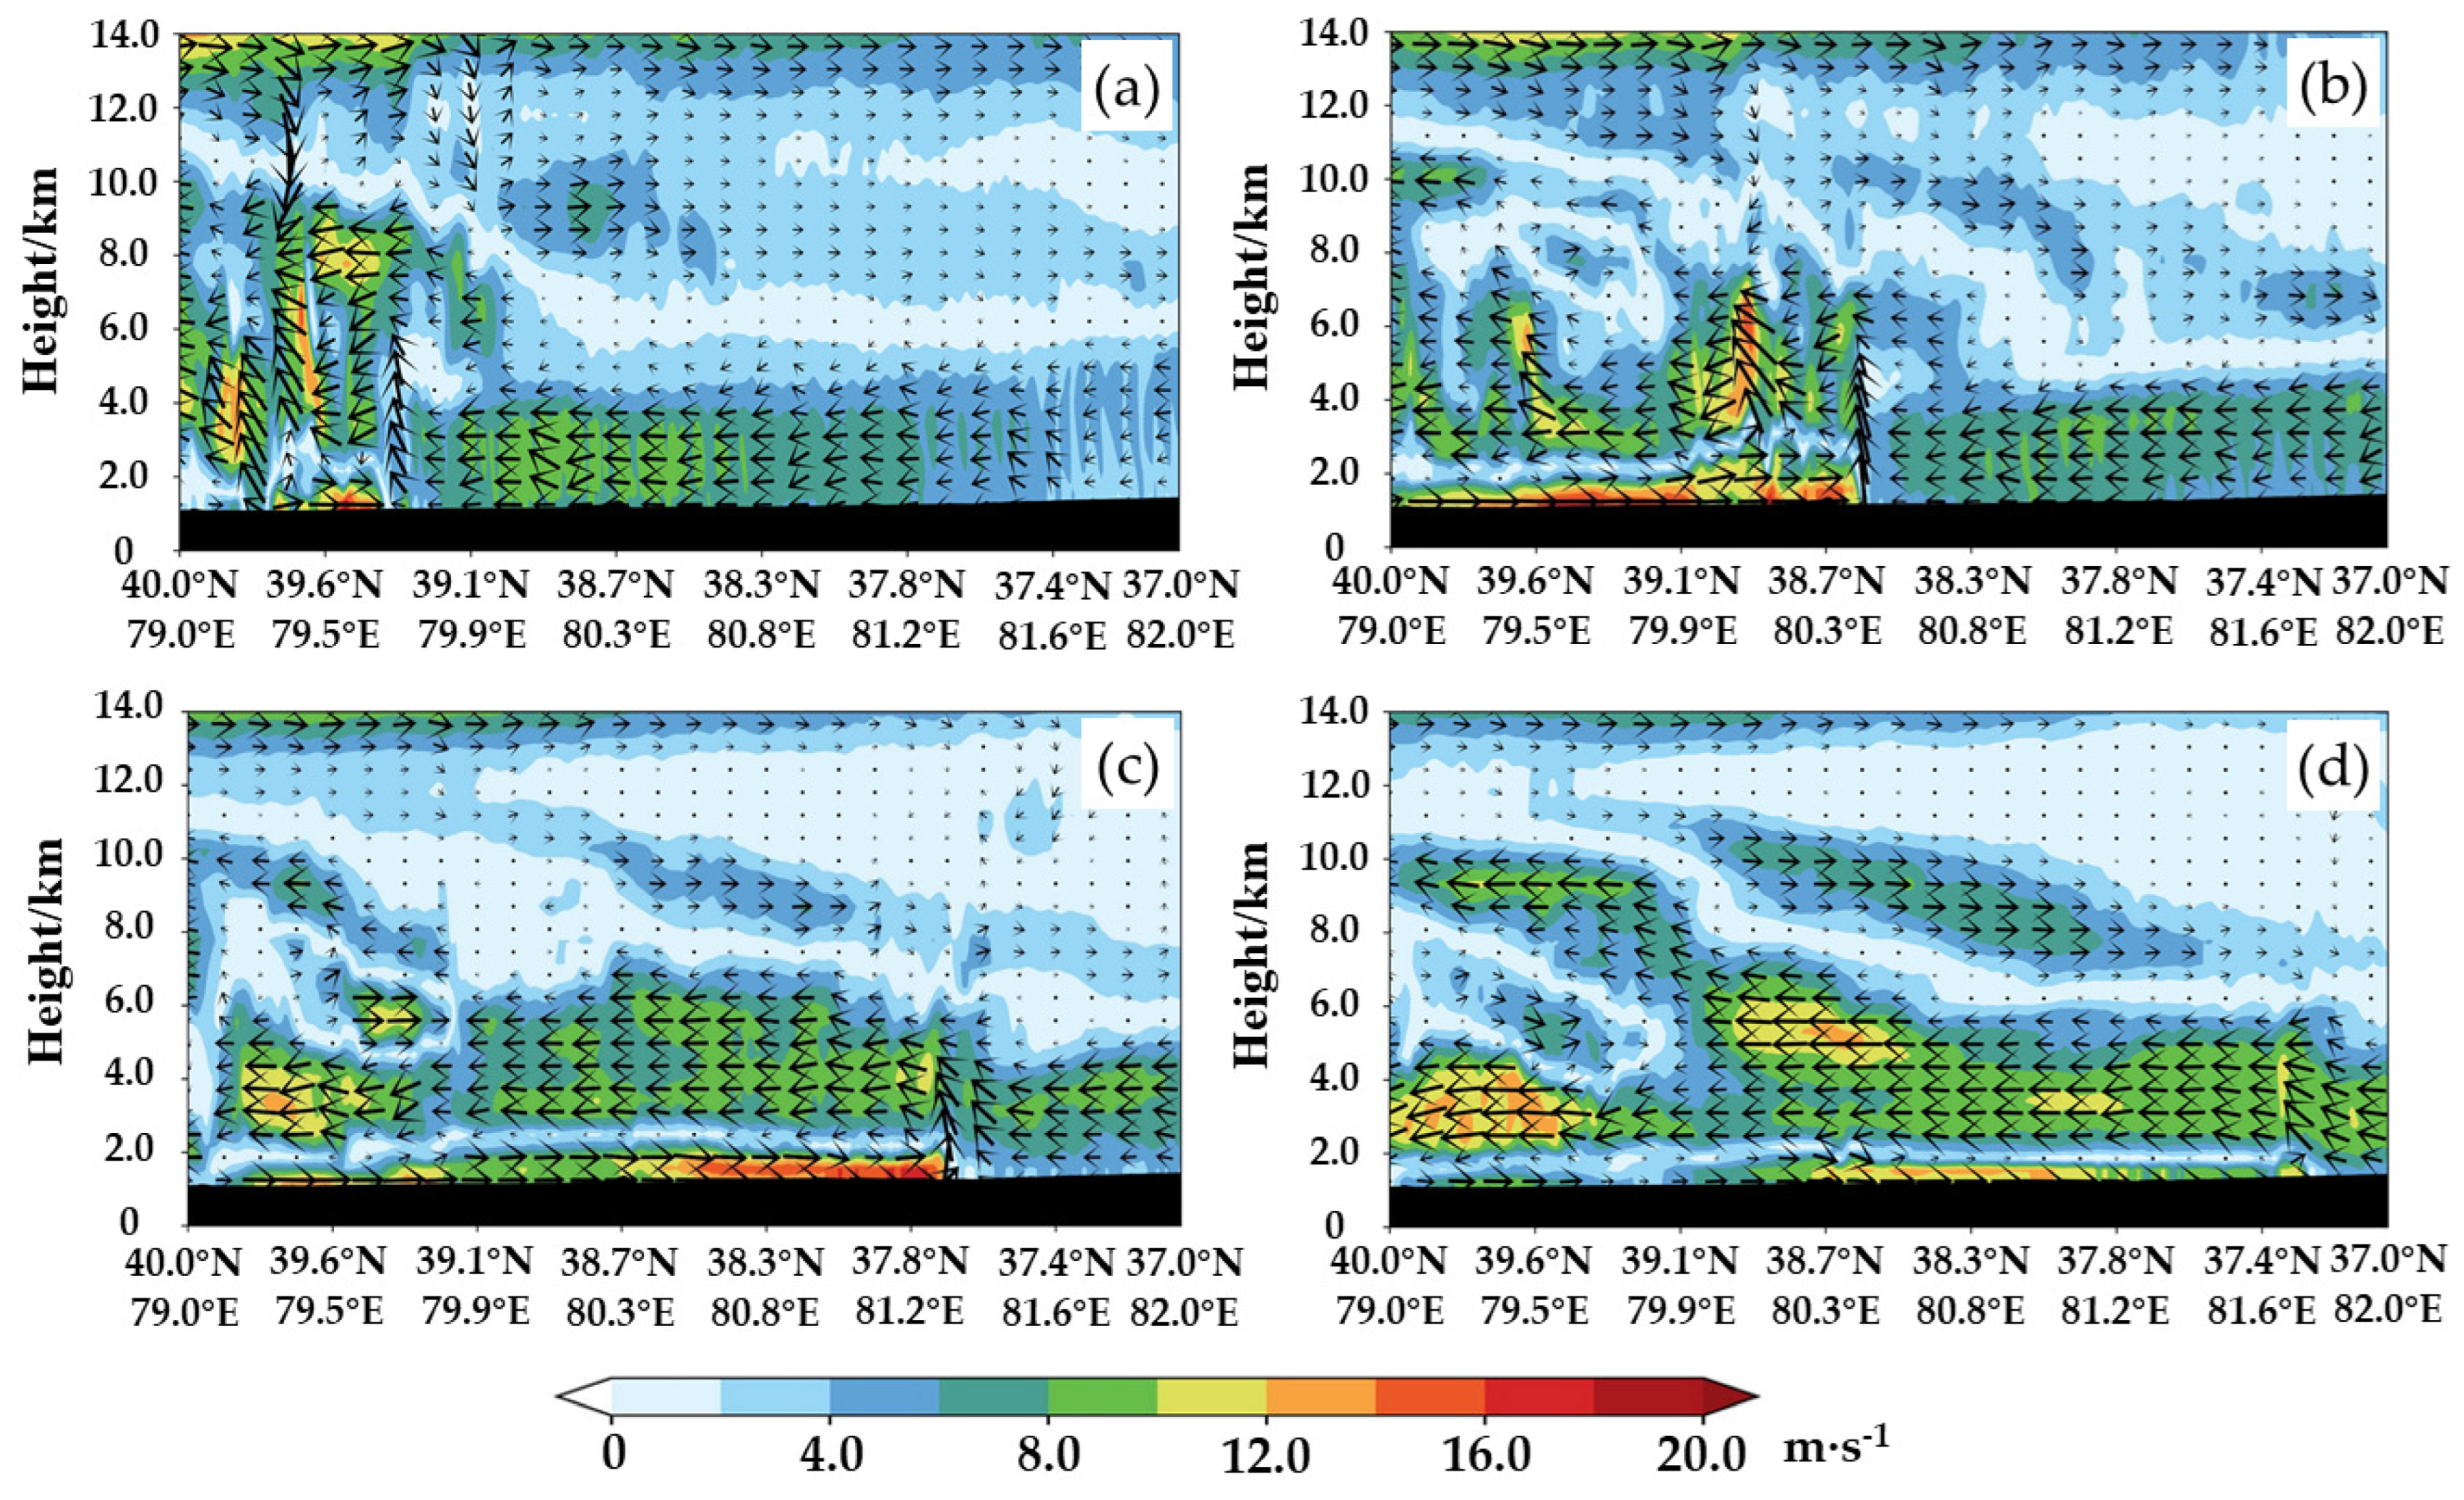
3.3.1. Radar Echoes, Shear Lines, and Evolution of Low-Level Jet

Figure 10 presents the simulated hourly wind fields and radar echoes during the period from 1000 UTC to 1500 UTC on 15 June 2021. In the early stage of convection (Figure 10a,b), a flat easterly belt appears on the 700 hPa wind field, and, meanwhile, the simulated strong echoes are mainly located at the junction of Kashgar and Hotan and extend southeastward. From 1200 UTC to 1300 UTC on 15 June (Figure 10c,d), the simulated radar echoes appeared in two bands over the central and southern parts of Hotan, with the central intensity reaching 35.0–40.0 dBZ. During this period, a strong northeasterly wind belt and southeasterly wind (with maximum wind speed exceeding 30.0 m·s−1) emerged on the 700 hPa wind field, forming a northwest–southeast-oriented horizontal shear. This corresponds to a strong convergence line, providing highly favourable mesoscale environmental conditions for the development and movement of convection. From 1400 UTC to 1500 UTC on 15 June (Figure 10e,f), the simulated radar echoes gradually weaken and shift northwestward, accompanied by a decrease in precipitation intensity.
Studies have shown that the location and intensity of the upper-level jet stream affect the weather and climate variability in surrounding areas [58,59,60] and provide favourable conditions for the occurrence and development of heavy rainfall [61,62]. During this precipitation process, a stable upper-level jet is observed at 200 hPa upstream (Figure 3a and Figure 10). At 1000 UTC on 15 June 2021, strong downdrafts exist below 12 km at the leading edge of the upper-level jet stream, while a stable low-level jet stream appears at 2 km (Figure 11a), coinciding with the onset of weak precipitation (Figure 2c). At 1200 UTC, momentum rapidly penetrates through the centre of the jet stream (20.0 m·s−1) at an altitude of 6 km, and the low-level jet stream continues to strengthen. The centre of the jet stream (15.0 m·s−1) drops to approximately 1 km, forming an ultra-low-level jet. The convergence of northwesterly and southeasterly wind occurs at around 38.6°N (Figure 11b), resulting in a strong ascending motion and further triggering precipitation. At 1400 UTC, the ultra-low-level jet continues to develop, with the central wind speed increasing to about 20.0 m·s−1. Concurrently, the convergence line persists and shifts southwestward to 37.7°N, enabling the heavy precipitation to continue (Figure 11c). At 1600 UTC, the low-level wind speed slows down, the convergence line disappears, and the precipitation gradually weakens (Figure 8c and Figure 11d). Before the onset of precipitation, three jet streams at different altitudes (Figure 4c) act in concert to transport warm and humid airflow continuously deep into the rainstorm area (Figure 5). The enhancement of wind speed along the convergence line plays a crucial role in triggering the mesoscale system responsible for this heavy-rainfall event (Figure 11).

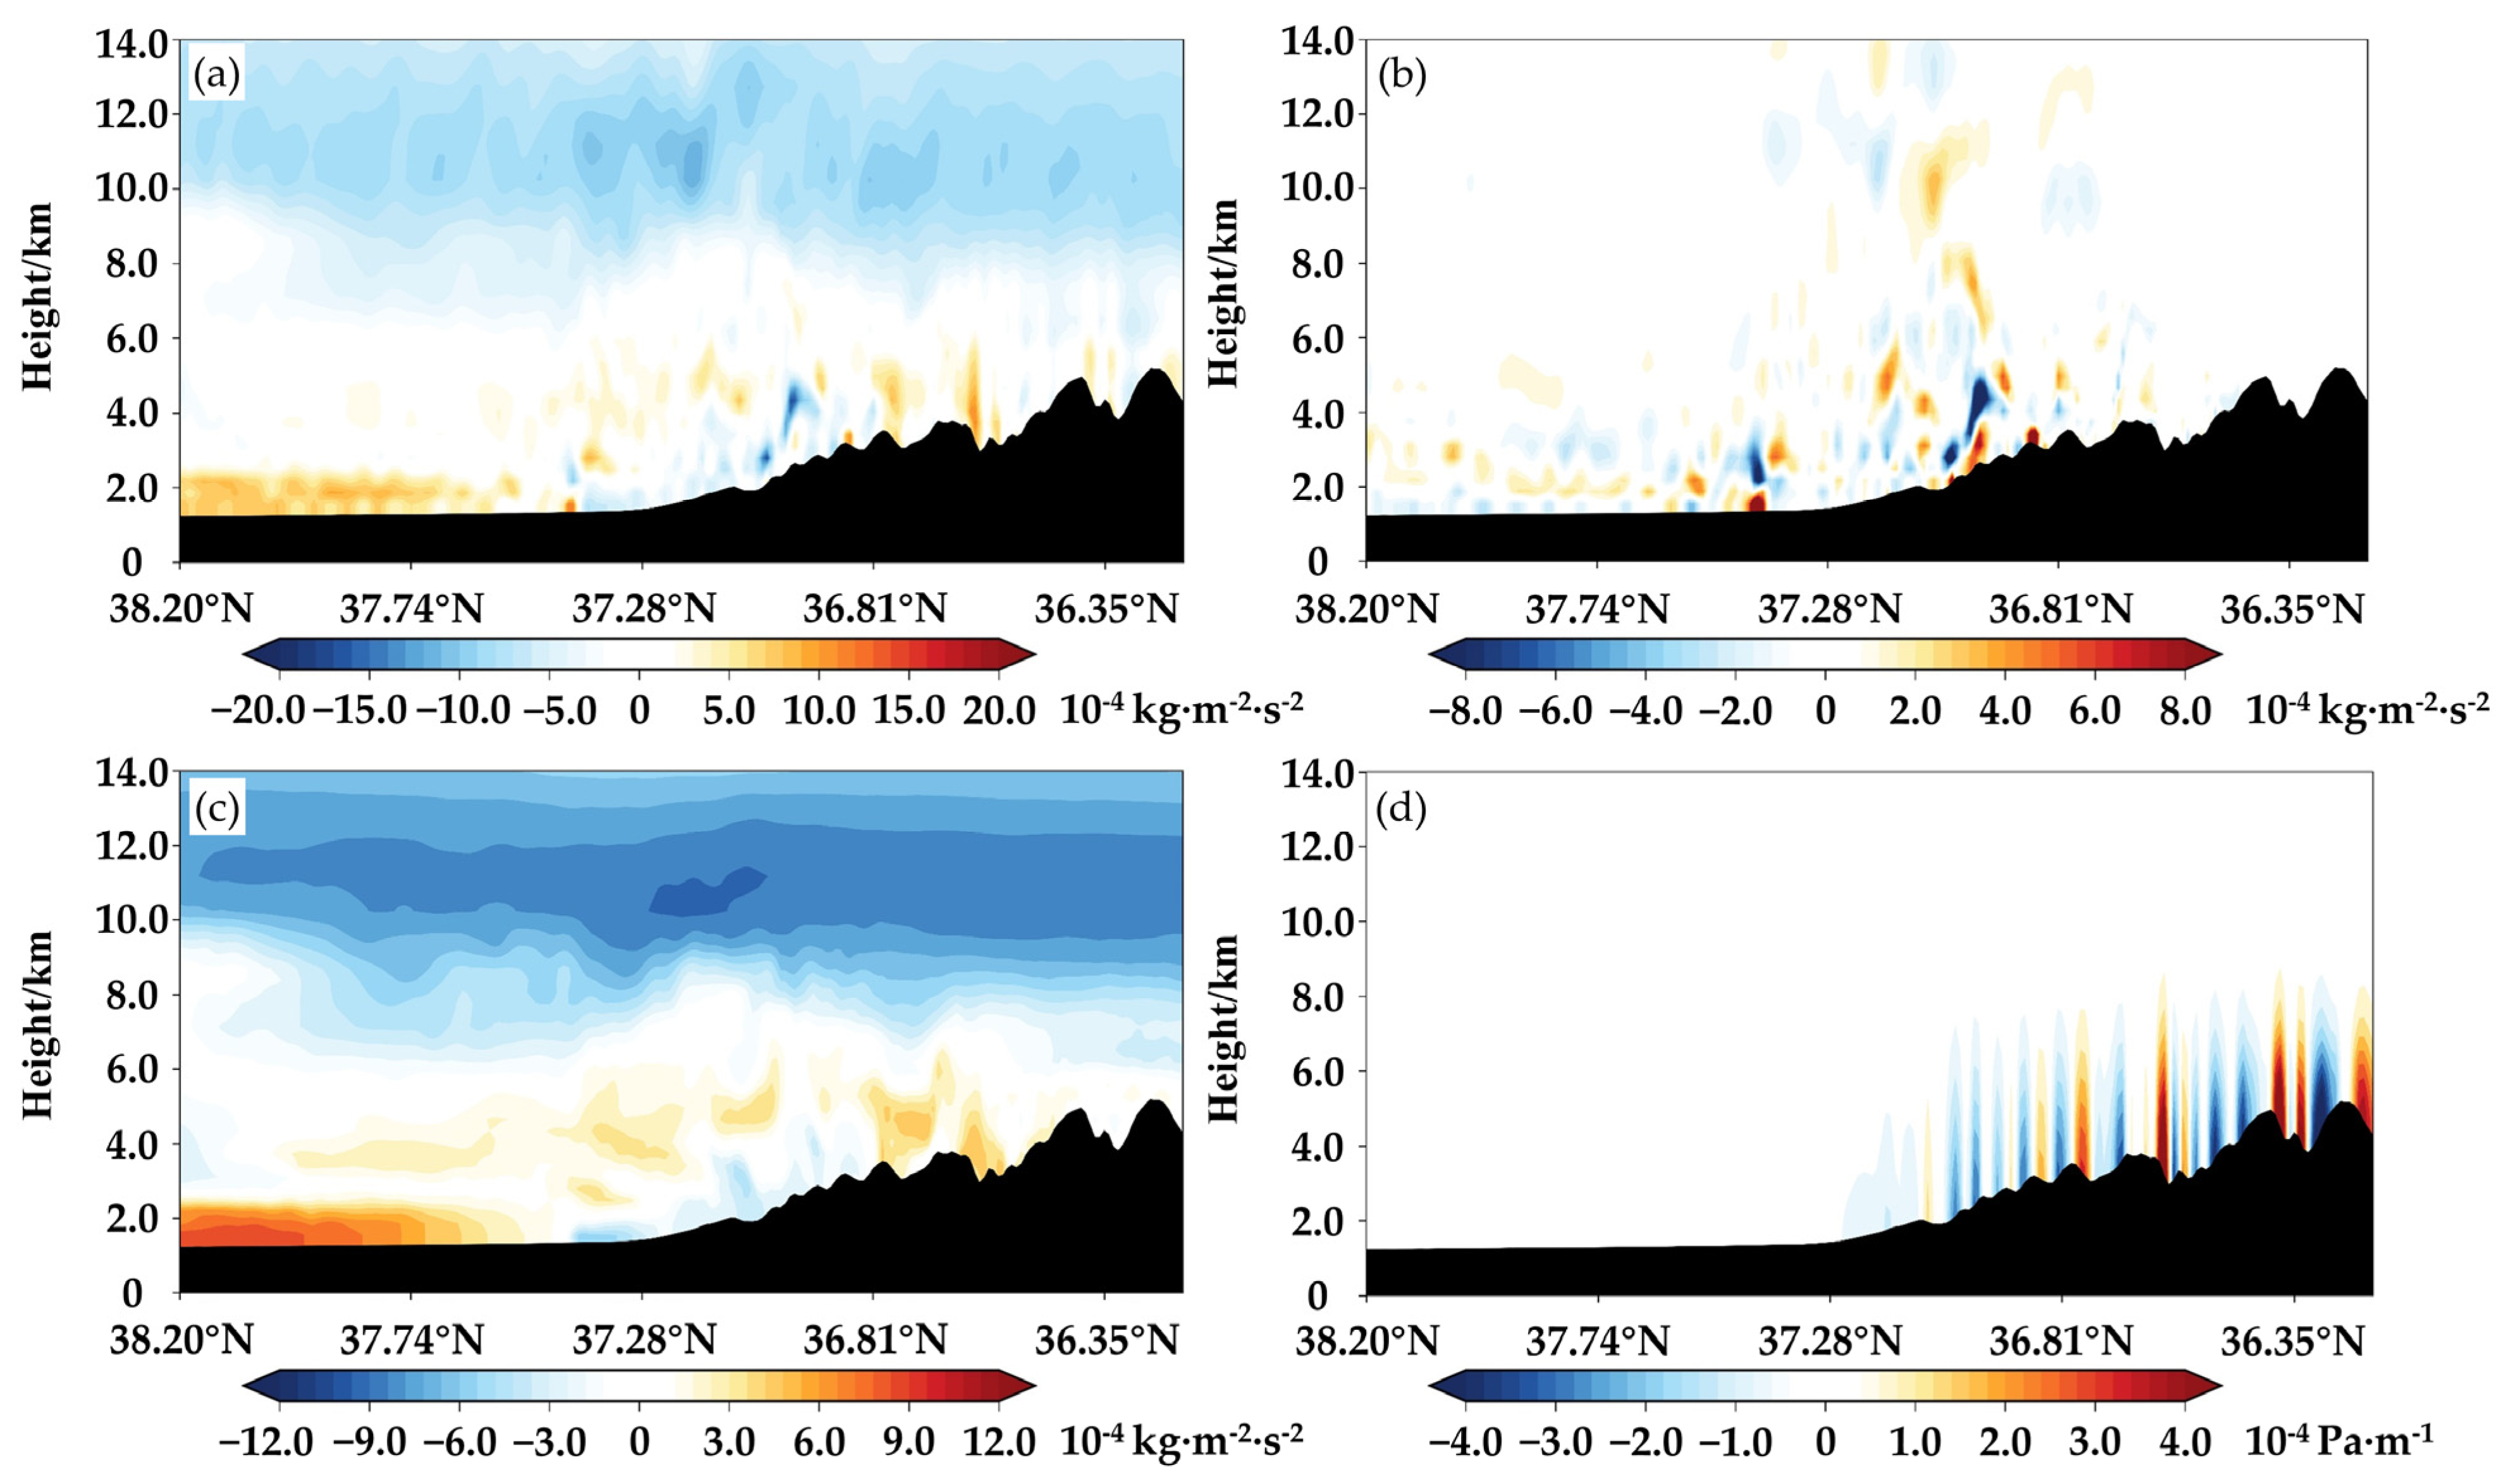
3.3.2. Momentum Budget Analysis

The variation in jet stream intensity is closely linked to momentum transport [63]. Zhang et al. [64] derived a momentum equation applicable to mesoscale convective systems and pointed out that most severe weather events, such as heavy precipitation, are often accompanied by momentum transport. Local changes in momentum caused by both downward momentum transport and orographic effects are conducive to the strengthening of surface wind. To analyze the impact of momentum transport on low-level wind convergence further, the momentum equation is applied, which is expressed as follows [59,64]:
t ρ u = · v ρ u + f ρ v p x
t ρ v = · v ρ v + f ρ u p y
where, v = u , v , w , u , v and w denote the wind velocity in the x , y and z directions, respectively. f represents the Coriolis parameter, p denotes the air pressure, ρ represents the density, and = / x i + / y j + / z k indicates the three-dimensional spatial gradient operator. ρ u and ρ v represent the momentum components in the zonal (x) and meridional (y) directions, respectively. Since this convective process is predominantly meridional and the low-level wind field is affected by the convergence of southerly wind and northerly wind, the subsequent analysis focuses on the variation and transport characteristics of meridional momentum ( ρ v ), as expressed by Equation (2).
Figure 12 presents the vertical distribution of the divergence term of the meridional momentum flux [ · v ρ v ], the Coriolis force term ( f ρ u ), and the meridional pressure gradient term ( p / y ) on the right-hand side of Equation (2) along 78.92°E (point D). At 1300 UTC on 15 June, heavy precipitation mainly occurred within the range of 36.81°N–37.28°N. The three forcing terms in Equation (2) are mainly distributed below 10 km above the rainfall area. The divergence term of the momentum flux plays a leading role in the local change in meridional momentum flux, which is related to the substantial changes in meridional wind speed in this region.
On the northern side of the rainfall area, the divergence term of the momentum flux presents a positive large-value area in the near-surface layer (Figure 12b), with the central intensity reaching 8.0 × 10⁻⁴ kg·m−2·s−2, indicating strong surface wind convergence in the rainfall area. A negative large-value area appears at the altitude of 2–4 km, with the central intensity reaching −8.0 × 10⁻⁴ kg·m−2·s−2. This is primarily attributed to the downward propagation of wind from the jet stream core and the deepening of the trough, both of which intensify the meridional wind speed and convergence. The upper-level positive centre is influenced by both the divergence term and the Coriolis force term, which may be related to the intensity and path of the low-level jet. On the southern side of the rainfall area, a similar pattern is observed, i.e., a positive large-value area below 2 km near the surface and a negative large-value area within the altitudes of 2–4 km, which may be caused by the convergence effects induced by orographic uplift. In summary, the divergence of momentum flux dominates the local change in meridional momentum below 4 km in the rainfall area, indicating that the downward transport of meridional momentum plays a crucial role in low-level wind convergence and tangential changes.
The meridional–vertical cross-sections illustrate the evolution of meridional momentum ( ρ v ) during this precipitation process (Figure 13). During the period from 1100 UTC to 1300 UTC (Figure 13a,b), a large-value area of northerly momentum dominates the near-surface layer, with the central intensity exceeding −12.0 kg·m−2·s−1, situated to the north of the main precipitation area (36.81°N–37.28°N). Simultaneously, strong meridional momentum flux ( v ρ v , w ρ v ) is transported southward in the near-surface layer, with peak intensity exceeding 100.0 kg·m−1·s−2. Under the effect of orographic uplift, the near-surface momentum flux tilts upward. Strong meridional momentum appears in the middle layer of 3–6 km, which converges with the near-surface momentum flux at a range of 36.9°N–37.1°N (Figure 13b) and subsequently propagates northward. Furthermore, the downward momentum flux associated with northerly wind is transported below 6 km in the troposphere near the precipitation centre (point D; 37.02°N), merging with the horizontal momentum flux in the near-surface layer. This enhances the near-surface northerly momentum, thereby leading to an increase in northerly wind near the surface layer. The intersection of northerly and southerly momentum at lower levels enhances the convergence of wind speed and wind direction along the low-level shear line. Additionally, the upward transport of northerly momentum strengthens the jet stream, thereby enhancing the upper-level pumping effect. Under the combined effect of the low-level wind convergence shear and the orographic uplift, the warm and humid airflow at lower levels is lifted to higher altitudes, further triggering heavy precipitation. At 1500 UTC (Figure 13c), both meridional momentum and momentum flux weaken, accompanied by a gradual decrease in short-term heavy precipitation intensity (Figure 8c).

4. Discussion

This study investigates the large-scale circulation background, water vapour transport conditions, dynamical and thermodynamic structures, and momentum transport associated with an extreme precipitation event that occurred on the northern slope of the Kunlun Mountains from 14 to 17 June 2021. On this basis, this study explores the mechanisms underlying the occurrence and development of this extreme precipitation event, providing a reliable reference for future research on such extreme precipitation on the northern slope of the middle Kunlun Mountains.
Based on the ERA5 reanalysis data, this study elucidates the circulation background of this precipitation event and reveals the three-dimensional structure of the mesoscale system involved. Under the favourable large-scale circulation pattern of “two ridges and one trough”, the upper-level South Asian high exhibited two centres, with the one over the eastern Tibetan Plateau being stronger than the one over the Iranian Plateau. The formation and development of the Central Asian vortex played a key role in driving this rainfall process. The extreme precipitation occurred near the entrance region of the 200 hPa upper-level jet, and the 500 hPa southerly airflow, 700 hPa shear line, and 850 hPa easterly jet interacted with each other. The coupling of strong upper-level divergence with low-level convergence facilitated the development of atmospheric vertical motion, providing favourable dynamical conditions for triggering this rainstorm event; this is consistent with the conclusion obtained by predecessors in the study of rainstorms [2,25,26,27,28]. The heavy-rainfall area was located at the forefront of the easterly jet and the strongest convergence zone, accompanied by strong water vapour convergence and ascending motion, providing critical conditions for the triggering of this convection process and the maintenance of precipitation [58,59,60].
Compared to previous studies on heavy rainfall on the northern slope of the Kunlun Mountains [2,13,22,23,24,25,26,27,28], the difference with our study is that we conduct a numerical simulation experiment that assimilates a variety of observational data. This experiment effectively reproduces the extreme precipitation process on the northern slope of the middle Kunlun Mountains, producing relatively accurate results in terms of the centre position, intensity, and occurrence time of the rainstorm [59]. Additionally, it accurately captures the vertical structure and characteristics of the atmosphere over the Hotan sounding station [17]. The convergence of cold and warm advections at 500 hPa triggers the release of convective instability energy, further resulting in the formation of precipitation. Subsequently, the triggering mechanism of this rainstorm is analyzed in detail, focusing on radar echo characteristics, shear lines, the evolution of the low-level jet, and momentum balance [59,64]. The downward transport of momentum from the upper to lower levels strengthens the development and ascending motion of the low-level jet. Meanwhile, the convergence of meridional momentum transport intensifies the low-level wind convergence shear. The convective development along the shear line, together with the orographic uplift by the northern slope of the middle Kunlun Mountains, jointly contribute to the occurrence of this extreme precipitation. The numerical simulation results in this study complement the study by Li et al. [60], which does not incorporate numerical simulations or a detailed analysis of the triggering mechanisms for this event.

5. Conclusions

In the context of global warming, heavy rainfall events on the northern slope of the Kunlun Mountains are becoming increasingly frequent [18,19,20,21]. This study utilizes the European Centre for Medium-Range Weather Forecasts Reanalysis-5 (ERA5) data, observational data in the Xinjiang (XJ) region, and high-resolution Weather Research and Forecasting (WRF) model simulations to investigate an extreme rainfall event on the northern slope of the middle Kunlun Mountains that occurred from 14 to 17 June 2021. The main conclusions are as follows.
This extreme precipitation event is characterized by large accumulated precipitation, a high number of rainstorm-affected stations, pronounced locality, and exceptionally high degree of extremity, with the maximum rainfall centre recording 121.6 mm. Under the circulation pattern of “two ridges and one trough”, the South Asian high exhibited a bimodal structure. At 200 hPa, the western part of southern XJ was located near the rupture of the upper-level jet stream and the entrance region of the eastern jet, where the maximum wind speed exceeded 40.0 m·s−1. At 1200 Coordinated Universal Time (UTC) on 15 June, a stable trough was found at 500 hPa extending from Siberia to Central Asia, accompanied by a distinct shear line at 700 hPa and an easterly jet stream of 12.0–16.0 m·s−1 at 850–700 hPa over the northern slope of the Kunlun Mountains. At 0000 UTC on 16 June, the easterly jet stream reached its peak intensity at a wind speed of 20.0 m·s−1. The formation and development of the Central Asian vortex, low-level shear lines, and upper- and lower-level jet streams were key synoptic systems contributing to the formation of this extreme precipitation event.
In the early stage of this precipitation process, water vapour for this rainstorm event was continuously transported into the basin through low troughs or short waves, and the strong water vapour flux centre moved from east to west, with the central intensity reaching 200.0 kg·m−1·s−1. Water vapour was transported along the northeast, northwest, and south paths, with southerly airflow prevailing at 500 hPa, northeasterly airflow at 700 hPa, and northwesterly and northeasterly airflows at 850 hPa. At 1200 UTC on June 15th, the convergence of northeasterly and northwesterly winds at 850 hPa resulted in strong water vapour flux convergence, with the central intensity reaching 10.0 g·cm−1·hPa−1·s−1. Correspondingly, the rainfall area was located in the strong convergence zone. Meanwhile, a substantial difference between the cold and warm advections was observed at 850 hPa, with the warm advection near the rainfall centre exceeding 30.0 × 10⁻⁵ °C·s−1. From 0000 UTC to 1200 UTC on 15 June, warm advection dominated 850 hPa, while cold advection prevailed at 800–700 hPa over Luopu station. The superimposition of upper-level cold advection and low-level warm advection was conducive to the formation of unstable atmospheric stratification. At 1200 UTC on 15 June, the vertical velocity reached its maximum, with the central intensity reaching 4.0 Pa·s−1. Meanwhile, a strong ascending motion extended from the surface up to 400 hPa, accompanied by strong water vapour convergence and an ascending motion in the convergence zone, serving as a crucial condition for the initiation of convection and the maintenance of precipitation.
Numerical simulation results reveal that, during the onset and development of convection, wind shear is evident at 700 hPa, with the maximum wind speed exceeding 30.0 m·s−1, accompanied by strong radar echoes, with the central intensity reaching 35.0–40.0 dBZ. At the altitude of 6 km, the jet stream centre reaches 20.0 m·s−1, accompanied by strong downdrafts. As the jet stream centre descends to 1 km, an ultra-low-level jet is formed with the central intensity of approximately 15.0 m·s−1, providing highly favourable mesoscale environmental conditions for convective development. In terms of the momentum budget, the momentum flux divergence term plays a dominant role in the local change in meridional momentum, with the central intensity of the positive and negative large-value areas reaching ±8.0 × 10⁻⁴ kg·m−2·s−2, respectively. The downward transport of meridional momentum assumes paramount importance in the low-level wind convergence and tangential variations. Meanwhile, strong north-to-south meridional momentum flux appears near the surface, with the peak intensity exceeding 100.0 kg·m−1·s−2. The near-surface momentum flux tilts upward along the terrain, thereby strengthening the low-level jet and the upper-level pumping effect. As a result, the low-level warm and humid airflow is lifted to higher altitudes, further triggering this heavy rainfall.
However, this study also has certain limitations. Some deviations remain in the simulated location and intensity of this process, which may result from model parameter configuration, the initial field, complex terrain, and assimilated observational data [36,37,38,44,45]. Additionally, although this study performs a diagnostic analysis and simulation experiment on this extreme rainstorm event over the northern slope of the middle Kunlun Mountains and draws several conclusions, it does not explore the role of cloud microphysics involved in this precipitation process, and the impact of the northern slope of the middle Kunlun Mountains on precipitation requires further investigation [30]. Further work will focus on these aspects to provide a more robust basis for improving precipitation forecasting and early warning in this region.

Author Contributions

Conceptualization, X.Y.; data curation, A.A. and Q.L.; funding acquisition, X.Y.; methodology, M.L. and J.Y.; writing—original draft, C.J.; writing—review and editing, C.J.; software, W.S. and Z.L.; validation, M.L., X.Y., Y.W., J.Y. and W.S.; formal analysis, C.J.; investigation, M.L.; data curation, Y.W. and A.A. All authors have read and agreed to the published version of the manuscript.

Funding

This work was funded by the Tianshan Talent Training Program (2023TSYCCX0077), the Natural Science Foundation of Xinjiang Uygur Autonomous Region (2022D01B231, 2022D01D86), the Open Grants of the State Key Laboratory of Severe Weather (2023LASW-B03), and the Guiding Planning Project of Xinjiang Meteorological Bureau (YD2024047).

Data Availability Statement

The data in this study can be obtained from C.J. (jucx@idm.cn) upon request.

Acknowledgments

I would like to express my deepest gratitude to Xia Yang of Xinjiang Meteorological Observatory for her insightful guidance and constructive suggestions. I am also grateful to my colleagues in the Institute of Desert and Meteorology of China Meteorological Administration for their insightful discussions and camaraderie. Additionally, all authors are grateful to the WRF development community for the programme’s maintenance and update.

Conflicts of Interest

The authors declare no conflicts of interest.

References

  1. Tao, S.Y. Heavy Rainfall in China; Science Press: Beijing, China, 1980; p. 225. [Google Scholar]
  2. Zhang, J.L.; Yang, X.; Shi, J.J. Analysis of the influence of the Qinghai-Xizang Plateau weather system on a rare rainstorm process on the northern slope of Kunlun Mountain. Plateau Meteor. 2021, 40, 1002–1011. [Google Scholar]
  3. Kunkel, K.E.; Karl, T.R.; Brooks, H.; Kossin, J.; Lawrimore, J.H.; Arndt, D.; Bosart, L.; Changnon, D.; Cutter, S.L.; Doesken, N.; et al. Monitoring and understanding trends in extreme storms: State of knowledge. Bull. Am. Meteorol. Soc. 2013, 94, 499–514. [Google Scholar] [CrossRef]
  4. Duan, W.; He, B.; Takara, K.; Luo, P.; Hu, M.; Alias, N.E.; Nover, D. Changes of precipitation amounts and extremes over Japan between 1901 and 2012 and their connection to climate indices. Clim. Dyn. 2015, 45, 2273–2292. [Google Scholar] [CrossRef]
  5. Yang, L.M. Climate change of extreme precipitation in Xinjiang. Acta Geogr. Sin. 2003, 58, 577–583. [Google Scholar]
  6. Dai, X.G.; Ren, Y.Y.; Chen, H.W. Multi-Scale feature of climate and climate shift in Xinjiang over the past 50 years. Acta Meteo. Sin. 2007, 65, 1003–1010. [Google Scholar]
  7. Yao, J.Q.; Chen, J.; Zhou, G.X.; Mao, W.Y. Reasearch on heavy rainfall in Southern Xinjiang: Scientific knowledge and research advances. Desert Oasis Meteorol. 2024, 18, 1–8. [Google Scholar]
  8. Jin, C.; He, Q.; Huang, Q. A review on rainstorm research in southern Xinjiang. Trans. Atmos. Sci. 2023, 46, 82–96. [Google Scholar]
  9. Chen, Y.; Deng, H.; Li, B.; Li, Z.; Xu, C. Abrupt change of temperature and precipitation extremes in the arid region of Northwest China. Quat. Int. 2014, 336, 35–43. [Google Scholar] [CrossRef]
  10. Wang, B.; Zhang, M.; Wei, J.; Wang, S.; Li, S.; Ma, Q.; Li, X.; Pan, S. Changes in extreme events of temperature and precipitation over Xinjiang, northwest China, during 1960–2009. Quat. Int. 2013, 298, 141–151. [Google Scholar] [CrossRef]
  11. Li, H.H.; Min, Y.; Li, A.B.; Li, R.Q. Comparative analysis of on water vapour characteristics of two extreme rainstorms in the north slope of Kunlun Mountains. Arid. Land Geogr. 2022, 45, 715–724. [Google Scholar]
  12. Zhang, J.L.; Li, N.; Qing, H.; Li, J.G.; Liu, J.; Liu, W.; Mikribanu, E. The observational analysis and water vapour characteristics of a rainstorm in Xinjiang. Torrential Rain Disasters 2016, 35, 537–545. [Google Scholar]
  13. Huang, Y.; Yu, X.D.; Chen, T.Y.; Tang, P. Analysis of conceptual models and ambient parameter of short time severe rainfall in South Xinjiang. Meteor. Mon. 2018, 44, 1033–1041. [Google Scholar]
  14. Zhuang, X.C.; Li, B.Y.; Qing, R.; Li, R.Q.; Zhang, Y.H.; Bai, S.Z. Analysis on the causes of an extreme rainstorm in the eastern Xinjiang. Plateau Meteor. 2020, 39, 947–959. [Google Scholar]
  15. Lü, X.S.; Zhou, Y.M.; Yu, X.J.; Yu, B.X.; Wang, X. Temporal and spatial variation characteristics of rainstorm flood disaster loss in Xinjiang during 1961–2019. Desert Oasis Meteorol. 2021, 15, 42–49. [Google Scholar]
  16. Wang, X.Q.; Wang, X. Spatial distribution and temporal variation characteristics of rainstorm flood disasters with different intensities in southern Xinjiang from 1980 to 2019. J. Glaciol. Geocry 2021, 43, 1818–1828. [Google Scholar]
  17. Tang, P.; Huang, Y.; Zhang, L.; Chen, T.Y.; Yang, X.F. Causation analysis of an extreme torrentaial rain on the north slope of middle Kunlun Mountain. Desert Oasis Meteorol. 2022, 16, 34–41. [Google Scholar]
  18. Zhao, D.S.; Gao, X.; Wu, S.H.; Zheng, D. Trend of climate variation in China from 1960 to 2018 based on natural regionalization. Adv. Earth Sci. 2020, 35, 750–760. [Google Scholar]
  19. Lu, S.; Hu, Z.Y.; Wang, B.P.; Qin, P.; Wang, L. Spatio-temporal Patterns of Extreme Precipitation Events over China in Recent 56 Years. Plateau Meteor. 2020, 39, 683–693. [Google Scholar]
  20. Wang, C.H.; Zhang, S.N.; Zhang, F.M.; Li, K.C.; Yang, K. On the increase of precipitation in the Northwestern China under the global warming. Adv. Earth Sci. 2021, 36, 980–989. [Google Scholar]
  21. Yang, X.; Zhou, H.K.; Xu, T.T.; Hua, Y. Comparative analysis of the fine characteristics of different rainstorms in southern Xinjiang during summer. Arid Zone Res. 2021, 38, 747–756. [Google Scholar]
  22. Chen, D.D.; Dai, Y.J. Characteristics and analysis of typical anomalous summer rainfall patterns in Northwest China over the last 50 years. Chin. J. Atmos. Sci. 2009, 33, 1247–1258. [Google Scholar]
  23. Yang, L.M.; Zhang, Q.Y. Surface latent heat flux characteristics over Tibetan Plateau and circulations of summer precipitation anomalies in south Xinjiang. Plateau Meteor. 2007, 26, 435–441. [Google Scholar]
  24. Lu, X.; Zhao, Y.; Wang, T.Z. Analysis on the circulation differences of summer rainfall over Xinjiang. Desert Oasis Meteorol. 2021, 15, 84–91. [Google Scholar]
  25. Zhang, Y.H.; Li, H.Y.; Lin, X.L.; Abulimiti; Yu, B.X. Analysis of continuous rainstorm circulation background and the dynamic process of synoptic scale in west of southern Xinjiang. Meteor. Mon. 2015, 41, 816–824. [Google Scholar]
  26. Zhou, X.Y.; Jia, J.; Liu, G.Q.; Qiu, H.M.; Yang, L. Comparative analysis of circulation background and dry intrusion of two spring heavy rainfall events in south Xinjiang. Meteorol. Sci. Technol. 2018, 46, 1201–1210. [Google Scholar]
  27. Yang, X.; Zhang, Y.H.; Zhang, C.; Yu, B.X.; Mu, H. Causation analysis of the 21 May 2018 torrential rain in west of southern Xinjiang. Desert Oasis Meteorol. 2020, 14, 21–30. [Google Scholar]
  28. Zeng, Y.; Yang, L.M. Comparative analysis on mesoscale characteristics of two severe short-time precipitation events in the west of southern Xinjiang. Torr. Rain Dis. 2017, 36, 410–421. [Google Scholar]
  29. Liu, W.; Li, J.G.; Yang, L.M. Characteristics of the MCS over southern Xinjiang during the late summer of 2016. Desert Oasis Meteorol. 2017, 11, 9–16. [Google Scholar]
  30. Xie, Z.M.; Zhou, S.Y.; Yang, L.M. Review of study on precipitation in Xinjiang. Torrential Rain Disasters 2018, 37, 204–212. [Google Scholar]
  31. Ji, C.H.; Li, S.X. Analysis on extremity of the “7·19” severe rainstorm process in Kaifeng. Meteor. Environ. Sci. 2021, 44, 53–62. [Google Scholar]
  32. Mao, Z.Y.; Li, G.P.; Xu, L. Analysis ontransport and budget characteristics of water vapour in a sustained heavy rain event in Hunan Province. Torrential Rain Disasters 2021, 40, 513–522. [Google Scholar]
  33. Liu, G.Q.; Tong, X.Y.; Deng, J.; Zhou, X.Y.; Zhou, C.L.; Liu, C.Y. Analysis of water vapour transport characteristics in Xinjiang based on the Lagrangian and Euler method. Desert Oasis Meteorol. 2019, 13, 22–31. [Google Scholar]
  34. Su, A.F.; Lü, X.N.; Cui, L.M.; Li, Z.; Xi, L.; Li, H. The basic observational analysis of “7.20” extreme rainstorm in Zhengzhou. Torrential Rain Disasters 2021, 40, 445–454. [Google Scholar]
  35. Feng, L.S.; Song, P.; Tian, L.; Gu, X.J.; Zhang, X.Y.; Han, Y. Meteorological condition diagnosis and transmission impact analysis of three heavy pollution processes in Henan province. Meteor. Environ. Sci. 2020, 43, 104–113. [Google Scholar]
  36. Yu, X.J.; Zhao, Y. Simulation of orographic effects on summer rain in the Tianshan mountains. J. Desert Res. 2016, 36, 1133–1143. [Google Scholar]
  37. Ye, L.M.; Wu, N.G.; Zhang, H.L.; Cai, J.J.; Wu, Z.F. Analysis of the influence of sea-land breeze and topography on the extraordinary heavy rain in warm sector under a weak weather background. Torrential Rain Disasters 2019, 38, 597–605. [Google Scholar]
  38. Liu, Y.N.; Liu, X.M.; Zou, H.B.; Wu, J. Analysis of terrain effect for a heavy rainstorm in northwestern Jiangxi by numerical simulation. Meteor. Dis. Red Res. 2021, 44, 105–114. [Google Scholar]
  39. Zhou, T.J.; Qian, Y.F. An experimental study on the effects of topography on numerical prediction. Sci. Atmos. Sin. 1996, 20, 452–462. [Google Scholar]
  40. Liao, F.; Hu, Y.M.; Hong, Y.C. Numerical study for the influences of orographic dynamicon cloud and precipitation in North China. Plateau Meteor. 2009, 28, 115–126. [Google Scholar]
  41. Liu, J.Y.; Mao, L.J.; Niu, T.; Chen, M.; Liu, H.L.; Wang, J.Z. Numerical simulation study on the impact of topographic forcing on the disaster rainstorm in West China in September 2011. Meteor. Mon. 2013, 39, 975–987. [Google Scholar]
  42. Xiong, Q.F.; Hu, J.L.; Zhang, Y.C. Terrain effects in numerical simulation of Meiyu front heavy rain. J. Meteor. Sci. 2007, 6, 591–596. [Google Scholar]
  43. Liu, Y.L.; Huang, Y. Study of Huangshan mountain terrain on precipitation enhancement condition. Plateau Meteor. 2013, 32, 2608–2615. [Google Scholar]
  44. Ding, R.H.; Ding, X. Analysis on precipitation differences between Jiuhua mountains and its surrounding regions. Meteor. Mon. 2014, 40, 458–465. [Google Scholar]
  45. Ma, S.H.; Xi, Y.W. Some regularities of storm rainfall in Xinjiang, China. Acta Meteor. Sin. 1997, 2, 239–248. [Google Scholar]
  46. Wu, H.; Xu, X.; Luo, T.; Yang, Y.; Xiong, Z.; Wang, Y. Variation and comparison of cloud cover in MODIS and four reanalysis datasets of ERA-interim, ERA5, MERRA-2 and NCEP. Atmos. Res. 2023, 281, 106477. [Google Scholar] [CrossRef]
  47. Jiménez, P.A.; Dudhia, J.; González-Rouco, J.F.; Navarro, J.; Montávez, J.P.; García-Bustamante, E. A revised scheme for the WRF surface layer formulation. Mon. Weather Rev. 2012, 140, 898–918. [Google Scholar] [CrossRef]
  48. Ju, C.; Li, H.; Li, M.; Liu, Z.; Ma, Y.; Mamtimin, A.; Sun, M.; Song, Y. Comparison of the forecast performance of WRF using noah and noah-mp land surface schemes in central Asia arid region. Atmosphere 2022, 13, 927. [Google Scholar] [CrossRef]
  49. Xin, Y.; Li, M.; Du, J.; Yang, Z.Z.; Yuan, B.; Wang, Y.F. The development of Xinjiang meteorology in exploiting data assimilation operational system. Desert Oasis Meteorol. 2021, 15, 133–143. [Google Scholar]
  50. Duolaite, X. Formulation of precipitation intensity standard of Xinjiang. Desert Oasis Meteorol. 2005, 28, 7–8. [Google Scholar]
  51. Chen, F.; Dudhia, J. Coupling an advanced land surface-hydrology model with the Penn State-NCAR MM5 modeling system. Part II: Preliminary model validation. Mon. Weather Rev. 2001, 129, 587–604. [Google Scholar] [CrossRef]
  52. Ek, M.B.; Mitchell, K.E.; Lin, Y.; Rogers, E.; Grunmann, P.; Koren, V.; Gayno, G.; Tarpley, J.D. Implementation of Noah land surface model advances in the National Centers for Environmental Prediction operational mesoscale Eta model. J. Geophys. Res. 2003, 108, 8851. [Google Scholar] [CrossRef]
  53. Mahrt, L.; Ek, M. The influence of atmospheric stability on potential evapouration. J. Clim. Appl. Meteor. 1984, 43, 170–181. [Google Scholar]
  54. Kramer, M.; Heinzeller, D.; Hartmann, H.; Wim, V.; Stetneveld, G. Assessment of MPAS variable resolution simulations in the grey-zone of convection against WRF model results and observations. Clim. Dyn. 2020, 55, 253–276. [Google Scholar] [CrossRef]
  55. Thompson, G.; Field, P.R.; Rasmussen, R.M.; Rasmussen, R.M.; Hall, W.D. Explicit forecasts of winter precipitation using an Improved bulk microphysics scheme. Part II: Implementation of a new snow parameterization. Mon. Weather Rev. 2008, 36, 5095–5115. [Google Scholar] [CrossRef]
  56. Hong, S.-Y.; Noh, Y.; Dudhia, J. A new vertical diffusion package with an explicit treatment of entrainment processes. Mon. Weather Rev. 2006, 134, 2318–2341. [Google Scholar] [CrossRef]
  57. Alapaty, K.; Niyogi, D.; Chen, F.; Pyle, P.; Chandrasekar, A.; Seaman, N. Development of the flux-adjusting surface data assimilation system for mesoscale models. J. Appl. Meteorol. Climatol. 2008, 47, 2331–2350. [Google Scholar] [CrossRef]
  58. Wu, W.J.; He, J.H.; Hyo-Sang, C.; Chun-Ho, C. The relationship between the East Asian Up-tropopheric jet stream in summer and climatic characteristics of synoptic-scale disturbance. Clim. Environ. Res. 2006, 11, 525–534. [Google Scholar]
  59. Chi, J.; Zhou, Y.S.; Ran, L.K.; Zhou, K.; Shen, X.Y. Numerical simulation analysis on the generation and evolution of the dynamic and thermodynamic processes of an extreme rainfall in Jilin province. Chin. J. Atmos. Sci. 2021, 45, 1400–1414. [Google Scholar]
  60. Li, X.M.; Yang, L.M.; Li, J.G.; Liu, J. Mesoscale convective systems characteristic analysis of the “6·14” extreme rainstorm in northern slope of the Kunlun Mountains. Arid. Land Geogr. 2024, 47, 1700–1712. [Google Scholar]
  61. Chen, Q.S. The instability of the gravity-inertia wave and its relation to low-level jet and heavy rainfall. J. Meteorol. Soc. Jpn. Ser. II 1982, 60, 1041–1057. [Google Scholar] [CrossRef]
  62. Sun, J.S. A study of the basic features and mechanism of boundary layer jet in Beijing area. Chin. J. Atmos. Sci. 2005, 29, 445–452. [Google Scholar]
  63. Zhong, Z.; Yuan, H.H.; Li, J.; Fan, H.Y. Characteristics of meso-scale perturbation and momentum transportation associated with an intensification process of upper-level jet. J. Meteor. Sci. 2010, 30, 639–645. [Google Scholar]
  64. Zhang, L.N.; Ran, L.K.; Li, N.; Du, J.; Zhou, X.; Meng, Y. Analysis of momentum flux and kinetic energy flux transport in the middle and lower troposphere during a thunderstorm event. Chin. J. Atmos. Sci. 2018, 42, 178–191. [Google Scholar]
Figure 1. Terrain heights (m) across Xinjiang, China.
Remotesensing 17 02519 g001
Figure 2. (a) Accumulated precipitation across Xinjiang from 1200 UTC on 14 June to 0000 UTC on 17 June 2021. Hourly precipitation (mm) at (b) No.1 station in the debris flow-prone area of Shanpuru Township, Luopu County, and at (c) Luopu station during the period from 0000 UTC on 15 June to 0000 UTC on 16 June 2021.
Remotesensing 17 02519 g002
Figure 3. (a) 100 hPa geopotential height (dagpm) and 200 hPa wind field (m·s−1), as well as (b) 500 hPa geopotential height (dagpm) and wind speed (m·s−1), at 1200 UTC on 15 June 2021. Colour-shaded areas represent strong wind zones, and the brown line denotes the trough line.
Remotesensing 17 02519 g003
Figure 4. (a) 700 hPa and (b) 850 hPa wind fields (m·s−1) at 1200 UTC on 15 June 2021, as well as (c) an analysis diagram of mesoscale systems. Colour-shaded areas represent strong wind zones.
Remotesensing 17 02519 g004
Figure 5. (a) The whole-layer water vapour flux (kg·m−1·s−1), as well as water vapour flux (kg·m−1·hPa−1·s−1) and water vapour flux divergence (10−6 g·m−2·hPa−1·s−1), at (b) 700 hPa and (c) 850 hPa at 1200 UTC on 15 June 2021. Arrows represent water vapour flux, and colour-shaded areas represent strong water vapour flux zones.
Remotesensing 17 02519 g005
Figure 6. (a) Temperature advection (10−5 °C·s−1) at 850 hPa at 1200 UTC on 15 June 2021. Time–height evolutions of (b) temperature advection and (c) vertical velocity (Pa·s−1) at Luopu station. The red box indicates the cold advection.
Remotesensing 17 02519 g006
Figure 7. Model domains. Colour-shaded areas denote terrain heights (m).
Remotesensing 17 02519 g007
Figure 8. (a) Simulated and (b) observed 24 h (from 0000 UTC on 15 June to 0000 UTC on 16 June 2021) accumulated precipitation (mm) in the Hotan region. (c) Temporal variations in hourly precipitation (mm) at point A and point D during the same period.
Remotesensing 17 02519 g008
Figure 9. (a) Observed and (b) simulated sounding data at Hotan station at 1200 UTC on 15 June 2021. The red solid line represents the ambient temperature, the green solid line denotes the environmental dew-point temperature, and the black solid line represents the state.
Remotesensing 17 02519 g009
Figure 10. Simulated radar reflectivity (colour-shaded areas; dBZ) and wind vectors (m·s−1) at 700 hPa at (a) 1000 UTC, (b) 1100 UTC, (c) 1200 UTC, (d) 1300 UTC, (e) 1400 UTC, and (f) 1500 UTC on 15 June 2021.
Remotesensing 17 02519 g010
Figure 11. Cross-sections of simulated wind speed (colour-shaded areas; m·s−1) and wind vectors (m·s−1) along the black line (shown in Figure 10c) at (a) 1000 UTC, (b) 1200 UTC, (c) 1400 UTC, and (d) 1600 UTC on 15 June 2021.
Remotesensing 17 02519 g011
Figure 12. Meridional–vertical cross-sections of (a) the local changed term of meridional momentum (10−4 kg·m−2·s−2), (b) meridional momentum flux divergence term (10−4 kg·m−2·s−2), (c) Coriolis force term (10−4 kg·m−2·s−2), and (d) meridional pressure gradient term (10−4 Pa·m−1) along point D at 78.92°E at 1300 UTC on 15 June 2021. The black shaded area represents the topography.
Remotesensing 17 02519 g012
Figure 13. Meridional–vertical cross-sections of meridional momentum (colour-shaded areas; kg·m−2·s−1) and momentum flux (arrows; kg·m−1·s−2) along point D at 78.92°E at (a) 1100 UTC, (b) 1300 UTC, and (c) 1500 UTC on 15 June 2021. The black shaded area represents the topography.
Remotesensing 17 02519 g013
Table 1. Grids and detailed parameterization schemes for simulation.
D01D02D03
Horizontal grid spacing9 km3 km1 km
Horizontal grid number712 × 532832 × 652808 × 496
Long-wave radiation schemeRapid radiative transfer model for general circulation models (RRTMG) schemeRRTMG schemeRRTMG [54] scheme
Short-wave radiation schemeRRTMG schemeRRTMG schemeRRTMG [54] scheme
Microphysics schemeNew Thompson schemeNew Thompson schemeNew Thompson [55] scheme
Surface layer schemeRevised Mesoscale Model version 5 (MM5)Revised MM5 schemeRevised MM5 [47] scheme
Planetary boundary layer schemeYonsei University (YSU) scheme YSU schemeYSU [56] scheme
Land-surface schemeNoahNoahNoah [57]
Disclaimer/Publisher’s Note: The statements, opinions and data contained in all publications are solely those of the individual author(s) and contributor(s) and not of MDPI and/or the editor(s). MDPI and/or the editor(s) disclaim responsibility for any injury to people or property resulting from any ideas, methods, instructions or products referred to in the content.

