1. Introduction
Critical raw materials (CRMs), such as antimony (Sb), are vital to modern technologies, playing key roles in products ranging from flame retardants to defense alloys. Given Europe’s strong dependence on imports, identifying and evaluating domestic Sb resources has become a strategic imperative [
1]. Sb, like many CRMs, is commonly associated with hydrothermal systems, where mineralizing fluids circulate through geological structures such as fractures, faults, and shear zones [
2,
3].
Remote sensing (RS) has long played a key role in detecting these systems. Early studies, such as those by Abrams et al. [
4], demonstrated the use of Landsat imagery to identify hydrothermal zones linked to copper deposits in Arizona. Later advancements by Kruse et al. [
5] integrated high spectral and spatial resolution data, enhancing mineral mapping capabilities. Additionally, Sabins [
6] provided foundational guidelines for RS applications in mineral exploration.
However, traditional RS methods faced limitations due to the low resolution of early satellite sensors [
6,
7]. Recent developments in hyperspectral missions (e.g., PRISMA, EnMAP) have significantly improved mineral mapping capabilities. However, high-resolution satellites like WorldView-3 remain prohibitively expensive for many academic applications, despite offering limited free access. In contrast, the SuperDove (PSB.SD) sensor of the PlanetScope (PS) constellation, launched in 2021, presents an affordable alternative. It provides eight bands in the visible and near-infrared (VNIR) range—including coastal blue and red edge—and a 3 m spatial resolution [
8]. PS imagery is also available under free academic quotas, increasing its accessibility to the scientific community.
The inclusion of specific VNIR bands, particularly those sensitive to iron oxides (Fe3+), which are key indicators of hydrothermal alteration, makes PSB.SD a promising tool for mineral exploration. Despite this potential, its capabilities have not been thoroughly benchmarked against more established sensors such as Sentinel-2, ASTER, and Landsat 9.
This study evaluates PSB. SD’s ability to map iron oxides, linked to Au-Sb mineralization in Freixeda, northern Portugal, where Sb is found in association with gold (Au), another important mineral for the economy. Au-Sb deposits are found in quartz veins with ferrous sulfides. In hydrothermal systems, these veins often have iron oxide caps at the surface, which can be a good sign of quartz veins below [
9]. Regarding RS studies related to antimony, we can mention the work of Dan et al. [
10], who integrate images from different multispectral satellites (Landsat 8 OLI, Sentinel-2, and ASTER) with lineament extraction to identify antimony occurrences. Gómez et al. [
11] used the integration of hyperspectral and thermal data to detect antimony concentrations. Carvalho et al. [
12] applied Convolutional Neural Networks (CNNs) to map antimony in northern Portugal, and Santos et al. [
13] used hyperspectral data (PRISMA satellite) to calculate Relative Band Depth (RBD) to map alteration minerals associated with antimony in Freixeda, Portugal.
While previous studies have integrated hyperspectral data or machine learning algorithms for Sb detection, this work uniquely evaluates PS’s cost-efficient VNIR capabilities against established multispectral sensors.
BR was selected for this study as it is a method widely validated in the literature for Fe
3+ detection, due to its simplicity, reproducibility, and proven effectiveness across various mineral systems, including pegmatites [
14,
15], carbonate-hosted Zn-Pb [
16,
17], copper [
4,
18,
19], and gold deposits [
16,
20,
21]. The performance of PSB.SD using BRs was then compared with Sentinel-2, ASTER, and Landsat 9, using only the VNIR bands from all sensors to ensure a consistent and fair comparison.
The methodology applied in this study focuses on using specific BRs to identify Fe
3+, followed by a comparative analysis of results obtained from different satellites against PS data. The BRs were processed using the equivalent red and blue bands of each sensor. After processing, spectral outliers were identified and masked following the approach of Chirico et al. [
16]. Finally, a fuzzification process was employed on the outputs from each satellite to generate prospectivity maps and identify new points of interest, which were subsequently validated through fieldwork.
Although PlanetScope lacks Shortwave Infrared (SWIR) bands—unlike Sentinel-2, ASTER, and Landsat 9—this work investigates whether its superior spatial resolution can offset that limitation in mapping Fe
3-rich zones. As the approach relies solely on VNIR data, it is inherently constrained to detecting Fe
3+ only, since identification of Fe
2+, ferrous silicates, and other minerals requires SWIR data [
17,
22,
23,
24].
Ultimately, this study seeks to demonstrate that PSB.SD can serve as a viable, low-cost alternative for iron oxide mapping, particularly in academic and early-stage exploration projects.
2. Study Area
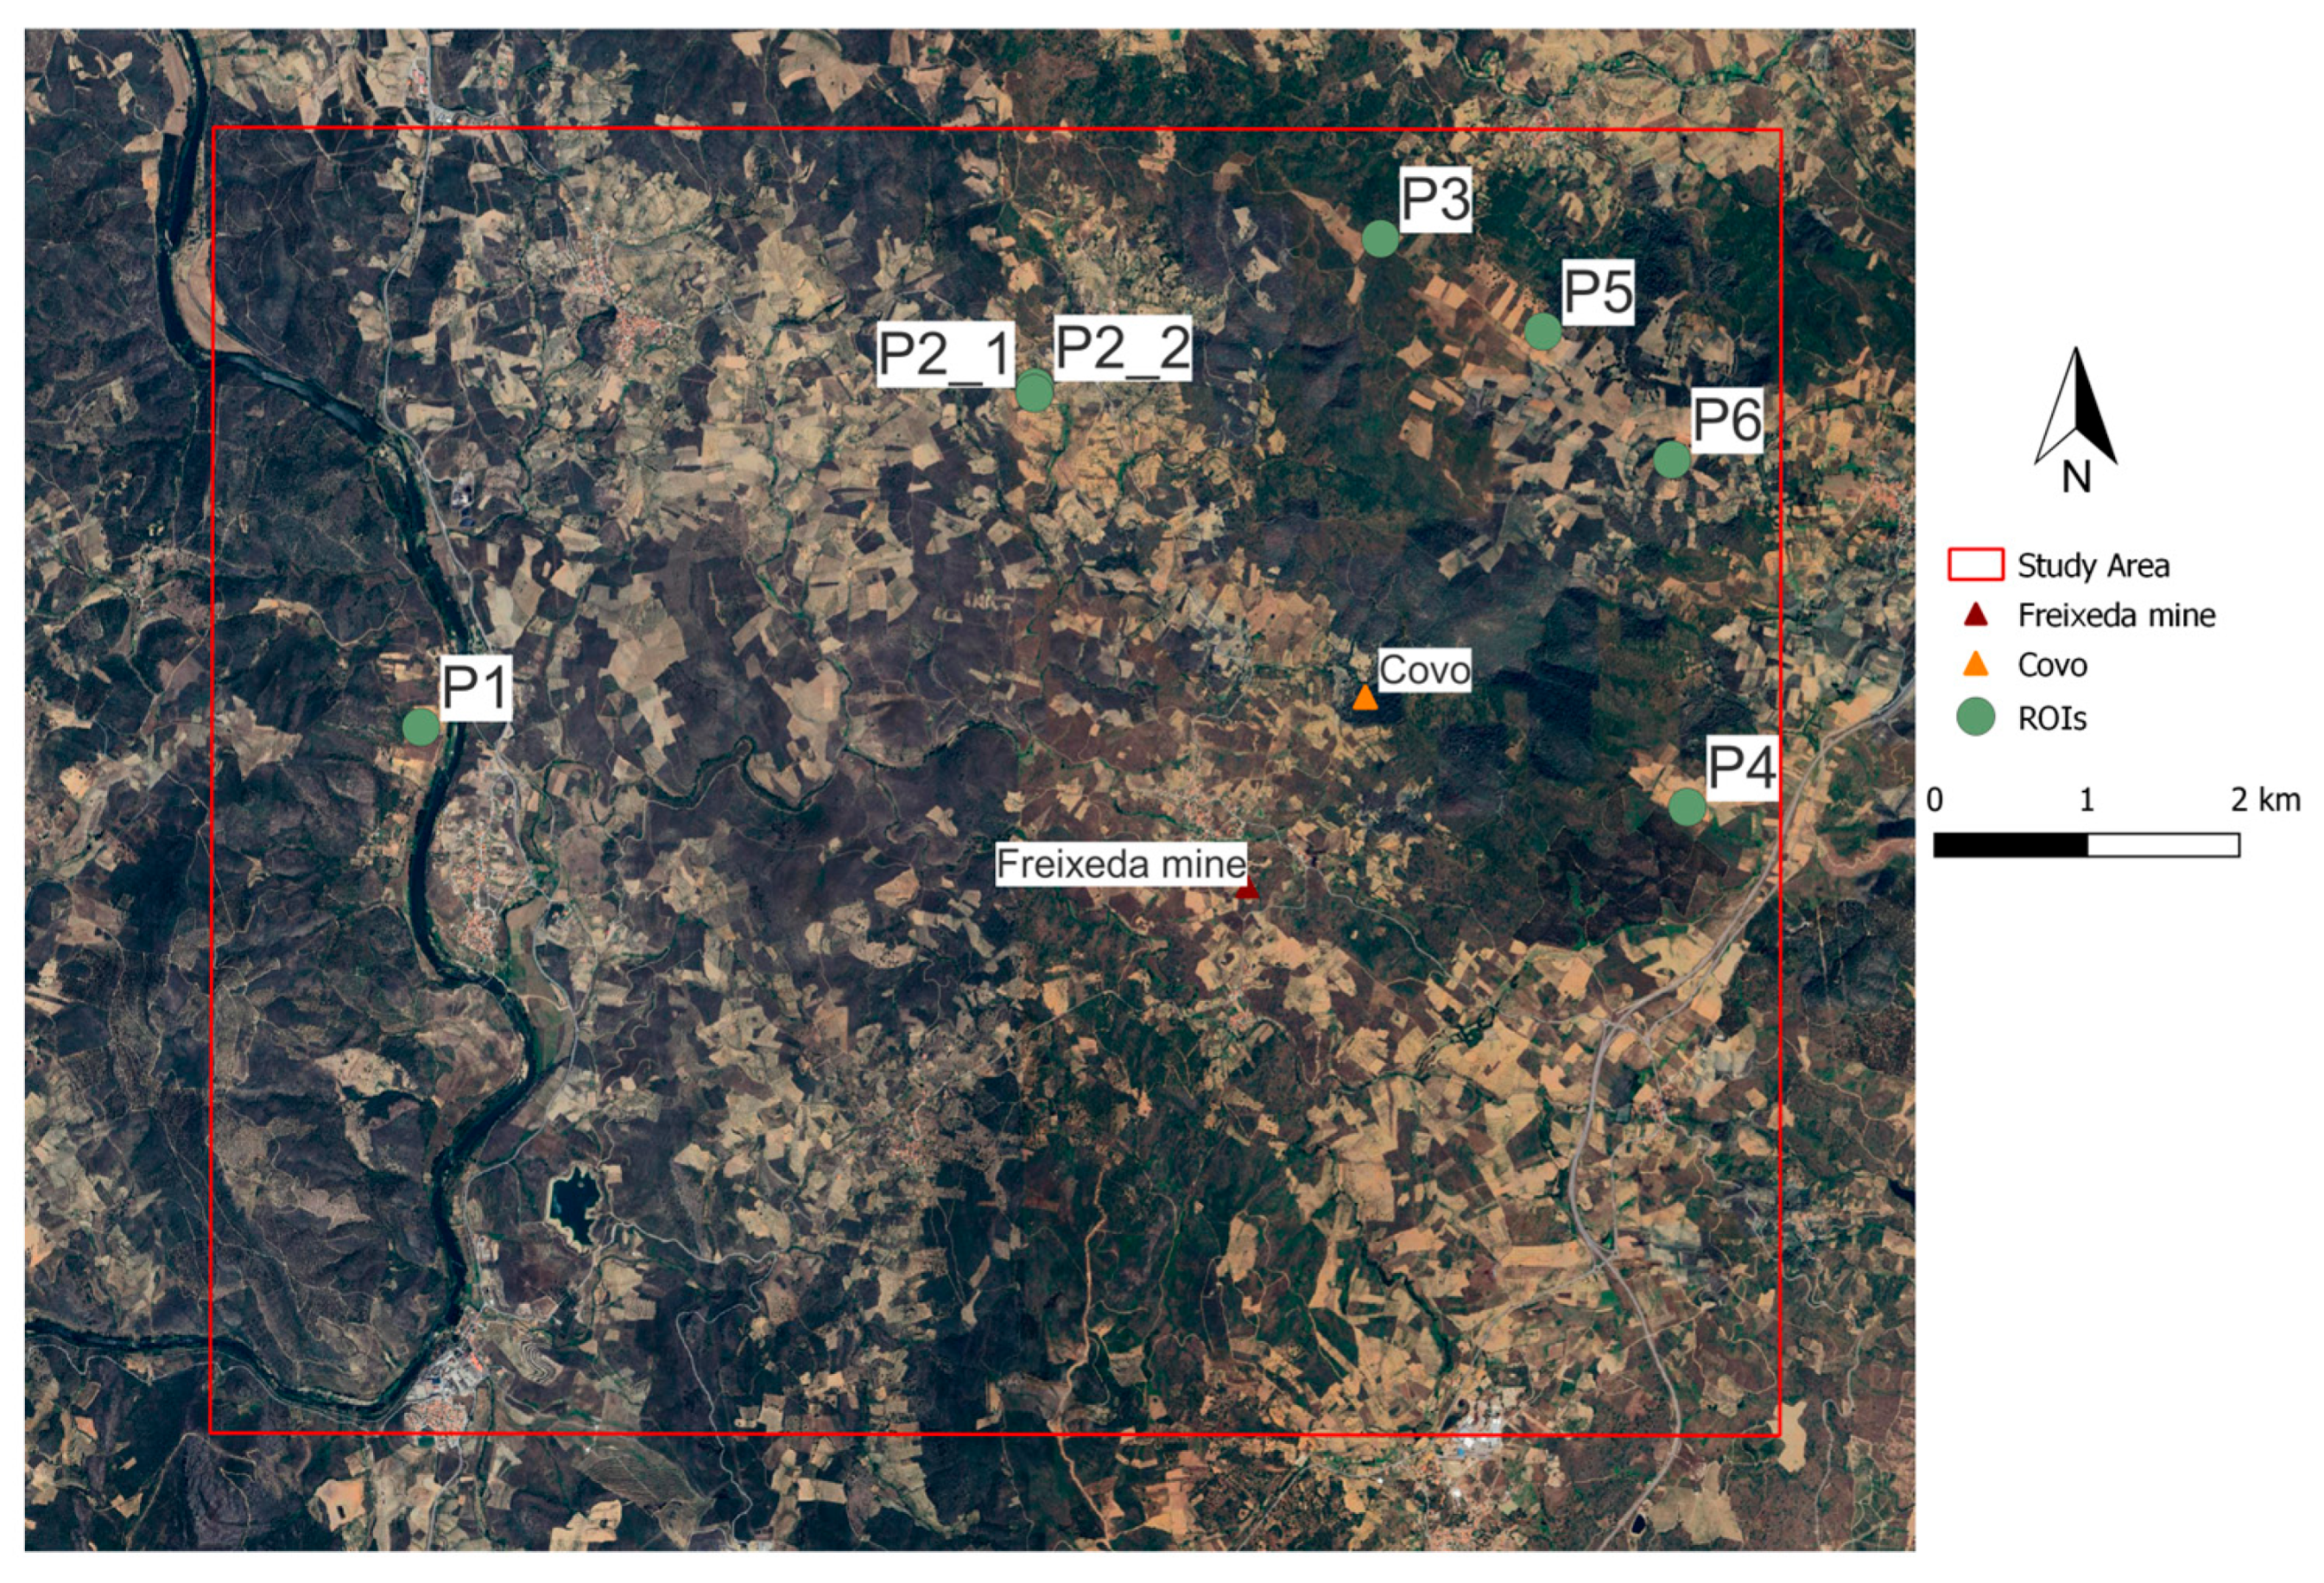
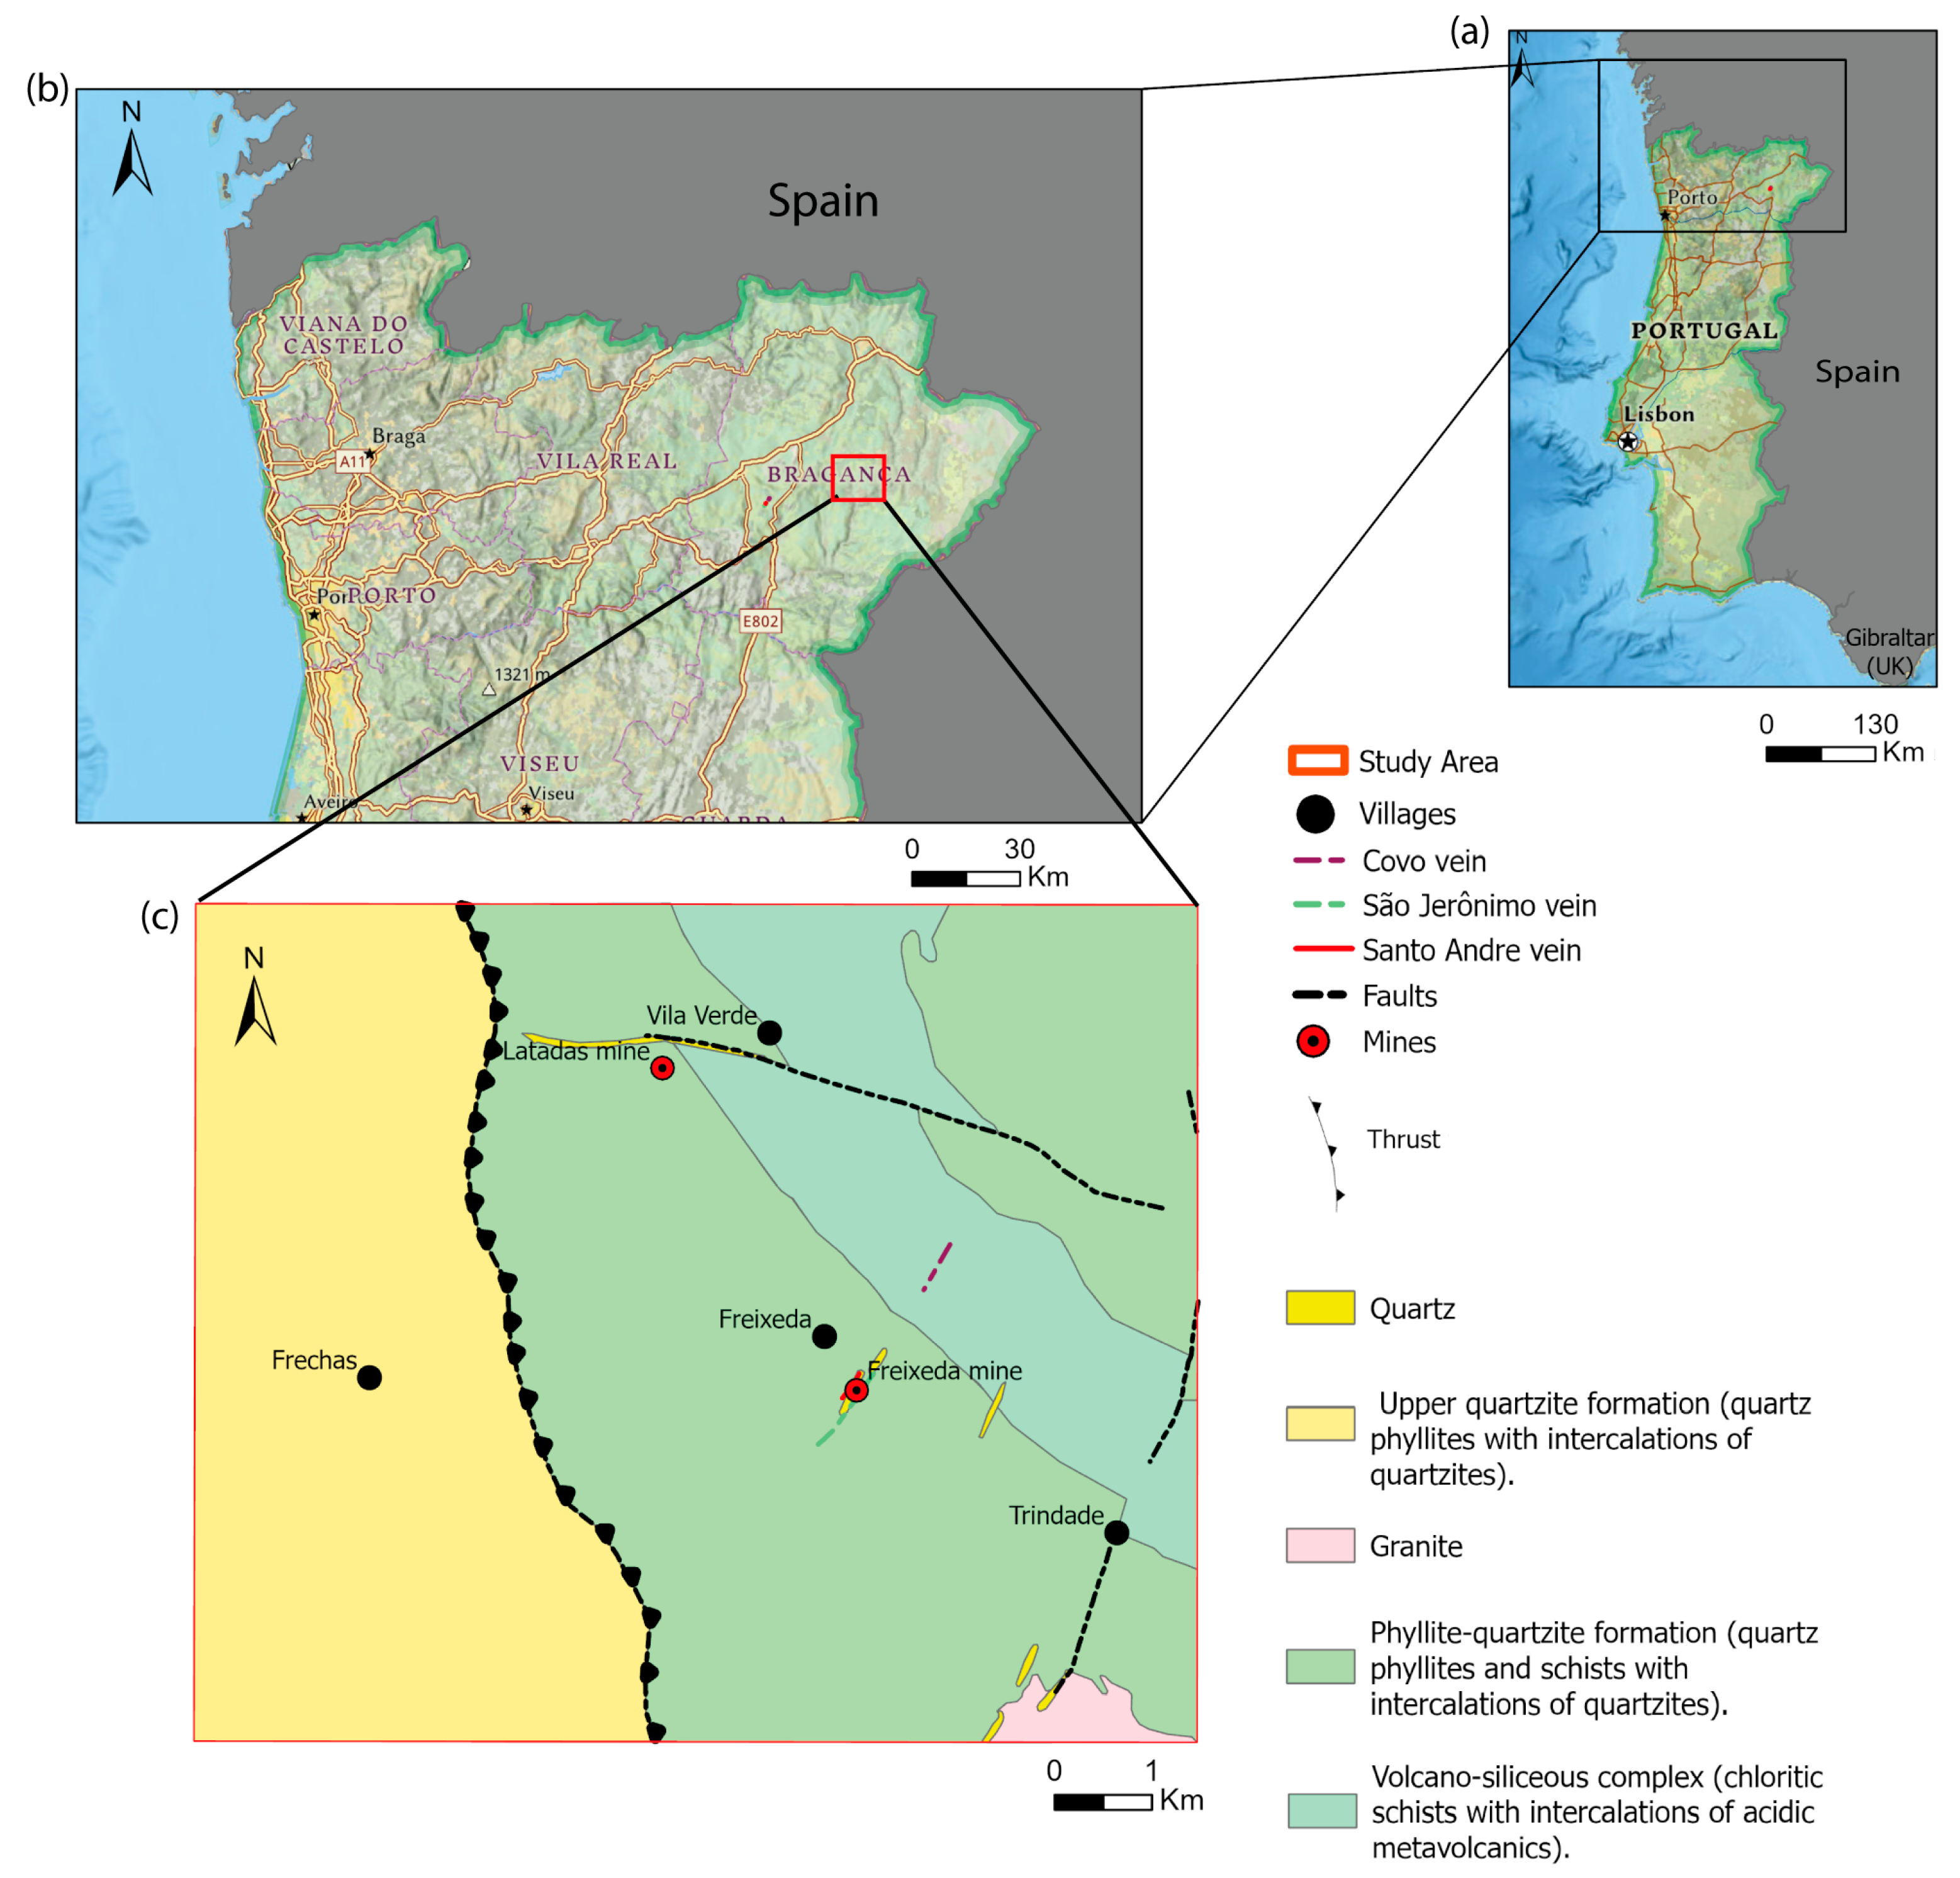
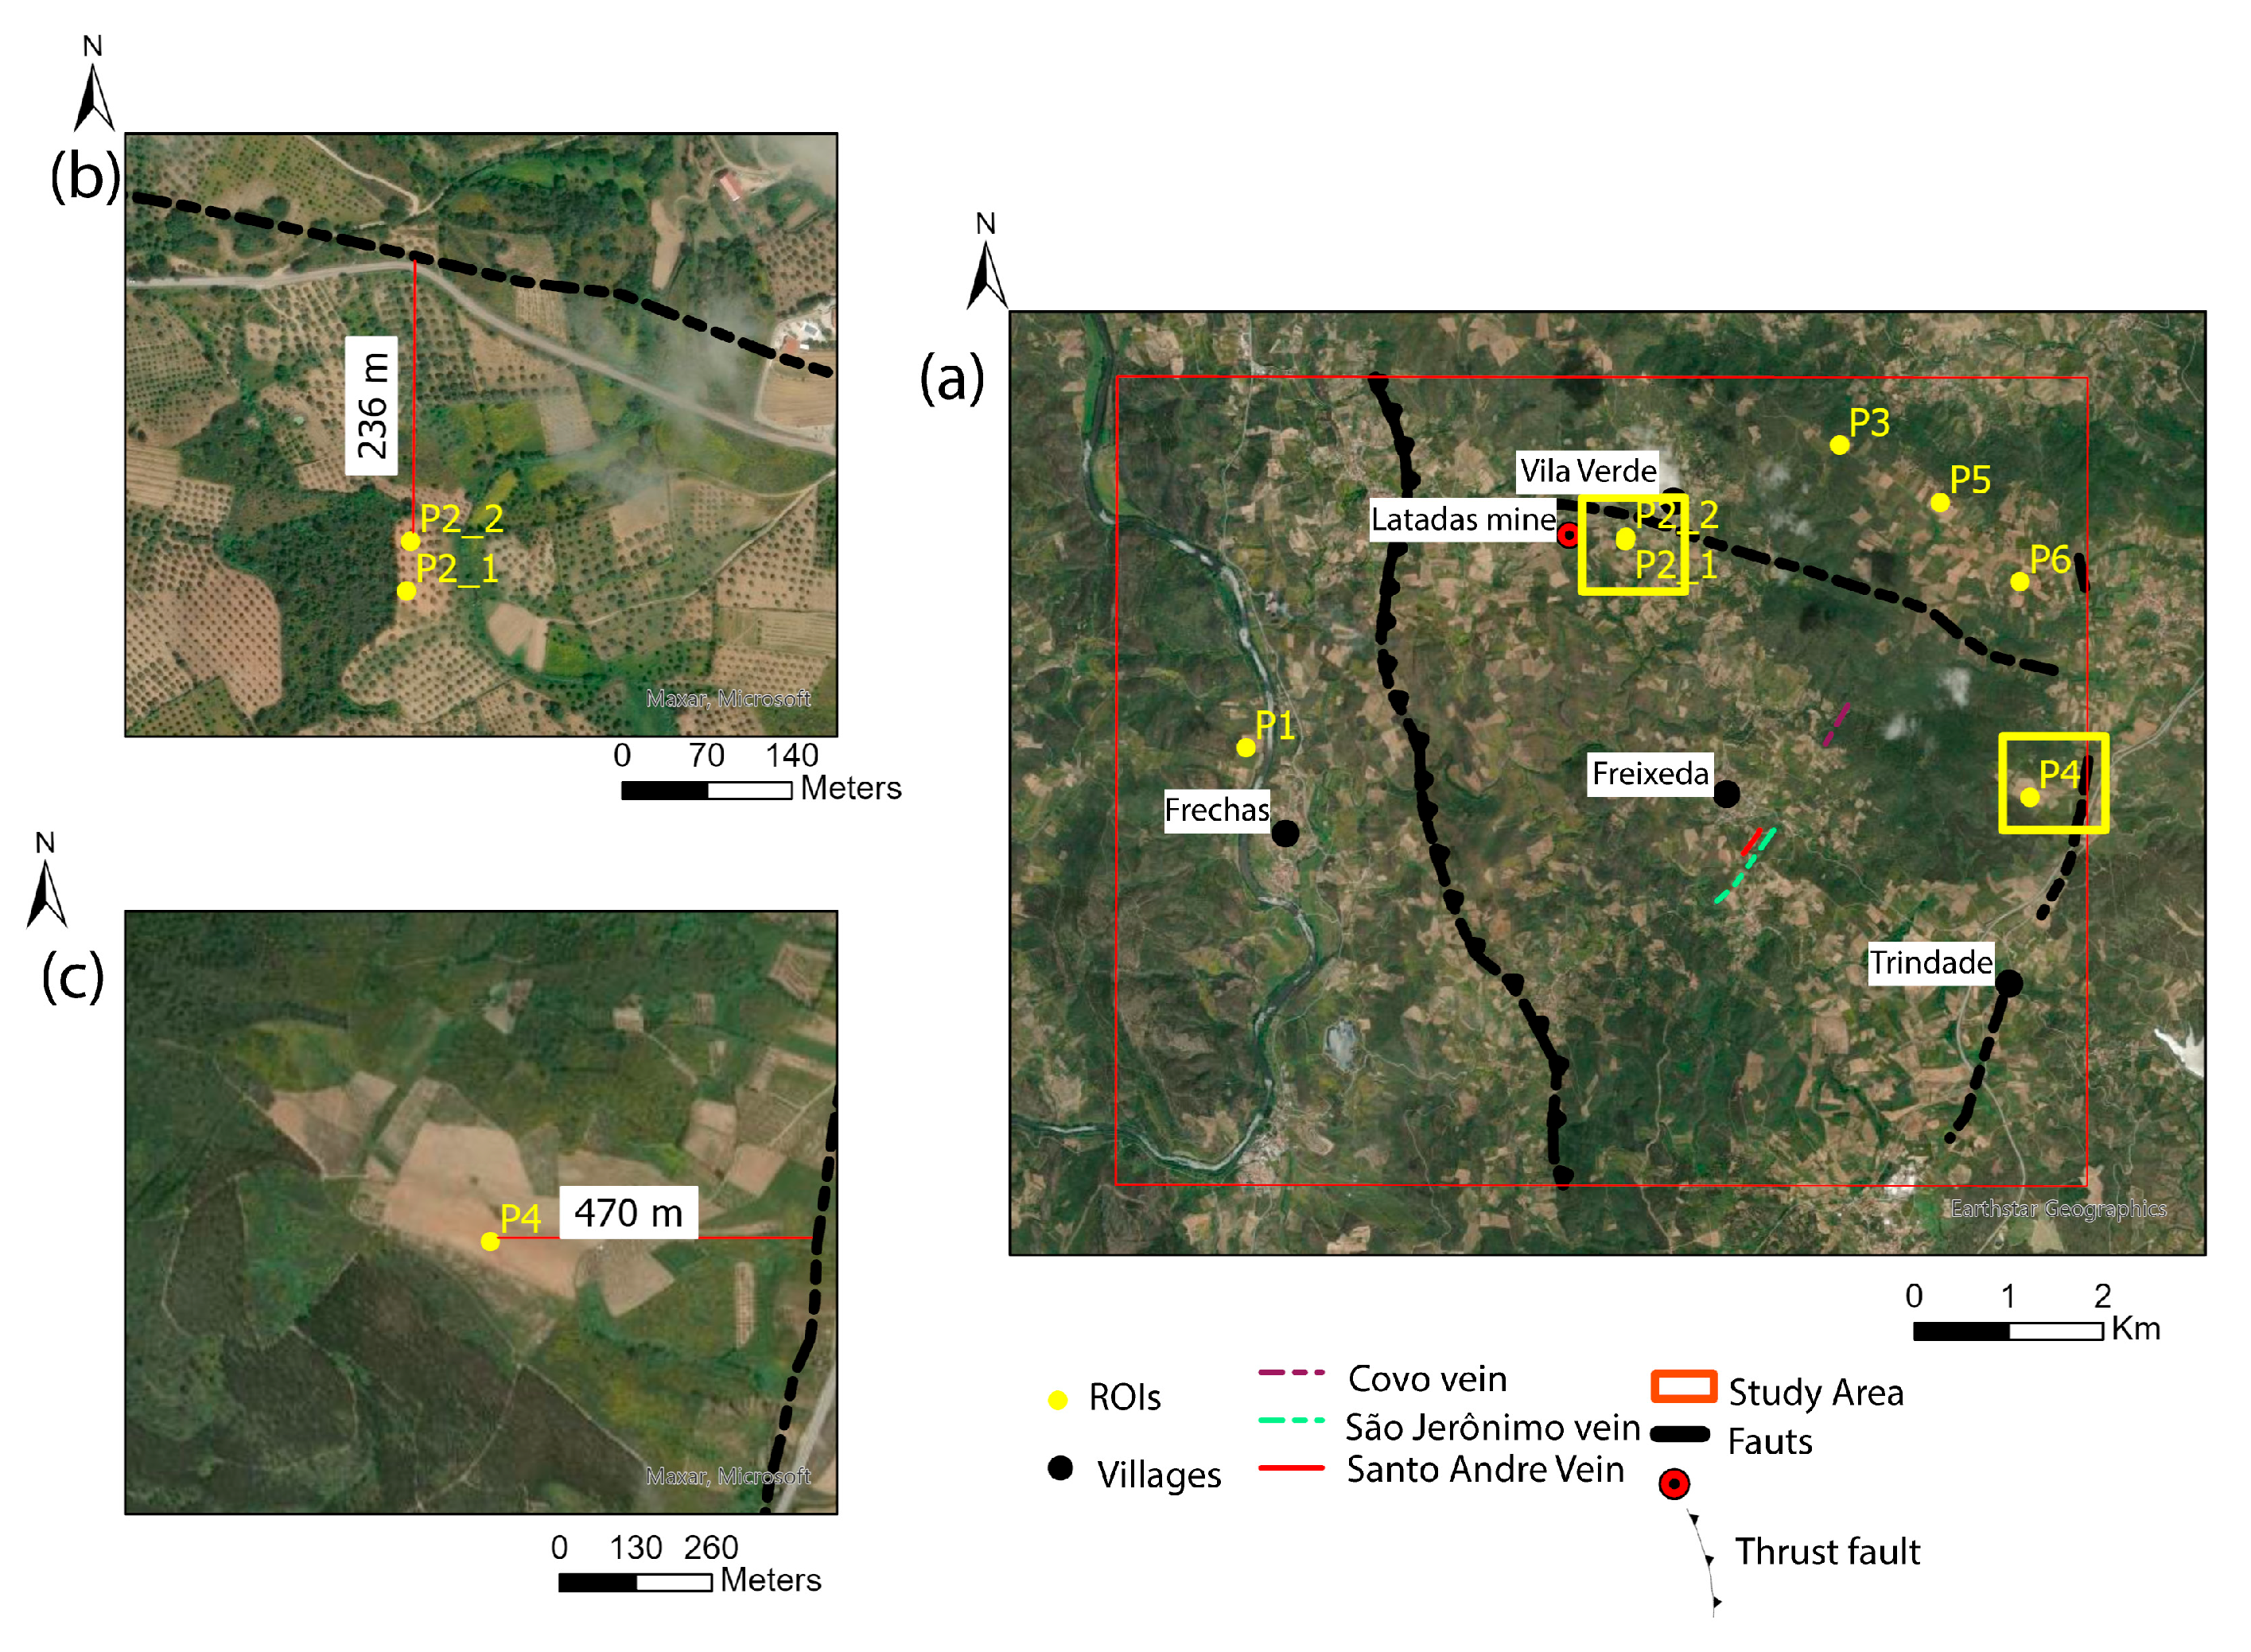
Freixeda is located in Zona de Galiza-Trás-os-Montes (ZGTM) in the municipality of Mirandela, north of Portugal (
Figure 1). The study area has 83 km
2 of extension and encompasses several mineralizations of Au-Ag (silver)-As (arsenic) and As-Au-Ag with some mining activity from the Roman period [
25,
26]. The Freixeda Philonian field is also rich in tungsten, lead, zinc, and copper. Antimony can be found in small quantities and is always associated with gold deposits [
27]. Among these mineralizations, we can give the example of the Freixeda mine, which encompasses two important veins (São Jerónimo and Santo André veins) with Sb mineralization [
27]. The Covo vein is northeast of the Freixeda mine, a continuation of the São Jeronimo lode and, therefore, has great potential for Sb mineralization [
27].
Gold and silver deposits are generally associated with Paleozoic quartzites from the Ordovician period and black shales dating from the Ordovician and Silurian periods [
28]. Occasionally, these mineralizations also occur in granitic rocks. Gold is found in veins, stockworks, and silicified masses within metamorphosed metasediments. The formation of these deposits was influenced by shear zones, tectonic pulses, and late fractures related to the Variscan Orogeny [
26].
The Freixeda mine operated as a gold mine from 1952 to 1955, ceasing its activities due to economic and organizational issues [
27,
29]. Almeida & Noronha [
22] suggested a relationship between late granites and tungsten (W) and Au-Ag mineralization. Almeida & Noronha [
29] described the mineral deposition sequence in two stages: the first is characterized by the presence of scheelite + wolframite + sulfides (such as arsenopyrite, pyrite, pyrrhotite, and molybdenite); the second stage includes the association of chalcopyrite + sphalerite + sulfides + galena + native elements, which is well represented in Freixeda.
The main iron oxides present in the study area that can be mapped are Goethite and Hematite. Both Hematite and Goethite were identified through spectral analyses conducted on rock samples. The spectral analyses also identify maghemite, zincite, and ferrihydrite, but are less representative than Goethite and Hematite. For future intents, Goethite and Hematite will be called target minerals.
3. Materials and Methods
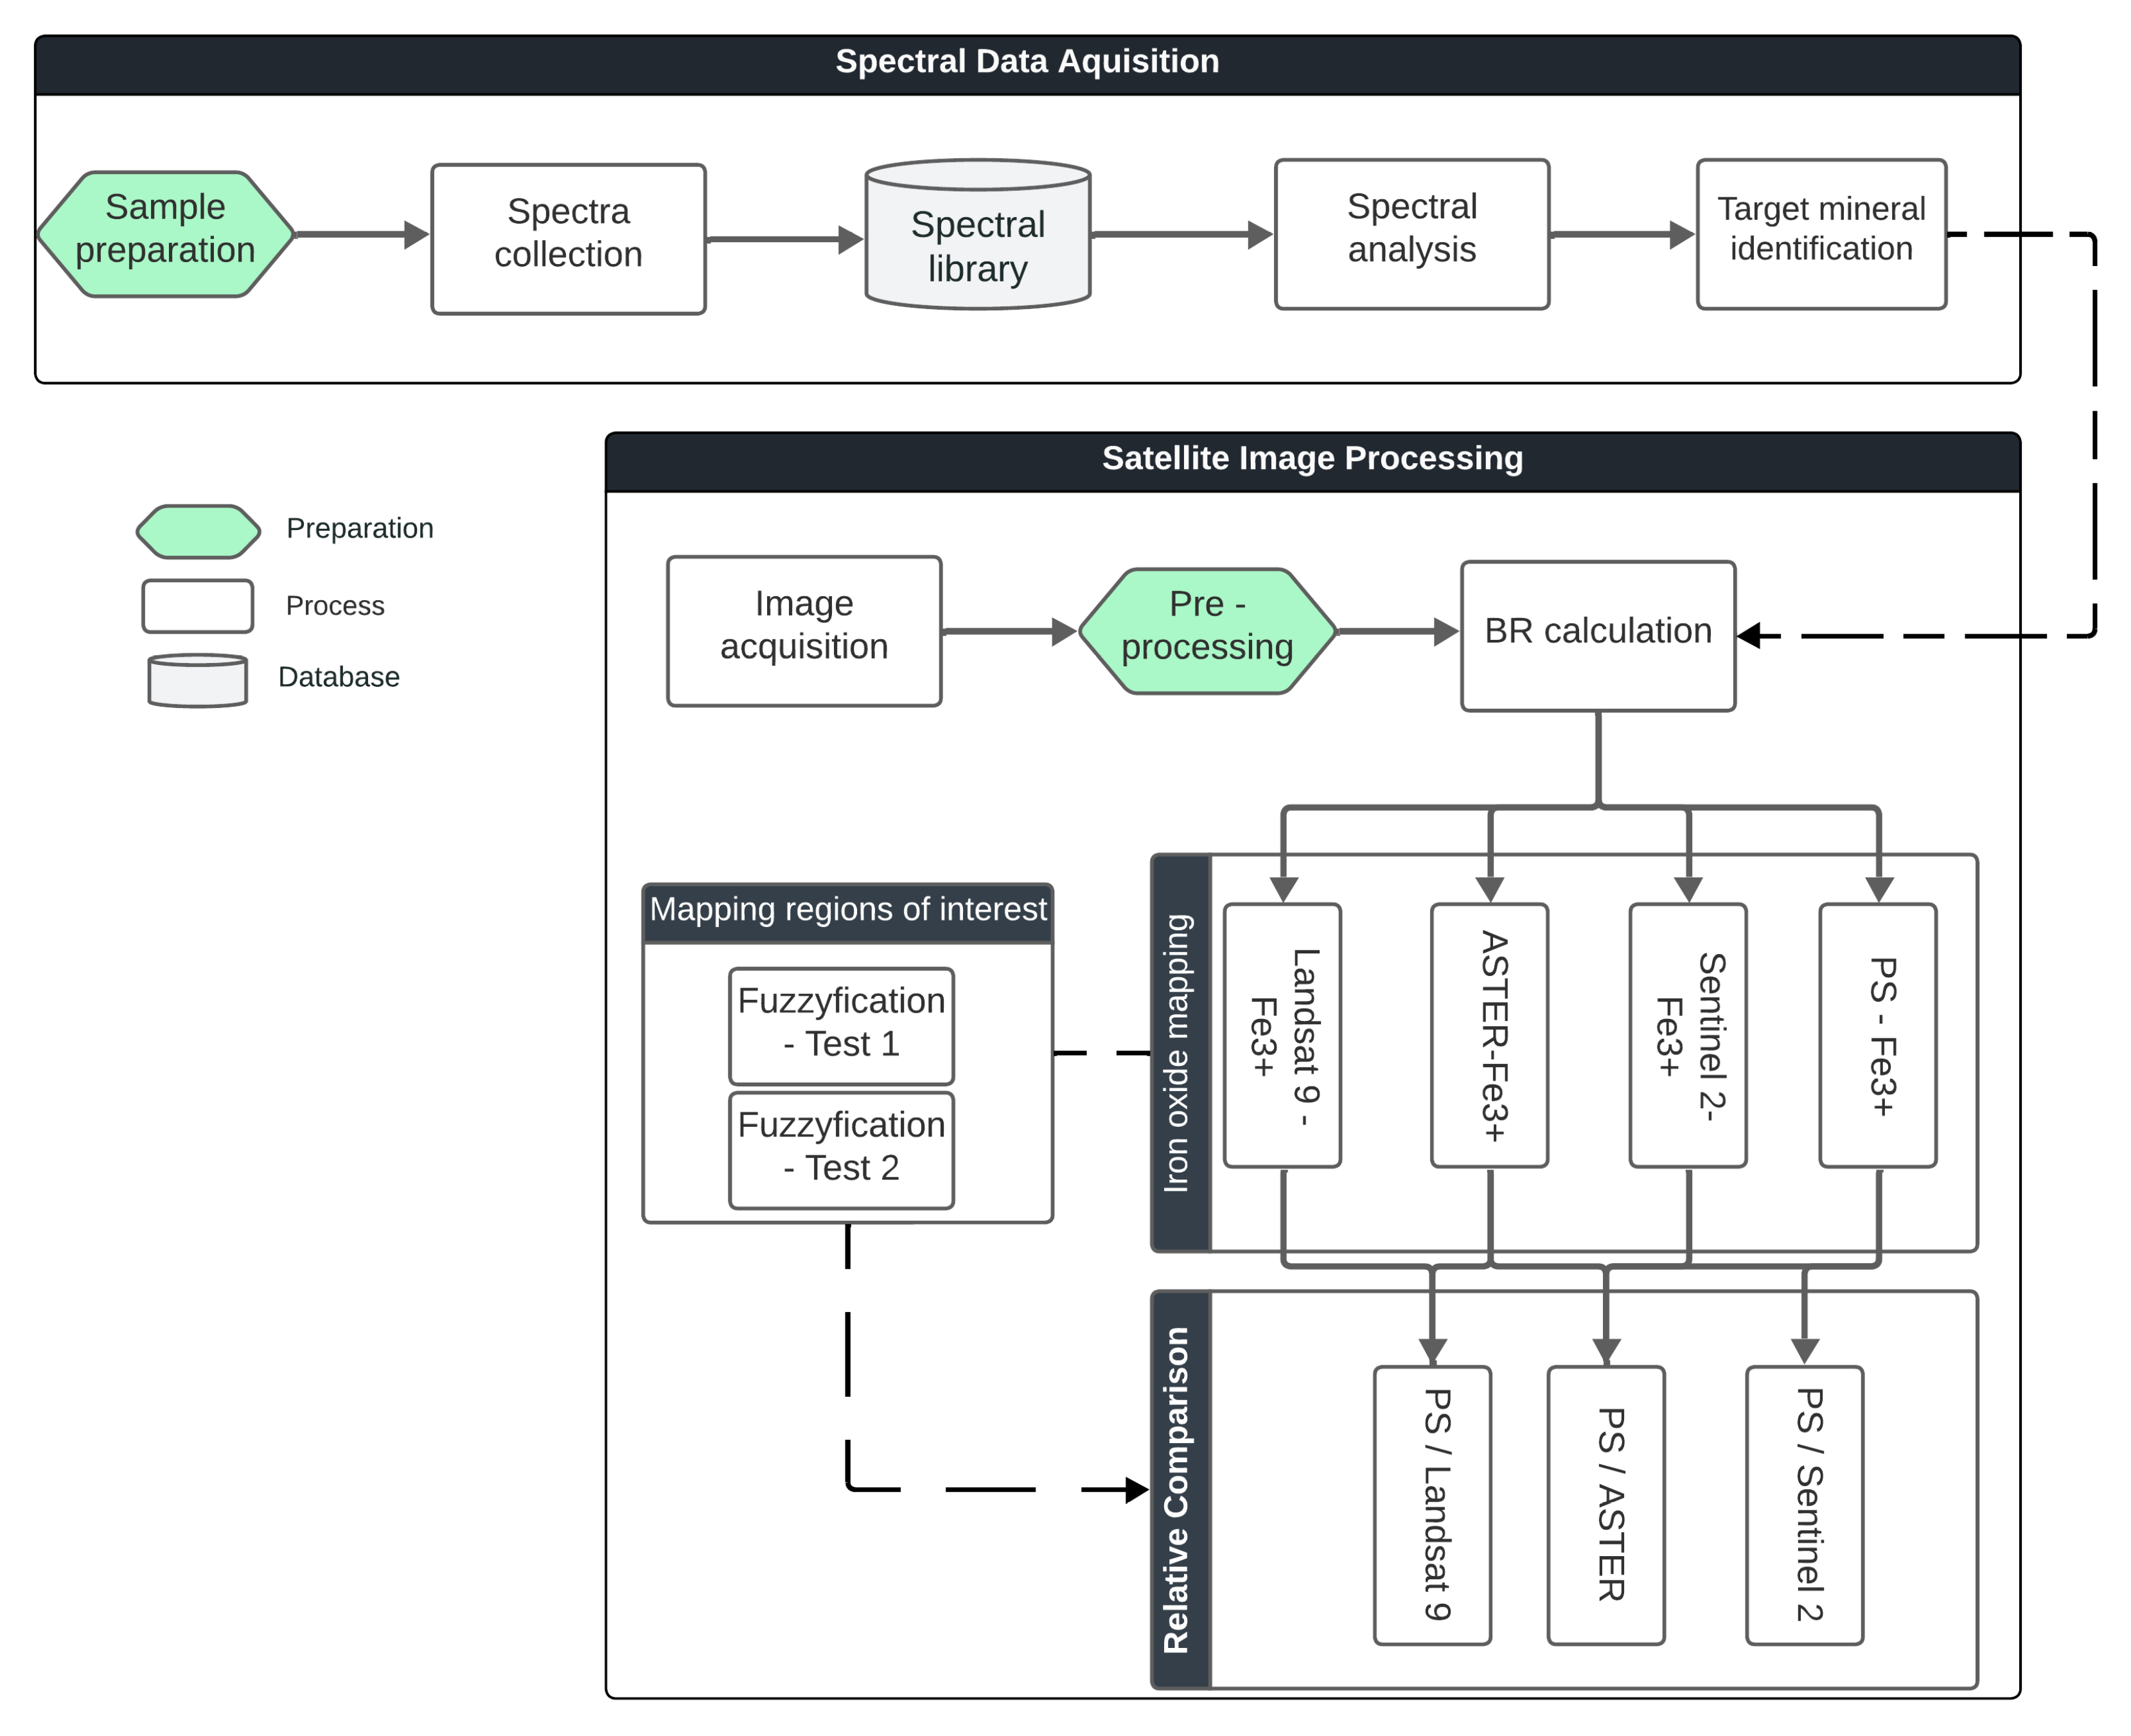
The step-by-step process illustrated in
Figure 2 outlines the methodology used in this study. It can be divided into two main stages. The first stage, spectral data acquisition, involves collecting spectral data from rock samples, organizing it into a spectral library, and analyzing it to identify target minerals. The second stage, satellite image processing, focuses on calculating specific BRs to map target minerals, identify potential areas of interest, and compare the results obtained from the PS sensor with other satellites. This comparison helps assess the degree of similarity between datasets and evaluate the PS sensor’s ability to detect iron oxides.
3.1. Data
The PS image was acquired on 28 August 2024. The PS image was obtained through the Planet Explore gallery (
developers.planet.com). The image was already provided in surface reflectance, so no atmospheric correction was needed. PS, operated by Planet, is a constellation of around 130 satellites with a ground sample distance (GSD) of 3 m. The SuperDove instrument (PSB.SD), launched in 2021, enhanced the original PS capabilities by expanding the available bands from the initial four (blue, green, red, and near-infrared (NIR)) to eight, with the addition of green I, yellow, coastal blue, and the red edge band [
30]. The Sentinel-2 image was acquired on 2 October 2023. The image was downloaded from the Copernicus Data Space website. The Sentinel-2 Multispectral Instrument (MSI) has four bands with 10 m of ground sample distance (GSD), six bands with 20 m of GSD, and three bands with 60 m of GSD [
31]. The ASTER image was captured on 14 September 2003. The ASTER has three bands in the visible and NIR with 15 m of GSD, six bands in the SWIR with a GSD of 30 m, and four bands in the thermal infrared region (TIR) with 90 m of GSD [
32]. The 2003 ASTER image was selected as it is one of the few cloud-free scenes with full spectral coverage before the SWIR sensor failure in 2008. Although the SWIR bands were not used in this study, the same image will be used in future work where SWIR data will be essential for mapping other alteration minerals such as clays. The Landsat 9 image was acquired on 202 October 2. Landsat 9 is equipped with the Operational Land Imager 2 (OLI-2) and the Thermal Infrared Sensor 2 (TIRS-2), which provide data across 11 spectral bands. The OLI-2 sensor captures data in the visible, near-infrared (NIR), and shortwave infrared (SWIR) regions with a GSD of 30 m for most bands. The panchromatic band has a GSD of 15 m. The TIRS-2 sensor acquires thermal infrared data in two bands with a native GSD of 100 m [
33].
One of the goals of this research is to compare the potential of PS satellites in mapping ferric iron (Fe
3+) with that of Sentinel-2 and ASTER satellites.
Table 1 presents the correlation between the bands of these satellites and those of the PS satellite.
3.2. Spectral Data Acquisition
The methodology began with collecting and analyzing rock spectra from the Freixeda study area. In total, 16 rock samples were acquired and placed in an oven, where they were subjected to a temperature of 50 degrees Celsius to eliminate any traces of liquid on the surface [
34]. This drying step is essential to avoid spectral distortions caused by surface moisture, ensuring that the spectral measurements accurately reflect the mineralogical composition of the samples [
35].
The spectral information obtained from the rock samples was collected using Analytical Spectral Devices (ASDs). The ASD FieldSpec 4 spectroradiometer is a portable, battery-operated spectrometer with a spectral range of 350–2500 nm. It offers a spectral resolution of 3 nm at 700 nm (VNIR), 10 nm at 1400 nm (SWIR 1), and 10 nm at 2100 nm (SWIR 2). A spectralon (Labsphere) plate was used for reflectance calibration. The spectralon plate has a maximum reflectance higher than 99% for the 400 to 1500 nm range and higher than 95% for the 250 to 2500 nm range [
14]. In total, 48 spectra were collected.
3.3. Preprocessing
The atmosphere correction was applied to satellite images (Sentinel-2, ASTER, and Landsat 9) using Quick Atmospheric Correction (QUAC). QUAC can derive atmospheric correction parameters directly from the image itself without requiring any external data [
36].
With the atmospheric correction completed, all images were resampled to a spatial resolution of 3 m using the “Resize Data” tool in ENVI 6.0. This resampling was performed to standardize the spatial resolution across all sensors, enabling consistent inter-sensor comparison.
3.4. Spectral Analyses
After that, a first spectral analysis was performed. This analysis is crucial for identifying the alteration minerals associated with Au-Sb deposits. Since the aim of this work is to map iron oxides, they were the focus of the analysis. The analyses were conducted using a spectral analyst tool (ENVI) to match an unknown spectrum with reference spectra from a known spectral library [
37]. The spectral analyst provides a score where a higher score indicates a higher probability that the spectrum belongs to a specific mineral [
37].
Iron oxide minerals such as maghemite, zincite, Goethite, ferrihydrite, and Hematite were identified. Among the iron oxides in the study area, we detected that Hematite and Goethite are the most representative minerals. After identifying the key iron oxides, a spectral resampling was performed to convert the iron oxide spectra to PS spectral resolution using the spectral resampling tool (ENVI). The spectra were then saved in a spectral library and used in final spectral analyses.
A final spectral analysis was conducted, in which, after composing graphs with the previously selected spectra (using OriginPro software 2025), it was possible to compare the main absorption features and reflectance peaks of the target minerals with the satellite bands. This allowed for an understanding of the advantages and limitations of the satellites in mapping these minerals.
3.5. Mapping Methods
BR is a common technique used in mineral exploration. It involves calculating the ratio between a band that reflects the target signal and a band that absorbs that signal [
14]. The difference between the reflecting band and the absorbing band highlights specific characteristics of the target [
14]. Many works use Fe
3+ as a key to map Hematite, and it can also be applied to map Goethite [
22,
26,
38].
To analyze the potential of PS satellites in detecting iron oxides, we developed and tested a new spectral ratio for PS while applying recognized methods to other satellites (
Table 2). We then assessed the similarity of the results to determine whether PS can achieve comparable outcomes to satellites with proven effectiveness in identifying these minerals. We focused on mapping the primary iron hydroxides associated with Au-Sb mineralization in Freixeda, specifically Hematite and Goethite. Threshold values were applied to mask spectral outliers, following the approach of Chirico et al. [
16], to exclude anomalous high-reflectance pixels unrelated to iron oxide signatures. Since we are working with different sensors, it is not possible to define a single threshold value for all of them, as the minimum and maximum band ratio (BR) values vary depending on the satellite.
3.6. Data Standardization
As we are working with different sensors, normalizing the data to a [0, 1] scale facilitates direct comparison between sensors. Additionally, standardized data eliminates scale differences that could negatively impact the correlation analysis between results from different satellites. To standardize the data, the following equation was applied to BR:
where min(BR) is the minimum pixel value of the BR and max(BR) is the maximum pixel value of the BR.
3.7. Post-Processing
It was necessary to mask higher values in BR, as these corresponded to a small number of pixels that were not representative of the study area and were associated with false positives, such as urban areas. This step was taken because, when applying color slices, these higher values distorted the scale, making it difficult to accurately interpret the distribution of the values within the area of interest. Masking these outliers ensured that the resulting visualization was more representative and better aligned with the study’s objectives. The masked values can be observed in
Table 2.
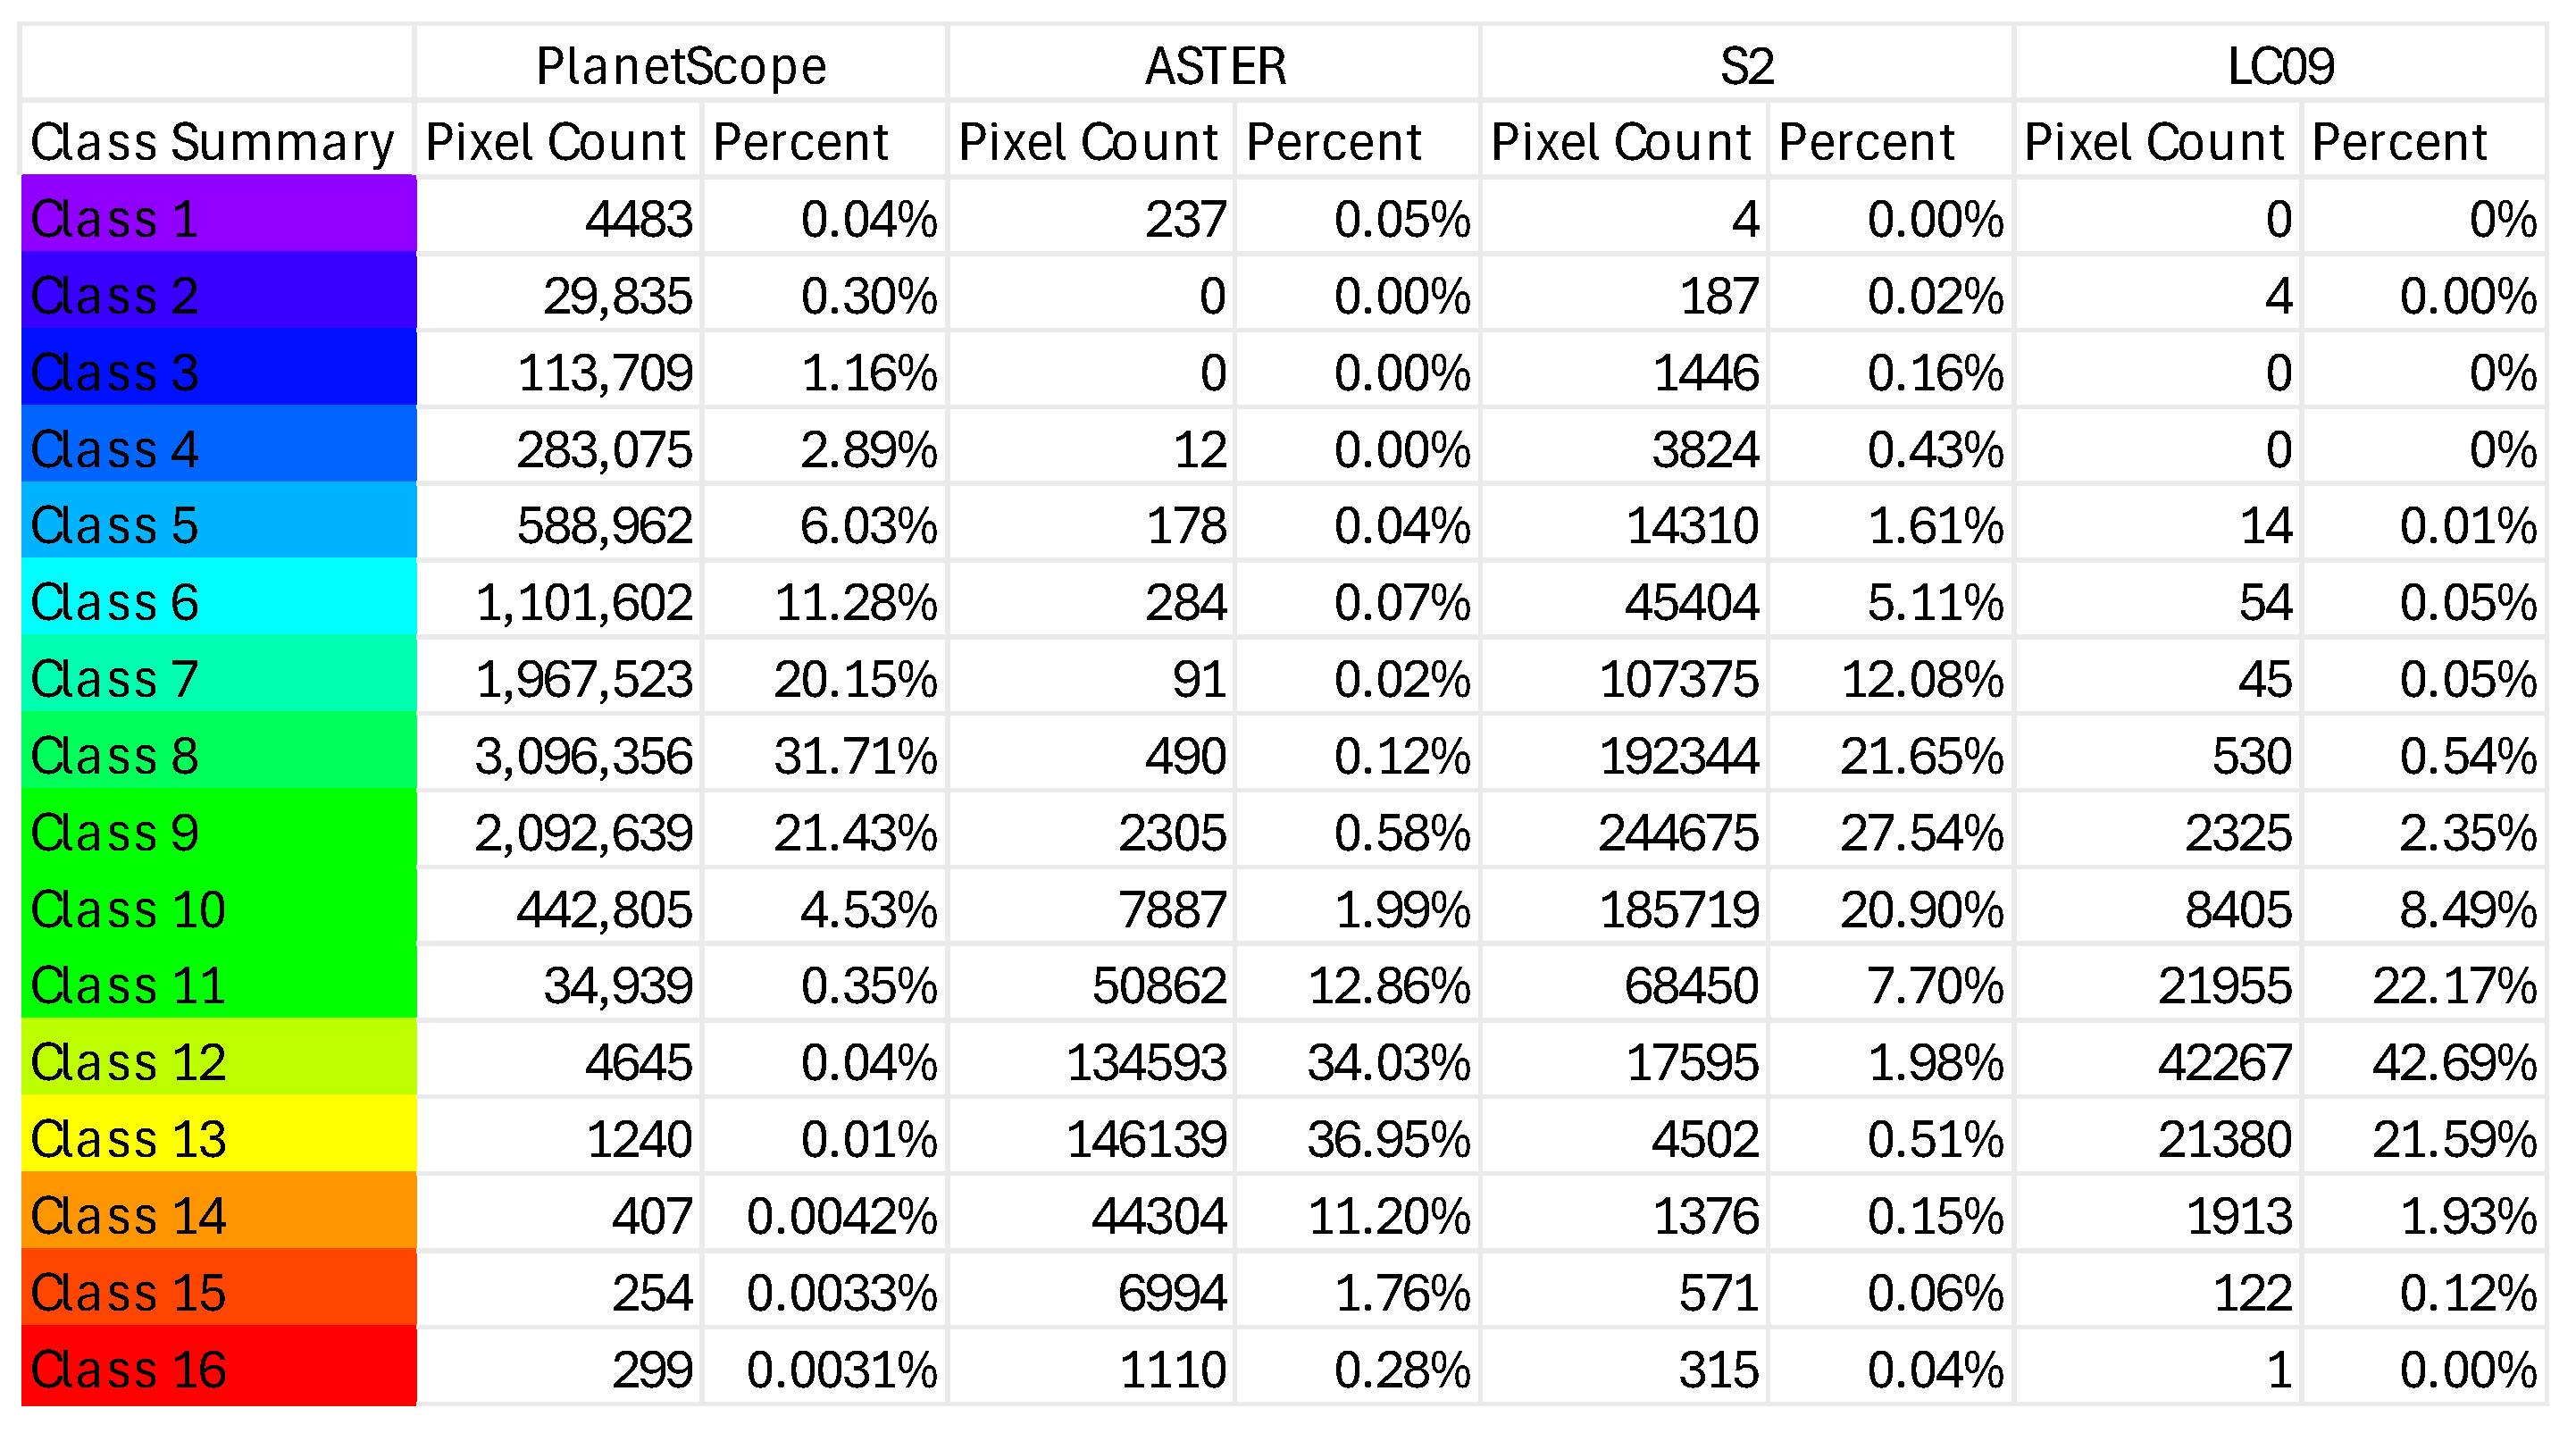
The Color Slices tool was applied using the Color Slices function in the ENVI software. This tool allows selecting data ranges and assigning colors to highlight specific areas in an image. Automatically, the data is organized into 16 intervals, which we will refer to as classes. Each class represents a specific interval of digital number (DN) or reflectance values, and is assigned a unique color. While cool colors represent the lowest values, warm colors represent the highest values.
3.8. Mapping Regions of Interest
A fuzzification (by fuzzy overlay) was computed to identify possible regions of interest (ROIs) for iron oxides in Freixeda. The fuzzy overlay combines raster data, based on the selected overlay type [
39]. By applying fuzzification, the integration of data from multiple sensors enables a more robust and reliable delineation of target zones [
40,
41,
42].
Identifying ROIs is crucial to compare the results of the satellites and to understand the capability of the PS image to identify the same ROIs.
Two tests were conducted using the GAMMA function of fuzzy overlay. Test 1—Using all the BR from each satellite as input (γ = 0.9); test 2—A fuzzification (Sentinel-2, ASTER., Landsat 9) without PS (γ = 0); this will allow us to understand the impact of PS in the final result. The final result was analyzed with the help of high-resolution true color composites and geological maps to discard false positives and choose the ROIs.
3.9. Relative Comparison (Ratio Between BRs)
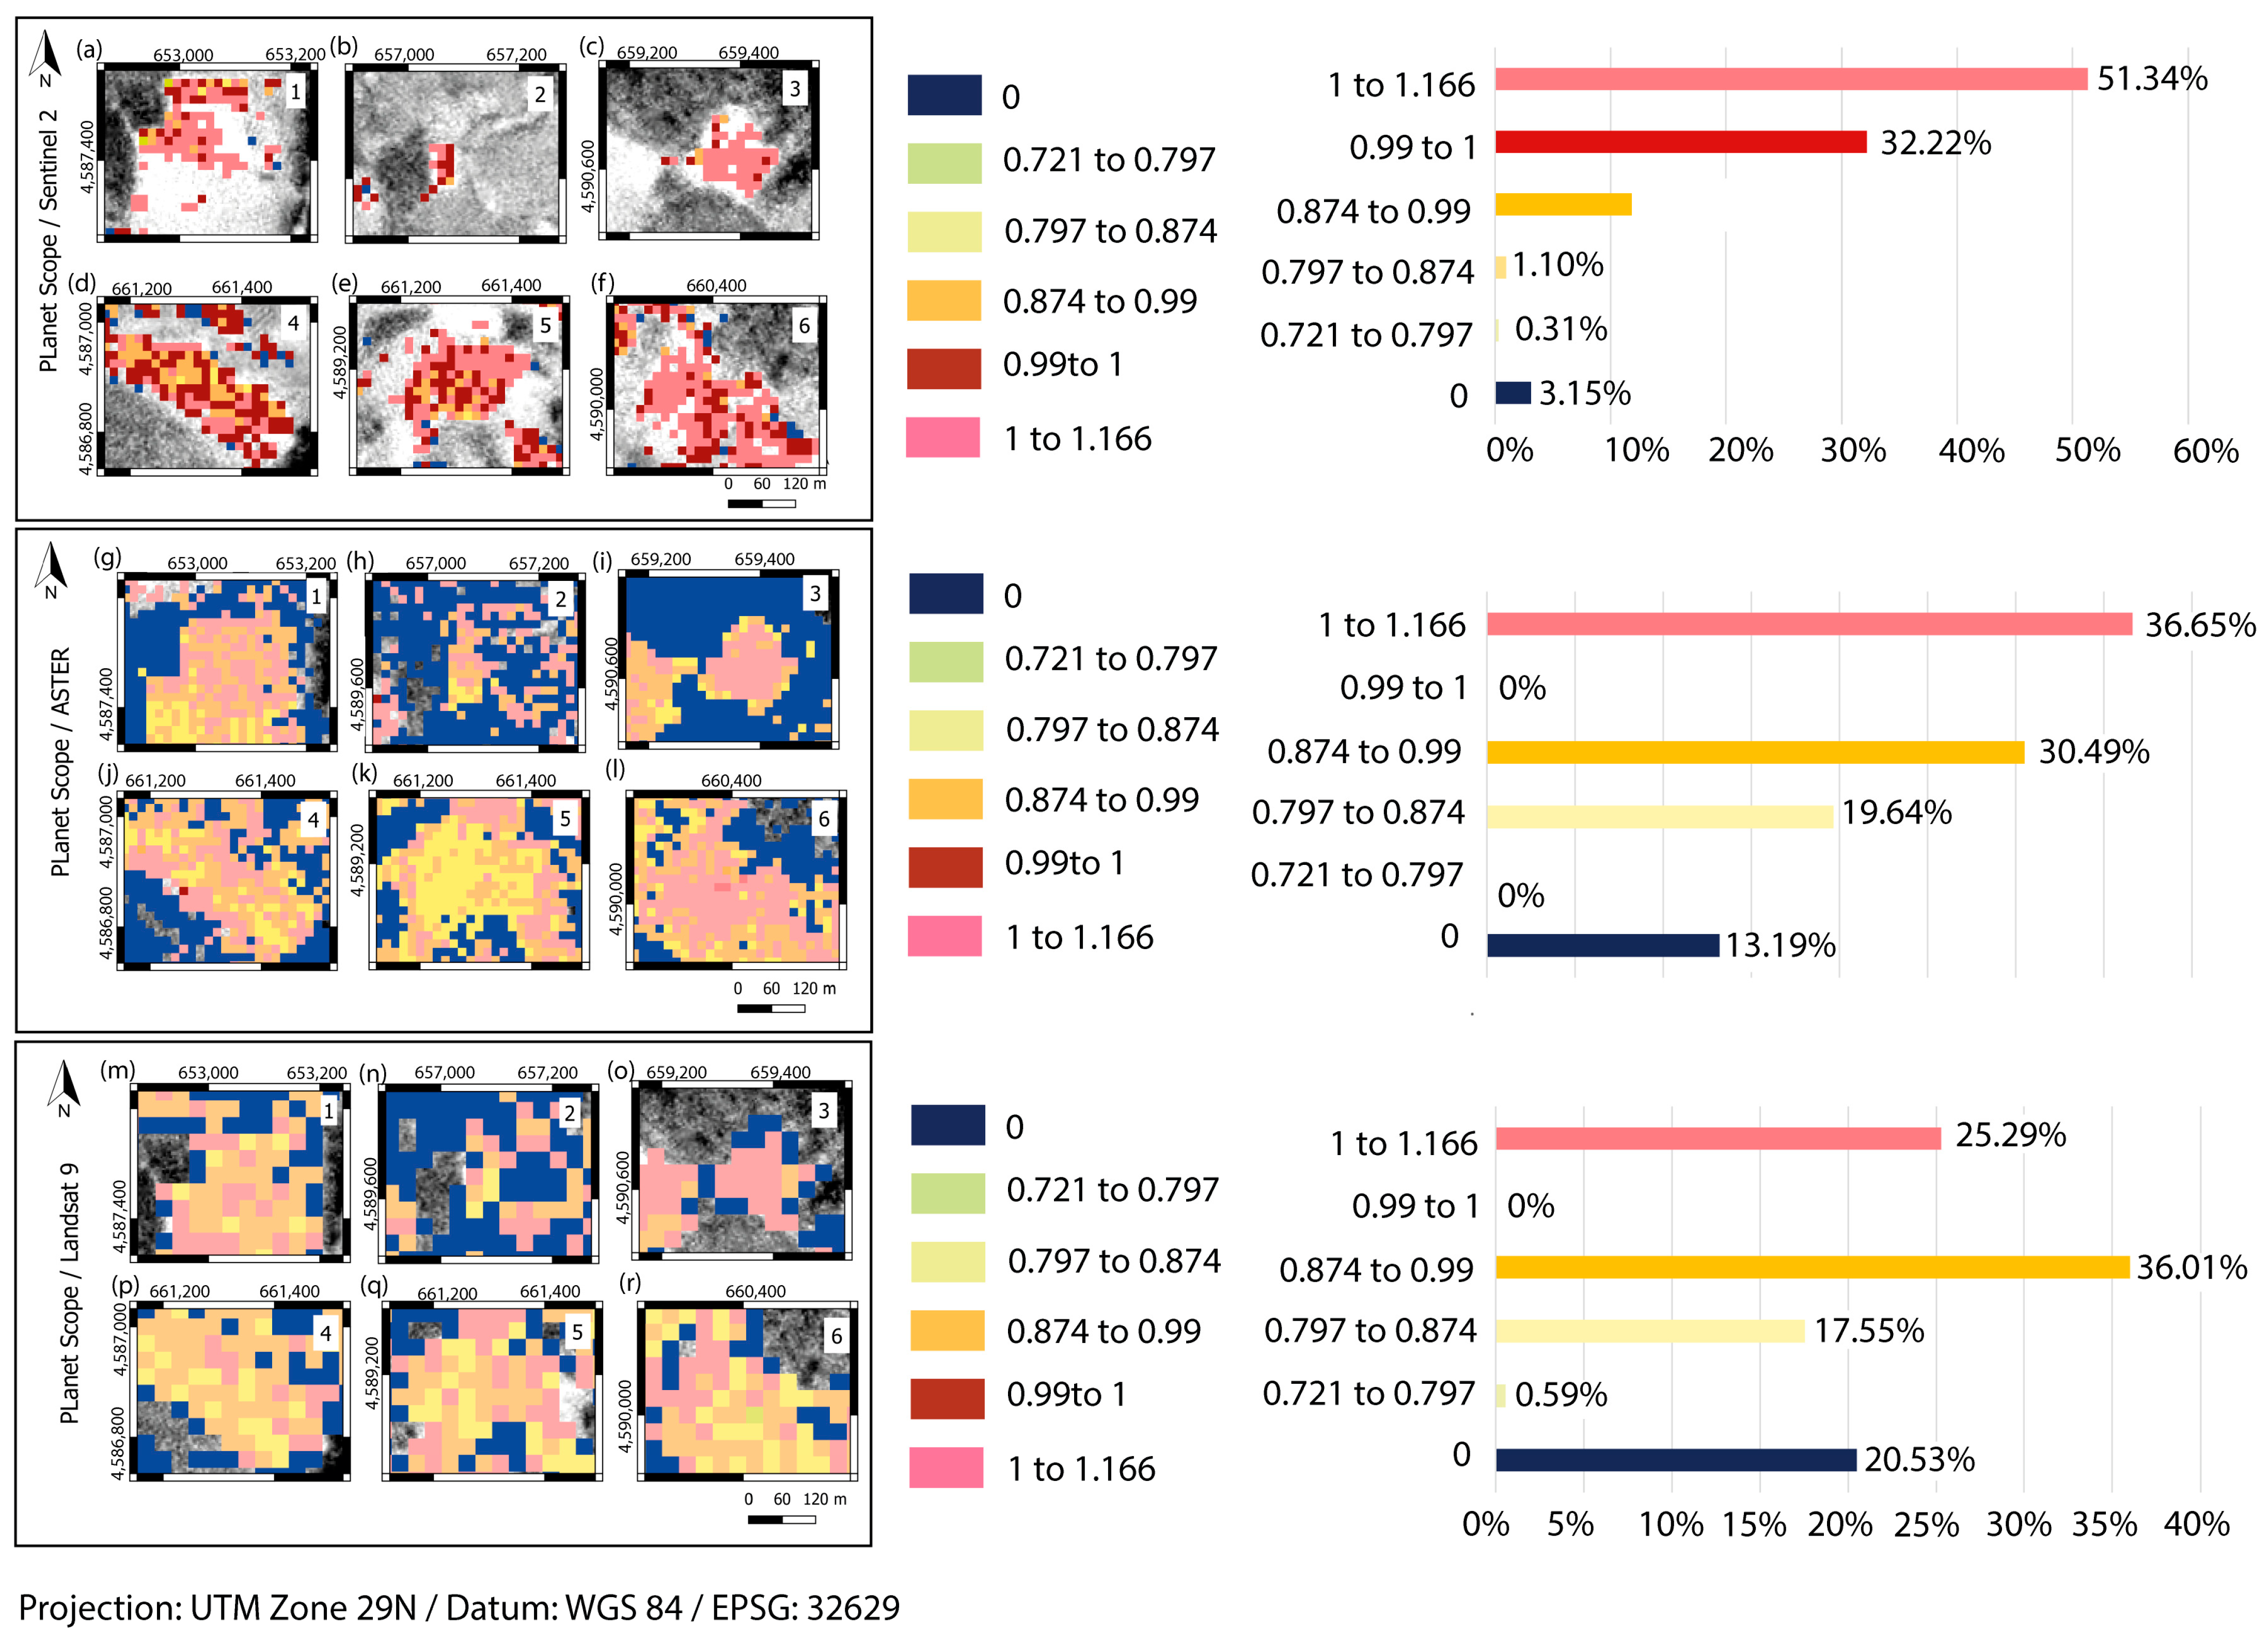
The BR results from each satellite were analyzed to better understand their similarities concerning PS results.
A cross-sensor band ratio comparison was applied to examine the relationship between values detected by different satellites. The results from each satellite (represented in color slices) were used to compute the ratios. This process involves calculating the ratio between the BRs of two satellites for each pixel, always using the PS BR as the dividend. To interpret these ratios, specific thresholds were established to classify the similarity between the results of PS and the other satellites:
Positive results are all those between ≥0.5 and ≤1.99.
Between 0.5 and 1, the PS identified fewer iron oxides than the other satellite, but there was no significant difference in the results.
Between 1 and 1.99, the PS identified more iron oxides, but again, without any abnormality in the results.
Values ≥ 2, based on the logic of the ratio, imply a significant discrepancy between the results.
On the other hand, values > 0 and ≤0.5 indicate that the PS identified far fewer iron oxides than the other satellite, which is, therefore, not an ideal result.
This approach has advantages, such as allowing an understanding of the proportion or relationship between the values detected by the satellites instead of just absolute differences. It enables a direct interpretation of the values, providing a clear and objective analysis of the results, which can be assessed both qualitatively and quantitatively. It also allows for analyzing the sensor’s spectral sensitivity in detecting the target mineral (in this case, iron oxides).
However, the method also has its limitations. Due to the nature of ratios, division by zero is undefined. Therefore, when ASTER, Sentinel-2, or Landsat 9 have a value of 0, the ratio result will be NoData. If both satellites have a value of 0, the result will also be NoData. On the other hand, if PS has a value of 0, the ratio result will be 0.
Although it is possible to apply filters or replace the NoData value with a real number, it was decided to keep it to preserve the integrity of the original data and avoid distortions in the results. Additionally, NoData values indicate areas with invalid or missing data, ensuring transparency in the analysis and facilitating its replication.
3.10. Validation and Evaluation
Fieldwork was conducted to collect samples and survey the identified regions of interest. Both rock and soil samples were collected during the field campaign; however, this study focuses exclusively on the soil samples. Aerial reconnaissance was performed using a high-resolution drone, DJI Mavic 3 Pro (sensor 4/3 CMOS; Effective pixels: 20 MP), that captured RGB images and videos of the study area. The samples were oven-dried at 50 °C and sieved (<200 µm). After sieving and proper drying, five spectra were collected from each sample to ensure the representativeness of the data. The procedure for spectral analysis was the same as described in
Section 3.4.
5. Discussion
5.1. Spectral Analyses
The spectral analyst results indicate that iron oxides are less representative than sheet silicates in the study area. Goethite was identified in four spectra and Hematite in two spectra. Despite not being so representative, mapping iron oxides is a basic method of finding hydrothermal deposits.
Therefore, after spectral analysis results, a new spectral analysis was conducted focusing on Goethite and Hematite.
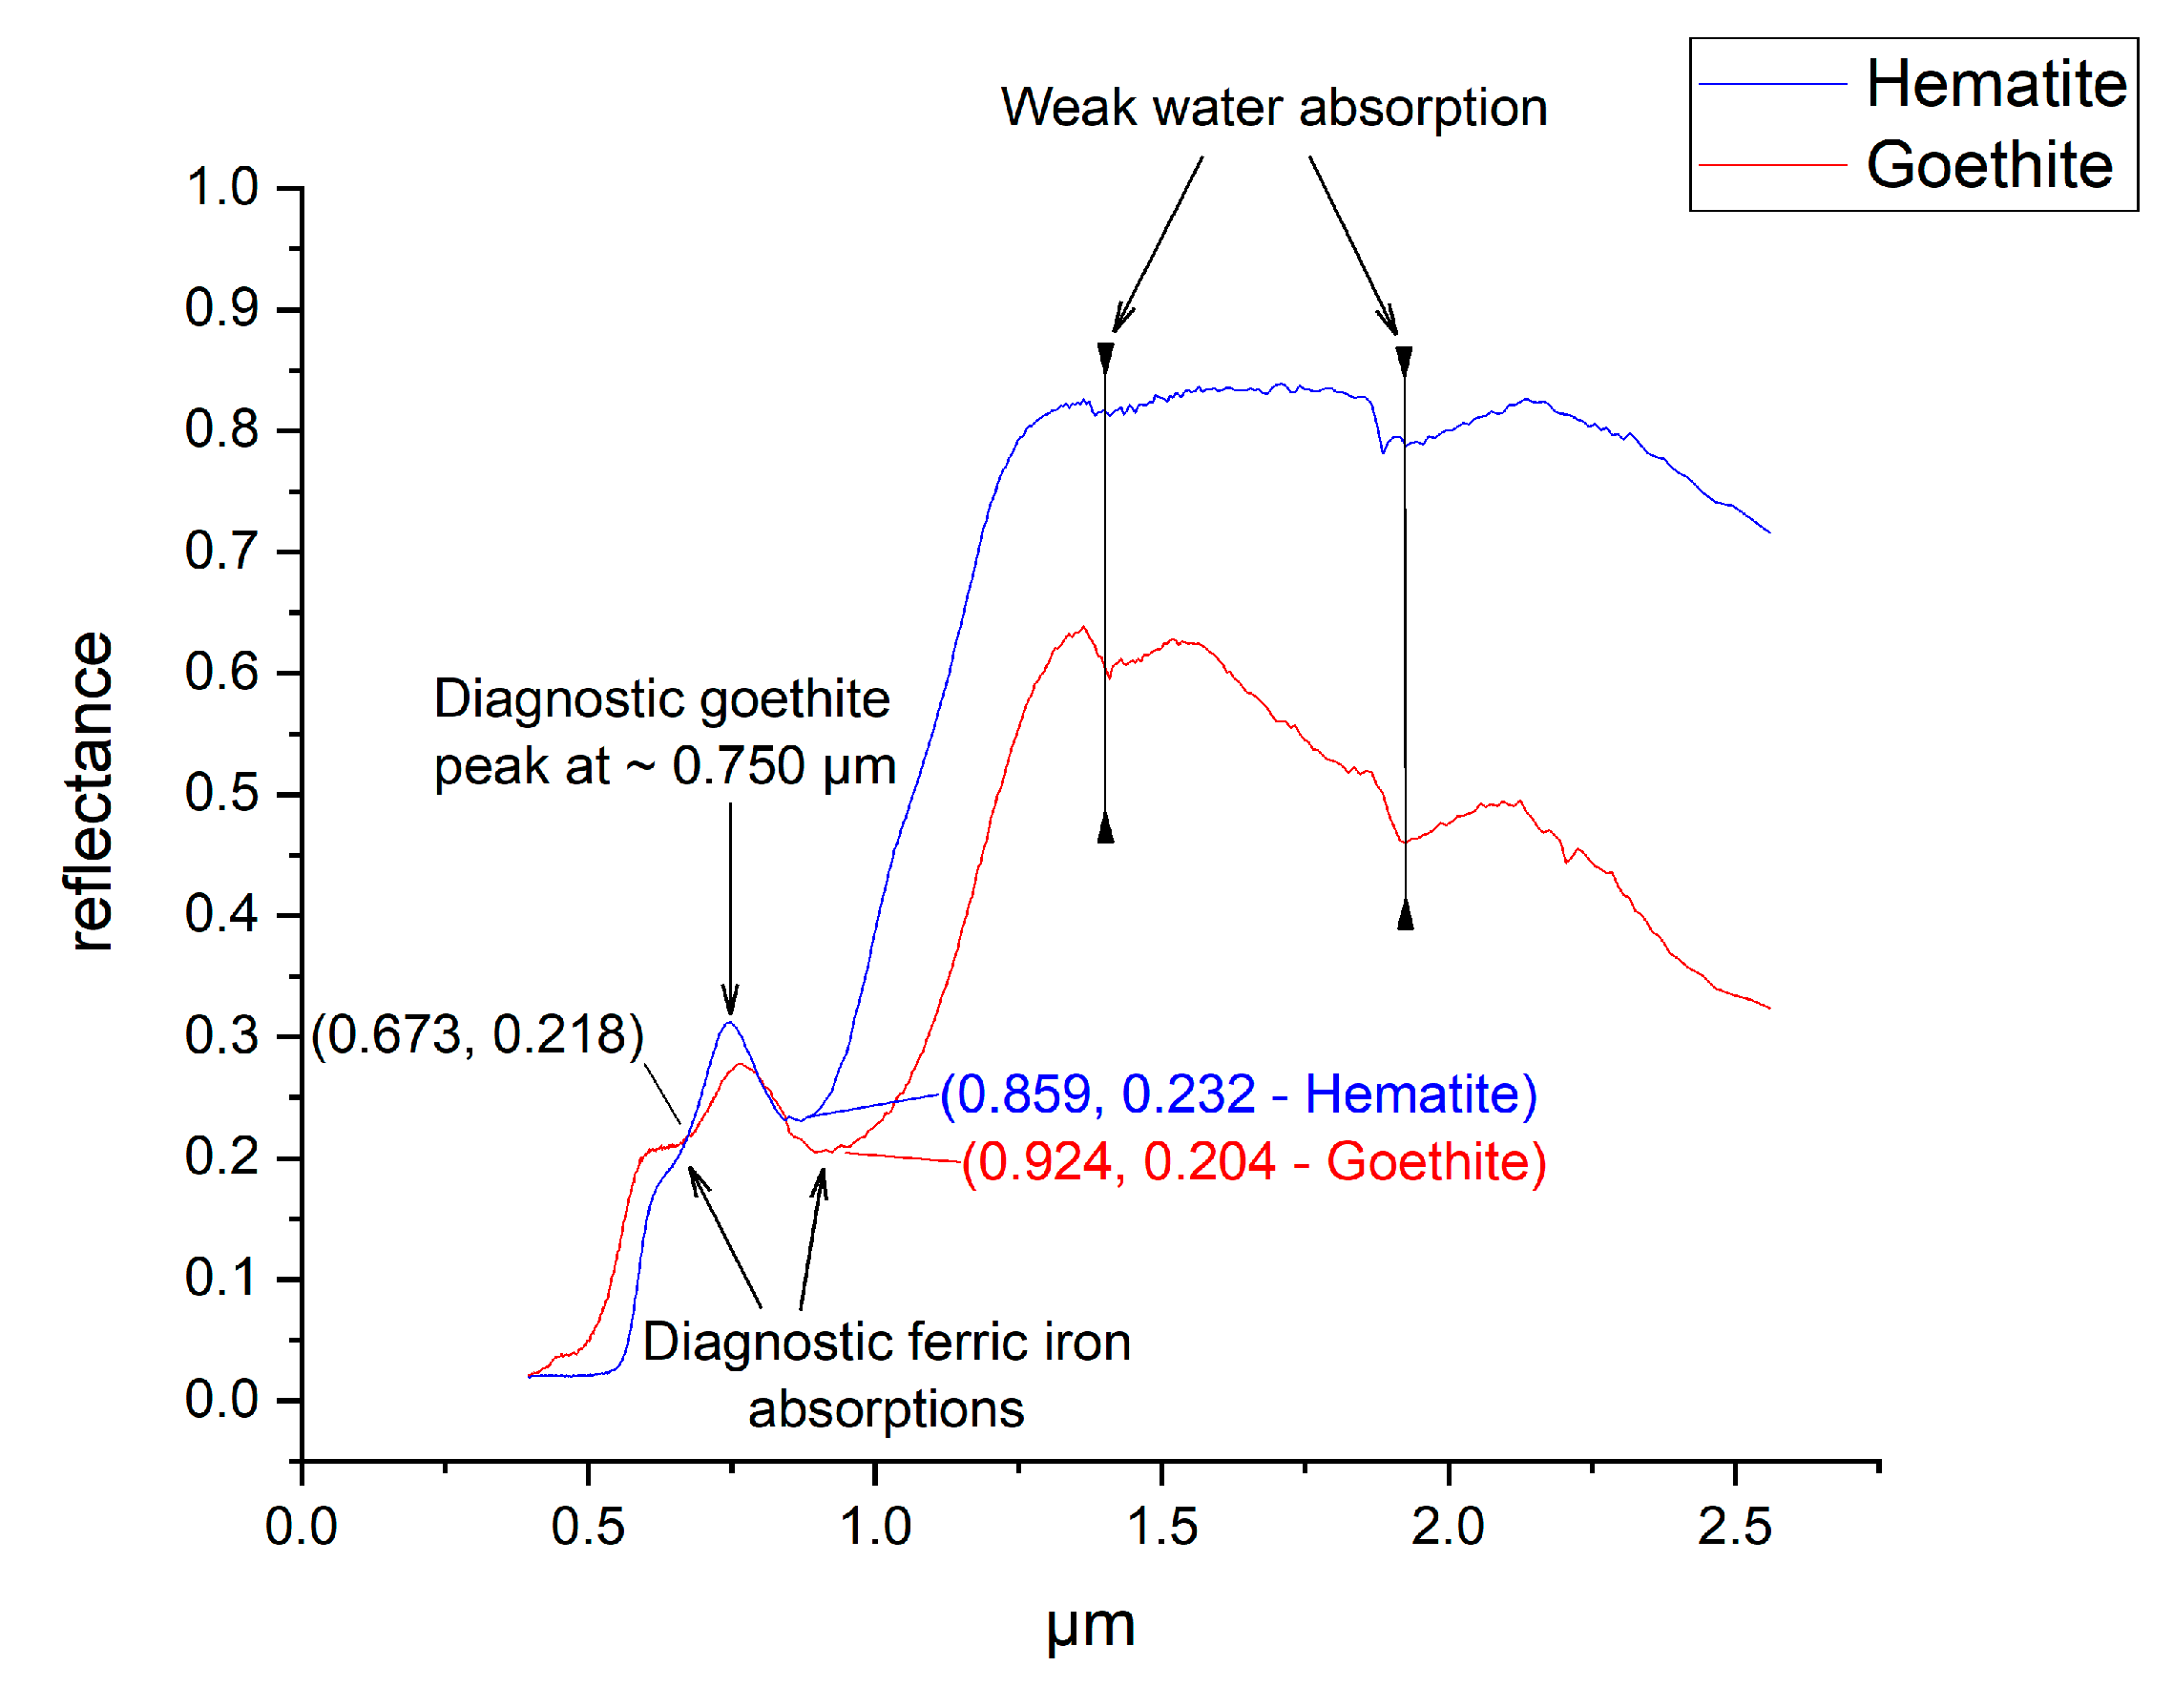
Figure 3 compares both Hematite and Goethite spectra, and it is possible to observe that there is a slight shift between their absorption features and reflectance peaks. However, due to the limited spectral resolution of multispectral satellites, both minerals often fall within the same satellite bands, making it challenging to differentiate between them [
46]. As a result, the same processing methods used to map Goethite can also be applied to Hematite [
46]. Therefore, while the Goethite spectrum was selected for analysis, it can be used to represent both minerals in this context.
5.2. BR
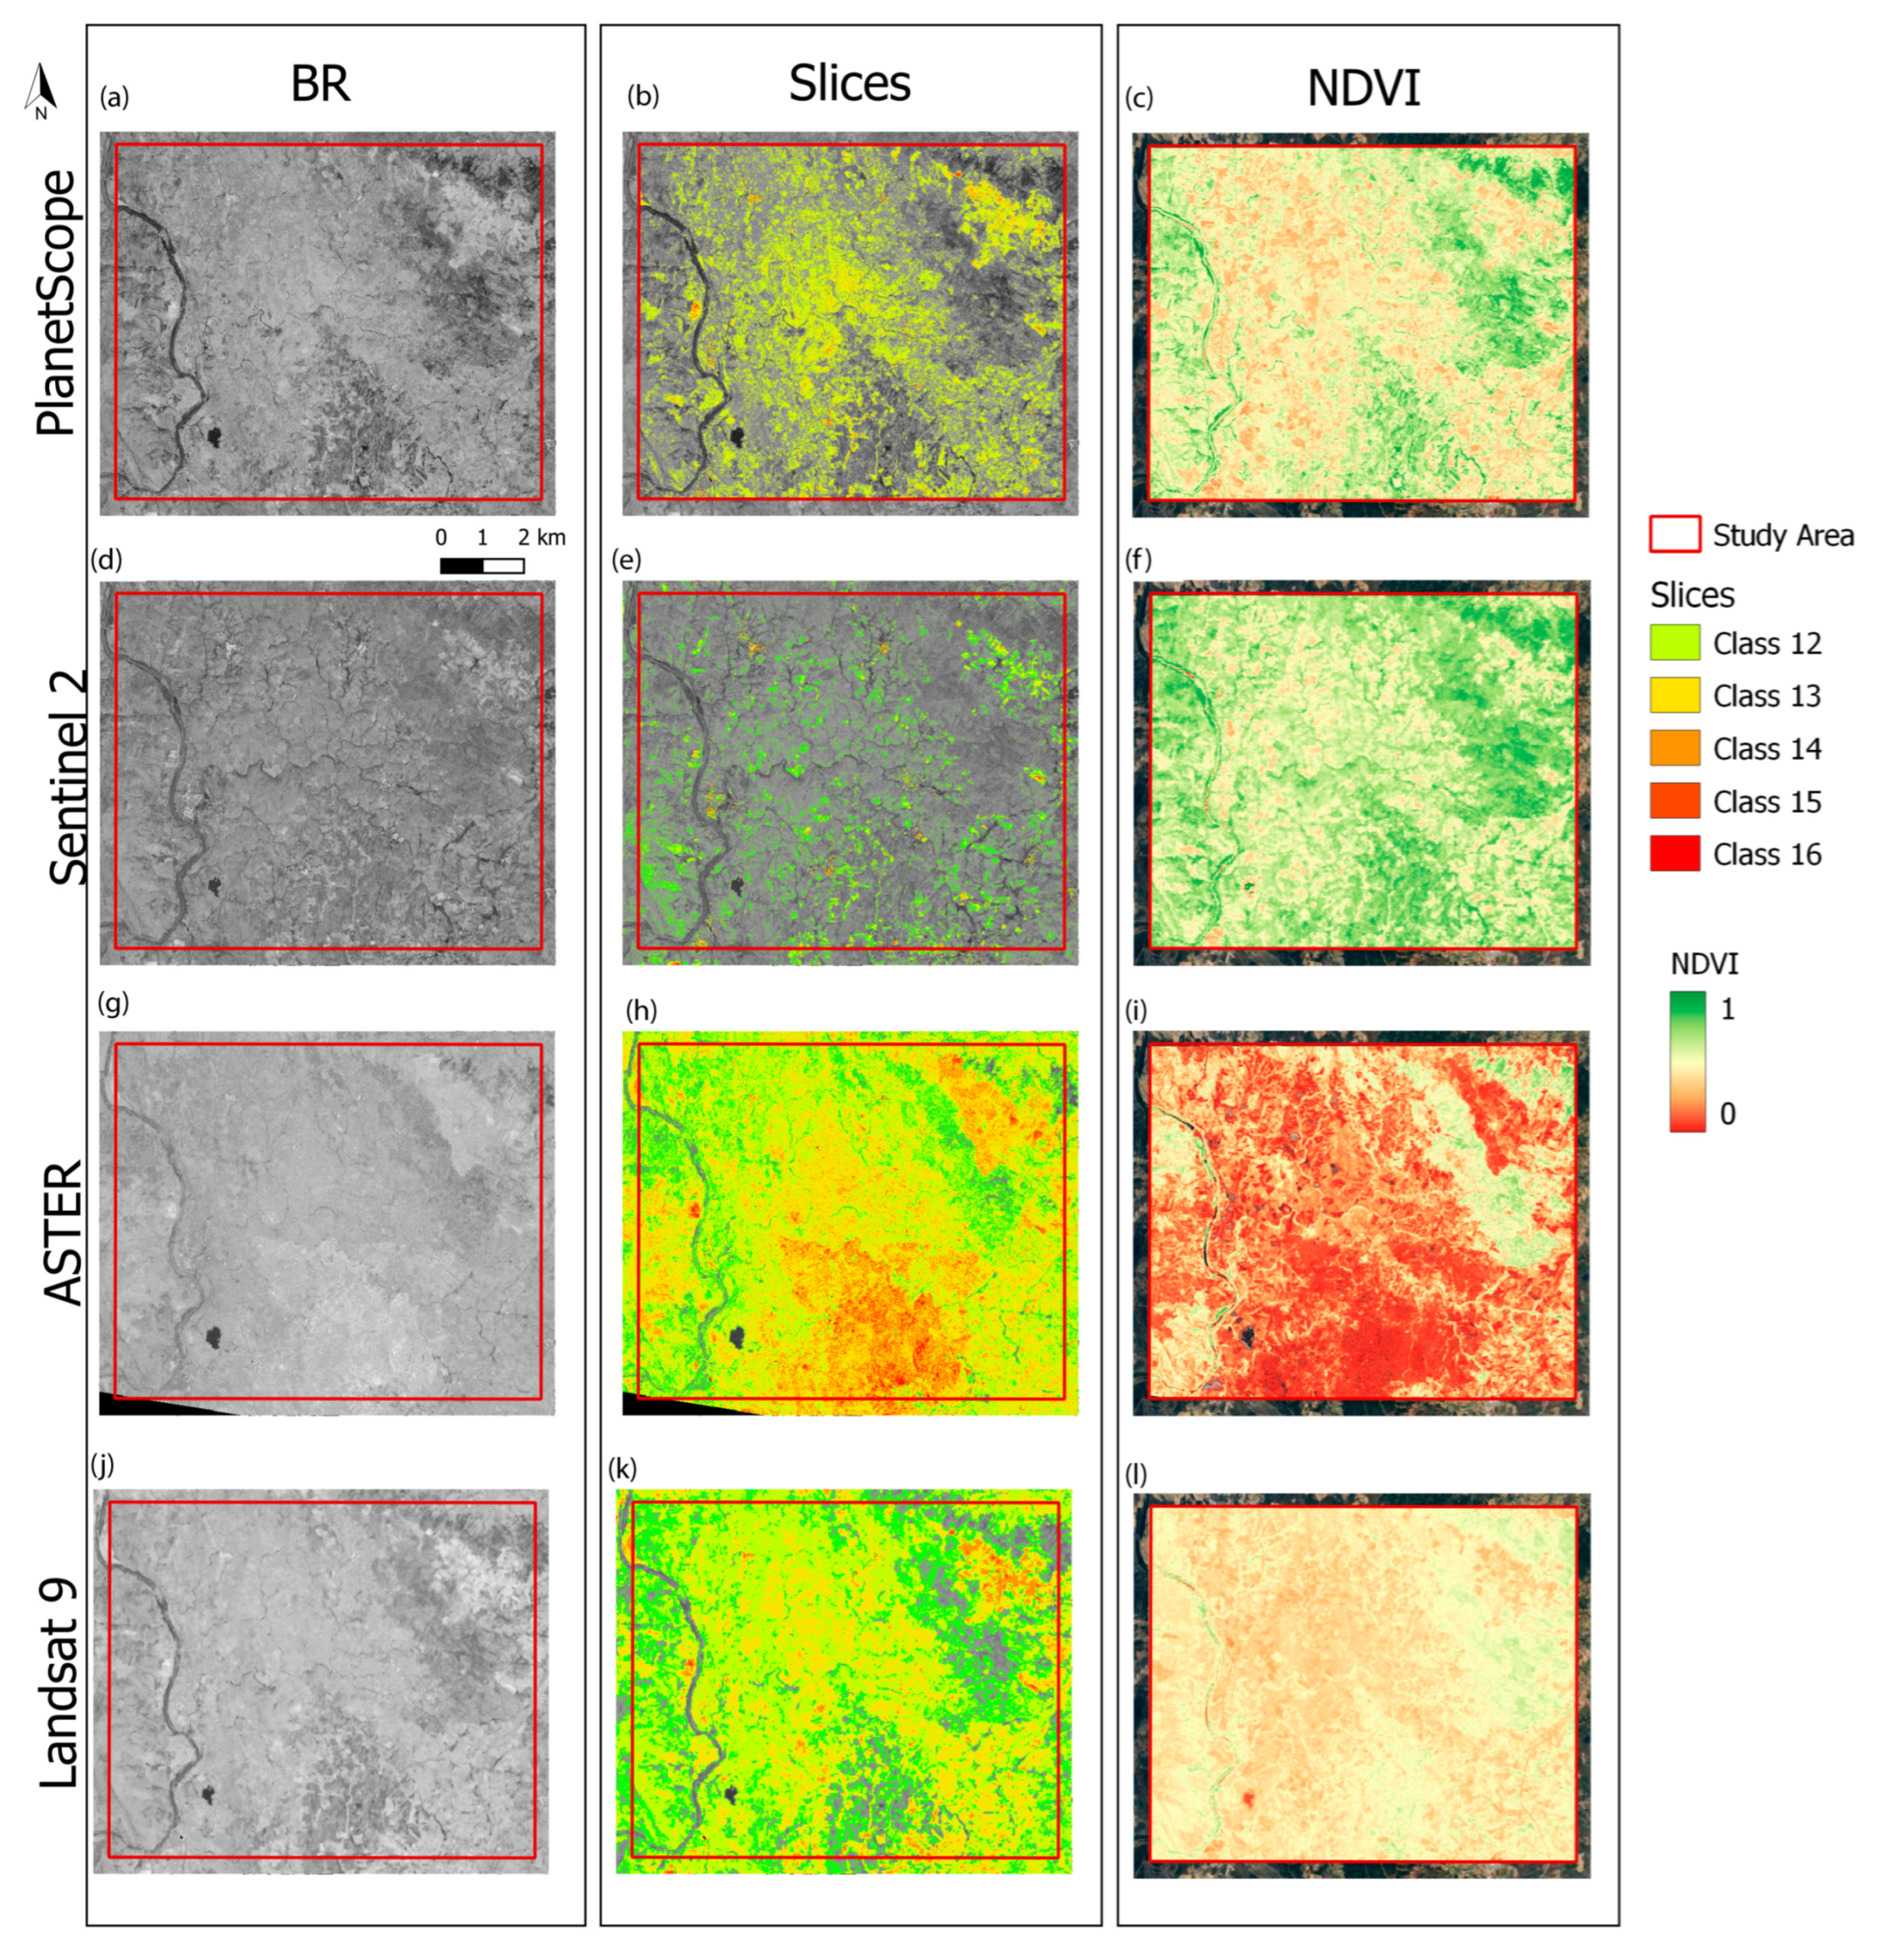
The results show that PS is the most sensitive in identifying pixels in the most important classes (classes 15 and 16), followed by Sentinel-2, while Landsat 9 proved to be the least sensitive, as it did not present significant results for class 16. ASTER performed distinctly, effectively identifying pixels in classes 13 and 14; however, upon further analysis, we observed that this high detection, especially in class 14, may indicate the presence of false positives associated with vegetation. In the results obtained for reflectance bands (RBs) of PS and Sentinel-2, classes 14, 15, and 16 have low values, but the pixels are distributed across areas of interest. Conversely, for ASTER and Landsat 9, the pixels are concentrated in class 14 rather than being distributed in classes 15 and 16, resulting in the formation of large clusters within a single class, which are not intuitive for identifying areas of interest.
We observed that the higher the spatial resolution, the greater the sensitivity in identifying pixels in the higher classes (15 and 16). Although ASTER and Landsat 9 identified pixels in medium-value classes (class 13) and high-value classes (class 14), these pixels were highly concentrated, forming large clusters that were not intuitive for prospectivity analysis. PS stands out overwhelmingly compared to the other satellites in detecting maximum-value pixels (class 16), the most important class for identifying iron oxides, highlighting its great potential for prospecting studies.
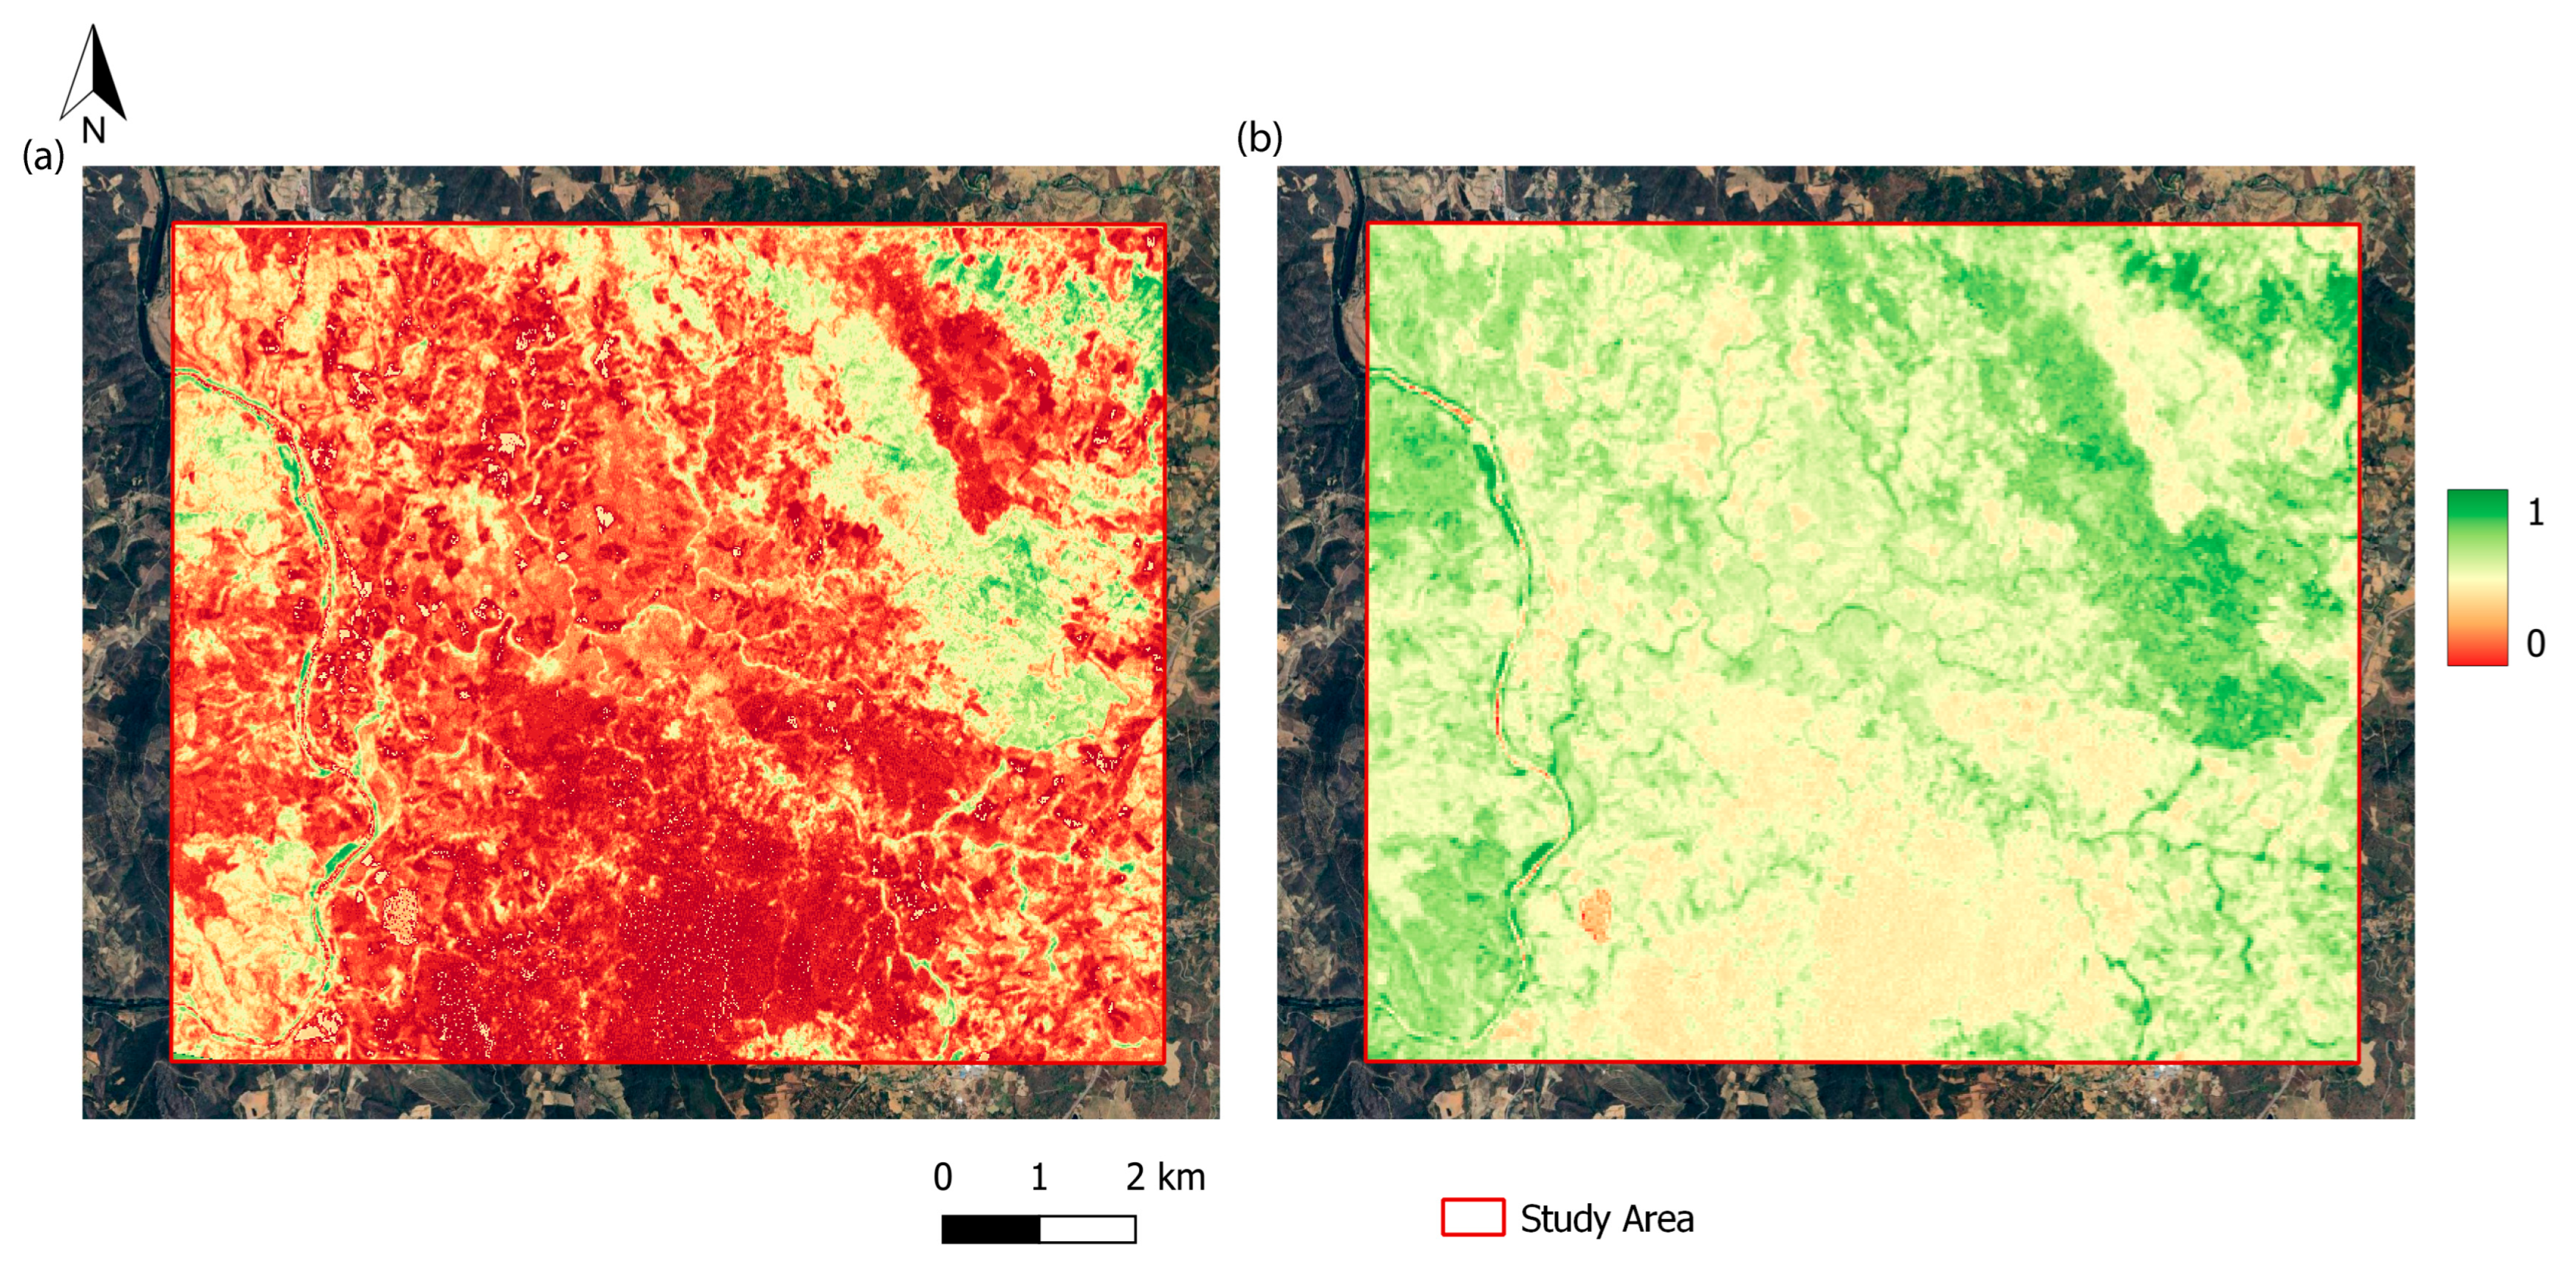
False positives related to non-vegetated areas were primarily observed in the BR 2/1 of ASTER, which misclassified extensive regions with sparse vegetation as class 14. Among all satellites, ASTER was the only one that consistently confused vegetated areas with areas of interest. When analyzing the NDVI results (
Figure A4,
Appendix A), we observed that ASTER detected significantly less vegetation, especially in the central region of the image. By comparing the NDVI with a true-color image from the same year on Google Earth, we confirmed that this area is predominantly covered by sparse vegetation, which was not correctly identified by ASTER’s NDVI. Comparative studies have shown that ASTER’s NDVI tends to yield lower values compared to other sensors [
47]. Although similar band ratios were applied to other satellites, they did not show the same level of misclassification, suggesting that ASTER’s spectral response in this configuration is less effective at distinguishing subtle vegetation signals from background materials such as iron oxides.
Landsat 9 also presented false positives with vegetation, but in medium-value classes (12 and 13), which did not significantly affect the analysis compared to ASTER. PS and Sentinel-2 showed no false positives with vegetation, as in both cases, vegetation was identified with low values, ensuring greater reliability in detecting iron oxide occurrences.
5.3. ROIs
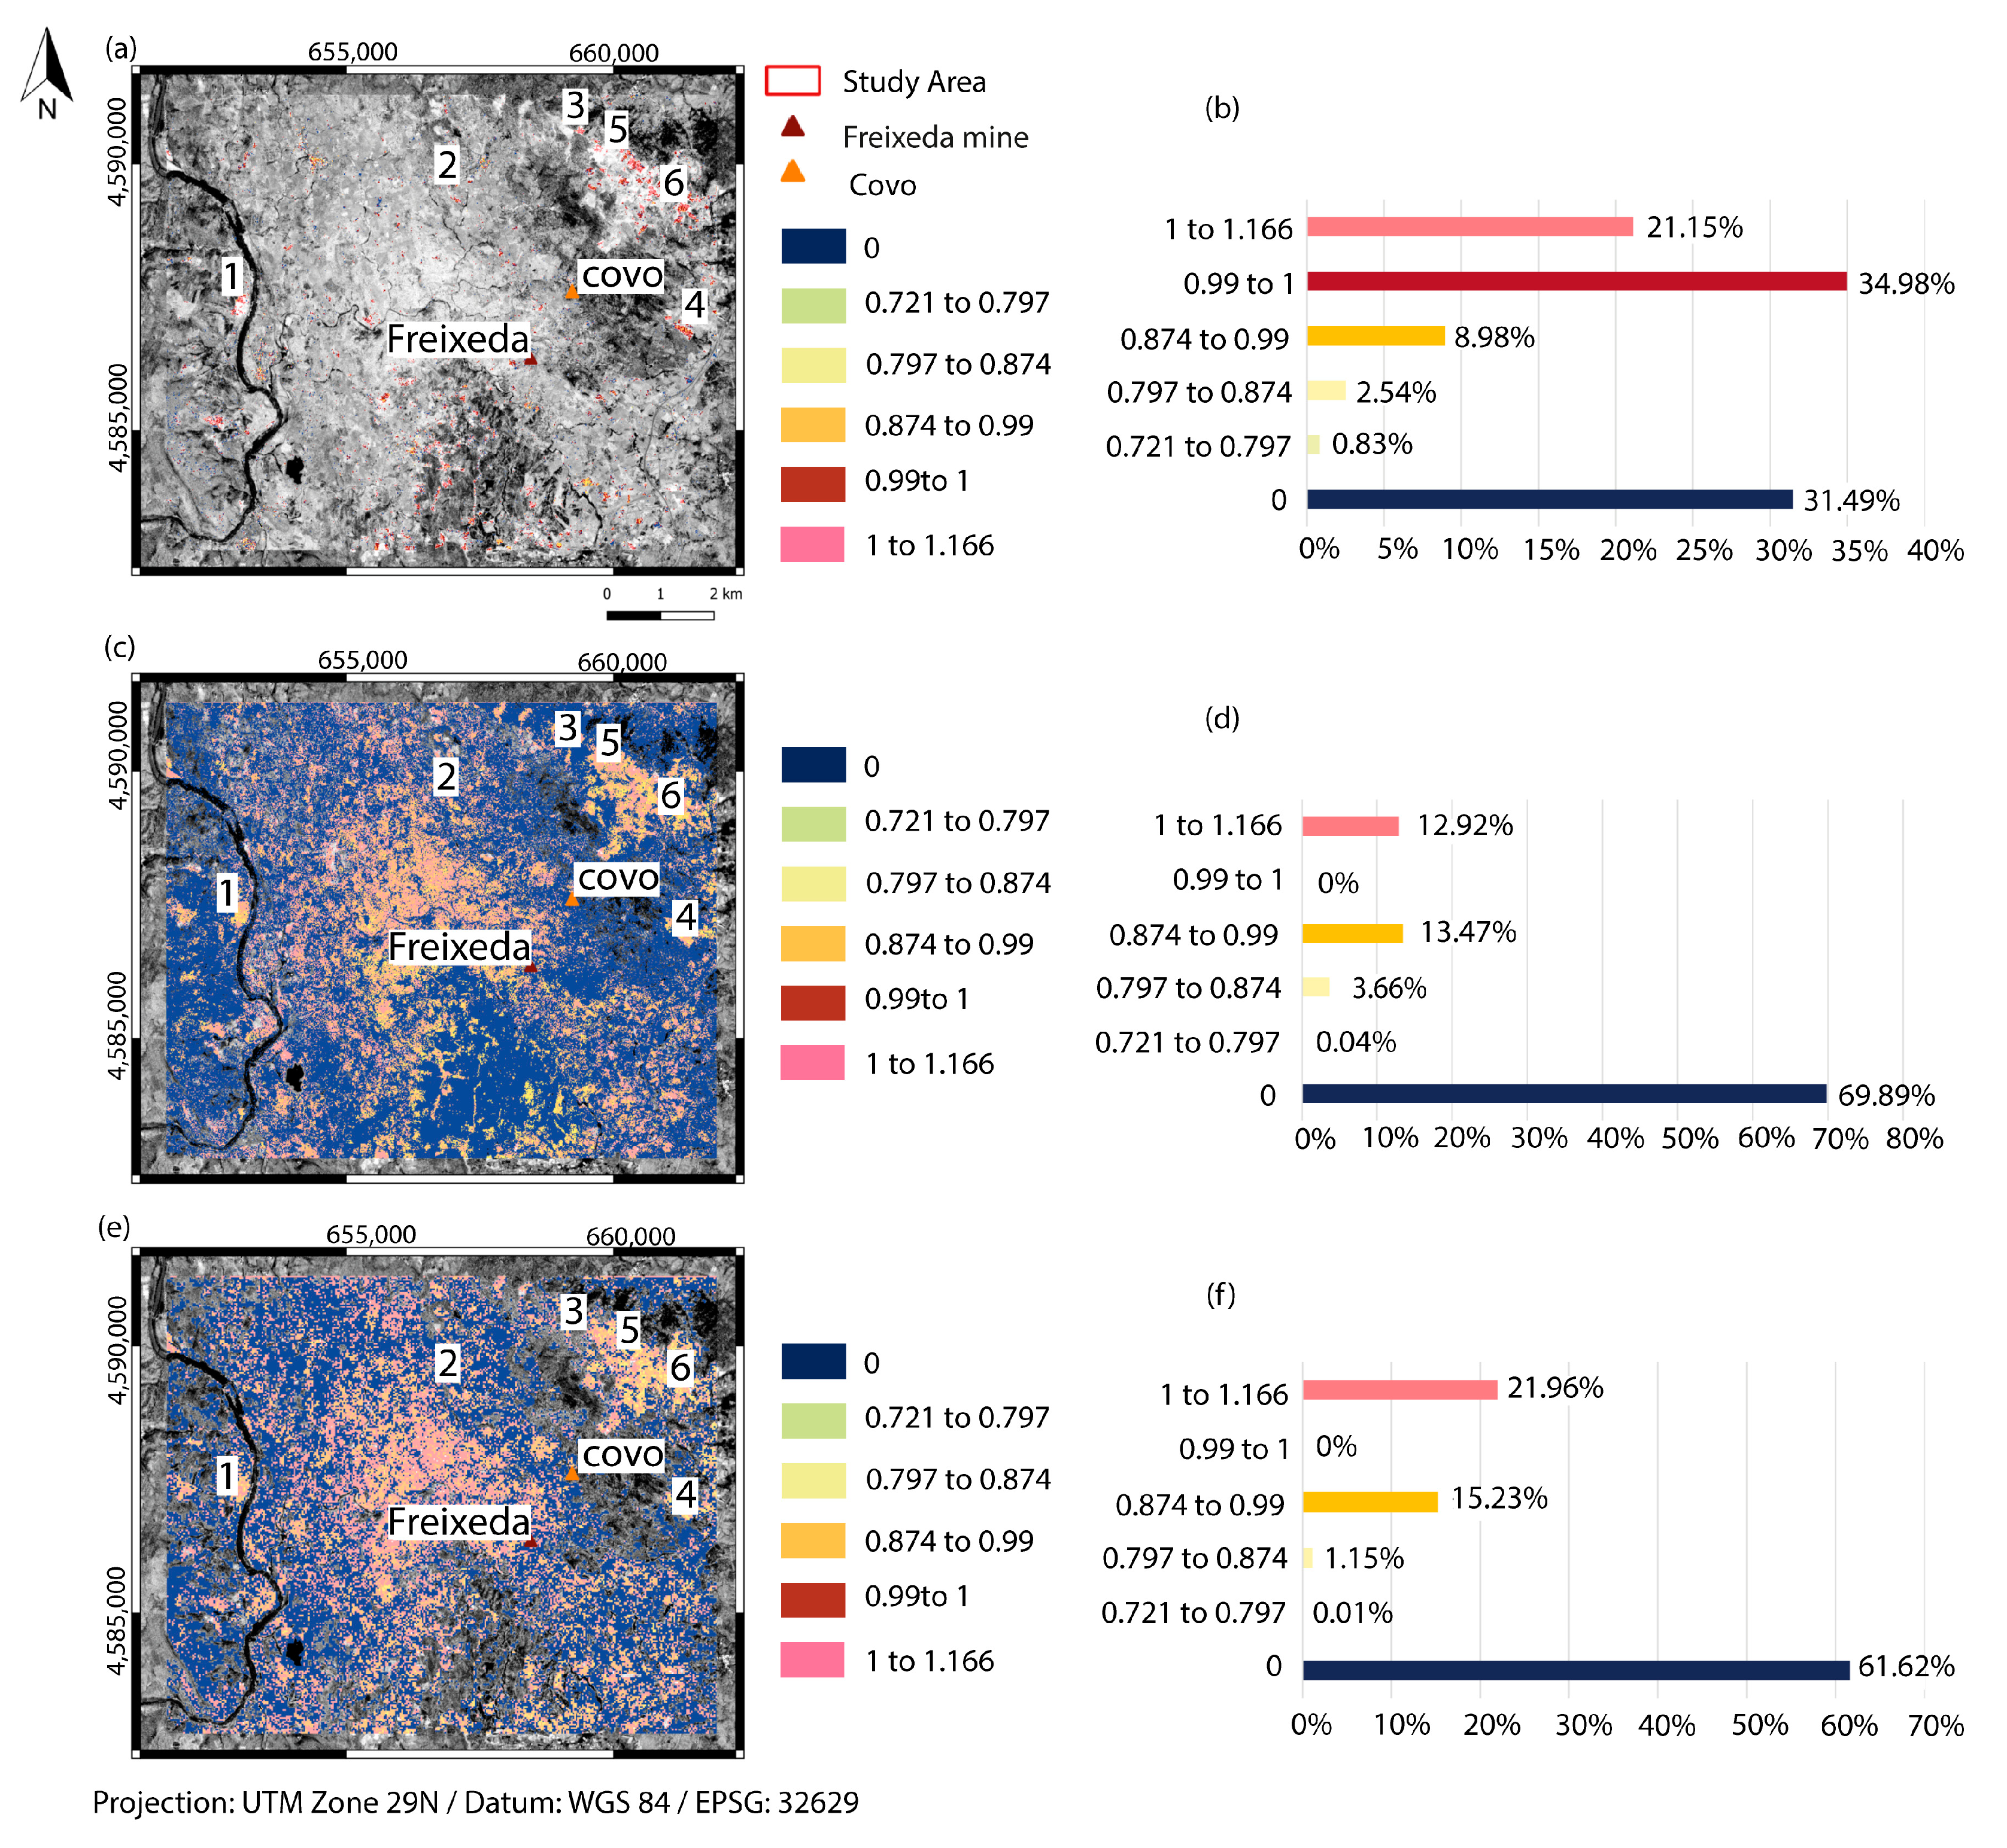
It is possible to observe in
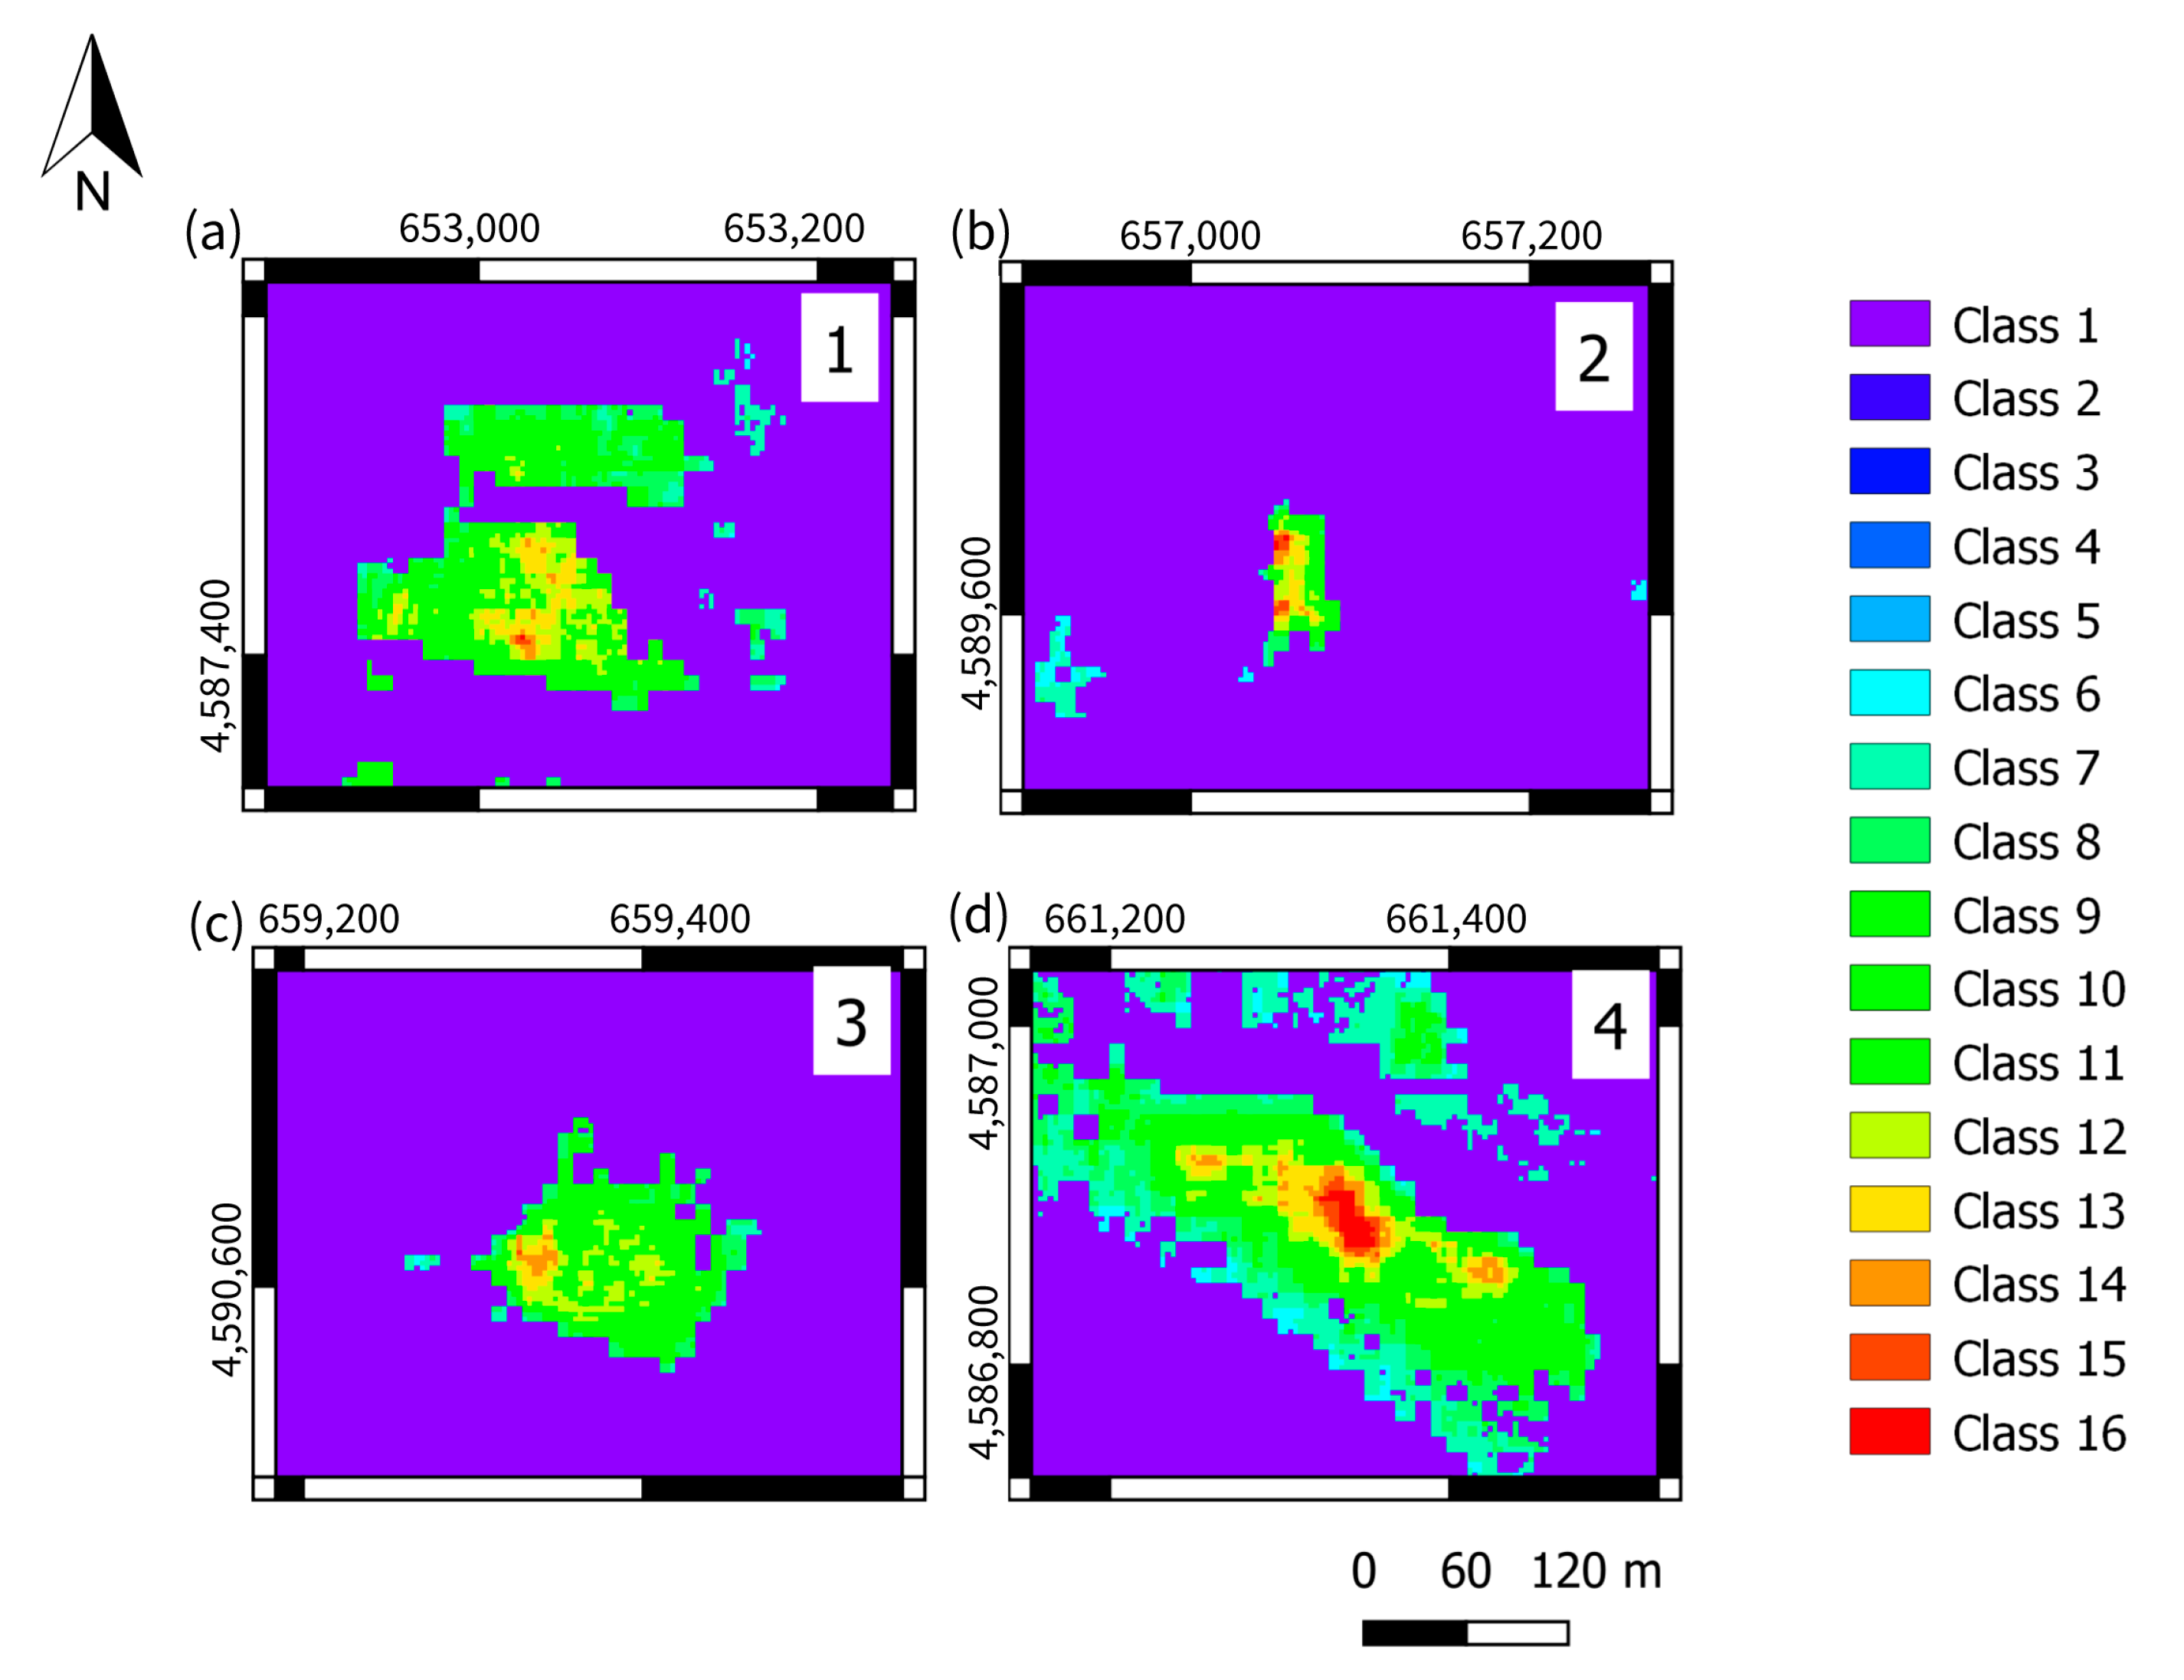
Table 3 that Test 2 identified more pixels in class 12, while Test 1 detected more pixels between classes 13 and 16. Notably, classes 15 and 16 are the most important for identifying iron oxides.
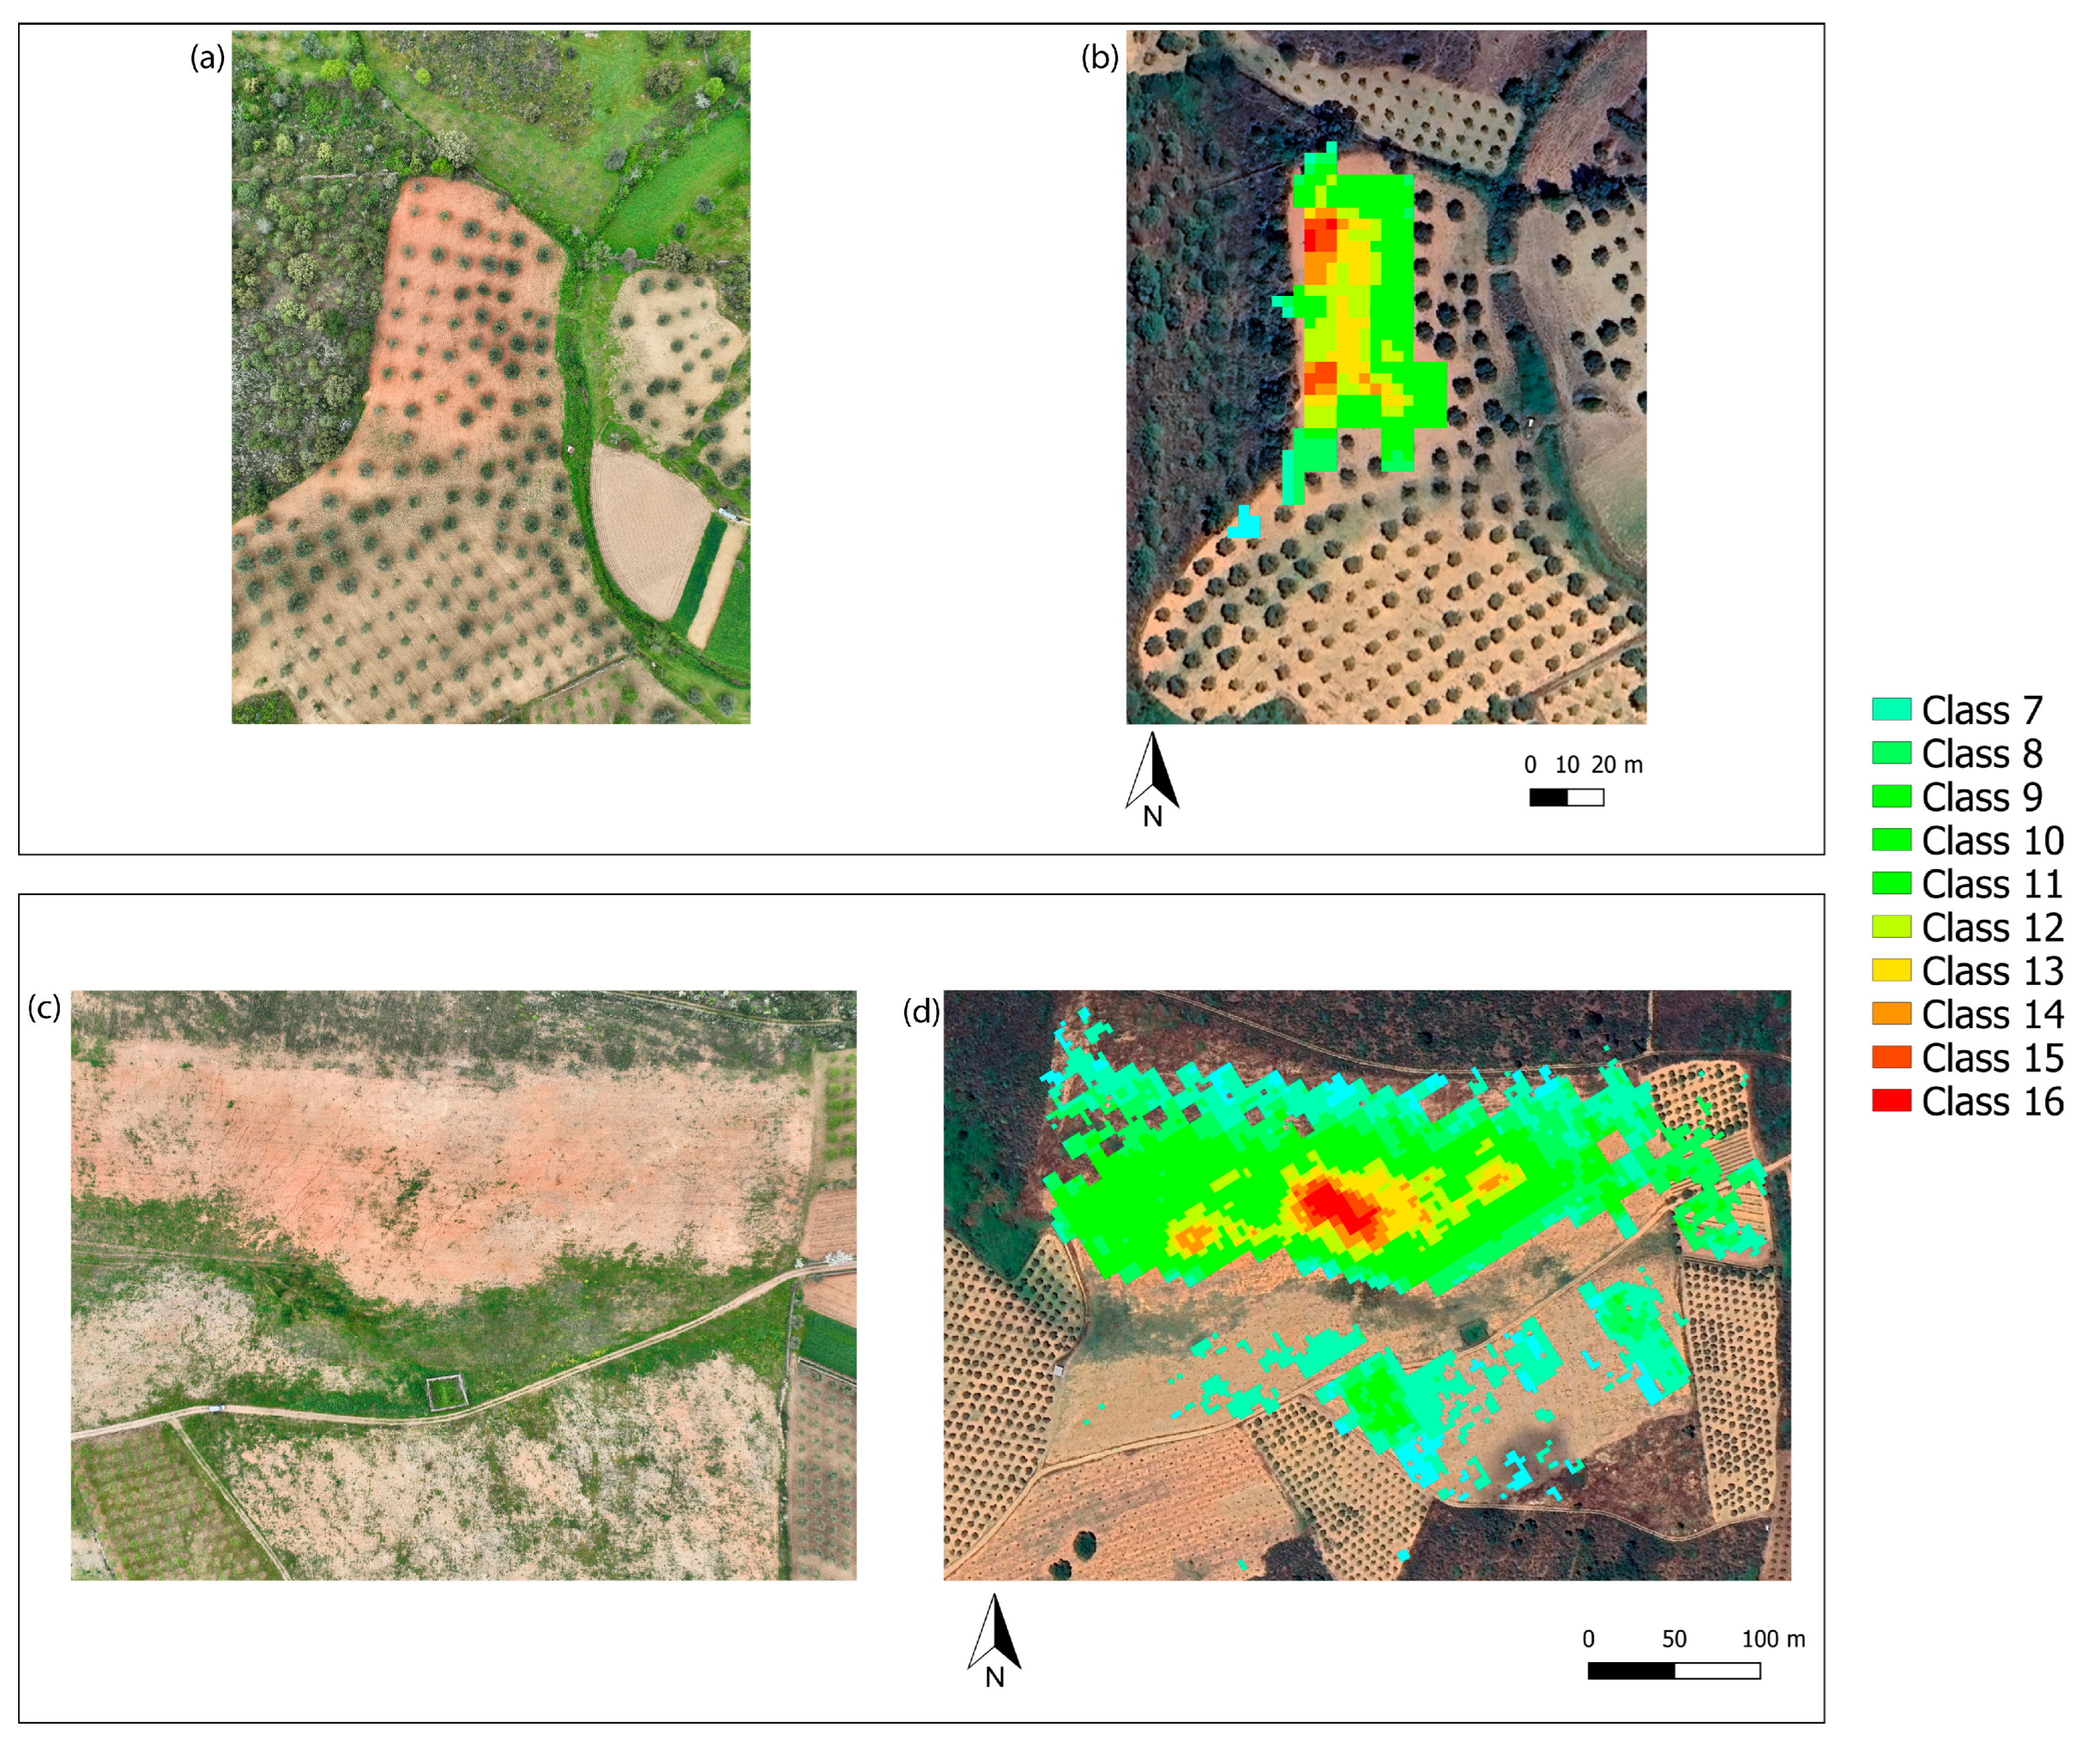
Test 2 identified more zones of interest than Test 1. However, upon analyzing the results, we can observe that this higher number of ROIs in Test 2 was primarily identified by pixels in classes 12 and 13. In contrast, Test 1 contains more pixels in the higher classes (14, 15, and 16). This suggests that PS influenced the fuzzification process, reducing the number of pixels representing iron oxides with lower values and increasing the number of pixels identified with higher values. This effect, as seen in
Figure 5c,d, is the formation of well-defined and restricted areas of interest, allowing for a more objective and effective field analysis.
For example, in ROI 3 (
Figure 5a), there is a concentration of high-value pixels (classes 15 and 16) in the southwestern corner of the ROI. In ROI 4 (
Figure 5d), the high-value pixels (classes 15 and 16) are concentrated in the center of the ROI. The clusters observed in
Figure 5 allow the field validation team to directly target locations with a higher probability of iron oxide occurrences.
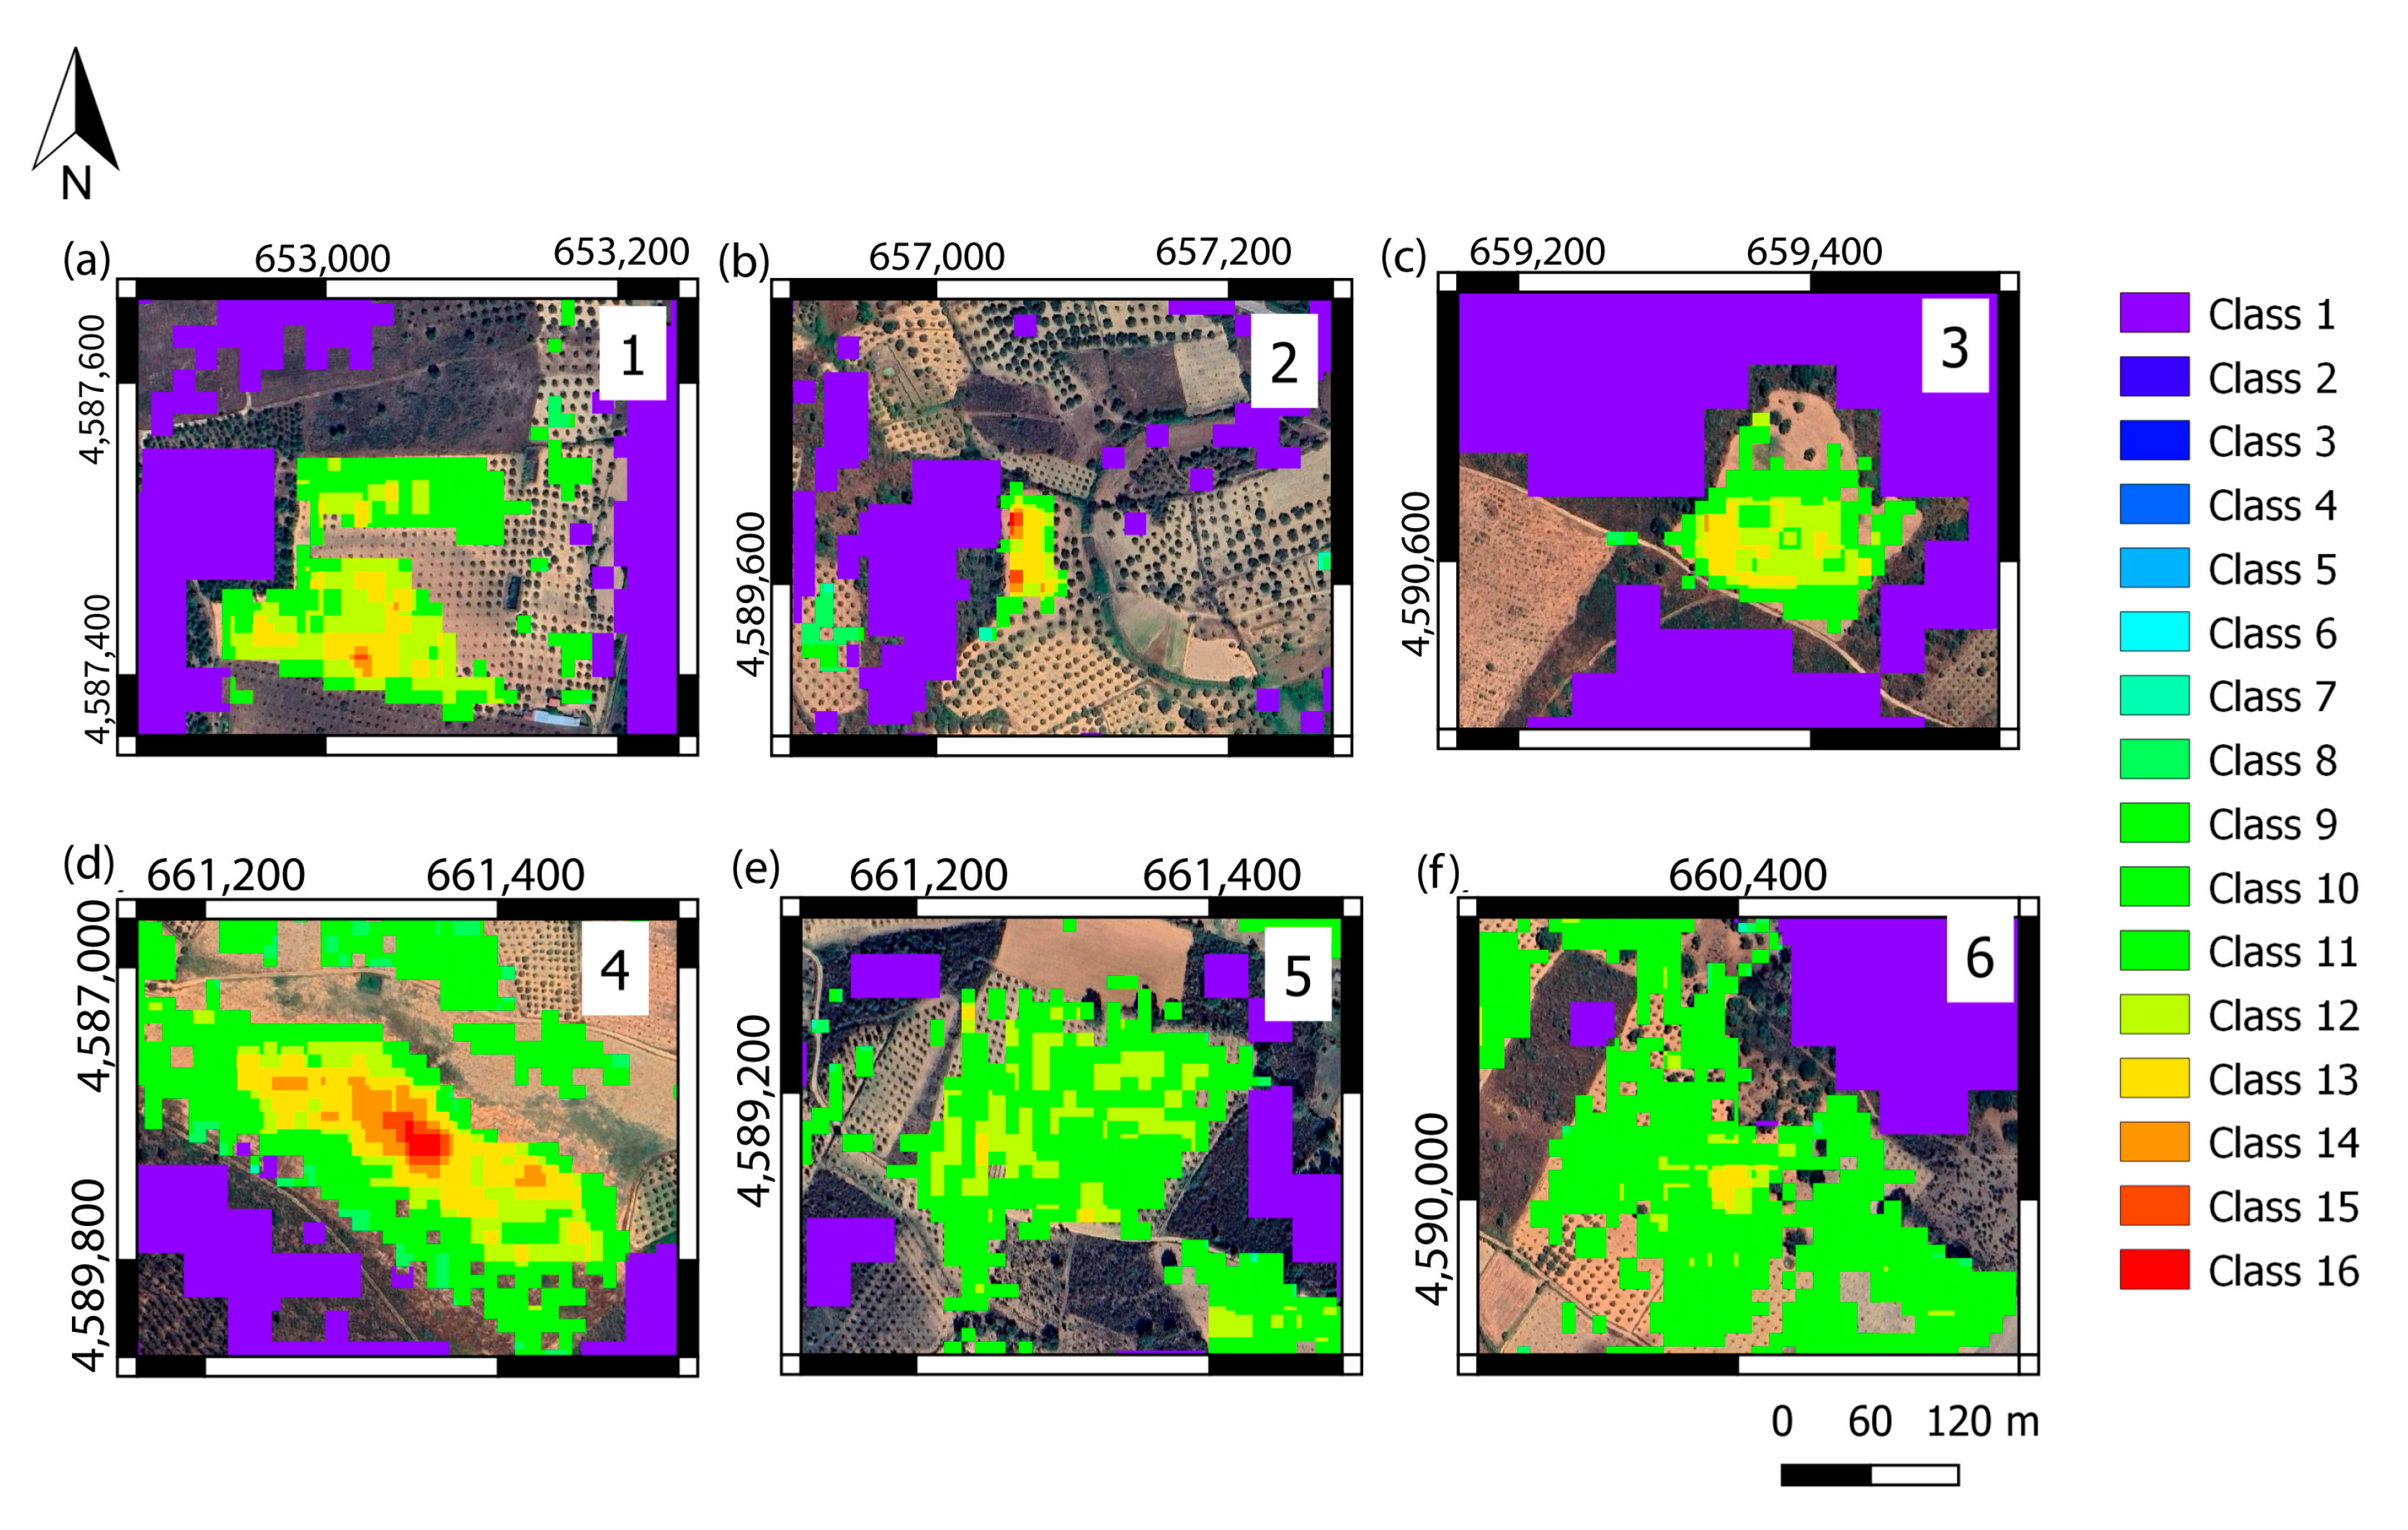
Conversely, Test 2 identified ROIs 1 (
Figure 6a), 2 (
Figure 6b), 3 (
Figure 6c), and 5 (
Figure 6e), with clusters predominantly composed of class 12 and 13 pixels, which hinders a more direct approach and requires a broader area to be analyzed for field validation compared to Test 1. However, Test 2 yielded good results for ROI 4 (
Figure 6d).
Overall, although the fuzzification process with PS identified fewer ROIs, this is not necessarily a negative outcome, as the results indicate that PS influenced the detection of a higher number of pixels with elevated values, which are more accurate for iron oxide identification. This demonstrates that the high spatial resolution of PS enhances sensitivity in detecting areas of interest, possibly leading to fewer false positives.
5.4. Relative Comparison (Ratio Between BRs)
The ratio between BR-PS and BR-Sentinel-2 was the only one to achieve significant values of absolute concordance. This is most likely due to their higher similarity in spatial resolution compared to the other satellites. When analyzing the individual BR results, we observed that both satellites identified very similar proportions of iron oxides, which explains why the ratio result was so positive.
The BR-PS/BR-ASTER and BR-PS/BR-Landsat 9 ratios showed similar levels of disagreement. However, the ratio with BR-ASTER exhibited slightly higher disagreement and fewer positive values than the ratio with Landsat 9, which was unexpected given its higher spatial resolution (15 m) compared to Landsat 9 (30 m).
This may be because BR-ASTER identified significantly more pixels in class 14 than the other satellites, and
Figure 4i shows that many of these pixels correspond to regions with sparse vegetation. Although this issue could be resolved by applying a vegetation mask, this approach was deliberately avoided to assess the potential false positives that the ratios might produce. By not excluding vegetation pixels beforehand, it was possible to analyze the extent to which the spectral signal of vegetation could influence the results. This analysis provides valuable insights into the limitations and reliability of the method when applied to areas with significant vegetation cover.
The ratio with Landsat 9 showed high levels of disagreement, with no cases of total agreement. However, compared to ASTER, it had more positive values and slightly lower disagreement. Some false positives involving vegetation were observed, particularly in class 12, but were less critical than those found with ASTER.
When analyzing the ratio maps across the entire study area, it becomes evident that the PS results are much more like those of Sentinel-2 and ASTER. However, it is crucial to consider that differences in spatial resolution may have a significant impact, contributing to the higher levels of disagreement between PS and the results from ASTER and Landsat 9.
Despite this, no anomalous values were observed, indicating that the discrepancies are primarily related to differences in spatial resolution rather than inconsistencies in detecting iron oxides.
When analyzing only the areas of interest, a stronger relationship emerges between the level of result correspondence and the spatial resolution of the satellites. The data suggest that as spatial resolution decreases, non-correspondence increases. Sentinel-2 (10 m) shows the highest agreement with PS (3 m), followed by ASTER (15 m), and finally, Landsat 9 (30 m), which has the lowest correspondence. This confirms that the further a satellite’s spatial resolution deviates from PS, the more different the results become due to increased pixel aggregation and spectral mixing.
Despite ASTER’s spatial lower resolution than Sentinel-2, its correspondence with PS significantly improves when focusing only on the areas of interest. This contrasts with the full-image analysis, where ASTER showed the lowest similarity with PS. A key factor contributing to this improvement is the absence of vegetation cover in the selected areas, which reduces spectral noise and potential misclassification.
Landsat 9, with its 30 m of spatial resolution, shows the lowest agreement level with PS. Its higher percentage of non-correspondence may be attributed to the larger pixel size, which results in mixed spectral signals and a loss of finer details in iron oxide detection. Additionally, the fact that Landsat 9 consistently identifies a greater proportion of iron oxides compared to PS suggests potential overestimation due to its broader spectral bands and coarser resolution.
While Sentinel-2 is the most comparable to PS, ASTER performs better in specific conditions, particularly in areas with minimal vegetation. On the other hand, Landsat 9′s lower agreement underscores its limitations for fine-scale iron oxide mapping but may still be useful for broader regional assessments.
5.5. Validation and Evaluation
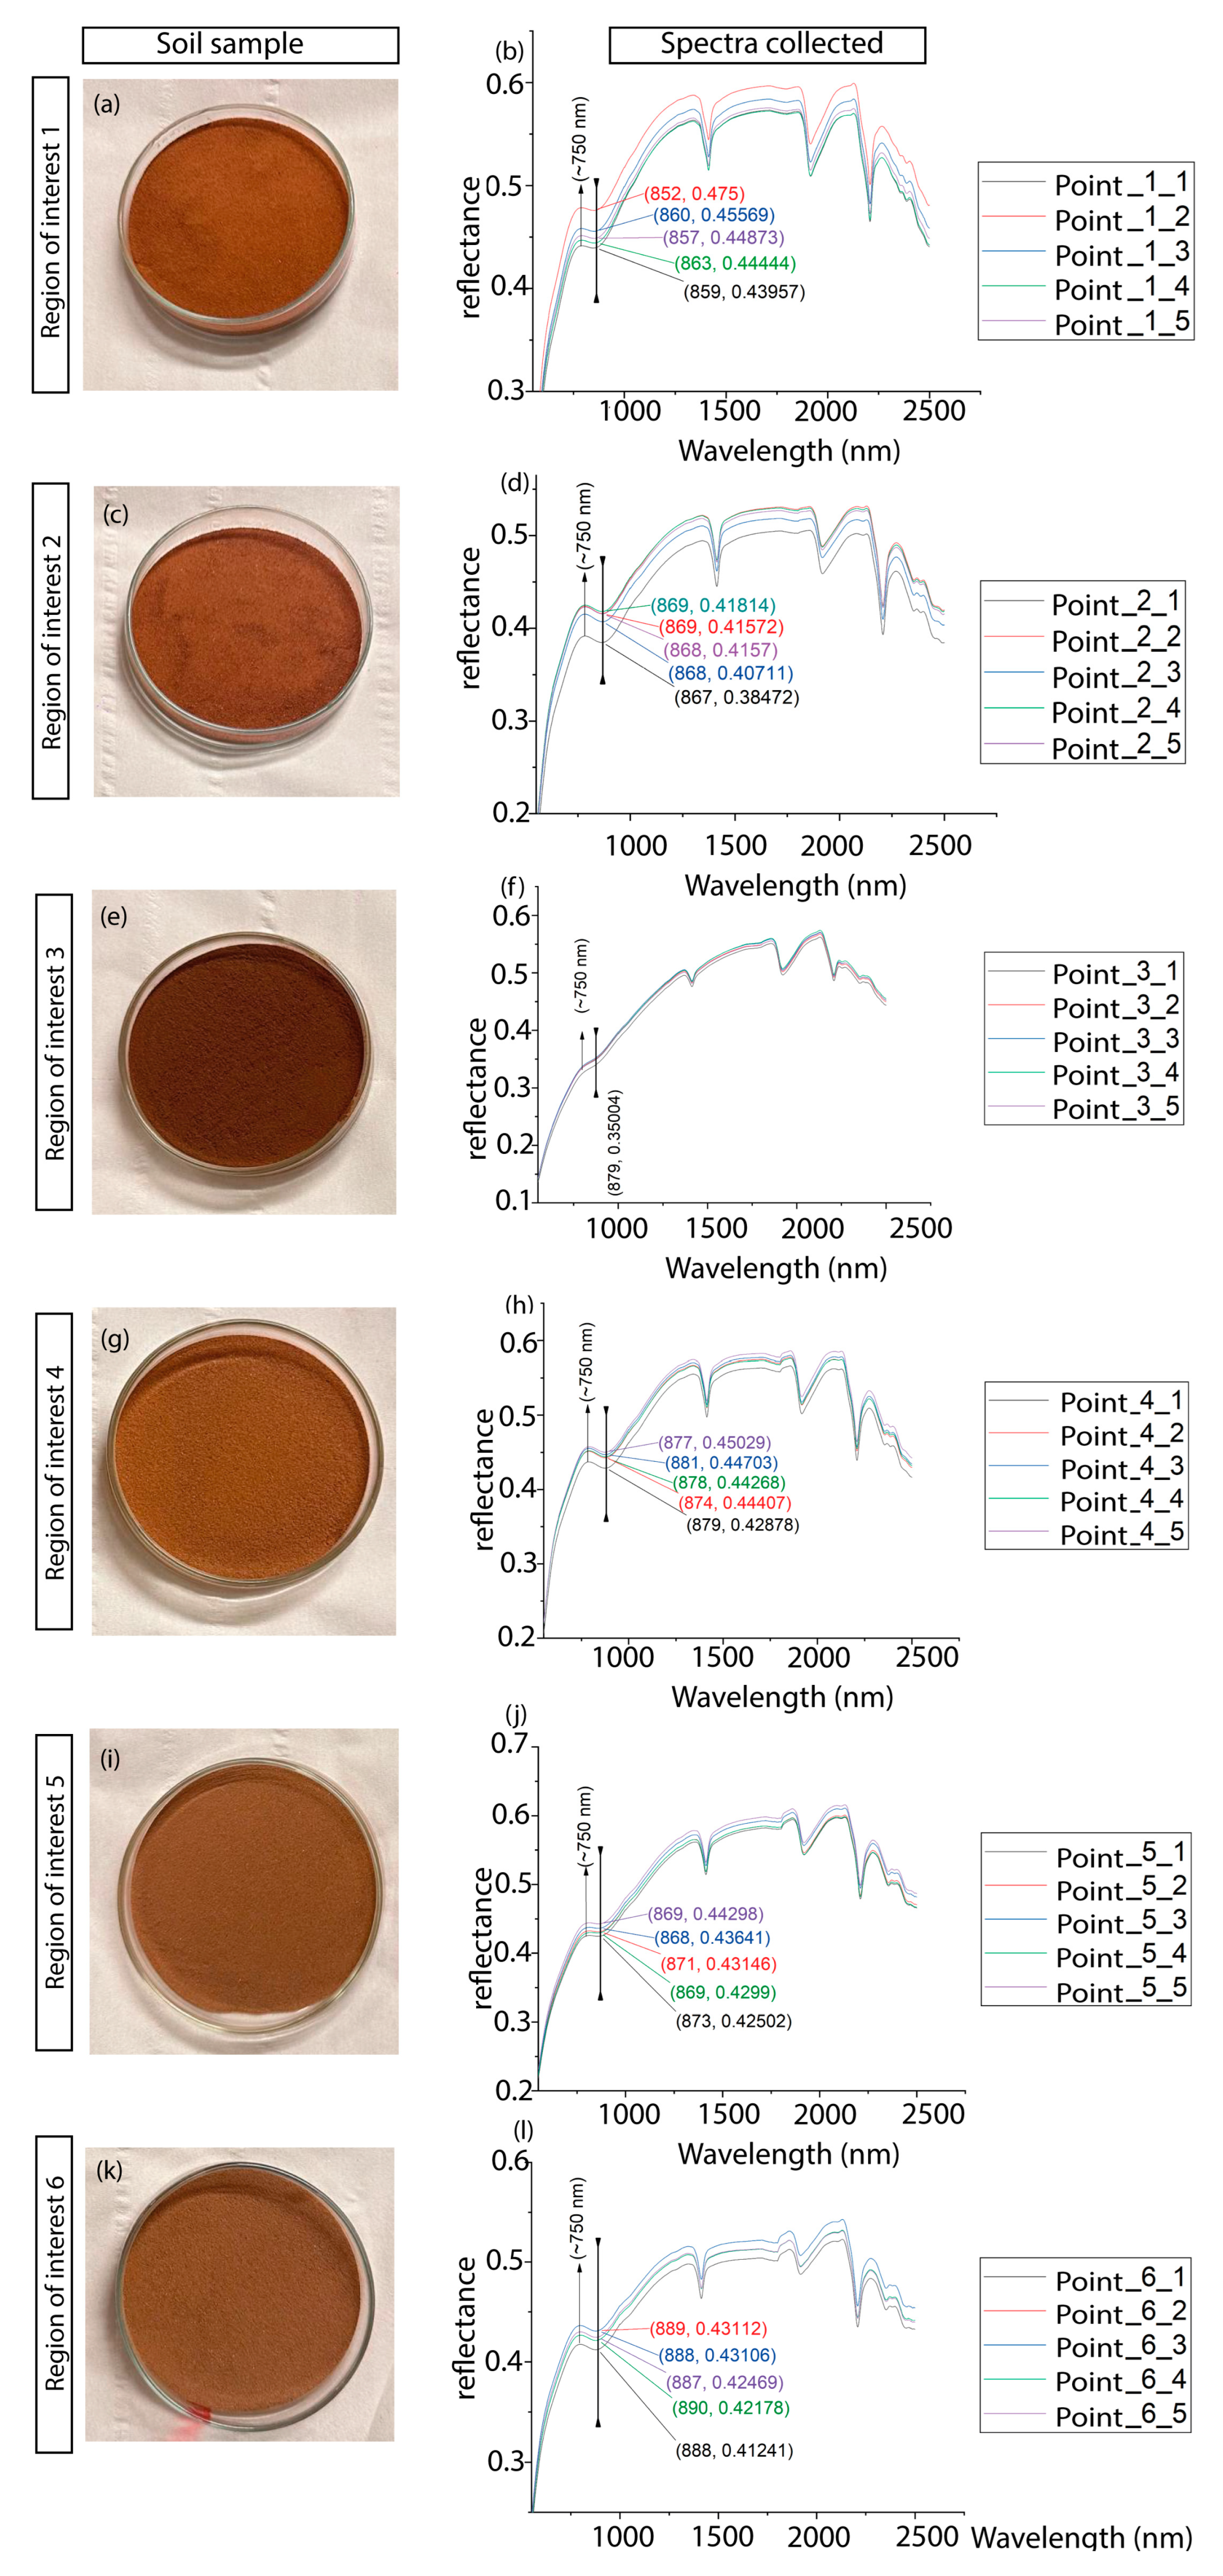
All spectra display a reflectance peak at approximately 750 nm. This peak is slightly weaker in the sample from ROI 5 (
Figure 9i,j) and significantly weaker in the sample from point 3 (
Figure 9e,f). Given that Hematite typically exhibits a reflectance peak at 750 nm and Goethite around 660 nm, and that all spectra display a peak at 750 nm, the results suggest that Goethite is absent in the analyzed soil samples, with Hematite being the predominant iron oxide identified.
The characteristic iron absorption near ~670 nm is absent in all spectra. However, all of them show a second diagnostic absorption feature ranging from 852 nm to 890 nm, which strongly indicates the presence of Hematite.
The spectra from sample 3 exhibit very uniform spectral behavior and low reflectance for iron diagnostic features. This may suggest that the sample is homogeneous. Upon analyzing the spectra of the field-collected samples, all exhibit spectral characteristics marked by a prominent diagnostic iron absorption feature, indicating the predominance of Hematite in the study area. The soil sample from ROI 3 displays a comparatively weaker spectral response associated with iron oxides. This location was identified in both fuzzification Tests 1 and 2, indicating consistent detection across all satellite datasets. However, before classifying this point as a false positive, a more detailed analysis of rock samples is planned for future work.
The analysis of the field samples confirms the effectiveness of the proposed method in accurately delineating zones enriched in iron oxides.
6. Conclusions
This study tests the effectiveness of PS in mapping iron oxides in Mirandela, Portugal. The results demonstrate that PS has the same capability to identify Fe3+ iron oxides as Sentinel-2, ASTER, and Landsat 9; however, its higher spatial resolution allows for more precise identification and analysis of potential points of interest. Despite its spectral limitations, notably the absence of SWIR bands, the proposed methodology, based on spectral analyses and band ratios (BRs), proved robust for mineral discrimination. When discussing potential areas of interest, Sentinel-2 exhibited the highest agreement with PS among the compared sensors. However, the absence of anomalous values indicates that the results remain reliable and consistent across different sensors. As a practical contribution, this study reinforces the potential of PS for mineral exploration, providing a reliable method for identifying areas of interest. Future research will explore the integration of PS with sensors featuring SWIR bands (e.g., Sentinel-2) to mitigate spectral limitations, assess the methodology’s applicability across diverse geological contexts, and incorporate advanced techniques such as machine learning to enhance mineral discrimination.



 ,
,